multi-modal visualization methods
DESCRIPTION
Multi-Modal Visualization Methods. The use of Haptics, Graphics, and Sonification to Better Interpret Multi-dimensional Data. By Doanna Weissgerber 7/19/01. Overview. Goal of my research Purpose of scientific visualization Methods of visualization Why multi-modal methods? - PowerPoint PPT PresentationTRANSCRIPT

Multi-Modal Visualization Methods
The use of Haptics, Graphics, and Sonification to Better Interpret Multi-dimensional Data
By Doanna Weissgerber 7/19/01

University of California at Santa Cruz
2 of 68
Overview Goal of my research Purpose of scientific visualization Methods of visualization Why multi-modal methods? My Previous and present research
in visualization State of the art in visualization Proposed research

University of California at Santa Cruz
3 of 68
Goals
Passive haptics is an information channel which has not been researched I am most interested in passive haptic information displayed on it’s own
information channel non-redundant
I will employ usability testing to prove effectiveness of haptic mappings In combination with other modalities when appropriate
Watching for cross-modal problems and enhancements Alone when appropriate
Watching for enhancement of a performed task My starting basis will be in scientific visualization
Increasing the amount of information able to be perceived in a period of time Great possibility of moving to flight simulation if funding found

University of California at Santa Cruz
4 of 68
Purpose of scientific visualization Accurately transmit data from
computer to user Enhance user’s ability to
understand presented data Develop mental image of the data

University of California at Santa Cruz
5 of 68
Methods of visualization Does not specifically require sight
Graphical - sight Color Texture Shape
Sonification - sound Decibel level Different instruments
Haptics - touch Tactile Kinesthetic
University of California at Santa Cruz
6 of 68
Why Multi-modal methods?
"Current graphics and visualization technology cannot cope with the volume and complexity of the data produced by the simulations that will be carried out on the high-end computer platforms in the next two to four years".
They say that new techniques that merge visual, sonic, and haptic data representations need to be developed.
Department of Energy

University of California at Santa Cruz
7 of 68
Multi-modal benefits Possible to display more data at the same
time Possible to display data in a more intuitive
fashion Earthquake model
locations of the earthquakes• Graphically represented
distance traveled • Graphically represented
depth of the earthquake• Sonification using musical notes
magnitude of the quake• Haptic vibration

University of California at Santa Cruz
8 of 68
Multi-modal benefits(cont) Cross-modal stimulation can lower
detection threshold Tactile stimuli can reinforce and/or
clarify stimuli from other modalities More natural mappings
Vision and audition usually dominate haptics
Haptics dominate with texture or surface judgments

University of California at Santa Cruz
9 of 68
My previous and present visualization research ProtAlign
Protein structure prediction Graphical visualization Sonification
Passive Haptics Unit

University of California at Santa Cruz
10 of 68
Predicting Protein Structure
Why predict the structure? Protein crystallization is difficult and expensive
Why use alignments to predict structures Proteins with similar amino acid sequences will
likely have same structure and function Huge databases of protein sequences exist
Why Study Structure Gain Insight into protein functions
Guide biological experiments Discover the genetic basis of disease
University of California at Santa Cruz
11 of 68
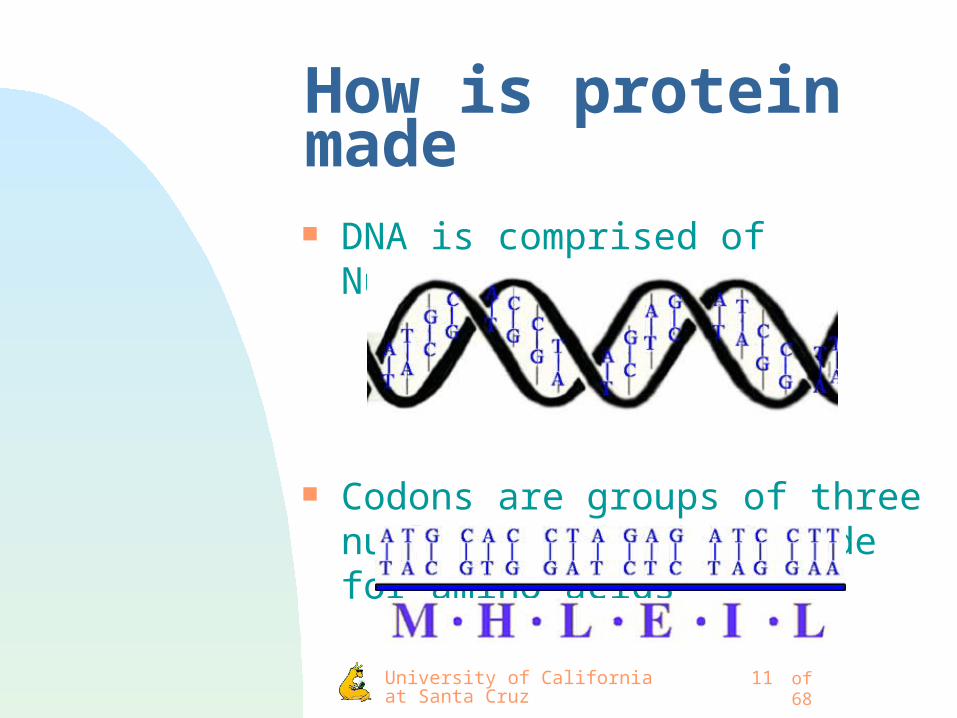
How is protein made
DNA is comprised of Nucleic Acids
Codons are groups of three nucleic acids which code for amino acids
University of California at Santa Cruz
12 of 68
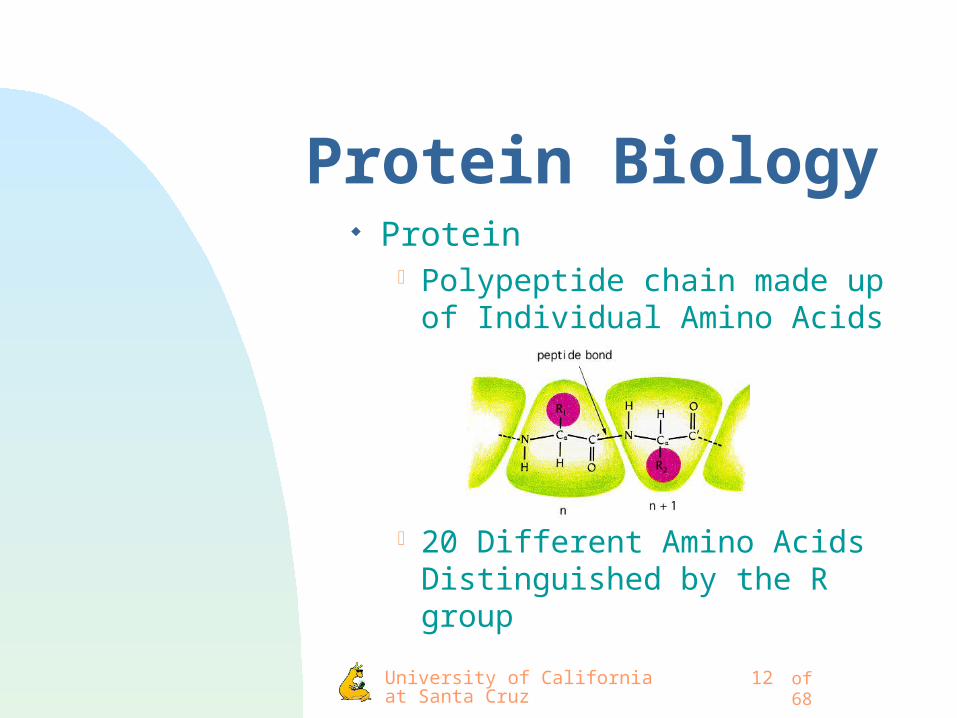
Protein Biology Protein
Polypeptide chain made up of Individual Amino Acids
20 Different Amino Acids Distinguished by the R group
University of California at Santa Cruz
13 of 68
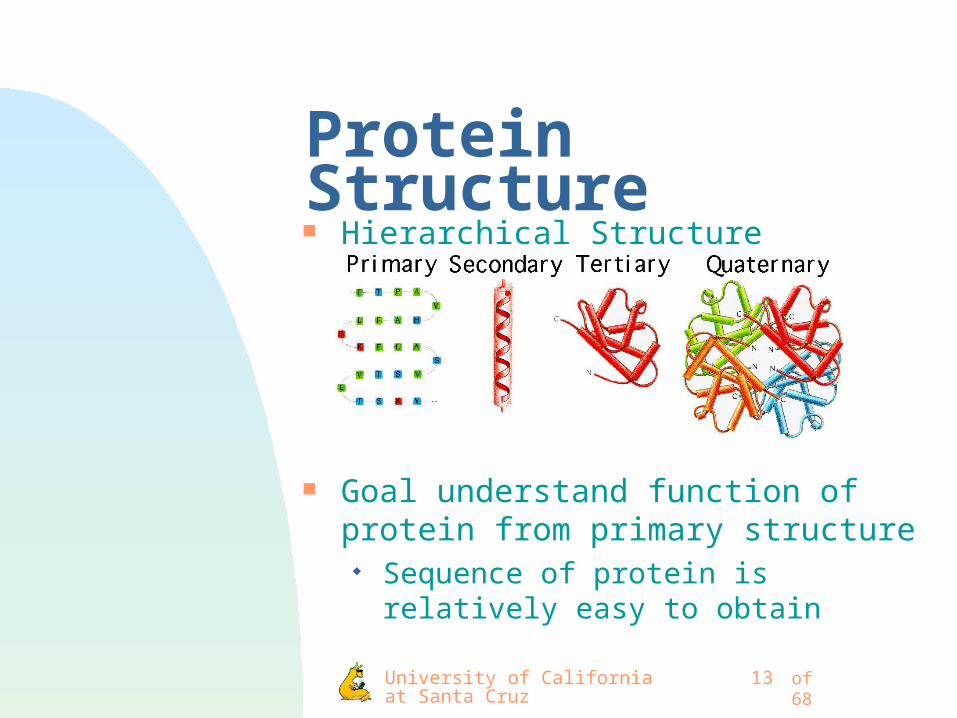
Protein Structure Hierarchical Structure
Goal understand function of protein from primary structure
Sequence of protein is relatively easy to obtain
University of California at Santa Cruz
14 of 68
Assessing an alignment Heuristics for assessing prediction
Amino Acid similarity four basic types of amino acids
• Hydrophobic,Charged Acidic, Charged Basic, Polar (hydrophilic)
Size of amino acid Core conservation
Want the core of the protein to be most similar
Environmental preferences

University of California at Santa Cruz
15 of 68
Two Dimensional Alignment Evaluation
Belvu Possible to Edit 2-D alignment and see results Color coded to assess positions along the
alignment Must remember protein 1 letter codes Only one color mapping possible at one time
User must memorize properties of amino acids
University of California at Santa Cruz
16 of 68
Why visualize the prediction? Some heuristics lack numerical
methods Combining heuristics is difficult Sanity check
University of California at Santa Cruz
17 of 68
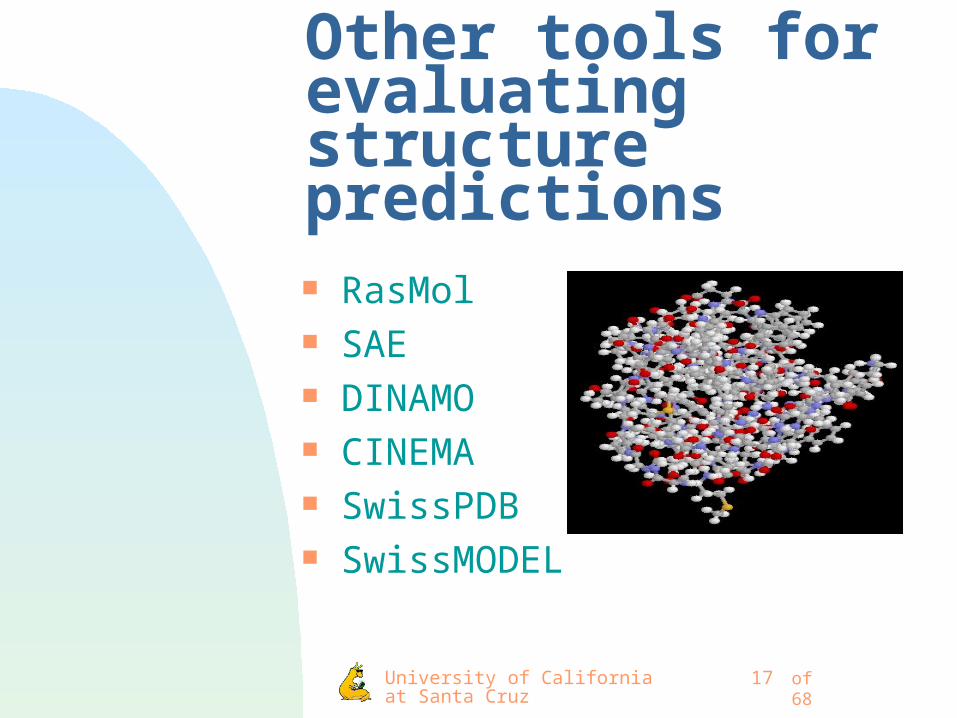
Other tools for evaluating structure predictions
RasMol SAE DINAMO CINEMA SwissPDB SwissMODEL
University of California at Santa Cruz
18 of 68
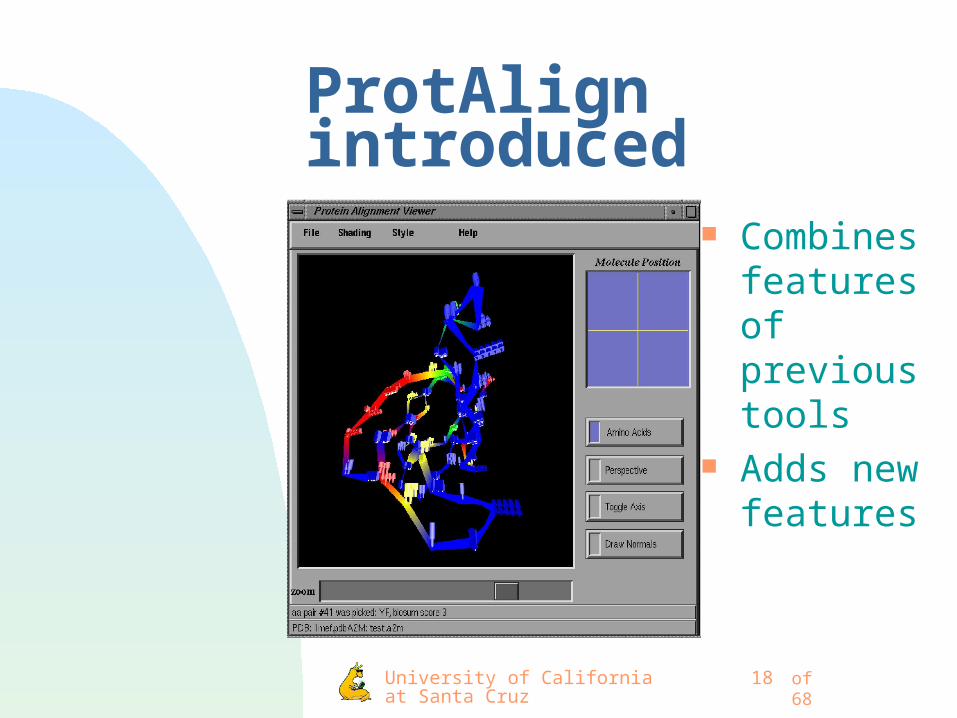
ProtAlign introduced
Combines features of previous tools
Adds new features

University of California at Santa Cruz
19 of 68
ProtAlign allows quick assessment Ribbon mode scoring allows quick
assessment of overall alignment
BadGood
University of California at Santa Cruz
20 of 68
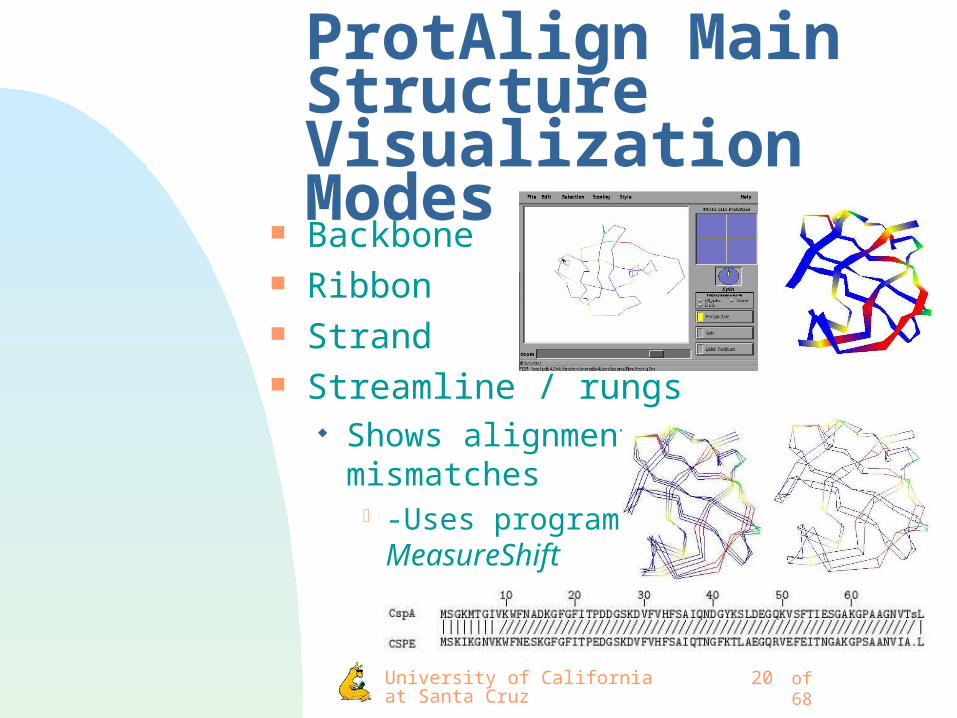
ProtAlign Main Structure Visualization Modes
Backbone Ribbon Strand Streamline / rungs
Shows alignment mismatches
-Uses program MeasureShift
University of California at Santa Cruz
21 of 68
ProtAlign Main Structure Visualization Modes (cont)
Cartoon Much like ribbon Shows secondary structure
• Helices• Loop structure• Beta strands
Invisible Allows focus on specific areas Removes extraneous information

University of California at Santa Cruz
22 of 68
ProtAlign Alignment tools
Low resolution glyphs Edit alignment in three dimensions
Updates two and three dimensional display
Multi-modal visualization Environmental mapping
• Amino acid environmental preferences
University of California at Santa Cruz
23 of 68
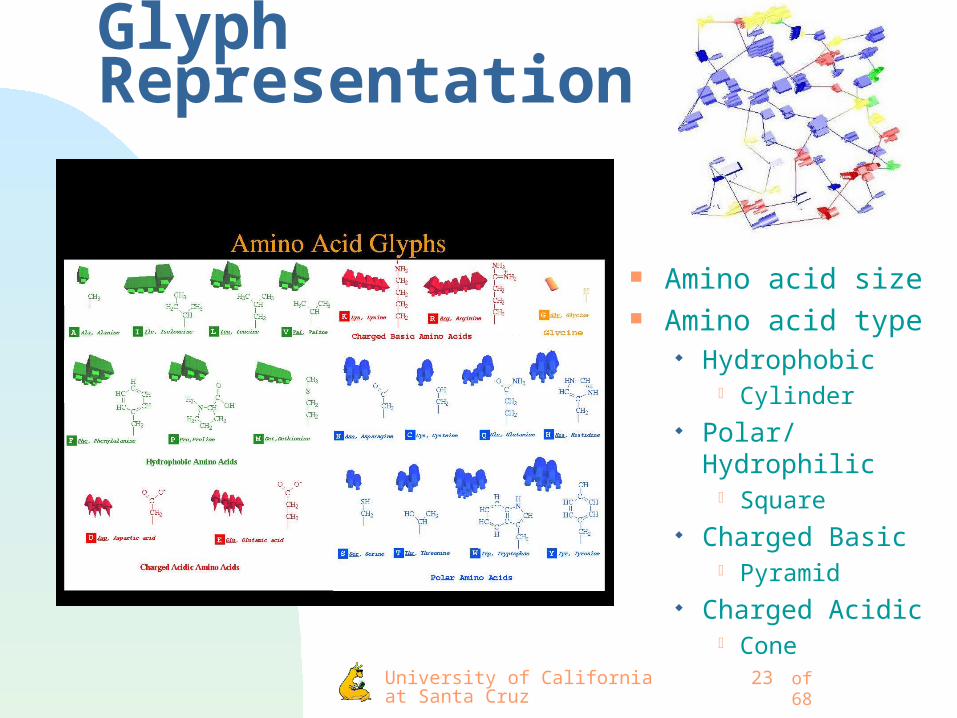
Glyph Representation
Amino acid size Amino acid type
Hydrophobic Cylinder
Polar/Hydrophilic Square
Charged Basic Pyramid
Charged Acidic Cone

University of California at Santa Cruz
24 of 68
Alignment Representation
Evaluate positions along alignment Color
Rainbow analogy Red, yellow,
green, blue Shape Size
University of California at Santa Cruz
25 of 68
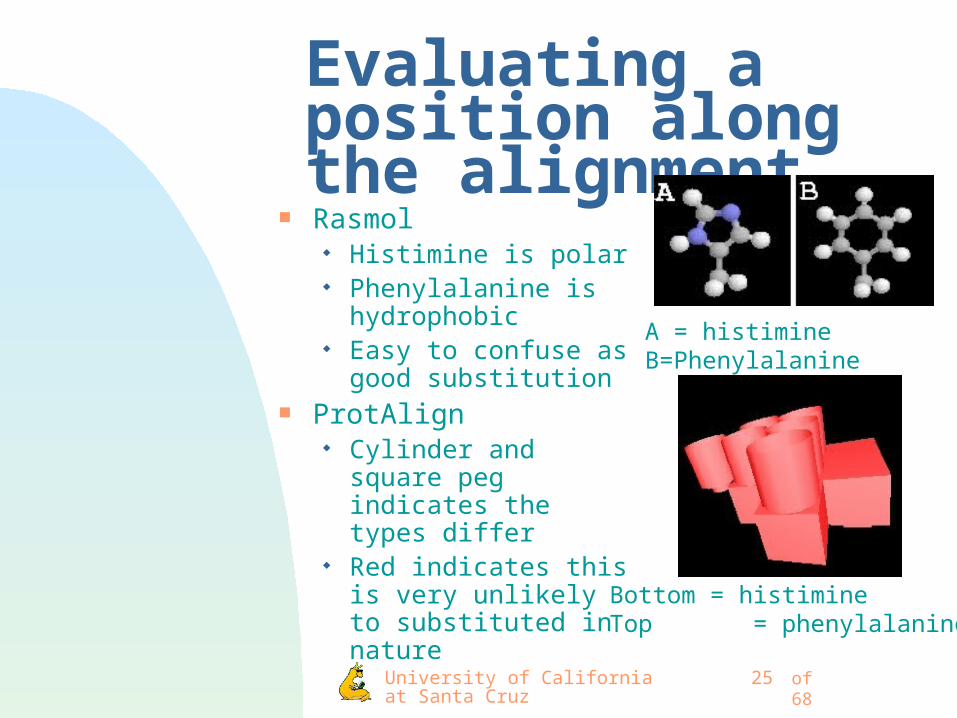
Evaluating a position along the alignment
Rasmol Histimine is polar Phenylalanine is
hydrophobic Easy to confuse as
good substitution ProtAlign
Cylinder and square peg indicates the types differ
Red indicates this is very unlikely to substituted in nature
A = histimine B=Phenylalanine
Bottom = histimineTop = phenylalanine

University of California at Santa Cruz
26 of 68
Possible to edit via 3d interface Edit alignment via 3d interface

University of California at Santa Cruz
27 of 68
ProtAlign Scoring metrics Blosum 62 matrix
Likelihood that the substitution occurs naturally in nature
Environmental Calculate environmental probability
• Exposure preferences– Buried– Partially buried– Exposed
• Preferences for neighboring amino acids• Structural preferences
– Coil– Strand– helix
Exposure None

University of California at Santa Cruz
28 of 68
Environmental Sonification added to ProtAlign Environments
Used to evaluate amino acid exposure preferences
Buried• Tend to like protein core
Partially exposed• Tend to like protein area between
core and loops
Exposed• Tend to like loop regions
University of California at Santa Cruz
29 of 68
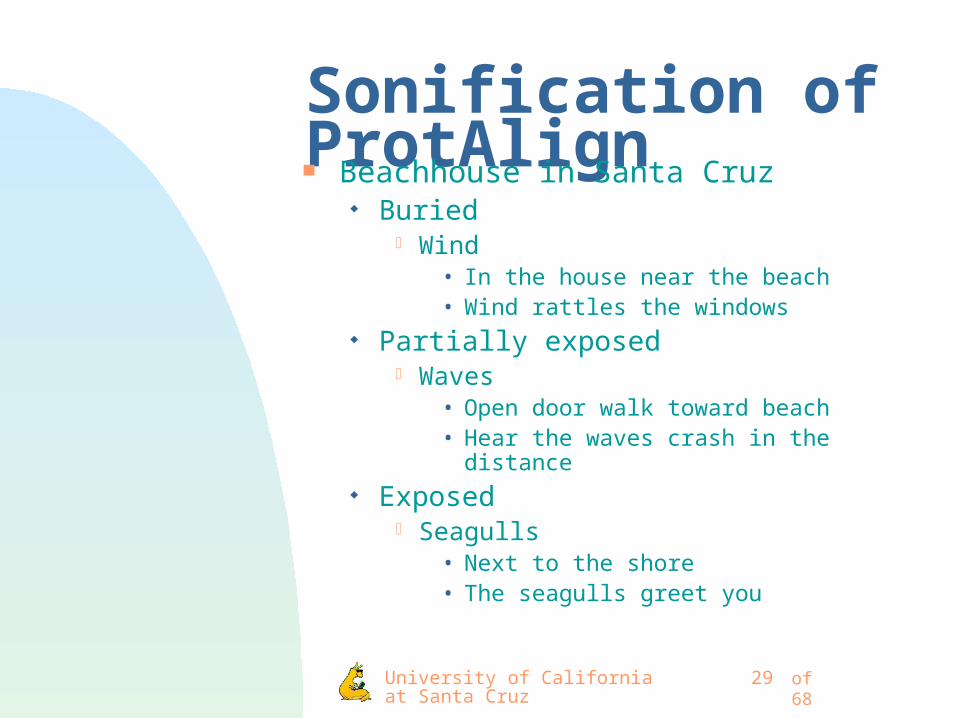
Sonification of ProtAlign Beachhouse in Santa Cruz
Buried Wind
• In the house near the beach• Wind rattles the windows
Partially exposed Waves
• Open door walk toward beach• Hear the waves crash in the distance
Exposed Seagulls
• Next to the shore• The seagulls greet you

University of California at Santa Cruz
30 of 68
ProtAlign Usability testing Color mapping tested
Environments used to color amino acids Possible color pairings tested
• Blue/red – excellent/bad
• Blue/yellow – excellent/poor
• Blue/green – excellent/good
• Green/yellow – good/poor Users asked if they thought if substitution
was• Much worse
• A little worse
• A little better
• Much better
University of California at Santa Cruz
31 of 68
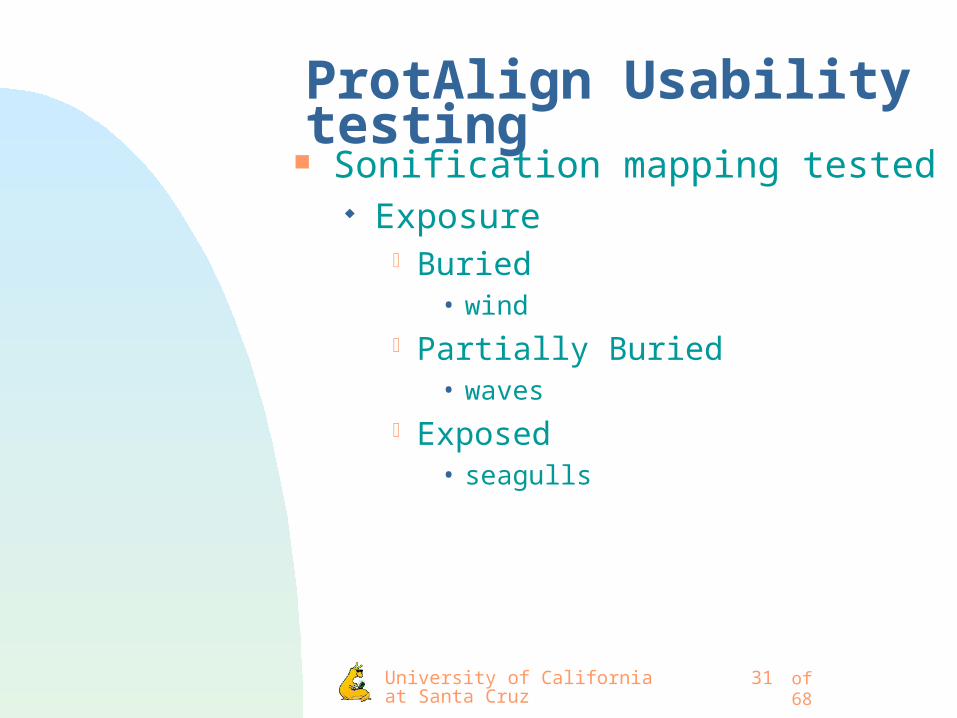
ProtAlign Usability testing Sonification mapping tested
Exposure Buried
• wind
Partially Buried• waves
Exposed• seagulls

University of California at Santa Cruz
32 of 68
ProtAlign Visual Testing Excellent/bad pairs recognized perfectly
and quickly Excellent/poor pairs moderate accuracy Good/poor pairs recognized with
surprisingly good accuracy
Blue/Green was skewed by single user allowing 45 seconds to elapse while answering
University of California at Santa Cruz
33 of 68
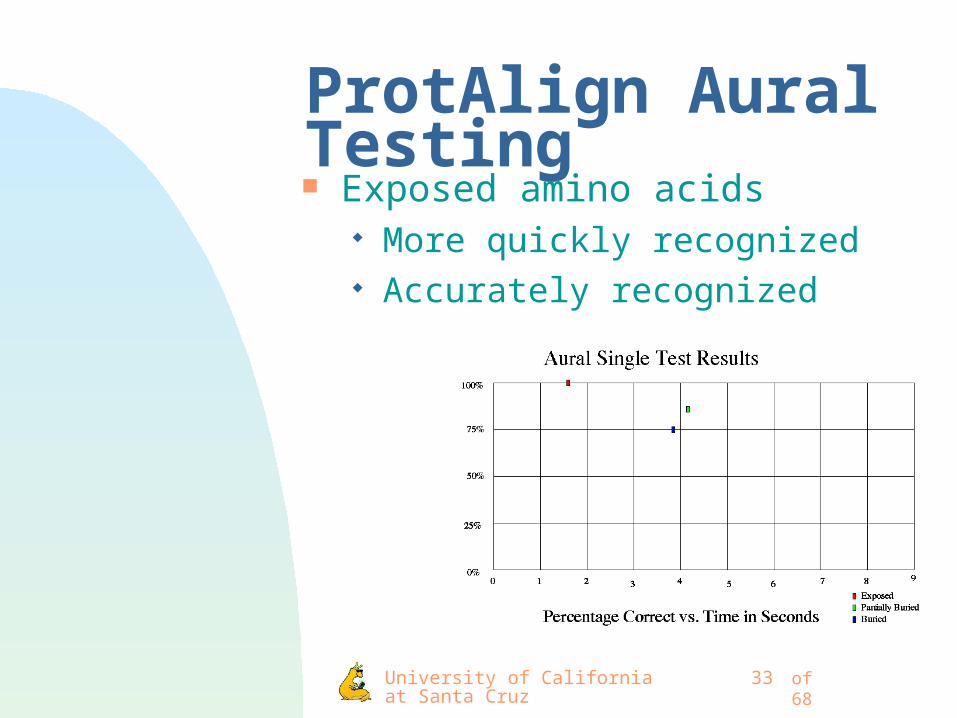
ProtAlign Aural Testing Exposed amino acids
More quickly recognized Accurately recognized

University of California at Santa Cruz
34 of 68
ProtAlign Aural Testing (cont) Partially exposed amino acids
Slowest recognition Moderate accuracy
University of California at Santa Cruz
35 of 68
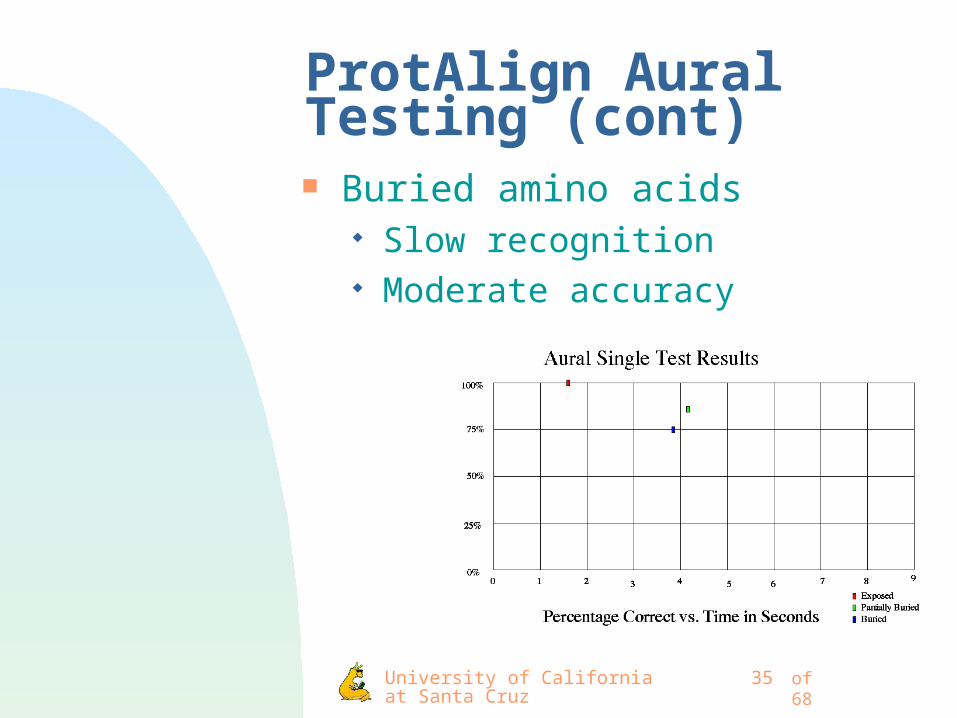
ProtAlign Aural Testing (cont) Buried amino acids
Slow recognition Moderate accuracy

University of California at Santa Cruz
36 of 68
ProtAlign Visual Testing
Visual accuracy in multi test is fairly close to single testing

University of California at Santa Cruz
37 of 68
ProtAlign Aural Testing Time for exposed consistently faster

University of California at Santa Cruz
38 of 68
ProtAlign overall results
Faster to present all information at once Time to evaluate a position for
environment and for exposure when presented with all information less than time to present information individually
Both environmental and exposure info mapped to color

University of California at Santa Cruz
39 of 68
Passive Haptic Unit No hands required Currently controls motor filled chair
pad ACCESS RDAG-128H
Serial communication Eight DACs
Digital to Analog converters Control variable voltage items
• Motors• Fans• Heating elements

University of California at Santa Cruz
40 of 68
How haptic unit is controlled
Functions to make voltage changes to single DACS using easy function calls.
RunDAC(theDAC, voltage_level) Pulse (theDAC, voltage_level)
Causes DAC to turn on to voltage_level than turns it off
Wave (theDAC, increments, level) DAC starts at 0 and increases voltage until
levels in the number of increments• Wave(0, 2, FULL_POWER)
– causes the motor to start at power 0, go to half power, then to full power, than half power, ending with off.

University of California at Santa Cruz
41 of 68
Multiple motor control
Possible to turn motors off and on in any sequence
University of California at Santa Cruz
42 of 68
State of the Art Immersive Multi-modal Visualization
CAVE (University of Illinois) Room SGI 4 projectors (3 walls and floor) Stereographic LCD glasses
Head Mounted Display (HMD) Wearables
Belt-pack PC HMD Wireless communications hardware Input device
Touch pad Chording keyboard

University of California at Santa Cruz
43 of 68
State of the Art Non-Immersive Multi-modal Visualization
PHANToM force feedback device requires at least one
finger to operate tends to have low degrees of freedom
Fan applied to hand by Ogi et al Information given using fans on the hand Unable to use hand for anything else
Air jets Low bandwidth
Jets must be spaced to sense seperately
Tacticon 1600 electrodes on user’s fingers provide
electrical pulses

University of California at Santa Cruz
44 of 68
Past “Normal” Active Haptic Units
Require hands be used for output Haptic mice and haptic joysticks
Require user to maintain contact Input pens
Must maintain contact
University of California at Santa Cruz
45 of 68
Proposed Research
Multi-modal visualization Concentration on tactile haptics
Use of haptics Showing independent information
More information at the same time Showing redundant information
Information more quickly understood Information better understood
User testing Did the user understand the mappings? Did the haptics help understanding?

University of California at Santa Cruz
46 of 68
Proposed Research (cond) Passive haptics
Sit back and absorb the information

University of California at Santa Cruz
47 of 68
Perceptual BandwidthVisual Aural Tactile
Physical Mechanism
Light Waves Sound Waves Surface Texture
Organs Retina Ear Drum Skin sensors: pacinian corpuscles, etc.
Perceptual organization
Global, spatially mapped
Global, spatially mapped
Spatially focused, body mapped
Information bandwidth
106 bps 104 bps 101-102 bps

University of California at Santa Cruz
48 of 68
Skin Layers
Dermal papillae Interdigitations of epidermis
and dermis Fingertips Soles of feet
Dermis Papillary layer
Nerve endings Reticular layer
Bulk of dermis nerves
[36]
University of California at Santa Cruz
49 of 68
Tactile sensory receptors Thermoreceptors
Changes in skin temperature Mechanoreceptors
Pressure Vibration Slip
Nocioreceptors Pain

University of California at Santa Cruz
50 of 68
Tactile sensory receptors (cont)
Successiveness limit 5 ms to perceive as separate 20 ms to perceive order (not including time
for cortex to process the order) Adaptation
Slowly adapting Respond throughout stimulus
• Joint angle from skin stretch Rapidly adapting
Respond to start/end of stimulus• Block out extraneous signals
– wearing gloves would be constant stimulus which is adapted to
University of California at Santa Cruz
51 of 68
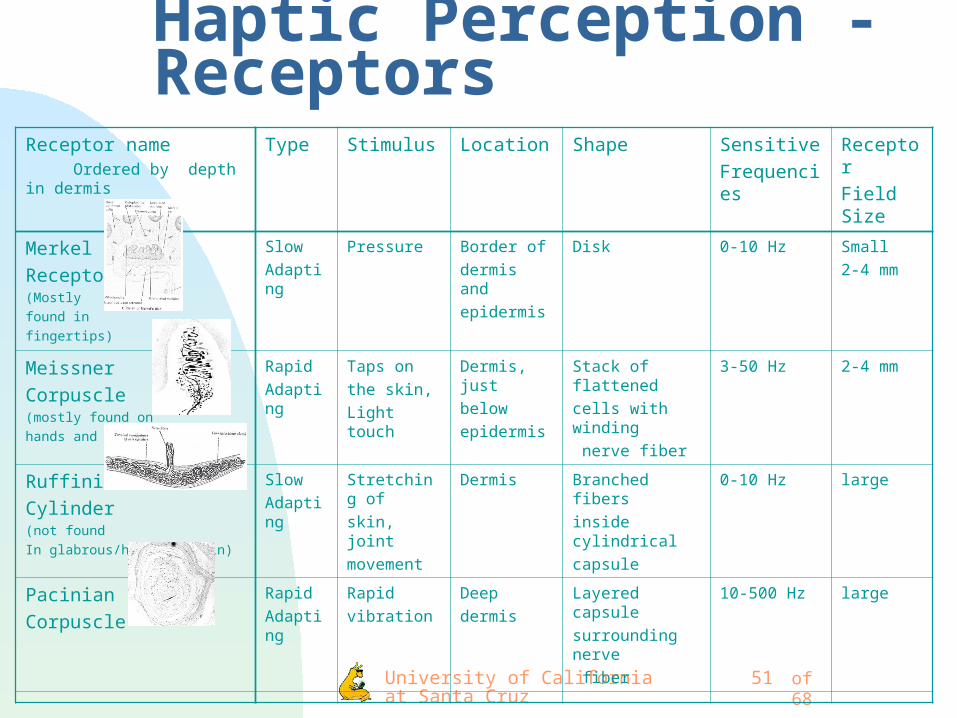
Haptic Perception - ReceptorsReceptor name Ordered by depth in dermis
Type Stimulus Location Shape Sensitive
Frequencies
Receptor
Field Size
Merkel
Receptor(Mostly
found in
fingertips)
Slow
Adapting
Pressure Border of
dermis and
epidermis
Disk 0-10 Hz Small
2-4 mm
Meissner
Corpuscle(mostly found on
hands and feet)
Rapid
Adapting
Taps on
the skin,
Light touch
Dermis, just
below
epidermis
Stack of flattened
cells with winding
nerve fiber
3-50 Hz 2-4 mm
Ruffini
Cylinder(not found
In glabrous/hairless skin)
Slow
Adapting
Stretching of
skin, joint
movement
Dermis Branched fibers
inside cylindrical
capsule
0-10 Hz large
Pacinian
Corpuscle
Rapid
Adapting
Rapid
vibration
Deep
dermis
Layered capsule
surrounding nerve
fiber
10-500 Hz large

University of California at Santa Cruz
52 of 68
Haptic perception: Free Nerve Endings and pain receptors
Free Nerve Endings Thermal differences
Heat receptors Cold receptors Receptor field 1-2mm
Pain receptors Painful mechanical stimulation Extreme cold and extreme heat
• < -15°C and > 45 ° C (5 ° F and 113 ° F)
• quick transmission (faster than normal response)
University of California at Santa Cruz
53 of 68
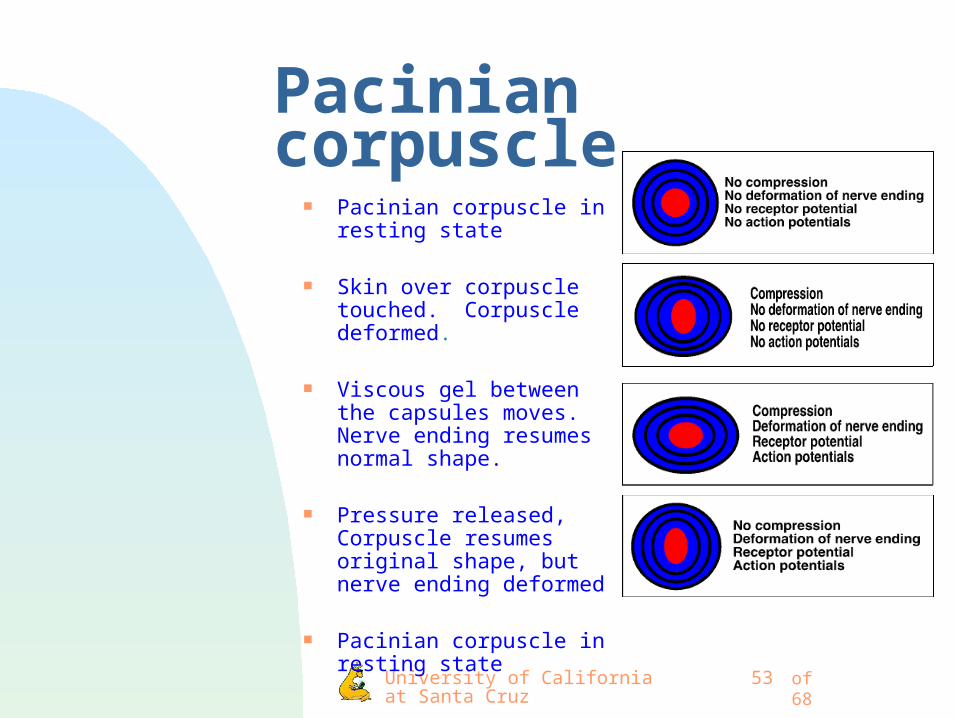
Pacinian corpuscle Pacinian corpuscle in resting
state
Skin over corpuscle touched. Corpuscle deformed.
Viscous gel between the capsules moves. Nerve ending resumes normal shape.
Pressure released, Corpuscle resumes original shape, but nerve ending deformed
Pacinian corpuscle in resting state

University of California at Santa Cruz
54 of 68
Tactile perception limitations Secular et al 1994
Sensitivity depends on area of body Fingers more sensitive than stomach or
back Females more sensitive to light touch Cooled skin less sensitive
Vibrotactile stimulation Greatest sensitivity 200 hz 10-30 hz, greatest sensitivity with
vibrating probe

University of California at Santa Cruz
55 of 68
Tactile perception limitations (cont) Two point thresholds
Location dependent Fingers 2mm Forearm 30 mm Inner thigh 34 mm Outer thigh 36mm Foot bottom 33mm Foot top 46mm Back 42-70mm
Declines with age Sensitivity and two point thresholds
correlated
University of California at Santa Cruz
56 of 68
Tactile perception limitations (cont)Karen MacLean lecture
Spatial limitations Depends on size of receptor field
Meissner corpuscle smaller receptor field than Pacinian corpuscle
Successiveness limitation 5 ms to perceieve as separate 20 ms to allow order determination
Takes longer for cortex to process Masking
Spatial or temporal stimulus interference limits maximum transmission rate
University of California at Santa Cruz
57 of 68
Multi-modal perceptionSrinivasan 1996
Crossmodal, intermodal one modality subconsciously influences
perception in another modality Multimodal
an event is perceived and integrated by multiple senses
Supramodal phenomenon that applies to all senses
Intramodal all in one sense

University of California at Santa Cruz
58 of 68
Early examples of cross-modal effectsKaren MacLean lecture
1669 Bartholmus Partially deaf people seem to hear better
in the light than the dark 1888 Urbantschitsch
Thresholds of touch and pressure affected by noise
Weak sounds lower threshold Strong sounds raise threshold
1920 Johnson Tactual discrimination 2% better in the
light than in the dark

University of California at Santa Cruz
59 of 68
Modern examples of cross-modal effects
McGurk effect McGurk and MacDonald 1976
Auditory output “bows” Vision output “goes” May perceive a synthesis of
the two Doze
What we see may influence what we hear and vice versa
http://zzyx.ucsc.edu/Psych/psych.html

University of California at Santa Cruz
60 of 68
Modern examples of cross-modal effectsDr. Dom Massaro
My dad taught me to drive See
My gag kok me koo grive
Hear My bab pop
me poo brive

University of California at Santa Cruz
61 of 68
Cross-modal factorsLecture of Karen MacLean
Stimulus intensity Low to moderate accessory
stimulus Primary stimulus facilitated
High accessory stimulus Primary stimulus inhibited
Habituation Initial effects to accessory stimulus
may differ from later effects

University of California at Santa Cruz
62 of 68
Cross-modal factorsLecture of Karen MacLean
Bimodal neurons in several areas of cortex Convergence of unimodal sensory
(afferent) inputs into single neuron Does more than sum information from
different senses Transforms information
Sensory convergence patterns in superior colliculus (monkey)
5% is trimodal 1% is auditory/somatosensory 9% is visual/somatosensory 11% is visual/auditory

University of California at Santa Cruz
63 of 68
Possible real time uses of passive haptics
“Any landing you can walk away from is a good landing. Any landing you can fly away from is a great landing.” Mark Boyd
While landing 85% of a pilots time is spent looking at the attitude indicator.
Used to determine turn angle (bank). Also used to determine whether ascending or descending.
It is possible while flying to be in a right bank and feel as though you are going left and vice versa
No frame of reference
University of California at Santa Cruz
64 of 68
Landing a plane
Pilot would ideally be looking outside at the airport and runway Airplanes (or cattle) may wander
onto runway as you approach You may be descending through a
flock of birds Haptic output could give the
information from the attitude indicator to the pilot
University of California at Santa Cruz
65 of 68
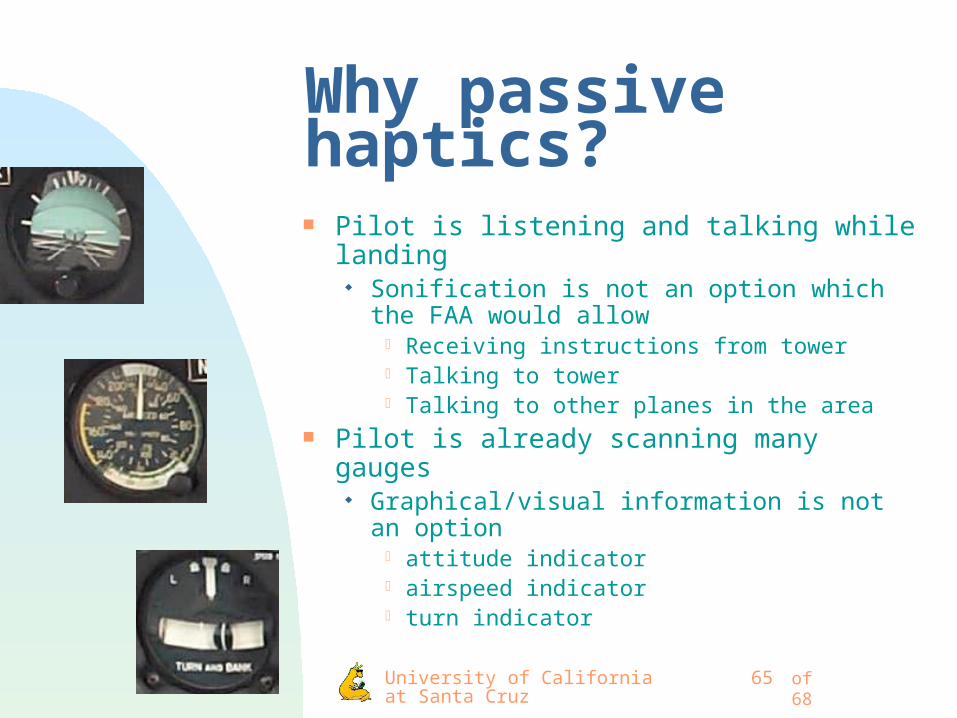
Why passive haptics?
Pilot is listening and talking while landing Sonification is not an option which the
FAA would allow Receiving instructions from tower Talking to tower Talking to other planes in the area
Pilot is already scanning many gauges Graphical/visual information is not an
option attitude indicator airspeed indicator turn indicator

University of California at Santa Cruz
66 of 68
Why passive haptics? (cont)
Pilot needs both hands and both feet to fly Active haptics would not work
Left hand on yoke Right hand on throttle Left foot on left rudder Right foot on right rudder
Passive haptics could be attached to pilot seat
University of California at Santa Cruz
67 of 68
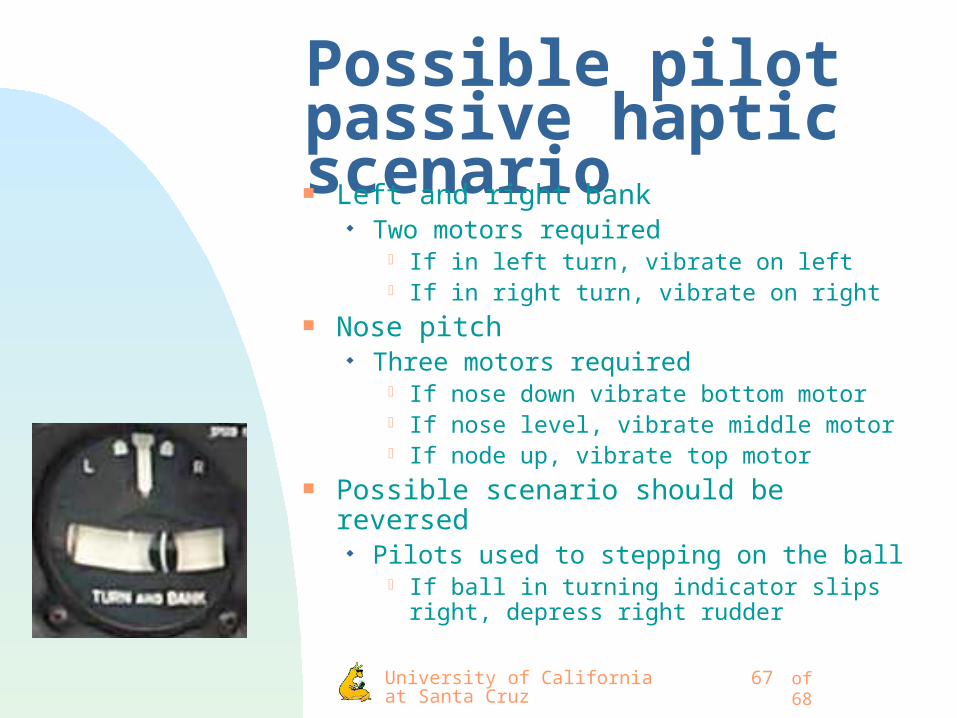
Possible pilot passive haptic scenario Left and right bank
Two motors required If in left turn, vibrate on left If in right turn, vibrate on right
Nose pitch Three motors required
If nose down vibrate bottom motor If nose level, vibrate middle motor If node up, vibrate top motor
Possible scenario should be reversed Pilots used to stepping on the ball
If ball in turning indicator slips right, depress right rudder

University of California at Santa Cruz
68 of 68
Goals
Passive haptics is an information channel which has not been researched I am most interested in passive haptic information displayed on it’s own
information channel non-redundant
I will employ usability testing to prove effectiveness of haptic mappings In combination with other modalities when appropriate
Watching for cross-modal problems and enhancements Alone when appropriate
Watching for enhancement of a performed task My starting basis will be in scientific visualization
Increasing the amount of information able to be perceived in a period of time Great possibility of moving to flight simulation if funding found

University of California at Santa Cruz
69 of 68
Acknowledgements Alex Pang for his patience and the initial suggestion of haptics. Suresh Lodha for his direction in sonification. Chris White for the computer, but mostly for his loving support. Mark Boyd for his excellent insight into planes and helping me
conceive an exciting (possible) real-time haptic application. Mark Hansen for our years of collaborative work on ProtAlign
before sonification. Carol Mullane for her help in sorting out all of the little things
before they become big things.