multi-objective particle swarm optimization for...
TRANSCRIPT

HYDROLOGICAL PROCESSESHydrol. Process. 21, 2897–2909 (2007)Published online 10 January 2007 in Wiley InterScience(www.interscience.wiley.com) DOI: 10.1002/hyp.6507
Multi-objective particle swarm optimization for generatingoptimal trade-offs in reservoir operation
M. Janga Reddy and D. Nagesh Kumar*Department of Civil Engineering, Indian Institute of Science, Bangalore - 560 012, India
Abstract:
A multi-objective particle swarm optimization (MOPSO) approach is presented for generating Pareto-optimal solutions forreservoir operation problems. This method is developed by integrating Pareto dominance principles into particle swarmoptimization (PSO) algorithm. In addition, a variable size external repository and an efficient elitist-mutation (EM) operatorare introduced. The proposed EM-MOPSO approach is first tested for few test problems taken from the literature and evaluatedwith standard performance measures. It is found that the EM-MOPSO yields efficient solutions in terms of giving a wide spreadof solutions with good convergence to true Pareto optimal solutions. On achieving good results for test cases, the approachwas applied to a case study of multi-objective reservoir operation problem, namely the Bhadra reservoir system in India. Thesolutions of EM-MOPSOs yield a trade-off curve/surface, identifying a set of alternatives that define optimal solutions to theproblem. Finally, to facilitate easy implementation for the reservoir operator, a simple but effective decision-making approachwas presented. The results obtained show that the proposed approach is a viable alternative to solve multi-objective waterresources and hydrology problems. Copyright 2007 John Wiley & Sons, Ltd.
KEY WORDS multi-objective optimization; particle swarm optimization; elitist-mutation; reservoir operation; hydropower;irrigation; water quality; Pareto optimal solutions
Received 2 December 2005; Accepted 26 June 2006
INTRODUCTION
Most of the water resources and hydrology problems arecharacterized by multiple objectives and/or goals, whichoften conflict and compete with one another. Optimiza-tion of multi-purpose reservoir systems involves solvingmulti-objective problems. For example, for a reservoirsystem having hydropower and flood control as key pur-poses, the two major objectives can be maximization ofthe hydropower generation from the reservoir and mini-mization of flood risk or flood damage. Obviously, thesetwo objectives are in conflict and compete with eachother. The higher the level of the reservoir, the morethe hydropower generation possible because of the highwater head, yet less water storage will be available forflood control purposes and vice-versa. Clearly, one canidentify, within the active storage capacity of that reser-voir, a Pareto optimum region where the enhancement ofthe first objective can be achieved only at the expense ordegradation of the second, namely flood control (Haimeset al., 1990). Also the units of these two objectives arenon-commensurable. The first objective, which maxi-mizes the hydroelectric power, is generally measured inunits of energy and not necessarily in monetary units,whereas the second objective can be measured in termsof acres of land, livestock, or human lives saved. If theobjectives are non-commensurate, the classic methodsof optimization cannot be applied easily. Of the several
* Correspondence to: D. Nagesh Kumar, Department of Civil Engineer-ing, Indian Institute of Science, Bangalore - 560 012, India.E-mail: [email protected]
approaches developed to deal with multiple objectives,tradeoff methodologies have shown promise as effec-tive means for considering non-commensurate objectivesthat are to be subjectively compared in operation deter-mination (Cohon and Marks, 1975). Therefore efficientgeneration of a set of alternatives for multiple objectivesis very important with minimum computational require-ments.
Scope for multi-objective optimization usingmeta-heuristic techniques
Reservoir operation modeling has an exhaustive liter-ature presenting various optimization techniques in orderto solve various kinds of problems (Yeh, 1985). How-ever, in order to focus on the goal of this paper, abrief overview is given here. Most of the researcherson reservoir operation problems have tried conventionaltechniques to generate tradeoffs among multiple objec-tives. For example, Tauxe et al. (1979) have applied amulti-objective dynamic programming (DP) model foranalyzing a reservoir operation problem involving threeconflicting objectives. Thampapillai and Sinden (1979)and Mohan and Raipure (1992) analyzed the tradeoffsfor multiple objective planning through linear program-ming (LP). To handle multiple objectives, many studieshave used either the weighing approach or the constraintmethod. The constraint method was used for generationof noninferior set and trade-off curves for reservoir oper-ation problems (e.g. Croley and Rao, 1979; Yeh andBecker, 1982; Liang et al., 1996 and Wang et al., 2005).
Copyright 2007 John Wiley & Sons, Ltd.

2898 M. J. REDDY AND D. NAGESH KUMAR
The conventional optimization methods such as DP,LP, and non-linear programming (NLP) are not suitableto solve multi-objective optimization problems (MOOP),because these methods use a point-by-point approach, andthe outcome of these classical optimization methods is asingle optimal solution. For example, the weighted summethod will convert the MOOP into a single objectiveoptimization. By using a single pair of fixed weights, onlyone point on the Pareto front can be obtained. Therefore,if one would like to obtain the global Pareto optimum,all possible Pareto fronts must first be derived. Thisrequires the algorithms to be executed iteratively, so asto ensure that every weight combination has been used.Obviously, it is impractical to reiterate the algorithmscontinually to exhaust all the weight combinations. Hencethe algorithms should have an ability to ‘learn’ fromprevious performance to direct the proper selection ofweights in further evolutions. Also conventional methodsmay face problems, if the optimal solution lies on non-convex or disconnected regions of function space (Deb,2001).
Recently, meta-heuristic techniques such as evolu-tionary algorithms (EAs) and swarm intelligence tech-niques are becoming increasingly popular for solvingoptimization problems. In the recent past, evolution-ary techniques have been successfully applied for singleobjective optimization (Oliveira and Loucks, 1997; Ward-law and Sharif, 1999; Raju and Nagesh Kumar, 2004)and MOOPs (Yapo et al., 1998; Vrugt et al., 2003; Khuand Madsen, 2005), due to their efficiency and ease inhandling non-linear and non-convex relationships of real-world problems. These techniques have some advantagesover the classical optimization techniques (Deb, 2001).They use a population of solutions in each iteration andoffer a set of alternatives in a single run. They use ran-domized initialization and stochastic search in their oper-ation. Therefore, they can locate the search at any placeover the entire search space and are able to overcomethe problems of local optima. Thus population basedstochastic search techniques are more appropriate to solveMOOPs. Achieving a well-spread and diverse Paretosolution front is the primary goal of MOOP. Among theelitist multi-objective EAs (MOEAs), strength Pareto EA(SPEA) (Zitzler and Thiele, 1999), Pareto-archived evo-lutionary strategy (PAES) (Knowles and Corne, 2000)and non-dominated sorting genetic algorithm (NSGA-II)(Deb et al., 2002) have been successfully demonstratedfor solving MOOP.
Among the meta-heuristic techniques, until recentlyparticle swarm optimization (PSO) was applied only tosingle objective optimization tasks. However, the highspeed of convergence of the PSO algorithm attractedresearchers to develop multi-objective optimization algo-rithms using PSO (Kennedy and Eberhart, 2001). Also,the PSO seems to have some advantages in terms ofthe better exploration and exploitation provided by localand global search capabilities of the algorithm. In thepresent study, a novel approach for multiple-objective
PSO (MOPSO) is developed. To demonstrate the effi-ciency of the proposed approach, results obtained arecompared with NSGA-II, and evaluated with standardperformance measures that are frequently used for per-formance evaluation of MOEAs.
The proposed approach for solving a multi-objectivedecision problem in reservoir operation has a greatpotential for application, due to its attractive feature ofgeneration of large number of well spread Pareto optimalsolutions in a single run. The other approaches suggestedin this paper for decision making, provide an opportunityfor the reservoir operator to choose the desired alternativefrom a set of Pareto-optimal solutions.
PARTICLE SWARM OPTIMIZATION
Swarm intelligence is a new area of research, fromwhich the PSO technique has been evolved througha simple simulation model of the movement of socialgroups such as birds and fish (Kennedy and Eberhart,2001). The basis of this algorithm is that local inter-actions motivate the group behaviour, and individualmembers of the group can profit from the discoveriesand experiences of other members. Social behaviour ismodeled in PSO to guide a population of particles (so-called swarm), moving towards the most promising areaof the search space. The changes of the position ofthe particles within the search space are based on thesocial psychological tendency of individuals to emulatethe success of other individuals. In PSO, each particlerepresents a candidate solution. If the search space isD-dimensional, the ith individual (particle) of the popu-lation (swarm) can be represented by a D-dimensionalvector, Xi D �xi1, xi2, . . . , xiD�T. The velocity (positionchange) of this particle, can be represented by anotherD-dimensional vector, Vi D �vi1, vi2, . . . , viD�T. The bestpreviously visited position of the ith particle is denoted asPi D �pi1, pi2, . . . , piD�T. Defining g as the index of theglobal guide of the particle in the swarm, and superscriptsdenoting the iteration number, the swarm is manipulatedaccording to the following two equations:
vnC1id D �[w vn
id C c1rn1 �pn
id � xnid�/t
C c2rn2 �pn
gd � xnid�/t] �1�
xnC1id D xn
id C t vnC1id �2�
where d D 1, 2, . . . , D; i D 1, 2, . . . , N; N is the size ofthe swarm population; � is a constriction factor whichcontrols and constricts the velocity’s magnitude; w isthe inertial weight, which is often used as a parameterto control exploration and exploitation in the searchspace; c1 and c2 are positive constant parameters calledacceleration coefficients; r1 and r2 are random numbers,uniformly distributed in [0,1]; t is the time step usuallyset as 1 and n is iteration number.
The successful application of PSO in many singleobjective optimization problems reflects its effectiveness,and it seems to be particularly suitable for multiobjective
Copyright 2007 John Wiley & Sons, Ltd. Hydrol. Process. 21, 2897–2909 (2007)DOI: 10.1002/hyp
MOPSO FOR GENERATING OPTIMAL TRADE-OFFS IN RESERVOIR OPERATION 2899
optimization due to its efficiency in yielding betterquality solutions while requiring less computational time(Kennedy and Eberhart, 2001). The main difficulty inextending PSO to multi-objective problems is to find thebest way of selecting the guides for each particle in theswarm. The difficulty is noticeable, as there are no clearconcepts of local and global bests that can be clearlyidentified, when dealing with many objectives rather thana single objective. Recently a few proposals on extensionsof PSO technique to multi-objective optimization havebeen reported (for example, Parsopoulos and Vrahatis,2002; Hu et al., 2003; Li, 2003; Coello et al., 2004).
In this paper, an efficient method is presented forPSO to solve MOOPs. The approach uses Pareto dom-inance criteria for selecting non-dominated solutions;an external repository (ERP) for storing best solutionsfound (elitism); crowding distance operator for creatingeffective selection pressure among the swarm to reachtrue Pareto optimal fronts; and incorporates an effectiveelitist-mutation (EM) strategy for effective explorationof the search space. The proposed elitist-mutated multi-objective particle swarm optimization (EM-MOPSO)algorithm is discussed in detail in the following sections.
MULTI-OBJECTIVE PARTICLE SWARMOPTIMIZATION
Brief concepts of multi-objective optimization are pre-sented first and then the proposed algorithm is explained.
Multi-objective optimization and Pareto optimality
A general MOOP can be defined as: minimize afunction f�x�, subject to p inequality and q equalityconstraints.
min . f�x� D ff1�x�f2�x� . . . fm�x�gT
x 2 D �3�
where x 2 Rn, fi : Rn ! R and
D D{ x 2 Rn : li � x � ui, 8i D 1, . . . ., n
gj�x� ½ 0, 8j D 1, . . . ., phk�x� D 0, 8k D 1, . . . ., q
�4�
where m is number of objectives; D is feasible searchspace; x D fx1x2 . . . xngT is the set of n-dimensionaldecision variables (continuous, discrete or integer); R isthe set of real numbers; Rn is n-dimensional hyper-planeor space; and li and ui are lower and upper limits of i-thdecision variable.
The MOOP should simultaneously optimize the vectorfunction and produce Pareto optimal solutions. Paretofront is a set of Pareto optimal (non-dominated) solutions,being considered optimal, if no objective can be improvedwithout sacrificing at least one other objective. On theother hand, a solution xŁ is referred to as dominated byanother solution x, if and only if, x is equally good orbetter than xŁ with respect to all objectives (Haimes et al.,1990).
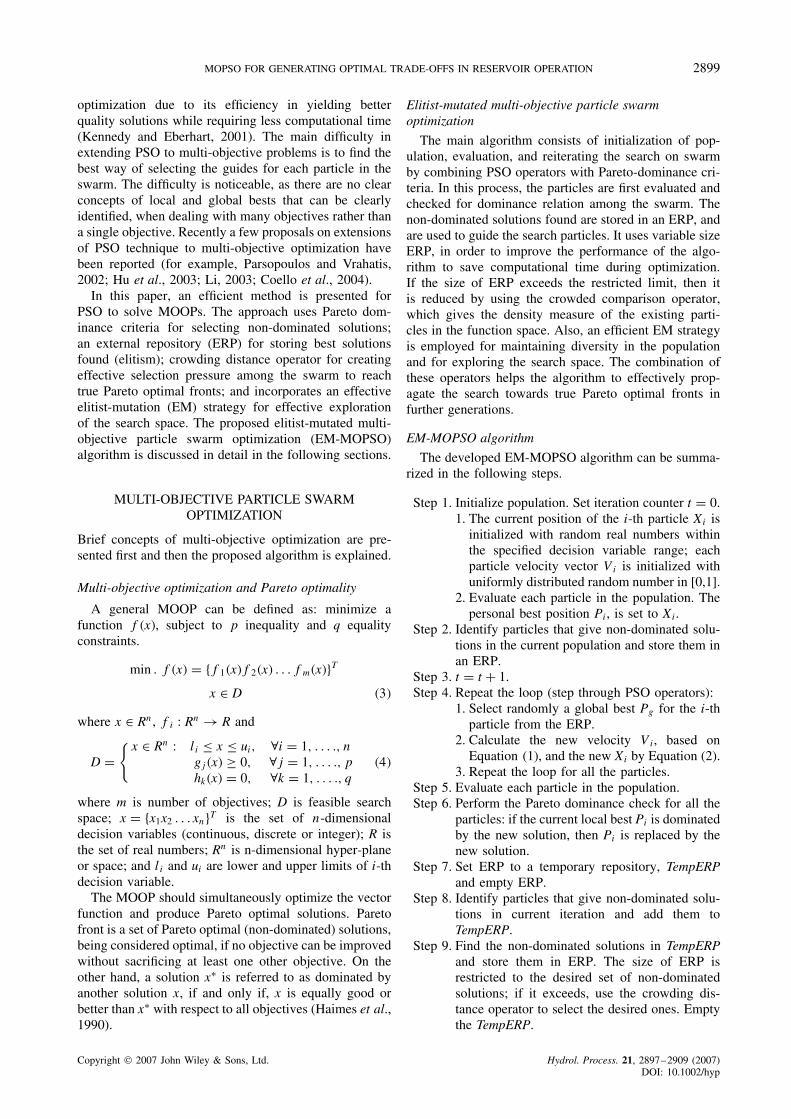
Elitist-mutated multi-objective particle swarmoptimization
The main algorithm consists of initialization of pop-ulation, evaluation, and reiterating the search on swarmby combining PSO operators with Pareto-dominance cri-teria. In this process, the particles are first evaluated andchecked for dominance relation among the swarm. Thenon-dominated solutions found are stored in an ERP, andare used to guide the search particles. It uses variable sizeERP, in order to improve the performance of the algo-rithm to save computational time during optimization.If the size of ERP exceeds the restricted limit, then itis reduced by using the crowded comparison operator,which gives the density measure of the existing parti-cles in the function space. Also, an efficient EM strategyis employed for maintaining diversity in the populationand for exploring the search space. The combination ofthese operators helps the algorithm to effectively prop-agate the search towards true Pareto optimal fronts infurther generations.
EM-MOPSO algorithm
The developed EM-MOPSO algorithm can be summa-rized in the following steps.
Step 1. Initialize population. Set iteration counter t D 0.1. The current position of the i-th particle Xi is
initialized with random real numbers withinthe specified decision variable range; eachparticle velocity vector Vi is initialized withuniformly distributed random number in [0,1].
2. Evaluate each particle in the population. Thepersonal best position Pi, is set to Xi.
Step 2. Identify particles that give non-dominated solu-tions in the current population and store them inan ERP.
Step 3. t D t C 1.Step 4. Repeat the loop (step through PSO operators):
1. Select randomly a global best Pg for the i-thparticle from the ERP.
2. Calculate the new velocity Vi, based onEquation (1), and the new Xi by Equation (2).
3. Repeat the loop for all the particles.Step 5. Evaluate each particle in the population.Step 6. Perform the Pareto dominance check for all the
particles: if the current local best Pi is dominatedby the new solution, then Pi is replaced by thenew solution.
Step 7. Set ERP to a temporary repository, TempERPand empty ERP.
Step 8. Identify particles that give non-dominated solu-tions in current iteration and add them toTempERP.
Step 9. Find the non-dominated solutions in TempERPand store them in ERP. The size of ERP isrestricted to the desired set of non-dominatedsolutions; if it exceeds, use the crowding dis-tance operator to select the desired ones. Emptythe TempERP.
Copyright 2007 John Wiley & Sons, Ltd. Hydrol. Process. 21, 2897–2909 (2007)DOI: 10.1002/hyp

2900 M. J. REDDY AND D. NAGESH KUMAR
Step 10. Perform EM operation on specified number ofparticles.
Step 11. Check for termination criteria; if the terminationcriterion is not satisfied, then go to step 3;otherwise output the non-dominated solution setfrom ERP.
The main operators used in this algorithm are explainedbelow.
Variable size external repository
The selection of the global best guide of the parti-cle swarm is a crucial step in a multi-objective PSOalgorithm. It affects both the convergence capability ofthe algorithm as well as maintaining a good spread ofnon-dominated solutions. As ERP stores non-dominatedsolutions found in the previous iteration, any one of thesolutions can be used as global guide. But we want toensure that the particles in the population move towardsthe sparse regions of the non-dominated solutions andspeed up the convergence towards the true Pareto opti-mal region. To perform these tasks, the global best guideof the particles is selected from a restricted variable sizeERP. This restriction on ERP is done using the crowdingdistance operator. This operator ensures that those non-dominated solutions with the highest crowding distancevalues are always preferred to be in the ERP. The otheradvantage of this variable size ERP is that it saves con-siderable computational time during optimization. As theERP size increases, the computing requirement becomesgreater for sorting and crowding value calculations. Thusfor effective exploration of the function space, the sizeis initially set to 10% of maximum ERP, and then thevalue is increased in a stepwise manner, so that at thestart of 90% of maximum iterations, it reaches the max-imum size of ERP. Selecting different guides for eachparticle from a restricted repository allows the particlesbetter exploration of the true Pareto optimal region. Thiskind of selection is novel and it effectively improves theperformance of the algorithm.
Crowding distance assignment operator
This operator is adopted from Deb et al. (2002). Thecrowding distance value of a solution provides an esti-mate of the density of solutions surrounding that solu-tion. Crowding distance is calculated by first sorting theset of solutions in ascending objective function values.The crowding distance value of a particular solution isthe average distance of its two neighboring solutions.The boundary solutions that have the lowest and high-est objective function values are given infinite crowdingdistance values, so that they are always selected. Thisprocess is done for each objective function. The finalcrowding distance value of a solution is computed byadding all the individual crowding distance values in eachobjective function. For sorting, an efficient quick sortingprocedure is used. The pseudo-code of crowding distancecomputation is given below.
1. Get the number of non-dominated solutions in the ERP
l D jERPj2. Initialize distance.
For i D 1 to l
ERP[i].dist D 0
3. Compute the crowding distance of each solution.For each objective m,Sort using objective value.
ERP D sort �ERP, m�
Set the boundary points to a large value so that theyare always selected.
ERP[1].dist D ERP[l].dist D 1For i D 2 to (l-1)
ERP[i].dist D ERP[i].dist C �ERP[i C 1].m
� ERP[i � 1].m�/�fmaxm � fmin
m �
Elitist-mutation operator
To maintain diversity in the population and to explorethe search space, a novel strategic mechanism calledEM is incorporated into the algorithm. This acts on apredefined number of particles. In the initial phase ofthis mechanism, it tries to replace the infeasible solutionswith the mutated least crowded particles of ERP and atthe later phase, it tries to exploit the search space aroundthe sparsely populated particles in ERP along the Paretofronts. This is a special strategic mechanism, whichenhances the performance of MOPSO while extendingfrom traditional PSO algorithm. Thus the EM operatorhelps to uniformly distribute the non-dominated solutionsalong the true Pareto optimal front. The pseudo-code ofthe elitist mutation mechanism is given below.
1. Randomly select one of the objectives from m objec-tives. Sort the fitness function of particles in descend-ing order and get the index number descending ordersorted particles (DSP) for the respective particles.
2. Use crowding distance assignment operator and calcu-late the density of solutions in the ERP and sort them indescending order of crowding value. Randomly selectone of the least crowded solutions from the top 10%of ERP as guide (g).
3. Perform EM on a predefined number of particles(NMmax).
Let Rp —be the size of repository; pem - probabilityof elitist mutation; Sm - mutation scale used to preservediversity; rand - uniformly distributed random numberU(0,1); intRnd (a, b) - uniformly distributed integerrandom number in the interval [a, b]; randn - Gaussian
Copyright 2007 John Wiley & Sons, Ltd. Hydrol. Process. 21, 2897–2909 (2007)DOI: 10.1002/hyp

MOPSO FOR GENERATING OPTIMAL TRADE-OFFS IN RESERVOIR OPERATION 2901
random number N(0,1); and VR[i]- range of decisionvariable i.
For i D 1 to NMmax
l D DSP[i]
g D intRnd�1, 0Ð1 ð Rp�
For d D 1 to dim
if �rand < pem�
X[l] [d] D ERP[g][d] C SmŁ VR[d]Ł randn
else
X[l] [d] D ERP[g][d]
End For
End For
If the mutated value exceeds the bounds, then it islimited to the upper or lower bound. The velocity vectorof the particle remains unchanged during this EM step.
Constraint handling
In order to handle the constrained optimization prob-lems, this study adopts the constraint handling mecha-nism proposed by Deb et al. (2002). This is a simple,but very effective procedure reported in the literature. Inthis approach, a solution i is said to be a constrained-dominate solution j if any of the following conditionshold good:
1. Solution i is feasible and solution j is not.2. Both solutions i and j are infeasible, but solution i has
a smaller overall constraint violation.3. Both solutions i and j are feasible and solution i
dominates solution j.
By using all the above steps, the EM-MOPSOapproach is coded in user friendly mathematical softwarepackage MATLAB 6Ð5 and is run on PC/WindowsXP/256MB RAM/2GZ computer. The applicability and effi-ciency of the proposed approach is demonstrated in thefollowing sections.
EM-MOPSO APPLICATION AND PERFORMANCEEVALUATION
In order to demonstrate the efficiency of the proposedEM-MOPSO, it is first tested for a few standard testproblems taken from the MOEAs literature and itsperformance is evaluated with results of NSGA-II.
Test problems
The four test functions considered to test the perfor-mance of the proposed algorithm are given in Table I(Deb, 2001). The first test problem (BNH) is a MOOP,with two objectives subject to two constraints. The sec-ond test problem (KITA) is a MOOP, with maximiza-tion of two objectives subject to three constraints. Thisproblem has non-convexity in its Pareto optimal region.The third test problem (CONSTR) is a MOOP, withtwo objectives subject to two constraints. This problemhas the difficulty that a part of the unconstrained Paretooptimal region is not feasible. Thus the resulting con-strained Pareto optimal region is a concatenation of thefirst constraint boundary and some part of unconstrainedPareto optimal region. The fourth test problem (SRN) isa MOOP, with two objectives subject to two constraints.Here the constrained Pareto optimal set is a subset ofthe unconstrained Pareto-optimal set, which gives diffi-culty in finding the true Pareto optimal region for thealgorithm.
Sensitivity of EM-MOPSO parameters
The sensitivity analysis of the PSO model is performedwith different combinations of each parameter. In thisanalysis, it is observed that by considering the propervalue for the constriction coefficient, the inertial weightdoes not have much influence on the final result of themodel (Nagesh Kumar and Janga Reddy, 2006). So inthis study the inertial weight (w) is fixed as 1. Also, itis found that the value of constriction coefficient � equalto 0Ð9 yields better results for the given model. After anumber of trials, it was found that constant parametersc1 D 1Ð0 and social parameter c2 D 0Ð5 resulted in betterquality solutions. The same values are used for all thetest problems.
Table I. Test problems used in the study
Problem Variable bounds Objective functions Constraints
BNH x1 2 [0, 5] Minimize g1�x� D �x1 � 5�2 C x22 � 25
x2 2 [0, 3] f1(x) D 4x21 C 4x2
2 g2�x� D �x1 � 8�2 C �x2 C 3�2 ½ 7Ð7f2(x) D �x1 � 5�2 C �x2 � 5�2
KITA xi 2 [0, 7] Maximize g1�x� D x1/6 C x2 � 6Ð5 � 0i D 1, . . . , 3 f1�x� D �x2
1 C x2 g2�x� D 0Ð5x1 C x2 � 7Ð5 � 0f2�x� D 0Ð5x1 C x2 C 1 g3�x� D 5x1 C x2 � 30 � 0
CONSTR x1 2 [0Ð1, 1Ð0] Minimize g1�x� D x2 C 9x1 ½ 6x2 2 [0, 5] f1(x) D x1 g2�x� D �x2 C 9x1 ½ 1
f2(x) D �1 C x2�/x1
SRN xi 2 [�20, 20] Minimize g1�x� D x21 C x2
2 � 225i D 1, 2 f1(x) D �x1 � 2�2 C �x2 � 1�2 C 2 g2�x� D x1 � 3x2 � �10
f2(x) D 9x1 � �x2 � 1�2
Copyright 2007 John Wiley & Sons, Ltd. Hydrol. Process. 21, 2897–2909 (2007)DOI: 10.1002/hyp

2902 M. J. REDDY AND D. NAGESH KUMAR
Size of elitist-mutated particles (NMmax ). The numberof particles to be elitist mutated is selected after ensuringthat the population does not lose control on search at thecost of exploring for better non-dominated solutions. Toexperiment with the size of elitist mutated particles, thenumber of particles is varied as 5, 10, 15, 20, 25 and 30for the problems having a maximum population of 100.The best results are found for NMmax D 20 and is keptconstant for all the test problems considered in this study.
Probability of elitist mutation (pem). pem is varied from0 to 0Ð5 for sensitivity analysis. It is found that bestperformance occurs at pem D 0Ð2, and is kept constantfor all the test problems considered in the study.
Elitist-mutation operator mutation scale (Sm). Theother parameter used in EM operation is mutation scale(Sm). After various experiments, it is found that a valueof Sm in the range of 0Ð2 to 0Ð01 gives good performance.This is selected after ensuring that at the initial stage itdid not deteriorate the search while exploring the searchspace or stagnate the search at the end of iterations.
Simulation results
To run the EM-MOPSO algorithm, the followingparameters are used: size of population D 100; constantparameters c1 D 1Ð0 and c2 D 0Ð5; inertial weight w D 1;constriction coefficient � D 0Ð9; size of ERP D 100; thesize of elitist-mutated particles is set to 20, the valueof pem was set to 0Ð2; and the value of Sm decreasesfrom 0Ð2 to 0Ð01 over the iterations. To run the NSGA-IImodel, the initial population was set to 100, crossoverprobability to 0Ð9, and mutation probability to 1/n(n is the number of real variables). The distribution indexvalues for real-coded crossover and mutation operatorsare set to 20 and 100 respectively (Deb et al., 2002).Maximum number of iterations in a run is set to 250 forboth the algorithms. The same parameter settings wereused for all the problems. To evaluate the performanceof the proposed EM-MOPSO algorithm, this study usestwo performance measures, set coverage metric (SC) andspacing metric (SP) (Deb, 2001). The details of theseperformance metrics are presented in APPENDIX- A.
Table II shows the best, worst, mean, variance andstandard deviation (SD) values of the two performancemetrics (SC and SP) obtained from 10 independentruns using EM-MOPSO and NSGA-II. The set coveragemetrics SC (A, B) and SC (B, A) give a measure of howmany solutions of A are covered by B and vice versa.Here, the value SC �A, B� D 1 means that all solutionsin B are weakly dominated by A, while SC �A, B� D 0represents the situation when none of the solutions inB are weakly dominated by A. It can be seen thatwith respect to the SC metric, the average performanceof EM-MOPSO is the best for test functions BNH,KITA and SRN, whereas NSGA-II performs best forthe CONSTR problem. This metric shows the efficiencyof EM-MOPSO in achieving better convergence to true
Table II. Resulting statistics by EM-MOPSO and NSGA-II fortest problems, considered in the study. In SC(A, B), A isEM-MOPSO and B is NSGA-II. Bold numbers indicate the best
performing algorithm
Test Statistic Performance metricproblem
Set coveragemetric (SC)
Spacingmetric (SP)
SC(A, B) SC(B,A) EM-MOPSO
NSGA-II
Best 0Ð1400 0Ð1200 0Ð6357 0Ð6408Worst 0Ð0900 0Ð0500 0Ð7559 0Ð8928
BNH Mean 0.1111 0Ð0877 0.6941 0Ð7756Variance 0Ð0003 0Ð0005 0Ð0015 0Ð0053SD 0Ð0176 0Ð0233 0Ð0385 0Ð0727Best 0Ð2900 0Ð2400 0Ð0374 0Ð0496Worst 0Ð1200 0Ð1300 0Ð4254 0Ð5117
KITA Mean 0.2400 0Ð1811 0.1359 0Ð1464Variance 0Ð0015 0Ð0013 0Ð0196 0Ð0227SD 0Ð0394 0Ð0355 0Ð1401 0Ð1507Best 0Ð1600 0Ð1700 0Ð0374 0Ð0372Worst 0Ð0700 0Ð1000 0Ð0431 0Ð0487
CONSTR Mean 0Ð1181 0.1344 0.0406 0Ð0437Variance 0Ð0008 0Ð0004 0Ð0000 0Ð0000SD 0Ð0281 0Ð0201 0Ð0017 0Ð0041Best 0Ð1400 0Ð1400 1Ð0768 1Ð3402Worst 0Ð0400 0Ð0400 1Ð3929 1Ð7073
SRN Mean 0.0978 0Ð0944 1.2439 1Ð5860Variance 0Ð0014 0Ð0009 0Ð0114 0Ð0179SD 0Ð0370 0Ð0305 0Ð1055 0Ð1337
Pareto optimal fronts than NSGA-II. With regard to thespacing metric (SP), as compared to NSGA-II, EM-MOPSO gives smaller SP values for all the test problemsconsidered in the study. The smaller SP indicates thatthe algorithm gives better distribution of solutions. ThusEM-MOPSO maintains the best distribution of solutionsfor all the test problems. For illustration purposes, asample result for each of the test problems considered isshown in the plots in Figure 1. Thus the results obtainedclearly show that the proposed method does not have anydifficulty in achieving a good spread of Pareto optimalsolutions for constrained multi-objective optimization.
CASE STUDY
To demonstrate the efficacy of the proposed approach,the Bhadra reservoir system in India is taken up as acase study for developing optimal reservoir operationpolicy. Figure 2 shows the location map of the Bhadrareservoir system. The Bhadra dam is located at latitude13°420 N and longitude 75°3802000 E. The Bhadra reser-voir is a multi-purpose project providing facilities for irri-gation, hydropower generation and meeting water qualityrequirements downstream. The schematic diagram of thereservoir system is given in Figure 3.
Most of the inflows into the reservoir are received dur-ing the monsoon season of 4 months. But the demandsare distributed throughout the year. The reservoir pro-vides water for irrigation of 6367 ha and 87 512 ha under
Copyright 2007 John Wiley & Sons, Ltd. Hydrol. Process. 21, 2897–2909 (2007)DOI: 10.1002/hyp

MOPSO FOR GENERATING OPTIMAL TRADE-OFFS IN RESERVOIR OPERATION 2903
(b) KITA
7.4
7.6
7.8
8.0
8.2
8.4
8.6
−4.0 −2.0 0.0 2.0 4.0 6.0 8.0
f1
f2
EM-MOPSO
NSGA-II
(a) BNH
0
10
20
30
40
50
0 30 60 90 120 150
f1
f2
EM-MOPSO
NSGA-II
(d) SRN
−250
−200
−150
−100
−50
0
0 50 100 150 200 250
f1
f2
EM-MOPSO
NSGA-II
(c) CONSTR
0
2
4
6
8
10
0.3 0.4 0.5 0.6 0.7 0.8 0.9 1.0 1.1
f1
f2
EM-MOPSO
NSGA-II
Figure 1. Non-dominated solutions obtained using EM-MOPSO and NSGA-II for the test problems (a) BNH, (b) KITA, (c) CONSTR and (d) SRN
left and right bank irrigation canals respectively. Theirrigated area spread over the districts of Chitradurga,Shimoga, Chikmagalur, and Bellary in Karnataka state,comprises predominantly of red loamy soil, except insome portions of the right bank canal area, which consistsof black cotton soil. Major crops grown in the com-mand area are paddy, sugarcane, permanent garden, andsemidry crops. Also under this project there are three setsof turbines, one set each on the left bank canal and theright bank canal and the other set at the river bed levelof the dam, generating hydropower. The operating headabove river bed, ranges from 38Ð56 m to 54Ð41 m for theright bank turbine (PH2), and from 36Ð88 m to 56Ð69 mfor left bank turbine (PH1) and bed turbines (PH3). Themean tail water levels of right bank, left bank, and bedturbines are at 32Ð736 m, 12Ð802 m and 6Ð706 m abovethe bed level respectively. It can be noted that the waterreleased to left bank and right bank canals goes throughturbines only when the water is within the limits of tur-bine operating range, otherwise it will be released directlyfor irrigation. Water quality is also a major concern to thereservoir authorities due to continuous development ofindustries in the downstream region. So the water qual-ity objective requires certain minimum water levels to bemaintained in the river downstream.
Salient features of the reservoir are given in Table III.Data pertaining to monthly inflows and other details werecollected from water resources development organiza-tion (WRDO), Bangalore covering a period of 69 years(from 1930–1931 to 1998–1999). The monthly cropwater requirements were calculated using Food and Agri-cultural Organization (FAO) Penman-Monteith method(Allen et al., 1998).
Model formulation
The objectives of the reservoir operation modelare: minimizing the irrigation deficits, maximizing thehydropower generation and maximizing the satisfactionlevel of water quality. These are conflicting and/or com-petitive objectives. For example, conflict may arise duringdry periods: for minimization of irrigation deficits, morewater is to be released to satisfy irrigation demands; whilefor maximization of hydropower production, higher levelof storage in the reservoir is required to produce morehydropower energy; and for maximizing the satisfactionlevel of water quality, steady release of water is requiredto meet river water quality requirements downstream.Thus, solving the allocation problems of this reservoirsystem is interesting from the multi-objective perspec-tive. In order to simplify the water quality objective,in this study it is assumed that if we discharge a pre-specified amount of water into the downstream river, theriver water quality can be maintained. The water qualitydemands are chosen after carefully studying the historicaldata and previous studies on river water quality mainte-nance. To maintain even distribution of irrigation deficitsif any, the irrigation objective is taken as squared devi-ation of demand to release. The competing objectives ofthe system are expressed as follows:
Minimize sum of squared deviations for irrigationannually:
SQDV D12∑
tD1
�D1,t � IR1,t�2 C
12∑tD1
�D2,t � IR2,t�2 �5�
where SQDV is the sum of squared deviations ofirrigation demands from releases. D1,t and D2,t are the
Copyright 2007 John Wiley & Sons, Ltd. Hydrol. Process. 21, 2897–2909 (2007)DOI: 10.1002/hyp

2904 M. J. REDDY AND D. NAGESH KUMAR
Figure 2. Location map of the Bhadra project command area
Left bank canalcapacity = 10 m3/s
Irrigated area = 6, 367 haAnnual demand = 227 Mm3
Irrigated area = 87, 512 haAnnual demand = 1, 911 Mm3
PH1PH2
PH3
Bhadra river
Reservoir
Left turbinecapacity = 2,000 kW
Bed turbinecapacity=24,000 kW
Right turbinecapacity = 13,200 kW
Right bank canalcapacity= 71 m3/s
Figure 3. Schematic diagram of the Bhadra reservoir project
irrigation demands for the left bank canal and right bankcanal command areas respectively in period t in Mm3;IR1,t and IR2,t are the irrigation releases into the left andright bank canals respectively in period t in Mm3.
Table III. Salient features of Bhadra reservoir system
Description Quantity
Gross storage capacity 2025 Mm3
Live storage capacity 1784 Mm3
Dead storage capacity 241 Mm3
Average Annual inflow 2845 Mm3
Left bank canal capacity 10 m3/sRight bank canal capacity 71 m3/sLeft bank turbine capacity (PH1) 2000 KwRight bank turbine capacity (PH2) 13 200 KwRiverbed turbine capacity (PH3) 24 000 kW
Maximize annual hydropower production:
P D12∑
tD1
p�R1,tH1,t C R2,tH2,t C R3,tH3,t� �6�
Copyright 2007 John Wiley & Sons, Ltd. Hydrol. Process. 21, 2897–2909 (2007)DOI: 10.1002/hyp

MOPSO FOR GENERATING OPTIMAL TRADE-OFFS IN RESERVOIR OPERATION 2905
where P is the total energy produced in M kWh; p ispower production coefficient; R1,t, R2,t and R3,t are thereleases to left bank, right bank and river bed turbinesrespectively in period t in Mm3. H1,t, H2,t, H3,t are thenet heads available to the left bank, right bank and bedturbines respectively in meters during period t (here,head is a nonlinear function of initial and final reservoirstorage).
Maximize satisfaction level of river water quality:
WQ D min8tD1,2,...,12
��t� �7�
where, �t is satisfaction level of water quality in periodt and is given by,
�t D
0 if R3,t � QDmin,t�R3,t � QDmin,t�
�QDmax,t � QDmin,t�if QDmin,t �R3,t �QDmax,t
1 if R3,t ½ QDmax,t�8�
where, QDmin,t and QDmax,t are the minimum and maxi-mum water demands to maintain water-quality in periodt in Mm3 for the river downstream of the dam.
The optimization is subject to the following con-straints:
Storage continuity:
StC1 D St C It � �R1,t C R2,t C R3,t C Et C Ot�
8t D 1, 2, . . . , 12 �9�
where St D Active reservoir storage at the beginningof period t in Mm3; It D inflow into the reservoir duringperiod t in Mm3; Et D the evaporation losses duringperiod t in Mm3 (here, Et is a nonlinear function of initialand final storages of period t); Ot D overflow from thereservoir in period t in Mm3;
Storage limits:
Smin � St � Smax 8t D 1, 2, . . . , 12 �10�
where Smin and Smax are the minimum and maximumactive storages of the reservoir in Mm3.
Maximum power production limits:
pR1,tH1,t � E1,max 8t D 1, 2, . . . , 12 �11�
pR2,tH2,t � E2,max 8t D 1, 2, . . . , 12 �12�
pR3,tH3,t � E3,max 8t D 1, 2, . . . , 12 �13�
where, E1,max, E2,max, and E3,max are the maximumamounts of power in M kWh, that can be produced(turbine capacity) by the left, right and bed level turbinesrespectively.
Canal capacity limits:
IR1,t � C1,max 8t D 1, 2, . . . , 12 �14�
IR2,t � C2,max 8t D 1, 2, . . . , 12 �15�
where, C1,max and C2,max are the maximum canal carryingcapacities of the left and right bank canals respectively.
Irrigation demands:
D1 min,t � IR1,t � D1 max,t 8t D 1, 2, . . . , 12 �16�
D2 min,t � IR2,t � D2 max,t 8t D 1, 2, . . . , 12 �17�
where, D1 min,t and D1 max,t are minimum and maxi-mum irrigation demands for left bank canal respectively;D2 min,t and D2 max,t are minimum and maximum irriga-tion demands for right bank canal respectively in timeperiod t.
Water Quality Requirements:
R3,t ½ MDTt 8t D 1, 2, . . . , 12 �18�
where, MDTt D minimum release to meet downstreamwater quality requirement in Mm3.
It can be noted that, in this study, under favorable rangeof reservoir storage for power production, the releasesmade through power turbines also serve to meet irrigationdemands of the left bank and right bank canals duringirrigation requirement periods. However, if the reservoirstorage is not within the limits of the turbine powerproduction range, then the water is released only to meetirrigation demands through sub-ways to irrigation canals.Since the water released for irrigation is restricted to itsdemands, any excess water is not a penalizing problemin the first objective function as given in Equation (5).
RESERVOIR OPERATION MODEL APPLICATIONAND RESULTS
To apply the EM-MOPSO for reservoir operation model,the following parameters are selected. The initial popula-tion of the EM-MOPSO is set to 200; c1 and c2 are set to1Ð0 and 0Ð5 respectively; w is set to 1Ð0; and � is set to0Ð9; the number of non-dominated solutions to be foundis set to 200. For the EM step, the size of elitist-mutatedparticles is set to 30, the value of pem was set to 0Ð2; andthe value of Sm decreases from 0Ð2 to 0Ð01 over the iter-ations. Then EM-MOPSO is run for 500 iteration steps.To run the NSGA-II model, the initial population was setto 200, crossover probability to 0Ð9, and mutation prob-ability to 1/n (n is the number of real variables). Thedistribution index values for real-coded crossover andmutation operators are set to 20 and 100 respectively.NSGA-II is also run for 500 generations. The averagemonthly inflow into the reservoir computed for each cal-endar month over a period of 69 years (from 1930–1931to 1998–1999) is used as inflow data to implement theabove model.
Two-objective model
To show the effectiveness of the proposed MOPSO, forsolving the reservoir operation problem, first it is appliedto irrigation and hydropower as two objectives of themodel. The reservoir operation model consists of mini-mizing irrigation deficits (Equation (5)) and maximizingthe hydropower (Equation (6)) subject to satisfying theconstraints from Equations (9) to (18).
Copyright 2007 John Wiley & Sons, Ltd. Hydrol. Process. 21, 2897–2909 (2007)DOI: 10.1002/hyp

2906 M. J. REDDY AND D. NAGESH KUMAR
To check the performance, 10 independent runs werecarried out for the two-objective reservoir operationmodel using both the algorithms. Table IV shows theresulting statistics for both the EM-MOPSO and NSGA-II models. It can be observed that with respect to setcoverage metric, the average value of SC(A, B) is higherthan the SC(B, A) value (here A is EM-MOPSO and B isNSGA-II). The metric SC(A, B) refers to the percentageof solutions in B that are weakly dominated by solutionsof A. Thus in this case, EM-MOPSO is performing betterthan the NSGA-II. Similarly, for the spacing metric, fromTable IV it can be observed that the mean value of SPmetric for EM-MOPSO is lower than that for NSGA-II.This indicates that best distribution of Pareto solutions isobtained in EM-MOPSO. For demonstration purposes asample result corresponding to median value of SC(A,B)is shown in Figure 4. It can be seen that EM-MOPSOis able to generate a set of well-distributed Pareto-optimal solutions. In this case NSGA-II fails to yieldthe extreme solutions, whereas our proposed methodis able to provide extreme solutions comfortably (theminimum squared deviation of irrigation as 0 �Mm3�2 andmaximum hydropower production as 227Ð845 MkWh).Thus again these results demonstrate that the proposedmethod is very useful for real life systems application.
Three-objective model
The reservoir operation model for three objectives con-sists of minimizing the irrigation deficits (Equation (5)),maximizing the hydropower (Equation (6)) and maximiz-ing the satisfaction level of water quality (Equations (7)and (8)) subject to satisfying the constraints fromEquations (9) to (18). Figure 5 shows the results of 200non-dominated solutions obtained using EM-MOPSOafter 500 iterations. There are a number of alternativesthat can be chosen at various satisfaction levels of themultiple objectives. Depending on the circumstances pre-vailing under the reservoir system and by analyzing thetradeoff between the multiple objectives, the reservoiroperator can make an appropriate decision. The detailsof decision making for application are presented in thefollowing section.
Table IV. Resulting statistics by EM-MOPSO and NSGA-II forthe two-objective reservoir operation model. In SC(A,B), A isEM-MOPSO and B is NSGA-II. Bold numbers indicate the best
performing algorithm
Statistic Performance metric
Set coverage metric(SC)
Spacing metric(SP)
SC(A, B) SC(B,A) EM-MOPSO NSGA-II
Best 0Ð2000 0Ð0400 206Ð1277 246Ð2255Worst 0Ð8788 0Ð6350 294Ð1276 787Ð7765Mean 0.5582 0Ð2878 258.2752 504Ð3212Variance 0Ð0435 0Ð0317 1419Ð9885 32 583Ð4308SD 0Ð2085 0Ð1780 37Ð6827 180Ð5088
145
155
165
175
185
195
205
215
225
235
0 25000 50000 75000 100000 125000
f1
f2
EM-MOPSO
NSGA-II
Figure 4. Non-dominated solutions obtained using EM-MOPSO andNSGA-II for two-objective reservoir operation model. The two objectivesare f1- squared deviation of irrigation �Mm3�2, f2-hydropower production,
M kWh
00.5
11.5
2
x 105
100
150
200
2500
0.2
0.4
0.6
0.8
1
f1f2
f3
Figure 5. Non-dominated solutions obtained for three-objective reservoiroperation model using EM-MOPSO. f1-sum of squared deficits of irriga-tion releases �Mm3�2; f2-hydropower production, M kWh; f3-satisfaction
level of water quality
Decision making
In any application, for final decision making, the deci-sion maker might be interested in minimum possiblenumber of well representative solutions for further analy-sis. So it is important that after obtaining many solutionswhich are true Pareto Optimal with uniform spread andwide coverage, we need to reduce the large set of solu-tions to a few representative solutions. In order to dothat, various clustering algorithms are available. A sim-ple clustering algorithm, which reduces the large numberof final Pareto solutions (N) to a few representative solu-tions (N), is described here.
Clustering technique
First each solution in ERP is considered to reside ina separate cluster. Thus initially there are N clusters.Thereafter the cluster distances between all pairs ofclusters are calculated. Then the two clusters with theminimum cluster distance are combined together to formone big cluster. The procedure is repeated by calculatingthe cluster distances for all the pairs of clusters obtained
Copyright 2007 John Wiley & Sons, Ltd. Hydrol. Process. 21, 2897–2909 (2007)DOI: 10.1002/hyp

MOPSO FOR GENERATING OPTIMAL TRADE-OFFS IN RESERVOIR OPERATION 2907
by merging the two closest clusters. This process ofmerging clusters is continued until the number of clustersin the ERP is reduced to N. Thereafter, in each cluster,the solution with the minimum average distance fromother solutions in the cluster is taken as a representativesolution for that cluster. The step-by-step procedure ofthe algorithm is given below (Deb, 2001).
1. Initialize cluster set C; each individual i in ERPconstitutes a distinct cluster. i.e. Ci D fig, so thatC D fC1, C2, . . . ., CNg
2. If, jCj � N go to Step 5, otherwise go to Step 3.3. For each pair of clusters, calculate the cluster-distance
by using Equation (19).
d12 D 1
jC1j.jC2j∑
i2C1,j2C2
d�i, j� �19�
where the function d12 reflects the distance between twoindividuals i1 and i2 (here the distance in objective spaceis used).4. Find the pair (i1, i2) which corresponds to the mini-
mum cluster-distance. Merge the two clusters Ci1 andCi2 together. This reduces the size of C by one. Go toStep 2.
5. Choose only one solution from each cluster and removeall others from the cluster. The solution having theminimum average distance from other solutions in thecluster is chosen as the representative solution of thecluster (centroid method).
To reduce the large number of alternatives, the num-ber of clusters is chosen as 20. According to the clus-ter algorithm described above, this reduces the largeset of non-dominated solutions to a few representativesolutions. Figure 6 shows the 20 representative clusteredPareto-optimal solutions for the three-objective reservoiroperation model.
To facilitate final decision making, (i.e. to understandhow each of the objectives can influence the decision) a
00.5
11.5
2
x 105
100
150
200
2500
0.2
0.4
0.6
0.8
1
f1f2
f3
Figure 6. Representative non-dominated solutions obtained from clus-tering of EM-MOPSO generated solutions. f1-sum of squared deficitsof irrigation releases �Mm3�2; f2-hydropower production, M kWh;
f3-satisfaction level of water quality
simple procedure called Pseudo-weight vector approachis employed in this study and the details of the procedureare given below.
Pseudo-weight vector approach
In this approach, a pseudo-weight vector is calculatedfor each obtained solution. For minimization problems,the approach is described here. From the obtained set ofsolutions, the minimum fmin
i and maximum fmaxi values
of each objective function i are noted. Thereafter theEquation (20) is used to compute the weight wi for thei-th objective function (Deb, 2001):
wi D �fmaxi � fi�x��/�fmax
i � fmini �
M∑mD1
�fmaxi � fm�x��/�fmax
i � fminm �
�20�
This equation calculates the relative distance of thesolution from the worst (maximum) value in each objec-tive function. Thus, for the best solution for the i-thobjective, the weight wi is to be a maximum. The numer-ator in the right side of the above equation ensures thatthe sum of all weight components for a solution is equalto one. Once the weight vectors are calculated, a simplestrategy is to choose the solution closer to a user-preferredweight vector. For example, if an 80% weightage for f1
and a 20% weightage for f2 are desired, the correspond-ing weight vector closer to that non-dominated solutioncan be selected for final decision making.
Based on pseudo-weight vector approach, the weightsthat can be given for each objective are shown in Table V,which gives the objective values for each of the represen-tative Pareto optimal solutions and its respective weight(shown in parenthesis) for each alternative. This providesease in decision making for policy implementation. Afteranalyzing the available alternatives, based on individualpreferences, the final decision can be made. Suppose thereservoir operator decides to implement a policy withweights 0Ð5, 0Ð1 and 0Ð4 for irrigation deficit, hydropowerproduction and water quality satisfaction levels respec-tively, then a solution closer to that set of weights i.e.9th solution from the Table V can be selected. The modelreadily gives the corresponding policy for implementa-tion. Figure 7 shows the corresponding releases to bemade into the left bank canal, right bank canal and bedturbine. Figure 8 shows the corresponding initial stor-ages required for ensuring such releases. Thus this kindof analysis can be implemented effectively with the pro-posed EM-MOPSO technique for derivation of reservoiroperation policies.
CONCLUSIONS
In this study, a novel approach for multi-objectiveoptimization based on swarm intelligence principles isproposed and applied to develop efficient operatingalternatives for multi-objective reservoir operation. Theproposed MOPSO approach combines PSO technique
Copyright 2007 John Wiley & Sons, Ltd. Hydrol. Process. 21, 2897–2909 (2007)DOI: 10.1002/hyp

2908 M. J. REDDY AND D. NAGESH KUMAR
Table V. Filtered or representative Pareto optimal solutions forthe three-objective reservoir operation model. The values inbrackets show the pseudo weights obtained for the respective
objective
Sl. No. Sum of squareddeficits of irrigationreleases �Mm3�2
Hydropower(M kWh)
Water qualitysatisfaction level
1 868Ð18 (0Ð60) 146Ð94 (0Ð02) 0Ð66 (0Ð39)2 32 580Ð11 (0Ð56) 199Ð25 (0Ð44) 0Ð03 (0Ð00)3 1 56 619Ð52 (0Ð00) 232Ð14 (0Ð50) 1Ð00 (0Ð50)4 99 357Ð97 (0Ð16) 223Ð42 (0Ð40) 1Ð00 (0Ð44)5 64 860Ð54 (0Ð28) 209Ð53 (0Ð36) 0Ð77 (0Ð36)6 40 728Ð10 (0Ð31) 202Ð89 (0Ð28) 1Ð00 (0Ð42)7 24 705Ð84 (0Ð37) 192Ð85 (0Ð24) 0Ð91 (0Ð39)8 252Ð88 (0Ð93) 144Ð72 (0Ð00) 0Ð11 (0Ð07)9 2796·60 (0·51) 161·66 (0·10) 0·77 (0·39)
10 1903Ð16 (0Ð68) 161Ð25 (0Ð13) 0Ð31 (0Ð20)11 69 078Ð16 (0Ð25) 210Ð89 (0Ð34) 0Ð89 (0Ð40)12 8392Ð71 (0Ð56) 177Ð37 (0Ð22) 0Ð40 (0Ð23)13 1 30 367Ð73 (0Ð08) 227Ð08 (0Ð45) 1Ð00 (0Ð47)14 9315Ð25 (0Ð47) 178Ð42 (0Ð19) 0Ð67 (0Ð33)15 9851Ð96 (0Ð50) 179Ð74 (0Ð21) 0Ð55 (0Ð29)16 44 503Ð89 (0Ð38) 205Ð14 (0Ð37) 0Ð47 (0Ð24)17 3686Ð70 (0Ð74) 170Ð16 (0Ð22) 0Ð07 (0Ð03)18 19 680Ð38 (0Ð58) 189Ð37 (0Ð34) 0Ð16 (0Ð09)19 81 005Ð89 (0Ð21) 217Ð66 (0Ð36) 1Ð00 (0Ð43)20 1542Ð24 (0Ð74) 160Ð49 (0Ð13) 0Ð20 (0Ð13)
0
50
100
150
200
1 2 3 4 5 6 7 8 9 10 11 12
Month
Rel
ease
(M
m3 )
R1 R2 R3
Figure 7. Release policy obtained for selected optimal point, showingreleases for left bank canal (R1), right bank canal (R2) and river bed
(R3)
400
800
1200
1600
2000
0 7 10 11 12 13Month
Sto
rage
(M
m3 )
654321 8 9
Figure 8. Monthly initial storages to be maintained in the reservoircorresponding to the selected optimal point
with Pareto dominance criteria to evolve non-dominatedsolutions. It uses a variable size ERP and a crowded
comparison operator to promote solution diversity. Inaddition, a special EM operator is incorporated intothe algorithm. This strategic mechanism keeps diversityin the population and consequently helps for effectiveexploration of Pareto optimal front. The proposed EM-MOPSO was first tested for a few standard test problemsfrom the literature and it was found that the approach isquite robust and very competitive to NSGA-II in terms ofyielding a diverse set of solutions along the true Paretooptimal fronts.
On achieving satisfactory performance for test prob-lems, EM-MOPSO is applied to a reservoir operationproblem, namely the Bhadra reservoir project. The multi-ple objectives involve minimization of irrigation deficit,maximization of hydropower and maximization of sat-isfaction level of downstream water quality require-ments. First a two-objective model is solved and EM-MOPSO efficiency is demonstrated by comparing it withthe results of NSGA-II. The results obtained clearlyshow the superiority of the proposed approach. Then theEM-MOPSO approach is extended to a three-objectivemodel and many Pareto optimal solutions are generated.A clustering algorithm is employed to reduce the largeset of Pareto optimal solutions to a small number ofconvenient representative alternatives. To facilitate easein decision making, a pseudo-weight vector approachis employed. This provides an idea about the relativeweight of each alternative and its preference over others.By analyzing the weight combinations, depending on thepreference of the reservoir operator, a suitable policy canbe implemented.
The main advantages of the proposed EM-MOPSOapproach are that it is easy to implement and easy touse, and yet robust in yielding efficient Pareto frontiers.Hence it can be concluded that, for multi-objectivewater resources and hydrology problems, the proposedtechnique is a viable tool for multi-objective analysisand decision making, and can be used in any practicalsituation.
APPENDIX A
Set coverage metric
This metric gives the relative spread of solutionsbetween two sets of solution vectors A and B. The setcoverage metric calculates the proportion of solutions inB, which are weakly dominated by solutions of A (Deb,2001).
C�A, B� D jfb 2 Bj9a 2 A : a � bgjjBj �21�
the value C(A, B) D 1 means that all solutions in B areweakly dominated by A, while C(A, B) D 0 representsthe situation when none of the solutions in B are weaklydominated by A. Since the domination operator is notsymmetric, i.e. C(A, B) is not necessarily equal to 1-C(B,A), it is necessary to calculate both C(A, B) and C(B, A)
Copyright 2007 John Wiley & Sons, Ltd. Hydrol. Process. 21, 2897–2909 (2007)DOI: 10.1002/hyp

MOPSO FOR GENERATING OPTIMAL TRADE-OFFS IN RESERVOIR OPERATION 2909
to understand how many solutions of A are covered byB and vice versa.
Spacing metric
The spacing metric aims at assessing the spread(distribution) of vectors throughout the set of non-dominated solutions. It is calculated with a relativedistance measure between consecutive solutions in theobtained non-dominated set (Deb, 2001):
S D√√√√ 1
jQjjQj∑iD1
�di � d�2 �22�
where di D mink2Q^k 6Di∑M
mD1 jfim � fk
mj and d is the
mean value of the distance measure d D ∑jQjiD1 di
/jQj.
fkm and fi
m are the values of m objective function for kand ith member in the population. The desired value forthis metric is zero, which means that the elements of theset of non-dominated solutions are equidistantly spaced.
REFERENCES
Allen RE, Pereira LS, Raes D, Smith M. 1998. Crop Evapotranspiration,Guidelines for Computing Crop Water Requirements , FAO Irrigationand Drainage Paper 56 . Food and Agricultural Organization of theUnited Nations: Rome.
Coello CAC, Pulido GT, Lechuga MS. 2004. Handling multipleobjectives with particle swarm optimization. IEEE Transactions onEvolutionary Computation 8: 256–279.
Cohon JL, Marks DH. 1975. A review and evaluation of multiobjectiveprogramming techniques. Water Resources Research 11(2): 208–220.
Croley TE II, Rao KNR. 1979. Multi-objective risks in reservoiroperation. Water Resources Research 15(4): 1807–1814.
Deb K. 2001. Multi-objective Optimization Using Evolutionary Algo-rithms . John Wiley and Sons: Chichester.
Deb K, Pratap A, Agarwal S, Meyarivan T. 2002. A fast and elitistmulti-objective genetic algorithm: NSGA-II. IEEE Transaction onEvolutionary Computation 6: 182–197.
Haimes YY, Tarvainen K, Shima T, Thadathil J. 1990. HierarchicalMultiobjective Analysis of Large-scale Systems . Hemisphere publishingco.: New York.
Hu X, Eberhart RC, Shi Y. 2003. Particle swarm with extended memoryfor multiobjective optimization. 2003 IEEE Swarm IntelligenceSymposium Proceedings . IEEE Service Center: Indianapolis, IN;193–197.
Kennedy J, Eberhart RC. 2001. Swarm Intelligence. Morgan Kaufmann:San Mateo, CA.
Khu ST, Madsen H. 2005. Multiobjective calibration with Pareto prefer-ence ordering: an application to rainfall-runoff model calibration. WaterResources Research 41(3): W03004, Doi:10Ð1029/2004WR003041.
Knowles JD, Corne DW. 2000. Approximating the nondominated frontusing the Pareto archived evolution strategy. Evolutionary Computation8: 149–172.
Li X. 2003. A nondominated sorting particle swarm optimizer formultiobjective optimization. In Proceedings Genetic and Evolution-ary Computation—GECCO 2003—Part I , Vol. 2723, Cantu-Paz E,Foster JA, Deb K, Davi L, Roy R, O’Reilly UM, Beyer HG, Stan-dish RK, Kendall G, Wilson SW, Harman M, Wegener J, Dasgupta D,Potter MA, Schultz AC, Dowsland KA, Jonoska N, .Miller JF (eds.).LNCS: Berlin, Germany; 37–48.
Liang Q, Johnson LE, Yu YS. 1996. A comparison of two methods formultiobjective optimization for reservoir operation. Water ResourcesBulletin 32(2): 333–340.
Mohan S, Raipure DM. 1992. Multiobjective analysis of multireservoirsystem. Journal of Water Resource Planning and Management ASCE118: 356–370.
Nagesh Kumar D, Janga Reddy M. 2006. Multipurpose reservoiroperation using particle swarm optimization. Journal of Water ResourcePlanning and Management ASCE (in press).
Oliveira R, Loucks DP. 1997. Operating rules for multireservoir systems.Water Resources Research 33(4): 839–852.
Parsopoulos K, Vrahatis M. 2002. Particle swarm optimization methodin multiobjective problems. Proceedings of the 2002 ACM Symposiumon Applied Computing (SAC’2002). ACM Press: Madrid; 603–607.
Raju KS, Nagesh Kumar D. 2004. Irrigation planning using geneticalgorithms. Water Resources Management 18(2): 163–176.
Tauxe GH, Inman RR, Mades DM. 1979. Multi-objective dynamicprogramming with application to reservoir. Water Resources Research15(6): 1403–1408.
Thampapillai DJ, Sinden JA. 1979. Tradeoffs for multiple objectivesplanning through linear programming. Water Resources Research 15:1028–1034.
Vrugt JA, Gupta HV, Bastidas LA, Bouten W, Sorooshian S. 2003.Effective and efficient algorithm for multiobjective optimizationof hydrologic models. Water Resources Research 39(8): 1214,Doi:10Ð1029/2002WR001746.
Wang YC, Yoshitani J, Fukami K. 2005. Stochastic multiobjectiveoptimization of reservoirs in parallel. Hydrological Processes 19:3551–3567.
Wardlaw R, Sharif M. 1999. Evaluation of genetic algorithms for optimalreservoir system operation. Journal of Water Resources Planning andManagement ASCE 125(1): 25–33.
Yapo PO, Gupta V, Soorishian S. 1998. Multi-objective global optimiza-tion for hydrological models. Journal of Hydrology 204: 83–97.
Yeh WW-G. 1985. Reservoir management and operations models: a state-of-the-art review. Water Resources Research 21(12): 1797–1818.
Yeh WW-G, Becker L. 1982. Multiobjective analysis of multreservoiroperations. Water Resources Research 18(5): 1326–1336.
Zitzler E, Thiele L. 1999. Multiobjective evolutionary algorithms: acomparative case study and the strength Pareto approach. IEEETransaction on Evolutionary Computation 3: 257–271.
Copyright 2007 John Wiley & Sons, Ltd. Hydrol. Process. 21, 2897–2909 (2007)DOI: 10.1002/hyp