multi-period spectral parameters - c.ymcdn.com · in accordance with section 21.1 see section...
TRANSCRIPT
Charlie Kircher, Ph.D. P.E. Kircher & Associates Palo Alto, California
. March 8-10, 2016
BSSC Second Annual Colloquium and Project 17 Meeting
.
Project 17 – Development of Next-Generation Seismic Design Values Maps
.
.
Multi-Period Spectral Parameters (of the 2020 NEHRP Provisions and ASCE 7-22?)

Topics • Background Material
– Design Response Spectrum (Figure 11.4-1 of ASCE 7-16)
• The Problem – Root Cause
• Short-Term Solution (ASCE 7-16) – Option 1 – Reformulate Design Parameters – Option 2 - Revise Site-Specific Requirements
• Long-Term Solution (ASCE 7-22) – Slides 19 - 21 – Project 17 (just starting) – multi-period design spectra and
parameters
• Project 17 Meeting (Slides 22 – 52) – Multi-Period Spectral Parameters Team, Issues and Studies – Some Ground Motion Info
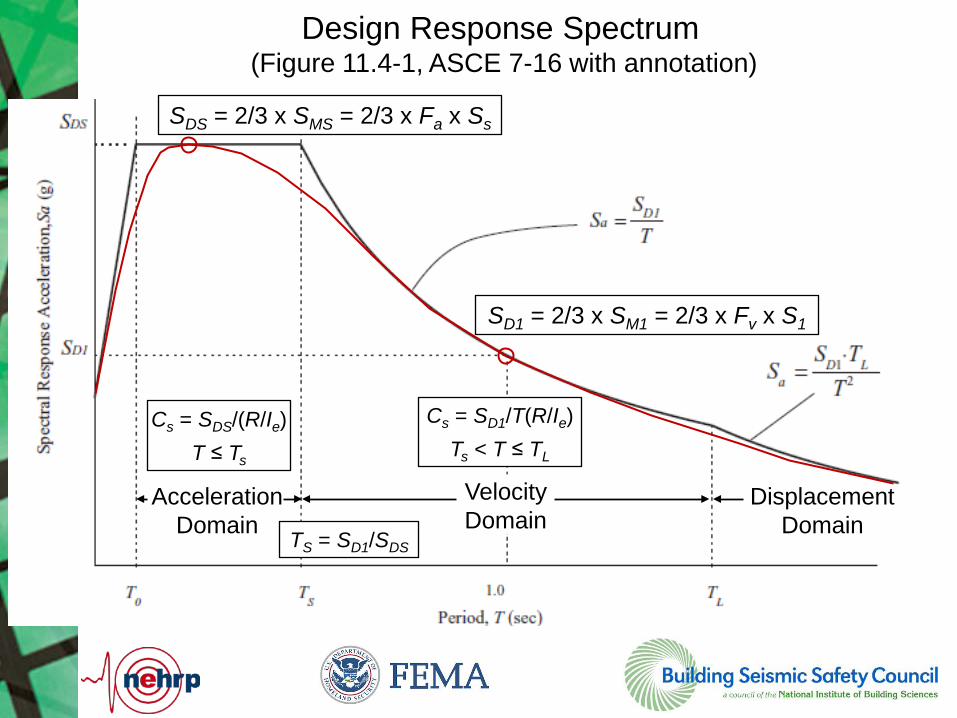
Design Response Spectrum (Figure 11.4-1, ASCE 7-16 with annotation)
Acceleration Domain
Velocity Domain
Displacement Domain
SDS = 2/3 x SMS = 2/3 x Fa x Ss
TS = SD1/SDS
SD1 = 2/3 x SM1 = 2/3 x Fv x S1
Cs = SDS/(R/Ie) T ≤ Ts
Cs = SD1/T(R/Ie) Ts < T ≤ TL
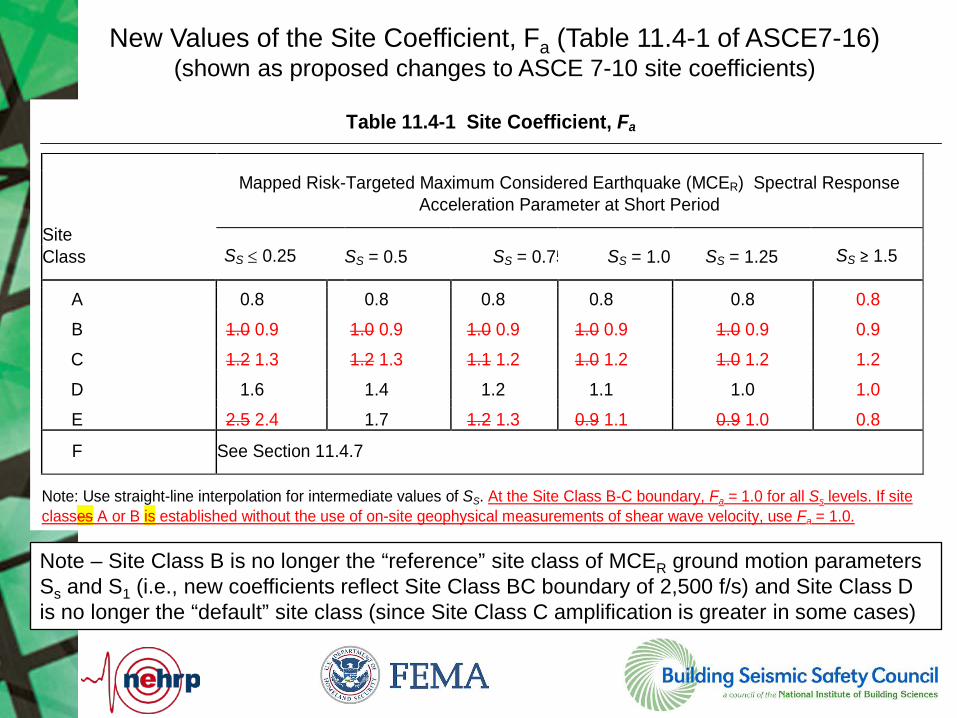
New Values of the Site Coefficient, Fa (Table 11.4-1 of ASCE7-16) (shown as proposed changes to ASCE 7-10 site coefficients)
Table 11.4-1 Site Coefficient, Fa
Site Class
Mapped Risk-Targeted Maximum Considered Earthquake (MCER) Spectral Response Acceleration Parameter at Short Period
SS ≤ 0.25 SS = 0.5 SS = 0.75 SS = 1.0 SS = 1.25 SS ≥ 1.5
A 0.8 0.8 0.8 0.8 0.8 0.8
B 1.0 0.9 1.0 0.9 1.0 0.9 1.0 0.9 1.0 0.9 0.9
C 1.2 1.3 1.2 1.3 1.1 1.2 1.0 1.2 1.0 1.2 1.2
D 1.6 1.4 1.2 1.1 1.0 1.0
E 2.5 2.4 1.7 1.2 1.3 0.9 1.1 0.9 1.0 0.8
F See Section 11.4.7
Note: Use straight-line interpolation for intermediate values of SS. At the Site Class B-C boundary, Fa = 1.0 for all Ss levels. If site classes A or B is established without the use of on-site geophysical measurements of shear wave velocity, use Fa = 1.0.
Note – Site Class B is no longer the “reference” site class of MCER ground motion parameters Ss and S1 (i.e., new coefficients reflect Site Class BC boundary of 2,500 f/s) and Site Class D is no longer the “default” site class (since Site Class C amplification is greater in some cases)

New Values of the Site Coefficient, Fv (Table 11.4-2 of ASCE7-16) (shown as proposed changes to ASCE 7-10 site coefficients)
Table 11.4-2 Site Coefficient, Fv
Site Class
Mapped Risk-Targeted Maximum Considered Earthquake (MCER) Spectral Response Acceleration Parameter at 1-s Period
S1 ≤ 0.1 S1 = 0.2 S1 = 0.3 S1 = 0.4 S1 = 0.5 S1 ≥ 0.6
A 0.8 0.8 0.8 0.8 0.8 0.8
B 1.0 0.8 1.0 0.8 1.0 0.8 1.0 0.8 1.0 0.8 0.8
C 1.7 1.5 1.6 1.5 1.5 1.4 1.5 1.3 1.5 1.4
D 2.4 2.0 2.2 1.8 2.0 1.6 1.9 1.5 1.8 1.7
E 3.5 4.2 3.2 3.3 2.8 2.4 2.4 2.2 2.0
F See Section 11.4.7
Note: Use straight-line interpolation for intermediate values of S1. At the Site Class B-C boundary, Fv = 1.0 for all S1 levels. If site classes A or B are established without the use of on-site geophysical measurements of shear wave velocity, use Fv = 1.0.
Note – Site Class B is no longer the “reference” site class of MCER ground motion parameters Ss and S1 (i.e., new coefficients reflect Site Class BC boundary of 2,500 f/s).
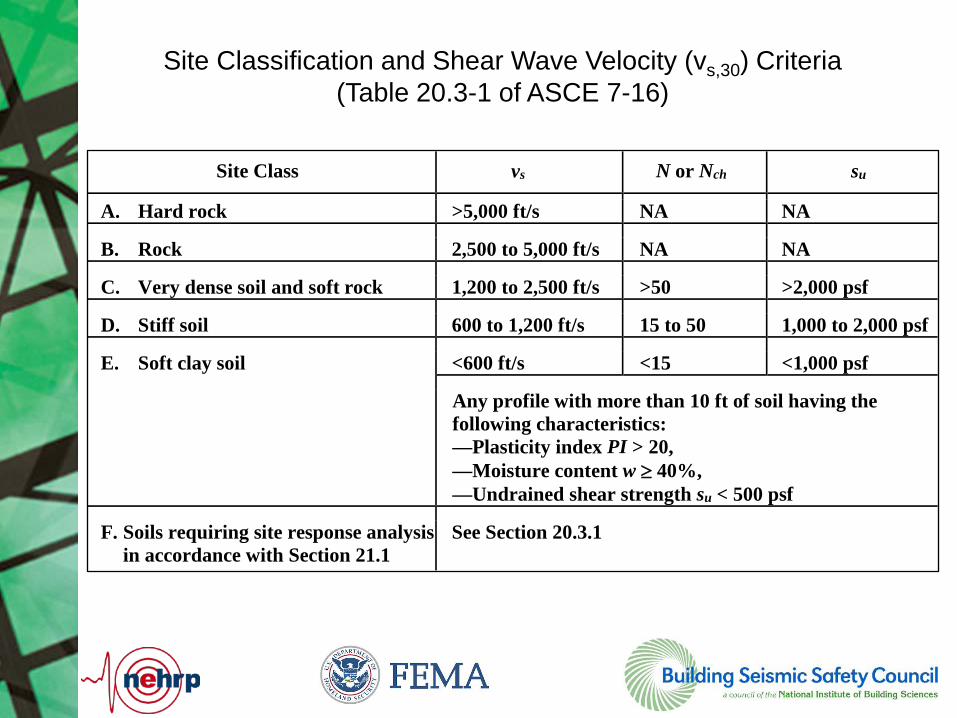
Site Classification and Shear Wave Velocity (vs,30) Criteria (Table 20.3-1 of ASCE 7-16)
Site Class vs N or Nch su
A. Hard rock >5,000 ft/s NA NA
B. Rock 2,500 to 5,000 ft/s NA NA
C. Very dense soil and soft rock 1,200 to 2,500 ft/s >50 >2,000 psf
D. Stiff soil 600 to 1,200 ft/s 15 to 50 1,000 to 2,000 psf
E. Soft clay soil <600 ft/s <15 <1,000 psf
Any profile with more than 10 ft of soil having the following characteristics: —Plasticity index PI > 20, —Moisture content w ≥ 40%, —Undrained shear strength su < 500 psf
F. Soils requiring site response analysis in accordance with Section 21.1
See Section 20.3.1
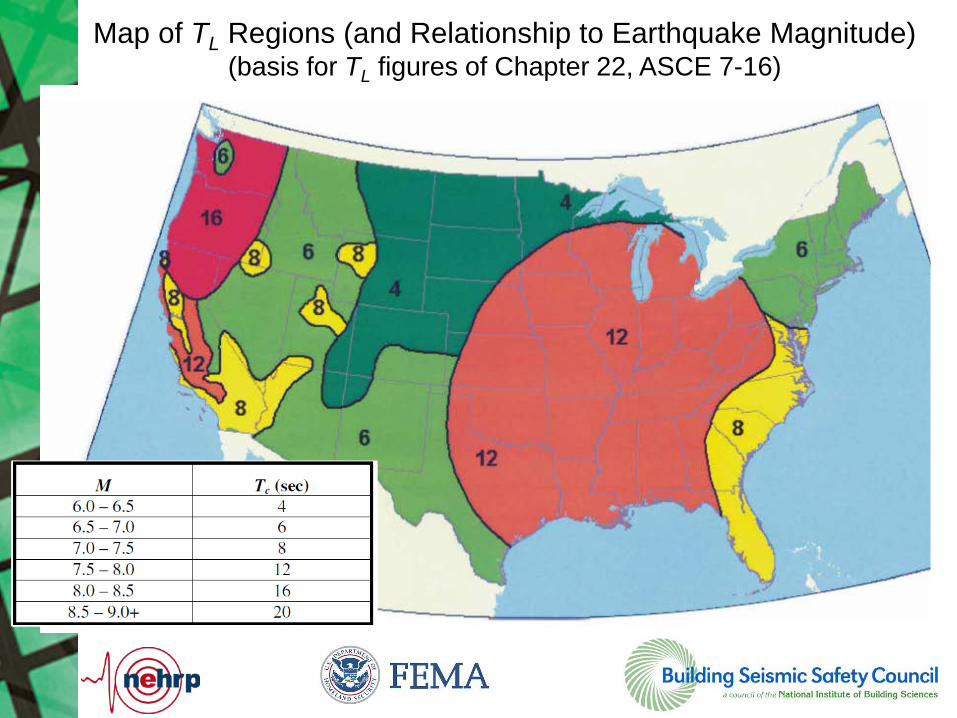
Map of TL Regions (and Relationship to Earthquake Magnitude) (basis for TL figures of Chapter 22, ASCE 7-16)

Earthquake Ground Motion Characterization
• Ground Motion Time Histories – Acceleration (including PGA) – Velocity (including PGV) – Displacement (including (PGD) Time Sh
akin
g
SA
SD
• Elastic Response Spectra – Peak response of a collection of linear
single-degree-of-freedom systems with 5% viscous damping
– “Smooth” spectra used for design (to represent many different possible ground motion time histories)

Example Design Spectra - Deterministic MCER Ground Motions (ASCE 7-16) PEER NGA West2 GMPEs (M7.0 at Rx = 6 km, Site Class boundaries)
0.0
0.5
1.0
1.5
2.0
2.5
0.1 1.0 10.0
Spe
ctra
l Acc
eler
atio
n (g
)
Period (seconds)
Site Class AB - vs,30 = 5,000 fpsSite Class BC - vs,30 = 2,500 fpsSite Class CD - vs,30 = 1,200 fpsSite Class DE - vs,30 = 600 fps

Illustration of the New SDS and SD1 Criteria of Section 21.4 of ASCE 7-16 Site Class DE, M8 at R = 8.5 km (PEER NGA-West1 Relations)
0.0
0.2
0.4
0.6
0.8
1.0
1.2
1.4
1.6
1.8
2.0
0.1 1.0 10.0
Spec
tral A
ccel
erat
ion
(g)
Period (seconds)
MCEr - BC (Vs,30 = 2,500 fps)
MCEr - DE (Vs,30 = 600 fps)
Design DE (Vs,30 = 600 fps)
ELF DE (Vs,30 = 600 fps)
SDS = Max(0.9 x Sa[T ≥ 0.2s])
SD1 = max(T x Sa[1s ≤l T ≤ 5s])
ELF “Design Spectrum” Cs x (R/Ie) = min[SDS, SD1/T]

Root Cause of the “Problem” (discovered by the late in the 2015 NEHRP Provisions update cycle)
• Section 11.4 of ASCE 7-10 (and ASCE 7-16) - Use of only two response periods (0.2s and 1.0s) to define ELF (and MRSA) design forces is not sufficient, in general, to accurately represent response spectral acceleration for all design periods
– Reasonably Accurate (or Conservative) – When peak MCER response spectral acceleration occurs at or near 0.2s and peak MCER response spectral velocity occurs at or near 1.0s for the site of interest (i.e., frequency content matches the shape of the design response spectrum, Figure 11.4-1)
– Potentially Non-conservative – When peak MCER response spectral velocity occurs at periods greater than 1.0s for the site of interest (e.g., soil sites whose seismic hazard is dominated by large magnitude events)

Example ELF “Design Spectrum” based on ASCE 7-16 Criteria M7.0 earthquake ground motions at RX = 6.5 km, Site Class C
0.0
0.2
0.4
0.6
0.8
1.0
1.2
1.4
1.6
1.8
2.0
2.2
2.4
2.6
0.1 1.0 10.0
Res
pons
e Sp
ectra
l Acc
eler
tatio
n (g
)
Period (seconds)
MCEr Multi-Period Response Spectrum - Site Class BCMCEr Multi-Period Response Spectrum - Site Class CDesign Multi-Period Response Spectrum - Site Class CELF Design Spectrum (Cs x R/Ie) - Current ASCE 7-16 Criteria

Example ELF “Design Spectrum” based on ASCE 7-16 Criteria M7.0 earthquake ground motions at RX = 6.5 km, Site Class D
0.0
0.2
0.4
0.6
0.8
1.0
1.2
1.4
1.6
1.8
2.0
2.2
2.4
2.6
0.1 1.0 10.0
Res
pons
e Sp
ectra
l Acc
eler
tatio
n (g
)
Period (seconds)
MCEr Multi-Period Response Spectrum - Site Class BCMCEr Multi-Period Response Spectrum - Site Class DDesign Multi-Period Response Spectrum - Site Class DELF Design Spectrum (Cs x R/Ie) - Current ASCE 7-16 Criteria

Example ELF “Design Spectrum” based on ASCE 7-16 Criteria M7.0 earthquake ground motions at RX = 6.5 km, Site Class E
0.0
0.2
0.4
0.6
0.8
1.0
1.2
1.4
1.6
1.8
2.0
2.2
2.4
2.6
0.1 1.0 10.0
Res
pons
e Sp
ectra
l Acc
eler
tatio
n (g
)
Period (seconds)
MCEr Multi-Period Response Spectrum - Site Class BCMCEr Multi-Period Response Spectrum - Site Class EDesign Multi-Period Response Spectrum - Site Class EELF Design Spectrum (Cs x R/Ie) - Current ASCE 7-16 Criteria

Short-Term Solution Options (considered by the 2010 PUC)
• Option 1 - Re-formulate seismic parameters to eliminate potential non-conservatism in ELF (and MRSA) seismic forces
• Option 2 - Require site-specific analysis when ELF (and MSRA) seismic forces could be potentially non-conservative

Short-Term Solution of ASCE 7-16 (to an identified short-coming in the seismic design procedures of ASCE 7-10)
• BSSC PUC Considered Two Options: – Re-formulate seismic parameters to eliminate potential non-
conservatism in ELF (and MRSA) seismic forces (not adopted) – Require site-specific analysis when ELF (and MRSA) seismic
forces could be potentially non-conservative (adopted)
• FEMA-funded BSSC study performed by Kircher & Associates that developed the technical approach and basis for proposing changes to current seismic criteria – Developed new values of re-formulated parameters (Option 1) – Developed criteria for requiring site-specific analysis (Option 2)
• Developed conservative values of current seismic parameters for design using ELF (and MRSA) methods in lieu of site-specific analysis
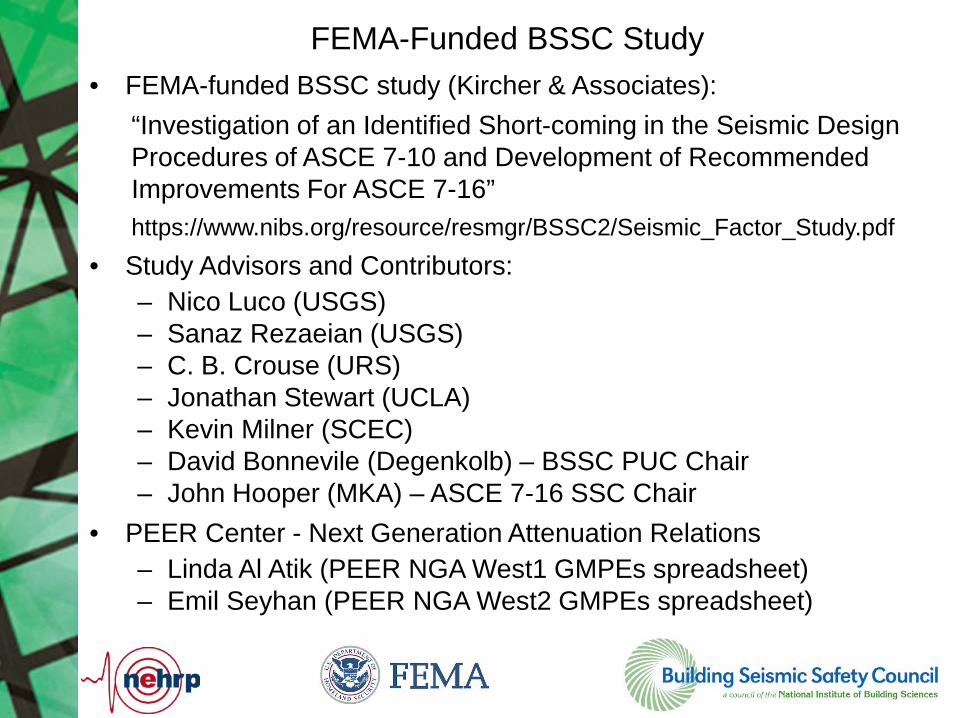
FEMA-Funded BSSC Study • FEMA-funded BSSC study (Kircher & Associates):
“Investigation of an Identified Short-coming in the Seismic Design Procedures of ASCE 7-10 and Development of Recommended Improvements For ASCE 7-16” https://www.nibs.org/resource/resmgr/BSSC2/Seismic_Factor_Study.pdf
• Study Advisors and Contributors: – Nico Luco (USGS) – Sanaz Rezaeian (USGS) – C. B. Crouse (URS) – Jonathan Stewart (UCLA) – Kevin Milner (SCEC) – David Bonnevile (Degenkolb) – BSSC PUC Chair – John Hooper (MKA) – ASCE 7-16 SSC Chair
• PEER Center - Next Generation Attenuation Relations – Linda Al Atik (PEER NGA West1 GMPEs spreadsheet) – Emil Seyhan (PEER NGA West2 GMPEs spreadsheet)

Option 1 - Spectrum Shape Adjustment Reformulation of Design Parameters (Figure 11.4-1 annotated to show proposed Ca and Cv factors of PUC Proposal IT11-006)
Acceleration Domain
Velocity Domain
Displacement Domain TS = SD1/SDS
SD1 = 2/3 x SM1 = 2/3 x Cv x Fv x S1
Cs = SDS/(R/Ie) T ≤ Ts
Cs = SD1/T(R/Ie) Ts < T ≤ TL
SDS = 2/3 x SMS = 2/3 x Ca x Fa x Ss Spectrum Shape Adjustment Factors
Ca = f{Ss, SC} ≥ 0.9 Cv = f{S1, SC, TL} ≥ 1.0

Long-Term Solution (Project 17/ASCE 7-22) • Develop and adopt multi-period design spectrum approach
– Not feasible in the last code update cycle (ASCE 7-16) • Multi-period spectrum approach will require:
– Reworking of seismic design requirements and criteria now based on two response periods
– Development of new ground motion design parameters (by the USGS) for each new response period of interest
– Development of new site factors for each new response period of interest (or site effects embedded directly in ground motion design values maps)
• Challenges: – Non-WUS sites? – Multi-period GMPEs with built-in site
amplification are not available for all U.S. regions – Too Many Maps (Too Many Tables)? – Can ground motion
design parameters be provided electronically (e.g., via the web) without direct inclusion in ASCE 7 or the IBC?

Next-Generation Design Response Spectrum (?) (Figure 11.4-1, ASCE 7-22?)
Acceleration Domain
Velocity Domain
Displacement Domain
SDS = 2/3 x SMS
TS = SD1/SDS
SD1 = 2/3 x SM1
Cs = SDS/(R/Ie) T ≤ Ts
Cs = SD1/T(R/Ie) Ts < T ≤ TL
Hypothetical Basis for Seismic Design Parameters WUS Sites (and possibly CEUS sites): SDS (SMS) and SD1 (SM1) based on site-specific
(multi-period) spectra criteria of Section 21.4 Other Sites (GMPEs w/o built-in site amplification): SMS = 2/3 x Fa x Ss SM1 = 2/3 x Fv x S1

Illustration of the New SDS and SD1 Criteria of Section 21.4 of ASCE 7-16 Site Class DE, M8 at R = 8.5 km (PEER NGA-West1 Relations)
0.0
0.2
0.4
0.6
0.8
1.0
1.2
1.4
1.6
1.8
2.0
0.1 1.0 10.0
Spec
tral A
ccel
erat
ion
(g)
Period (seconds)
MCEr - BC (Vs,30 = 2,500 fps)
MCEr - DE (Vs,30 = 600 fps)
Design DE (Vs,30 = 600 fps)
ELF DE (Vs,30 = 600 fps)
SDS = Max(0.9 x Sa[T ≥ 0.2s])
SD1 = max(T x Sa[1s ≤l T ≤ 5s])
ELF “Design Spectrum” Cs x (R/Ie) = min[SDS, SD1/T]

Project 17 – Multi-Period Spectral Parameters Team
• Team Members: – Charlie Kircher (Chair)
– Nico Luco (USGS)
– Sanaz Rezaeian (USGS)
– C. B. Crouse (URS)
– Jonathan Stewart (UCLA)
– David Bonnevile (Degenkolb) – BSSC PUC Chair
– John Hooper (MKA) – ASCE 7-16 SSC Chair

Project 17 – Multi-Period Spectral Parameters Team
• Issues (regarding incorporation of multi-period spectra): – Update of US National Seismic Hazard Maps (USGS)
• Not our problem
– Create site-specific (or zone-specific) values of seismic design parameters from US National Seismic Hazard Maps (USGS)
• Not our problem
– Update of Section 11.4 parameters and criteria (Team scope)
• Sites with multi-period spectra w/built-in site effects
• Sites with multi-period spectra, but w/o built-in site effects (e.g., need for multi-period site amplification factors)
• Sites without multi-period spectra (i.e., same problem as that now addressed by Section 11.4.7 of ASCE 7-16)

Project 17 – Multi-Period Spectral Parameters Team
• Supporting Studies (required or desired to support incorporation of multi-period spectra): – Site Amplification – Develop new/improved values of multi-
period site factors
• Sites with multi-period spectra, but w/o built-in site effects (e.g., need for multi-period site amplification factors)
– Displacement Domain – Develop new/improved values of TL
• Site-specific values of maximum magnitude (Mmax) (e.g., from site hazard de-aggregation?)
• Site-specific values of TL = f[Mmax ] (e.g., from GMPEs?)
– Other (??)

Project 17 Meeting – Some Ground Motion Issues • Summary of Prior Seismic Design Parameters (Slides 26-365)
– Verify that proposed seismic design parameters are not whacko with respect to current/prior values of these parameters
• Limited Quantity of Large-Magnitude Data (Slides 37-40) – PEER NGA West1 and West2 Databases – Example - Riverside MCER Ground Motions
• Site-Specific MCER Ground Motions Yo-Yo (Slides 41-42) – PEER NGA West1GMPEs and PEER NGA West2 GMPES
• Displacement Domain Criteria (Slides 43-46) – Site-Specific Values of Maximum Magnitude (Mmax) – Determination of TL = f(Mmax) using GMPEs
• Site Coefficients (Slides 47-52) – Consistency of site coefficients and site-amplification derived from
GMPEs w/built-in site amplification? – Additional Site Classes (e.g. at boundaries) and interpolation
between site classes (e.g., as a function of vs,30)
Comparison of Seismic Design Values
• 34 City Sites in the Continental United States – Selection of regions most at risk:
• High seismic regions (Nor Cal, So Cal, PNW) • High population areas of high/moderate/low
seismic regions (Intermountain and CEUS) – Selection of City sites:
• Major city of regional county or metropolitan area • Nearest USGS hazard grid point to center of city
• Average Regional or National values: – Weight seismic design value of associated county or
metropolitan area population • Assume Default Soil Type (Site Class D)

Map showing selected United States city sites (34) used to compare ground motions (WUS faults shown with red lines)

Map showing selected United States city sites (34) and new 1-second MCE ground motions (WUS faults shown with red lines)

Southern California City Sites
Comparison of 1-second design values (SD1) and MCE parameters for Site Class D, return periods and 50-year collapse risk probabilities
Design
S D1 (g) F v S 1UH (g) C R1 S 1D (g)
Los Angeles 0.84 1.50 0.88 0.96 1.01 2,228 1.0%Century City 0.80 1.50 0.84 0.96 1.05 2,240 1.0%Northridge 0.60 1.50 0.69 1.04 0.60 1,558 1.6%Long Beach 0.62 1.50 0.65 0.96 0.98 2,233 1.0%Irvine 0.57 1.50 0.56 1.01 1.24 2,556 1.0%Riverside 0.60 1.50 0.67 1.07 0.60 1,657 1.6%San Bernardino 1.08 1.50 1.43 0.96 1.08 1,155 1.7%San Luis Obispo 0.45 1.57 0.43 0.98 0.60 2,349 1.0%San Diego 0.49 1.52 0.56 0.87 1.05 1,940 1.0%Santa Barbara 0.99 1.50 1.10 0.90 1.17 1,863 1.0%Ventura 0.90 1.50 0.97 0.93 1.27 2,096 1.0%So Cal Average 0.70 1.50 0.77 0.97 0.98 1,993 1.2%
City (Site Location)
MCE (2009 NEHRP Provisions ) Return Period (years)
50-Year Collapse
Prob.

Northern California City Sites
Comparison of 1-second design values (SD1) and MCE parameters for Site Class D, return periods and 50-year collapse risk probabilities
Design
S D1 (g) F v S 1UH (g) C R1 S 1D (g)
Oakland 0.75 1.50 1.07 1.01 0.75 832 2.4%Concord 0.73 1.50 0.99 0.98 0.73 1,054 1.9%Monterey 0.56 1.50 0.59 0.95 0.93 2,189 1.0%Sacramento 0.35 1.81 0.26 1.12 0.60 3,805 1.0%San Francisco 0.64 1.50 0.85 0.99 0.64 1,064 1.9%San Mateo 0.86 1.50 1.06 0.92 0.86 1,441 1.3%San Jose 0.60 1.50 0.72 1.09 0.60 1,262 2.0%Santa Cruz 0.60 1.50 0.64 0.98 0.60 2,012 1.1%Vallejo 0.60 1.50 0.65 1.08 0.60 1,838 1.5%Santa Rosa 1.04 1.50 1.42 0.90 1.04 1,135 1.5%Nor Cal Average 0.65 1.54 0.81 1.02 0.71 1,616 1.7%
City (Site Location)
MCE (2009 NEHRP Provisions ) Return Period (years)
50-Year Collapse
Prob.

Pacific Northwest and Intermountain City Sites
Comparison of 1-second design values (SD1) and MCE parameters for Site Class D, return periods and 50-year collapse risk probabilities
Design
S D1 (g) F v S 1UH (g) C R1 S 1D (g)
Seattle 0.53 1.50 0.56 0.93 1.07 2,056 1.0% Tacoma 0.51 1.51 0.52 0.95 0.60 2,128 1.0% Everett 0.49 1.53 0.52 0.92 1.00 2,012 1.0% Portland 0.44 1.58 0.48 0.87 1.20 1,814 1.0% PNW Average 0.49 1.53 0.52 0.91 1.03 1,984 1.0%
Salt Lake City 0.56 1.50 0.67 0.81 1.55 1,785 1.0% Boise 0.17 2.38 0.11 0.97 0.60 2,292 1.0% Reno 0.52 1.50 0.55 0.95 0.60 2,137 1.0% Las Vegas 0.24 2.14 0.17 0.98 0.63 2,385 1.0%
Intermountain Avg. 0.34 1.93 0.33 0.93 0.87 2,186 1.0%
City (Site Location)
MCE (2009 NEHRP Provisions ) Return Period (years)
50-Year Collapse
Prob.

Central and Eastern United States City Sites
Comparison of 1-second design values (SD1) and MCE parameters for Site Class D, return periods and 50-year collapse risk probabilities
Design
S D1 (g) F v S 1UH (g) C R1 S 1D (g)
St. Louis 0.24 2.13 0.20 0.83 0.60 1,717 1.0%
Memphis 0.40 1.70 0.44 0.80 0.60 1,706 1.0%
Charleston 0.41 1.67 0.45 0.81 0.91 1,865 1.0%
Chicago 0.10 2.40 0.07 0.87 0.60 1,850 1.0%
New York 0.11 2.40 0.08 0.91 0.60 2,129 1.0%
CEUS Average 0.14 2.34 0.11 0.88 0.61 1,992 1.0%
CEUS City (Site Location)
MCE (2009 NEHRP Provisions ) Return Period (years)
50-Year Collapse
Prob.

Comparison of Short-Period Design Ground Motions
Comparison of average values of current (ASCE 7-10) and prior (ASCE 7-05) ground motions, and older Codes for each region and all 34 selected
sites in the continental United States
2.75*Z C a
1994 UBC 1997 UBC 7-98(7-02) 7-05 7-10
Southern CA 1.10 1.25 1.06 1.16 1.22
Northern CA 1.06 1.18 1.01 1.00 1.08
Pacific NW 0.83 0.90 0.90 0.84 0.83
Intermountain 0.68 0.80 0.72 0.70 0.65
CEUS 0.31 0.40 0.39 0.36 0.29
All Regions 0.69 0.80 0.72 0.73 0.72
United States Region
S DS - ASCE 7

Comparison of Short-Period Design Ground Motions
0.0
0.2
0.4
0.6
0.8
1.0
1.2
1.4
1.6
SouthernCA (11)
NorthernCA (10)
Pacific NW(4)
Mountain(4)
CEUS (5) Average -All (34)
Region of United States
S DS,
2.5C
a, or
2.7
5Z (g
)1994 UBC1997 UBC ASCE 7-98 (7-02)ASCE 7-05ASCE 7-10

Comparison of 1-Second Design Ground Motions
Comparison of average values of current (ASCE 7-10) and prior (ASCE 7-05) ground motions, and older Codes for each region and all 34 selected sites
in the continental United States
1.25(1.5)Z C v
1994 UBC 1997 UBC 7-98 (7-02) 7-05 7-10
Southern CA 0.75 0.83 0.63 0.65 0.70
Northern CA 0.73 0.81 0.64 0.61 0.65
Pacific NW 0.56 0.54 0.46 0.44 0.49
Intermountain 0.47 0.46 0.41 0.39 0.34
CEUS 0.21 0.24 0.16 0.14 0.14
All Regions 0.47 0.52 0.39 0.38 0.40
United States Region
S D1 - ASCE 7

Comparison of 1-Second Design Ground Motions
0.0
0.1
0.2
0.3
0.4
0.5
0.6
0.7
0.8
0.9
1.0
SouthernCA (11)
NorthernCA (10)
Pacific NW(4)
Mountain(4)
CEUS (5) Average -All (34)
Region of the United States
S D1,
Cv,
or 1
.25(
1.5)
Z 1994 UBC1997 UBC ASCE 7-98 (7-02)ASCE 7-05ASCE 7-10

PEER NGA-West1 and NGA-West 2 Earthquake Databases (Bozorgnia et al., Earthquake Spectra, Vol. 30, No. 3, August 2014, EERI)
NGA-West1 Database – 3,550 Records (West1 GMPEs used for ASCE 7-10 maps)
NGA-West2 Database – 21,332 Records (West2 GMPEs used for ASCE 7-16 maps)

Example Values Response Spectral Acceleration (PEER NGA-West2 Database)
Response spectral acceleration at four periods for strike-slip faults. All amplitudes adjusted to Vs30 = 760m/s using soil amplification factors of BSSA14 (from Figure 5, “NGA-West2 Equations for Predicting PGA, PGV, and 5% Damped PSA for Shallow Crustal Earthquakes,” Boore et al., Earthquake Spectra, Vol. 30, No. 3 August 2014)

Comparison of Probabilistic and Deterministic MCER Response Spectra - SCEC Riverside Site
0.00
0.25
0.50
0.75
1.00
1.25
1.50
1.75
2.00
2.25
2.50
2.75
3.00
0 0.2 0.4 0.6 0.8 1 1.2 1.4 1.6 1.8 2
Res
pons
e S
pect
ral A
ccel
erat
ion
(g)
Period (seconds)
SCEC Riverside Site Response Spectra - Vs,30 = 1,200 fps (CD) - RotD100
MCE Probabilistic - 2%-50yr Uniform HazardMCEr Probabilistic - 1%-50yr Uniform Collapse RiskMCEr Deterministic - 'Lower-Limit' Ground MotionsMCEr Deterministic - M7.8 84th %ile Ground MotionsMedian M7.8 Earthquake Ground Motions at Rx = 18 km
Likely ground motions due to the next M7.8 earthquake on the San Jacinto Fault
SMS
SM1
Probabilistic MCER ≈ 3 x median response of
an M7.8 earthquake

Comparison of Representative Response Spectra (PEER NGA West2 Database) and MCER Response Spectra - SCEC Riverside Site
0
0.25
0.5
0.75
1
1.25
1.5
1.75
2
2.25
2.5
2.75
3
0 0.2 0.4 0.6 0.8 1 1.2 1.4 1.6 1.8 2
Res
pons
e S
pect
ral A
ccel
erat
ion
(g)
Period (seconds)
Comparison of All (14) Representative Spectra of the PEER NGA West2 Database and SCEC Riverside Site MCE Spectra - Vs,30 = 1,200 fps (CD) RotD100
Geomean of 14 Records - RotD10084th %ile of 14 Records - RotD100MCE Probabilistic - 2%-50yr Uniform HazardMCEr Probabilistic - 1%-50yr Uniform Collapse RiskMCEr Determistic - M7.8 84th % Ground Motions
PEER NGA West2 Database Search Criteria Magnitude Range - M7.5 - M8.5 (avg M7.61)Fault Type - AllDistance Range - 15 km - 20 km (avg 17.9 km)Vs,30 Range - 200 mps - 600 mps (avg 398 mps)

0.0
0.2
0.4
0.6
0.8
1.0
1.2
1.4
1.6
1.8
2.0
2.2
2.4
0.1 1.0 10.0
Spec
tral A
ccel
erat
ion
(g)
Period (seconds)
West1 - vs,30 = 5,000 fpsWest1 - vs,30 = 2,500 fpsWest1 - vs,30 = 1,200 fpsWest1 - vs,30 = 600 fpsWest2 - vs,30 = 5,000 fpsWest2 - vs,30 = 2,500 fpsWest2 - vs,30 = 1,200 fpsWest2 - vs,30 = 600 fps
Example Comparison of Deterministic MCER Ground Motions NGA-West1 and NGA-West2 GMPEs (M7.0 at Rx = 6 km, Site Class boundaries)
PEER NGA GMPE spreadsheet calc’s: West1 based on Al Atik, 2009, West2 based on Seyhan, 2014)
West2 is 45% greater than West1 at 0.5s
(vs,30 = 600 fps)
West2 is 27% greater than West1 at 0.3s (vs,30 = 1,200 fps)

Sacramento Bee Article – June 24, 2007 New data shake quake strategy – Analysis of foreign disasters may allow state to ease strict building codes “Deierlein, deputy director of the Pacific Earthquake Engineering Center at UC Berkeley, is among dozens of consultants, professors and government scientists who toiled to understand implications of data from Taiwan, Turkey and other recent deadly quakes. The result was a set of five “attenuation” equations that can be used to predict how much a given quake, in a given spot, will make different types of ground shudder miles away. For much of California, that means 10 percent to 35 percent less shaking, said Youssef Bozorgnia, associate director of the quake research center at Berkeley. ‘We are so proud of these’ equations, Bozorgnia said, because they could reduce construction costs by hundreds of millions of dollars in much of coastal California, where new or retrofitted buildings would not need to be as robust.”

Map of TL Regions (and Relationship to Earthquake Magnitude) (basis for TL figures of Chapter 22, ASCE 7-16)

Map showing selected Southern California city sites used to compare MCER ground motions (and high slip rate WUS faults)
San Andreas Fault System
San Jacinto Fault System

De-aggregation of 2,475-year mean annual return period seismic hazard at the SCEC Riverside site - 1s response (USGS)
San Jacinto Fault (San Bernardino Segment)
San Andreas Fault (San Bernardino Segment)

0.5s 1s 2s
4s
8s
0.25s
0.1
1.0
0.1 1.0 10.0 100.0
Spe
ctra
l Acc
eler
atio
n (g
)
Spectral Displacement (inches)
Site Class AB - vs,30 = 5,000 fpsSite Class BC - vs,30 = 2,500 fpsSite Class CD - vs,30 = 1,200 fpsSite Class DE - vs,30 = 600 fps
Example Design Spectra - Deterministic MCER Ground Motions (ASCE 7-16) PEER NGA West2 GMPEs (M7.0 at Rx = 6 km, Site Class boundaries)

Example Design Spectra - Deterministic MCER Ground Motions (ASCE 7-16) PEER NGA West2 GMPEs (M7.0 at Rx = 6 km, Site Class boundaries)
0.0
0.5
1.0
1.5
2.0
2.5
0.1 1.0 10.0
Spe
ctra
l Acc
eler
atio
n (g
)
Period (seconds)
Site Class AB - vs,30 = 5,000 fpsSite Class BC - vs,30 = 2,500 fpsSite Class CD - vs,30 = 1,200 fpsSite Class DE - vs,30 = 600 fps

0.0
0.5
1.0
1.5
2.0
2.5
3.0
0.1 1.0
Res
pons
e Sp
ectr
al A
ccel
erat
ion
(g) o
r Site
Am
plifi
catio
n
Response Period (seconds)
Site Class BC (M7.75, Rx = 9.05 km)
Site Class D (M7.75, Rx = 9.05 km)
Site Class D Amplification
Example Calculation of Site Amplification Curve – Site Class D SaM(vs,30 = 870 fps) ÷ SaM(vs,30 = 1,200 fps)
F1.0 = 2.4
F0.2 = 1.05 MCER Spectrum
Site Class BC
MCER Spectrum Site Class D

Comparison of Site Amplification Curves Derived from PEER NGA-West 2 GMPEs and ASCE 7-16 Site Coefficients Site Class D (Default Values of Basin Depth)
0.0
0.5
1.0
1.5
2.0
2.5
3.0
0.1 1
Site
Fac
tor -
Site
Cla
ss D
Response Period (seconds)
Ss = 0.25g/S1 = 0.1gSs = 0.5g/S1 = 0.2gSs = 0.75g/S1 = 0.3gSs = 1.0g/S1 = 0.4gSs = 1.25g/S1 = 0.5gSs = 1.5g/S1 = 0.6gFa - ASCE 7-16Fv - ASCE 7-16

Comparison of Site Amplification Curves Derived from PEER NGA-West 1 GMPEs and ASCE 7-16 Site Coefficients Site Class D (Default Values of Basin Depth)
0.0
0.5
1.0
1.5
2.0
2.5
3.0
0.1 1
Site
Fac
tor -
Site
Cla
ss D
Response Period (seconds)
Ss = 0.25g, S1 = 0.1g
Ss = 0.5g, S1 = 0.2g
Ss = 0.75g, S1 = 0.3g
Ss = 1.0g. S1 = 0.4g
Ss = 1.25g, S1 = 0.5g
Ss = 1.5g, S1 - 0.6g
Fa - ASCE 7-16
Fv - ASCE 7-16

Example Site Amplification Curves of Different Site Classes (PEER NGA West 2 GMPEs, Ss = 0.75g and S1 = 0.3g, default basin depth parameters)
0.0
0.5
1.0
1.5
2.0
2.5
3.0
3.5
4.0
4.5
5.0
5.5
6.0
0.1 1
Site
Fac
tor -
Site
Ss
= 0.
75g/
S1 =
0.3
g
Response Period (seconds)
Site Class BSite Class CSite Class DSite Class E
F3.0 = 5.01
86%
73%
78%
F3.0 = 2.89
F3.0 = 1.60
F3.0 = 0.86

Example Basin Depth Effects (curves of the ratio of site amplification with and without default basin depth)
0.0
0.5
1.0
1.5
2.0
2.5
0.1 1 10
Rat
io o
f Site
Am
plifi
catio
n w
and
w/o
Bas
in E
ffect
s
Response Period (seconds)
Inferred Basin Effects - Site Class BInferred Basin Effects - Site Class CInferred Basin Effects - Site Class DInferred Basin Effects - Site Class E


Comparison of Seismic Design Values • 34 City Sites in the Continental United States
– Selection of regions most at risk: • High seismic regions (Nor Cal, So Cal, PNW) • High population areas of high/moderate/low
seismic regions (Intermountain and CEUS) – Selection of City sites:
• Major city of regional county or metropolitan area • Nearest USGS hazard grid point to center of city
• Average Regional or National values: – Weight seismic design value of associated county or
metropolitan area population • Assume Default Soil Type (Site Class D)

Map showing selected United States city sites (34) used to compare ground motions (WUS faults shown with red lines)

Map showing selected United States city sites (34) and new 1-second MCE ground motions (WUS faults shown with red lines)

Map showing selected Pacific Northwest city sites (4) used to evaluate proposed ground motions (WUS faults shown with red lines)

Pacific Northwest and Intermountain City Sites
Location and associated county population data
Name Latitude Longitude Name Population
Seattle 47.60 -122.30 King WA 1,826,732Tacoma 47.25 -122.45 Pierce WA 766,878Everett 48.00 -122.20 Snohomish WA 669,887Portland 45.50 -122.65 Portland Metro OR (3) 1,523,690
10,096,556 Total Pop - 6 Counties 4,787,187Salt Lake City 40.75 -111.90 Salt Lake UT 978,701Boise 43.60 -116.20 Ada/Canyon ID (2) 532,337Reno 39.55 -119.80 Washoe NV 396,428Las Vegas 36.20 -115.15 Clarke NV 1,777,539
6,512,057 Total Pop - 5 Counties 3,685,005
City and Location of Site County or Metropolitan Area
Total Pop - ID/UT/NV
Total Pop - OR and WA

Map showing Seattle City Site and Seattle Fault Zone
Seattle City Site
Seattle Fault Zone

Pacific Northwest and Intermountain City Sites
Comparison of 1-second design values (SD1) and MCE parameters for Site Class D, return periods and 50-year collapse risk probabilities
Design
S D1 (g) F v S 1UH (g) C R1 S 1D (g)
Seattle 0.53 1.50 0.56 0.93 1.07 2,056 1.0% Tacoma 0.51 1.51 0.52 0.95 0.60 2,128 1.0% Everett 0.49 1.53 0.52 0.92 1.00 2,012 1.0% Portland 0.44 1.58 0.48 0.87 1.20 1,814 1.0% PNW Average 0.49 1.53 0.52 0.91 1.03 1,984 1.0%
Salt Lake City 0.56 1.50 0.67 0.81 1.55 1,785 1.0% Boise 0.17 2.38 0.11 0.97 0.60 2,292 1.0% Reno 0.52 1.50 0.55 0.95 0.60 2,137 1.0% Las Vegas 0.24 2.14 0.17 0.98 0.63 2,385 1.0%
Intermountain Avg. 0.34 1.93 0.33 0.93 0.87 2,186 1.0%
City (Site Location)
MCE (2009 NEHRP Provisions ) Return Period (years)
50-Year Collapse
Prob.

Pacific Northwest and Intermountain City Sites
Comparison of 1-second design ground motions (SD1) with prior (ASCE 7-05) values and older Code Values (Site Class D)
1.25(1.5)Z C v
1994 UBC 1997 UBC ASCE 7-98 ASCE 7-05 ASCE 7-10 Seattle 0.56 0.54 0.56 0.49 0.53 Tacoma 0.56 0.54 0.43 0.44 0.51 Everett 0.56 0.54 0.42 0.43 0.49 Portland 0.56 0.54 0.39 0.39 0.44 PNW Average 0.56 0.54 0.46 0.44 0.49 Salt Lake City 0.56 0.54 0.76 0.70 0.56 Boise 0.38 0.40 0.17 0.17 0.17 Reno 0.75 0.64 0.49 0.59 0.52 Las Vegas 0.38 0.40 0.26 0.25 0.24
Intermountain Avg 0.47 0.46 0.41 0.39 0.34
City (Site Location)
S D1 - ASCE 7

Pacific Northwest and Intermountain City Sites
Comparison of short-period design ground motions (SDS) with prior (ASCE 7-05) values and older Code values (Site Class D)
2.75*Z C a
1994 UBC 1997 UBC ASCE 7-98 ASCE 7-05 ASCE 7-10 Seattle 0.83 0.90 1.08 0.97 0.91 Tacoma 0.83 0.90 0.83 0.82 0.86 Everett 0.83 0.90 0.82 0.80 0.85 Portland 0.83 0.90 0.75 0.73 0.72 PNW Average 0.83 0.90 0.90 0.84 0.83 Salt Lake City 0.83 0.90 1.17 1.15 1.03 Boise 0.55 0.70 0.36 0.32 0.32 Reno 1.10 1.10 0.92 1.00 1.00 Las Vegas 0.55 0.70 0.55 0.51 0.46
Intermountain Avg 0.68 0.80 0.72 0.70 0.65
S DS - ASCE 7 City (Site Location)

Map showing selected Northern California city sites (10) used to compare ground motions (WUS faults shown with red lines)

Northern California City Sites Location and associated county population data
Name Latitude Longitude Name Population
Oakland 37.80 -122.25 Alameda 1,502,759Concord 37.95 -122.00 Contra Costa 955,810Monterey 36.60 -121.90 Monterey 421,333Sacramento 38.60 -121.50 Sacramento 1,233,449San Francisco 37.75 -122.40 San Francisco 776,733San Mateo 37.55 -122.30 San Mateo 741,444San Jose 37.35 -121.90 Santa Clara 1,802,328Santa Cruz 36.95 -122.05 Santa Cruz 275,359Vallejo 38.10 -122.25 Solano 423,473Santa Rosa 38.45 -122.70 Sonoma 489,290
14,108,451 Total Pop - 10 Counties 8,621,978Total Pop - N. California

Map showing Oakland City Site and Hayward Fault
Oakland City Site

Northern California City Sites
Comparison of 1-second design values (SD1) and MCE parameters for Site Class D, return periods and 50-year collapse risk probabilities
Design
S D1 (g) F v S 1UH (g) C R1 S 1D (g)
Oakland 0.75 1.50 1.07 1.01 0.75 832 2.4%Concord 0.73 1.50 0.99 0.98 0.73 1,054 1.9%Monterey 0.56 1.50 0.59 0.95 0.93 2,189 1.0%Sacramento 0.35 1.81 0.26 1.12 0.60 3,805 1.0%San Francisco 0.64 1.50 0.85 0.99 0.64 1,064 1.9%San Mateo 0.86 1.50 1.06 0.92 0.86 1,441 1.3%San Jose 0.60 1.50 0.72 1.09 0.60 1,262 2.0%Santa Cruz 0.60 1.50 0.64 0.98 0.60 2,012 1.1%Vallejo 0.60 1.50 0.65 1.08 0.60 1,838 1.5%Santa Rosa 1.04 1.50 1.42 0.90 1.04 1,135 1.5%Nor Cal Average 0.65 1.54 0.81 1.02 0.71 1,616 1.7%
City (Site Location)
MCE (2009 NEHRP Provisions ) Return Period (years)
50-Year Collapse
Prob.

Northern California City Sites
Comparison of 1-second design ground motions (SD1) with prior (ASCE 7-05) values and older Code Values (Site Class D)
1.25(1.5)Z Cv
1994 UBC 1997 UBC ASCE 7-98 ASCE 7-05 ASCE 7-10Oakland 0.75 1.04 0.64 0.60 0.75Concord 0.75 0.77 0.74 0.65 0.73Monterey 0.75 0.77 0.67 0.61 0.56Sacramento 0.56 0.54 0.28 0.31 0.35San Francisco 0.75 0.74 0.70 0.68 0.64San Mateo 0.75 0.95 0.99 0.90 0.86San Jose 0.75 0.69 0.60 0.60 0.60Santa Cruz 0.75 0.72 0.61 0.60 0.60Vallejo 0.75 0.87 0.60 0.60 0.60Santa Rosa 0.75 1.28 0.86 0.83 1.04NoCal Average 0.73 0.81 0.64 0.61 0.65
City (Site Location)
SD1 - ASCE 7

Northern California City Sites
Comparison of short-period design ground motions (SDS) with prior (ASCE 7-05) values and older Code values (Site Class D)
2.75*Z Ca
1994 UBC 1997 UBC ASCE 7-98 ASCE 7-05 ASCE 7-10Oakland 1.10 1.43 1.08 1.06 1.24Concord 1.10 1.10 1.26 1.23 1.38Monterey 1.10 1.10 1.15 0.97 1.02Sacramento 0.83 0.90 0.51 0.52 0.57San Francisco 1.10 1.10 1.00 1.00 1.00San Mateo 1.10 1.28 1.11 1.17 1.23San Jose 1.10 1.10 1.00 1.00 1.00Santa Cruz 1.10 1.10 1.04 1.00 1.01Vallejo 1.10 1.19 1.00 1.00 1.00Santa Rosa 1.10 1.65 1.37 1.37 1.67NoCal Average 1.06 1.18 1.01 1.00 1.08
SDS - ASCE 7City (Site Location)

Map showing selected Intermountain city sites (4) used to compare ground motions (WUS faults shown with red lines)
Boise City Site
Salt Lake City Site
Las Vegas City Site
Reno City Site

Pacific Northwest and Intermountain City Sites
Location and associated county population data
Name Latitude Longitude Name Population
Seattle 47.60 -122.30 King WA 1,826,732Tacoma 47.25 -122.45 Pierce WA 766,878Everett 48.00 -122.20 Snohomish WA 669,887Portland 45.50 -122.65 Portland Metro OR (3) 1,523,690
10,096,556 Total Pop - 6 Counties 4,787,187Salt Lake City 40.75 -111.90 Salt Lake UT 978,701Boise 43.60 -116.20 Ada/Canyon ID (2) 532,337Reno 39.55 -119.80 Washoe NV 396,428Las Vegas 36.20 -115.15 Clarke NV 1,777,539
6,512,057 Total Pop - 5 Counties 3,685,005
City and Location of Site County or Metropolitan Area
Total Pop - ID/UT/NV
Total Pop - OR and WA
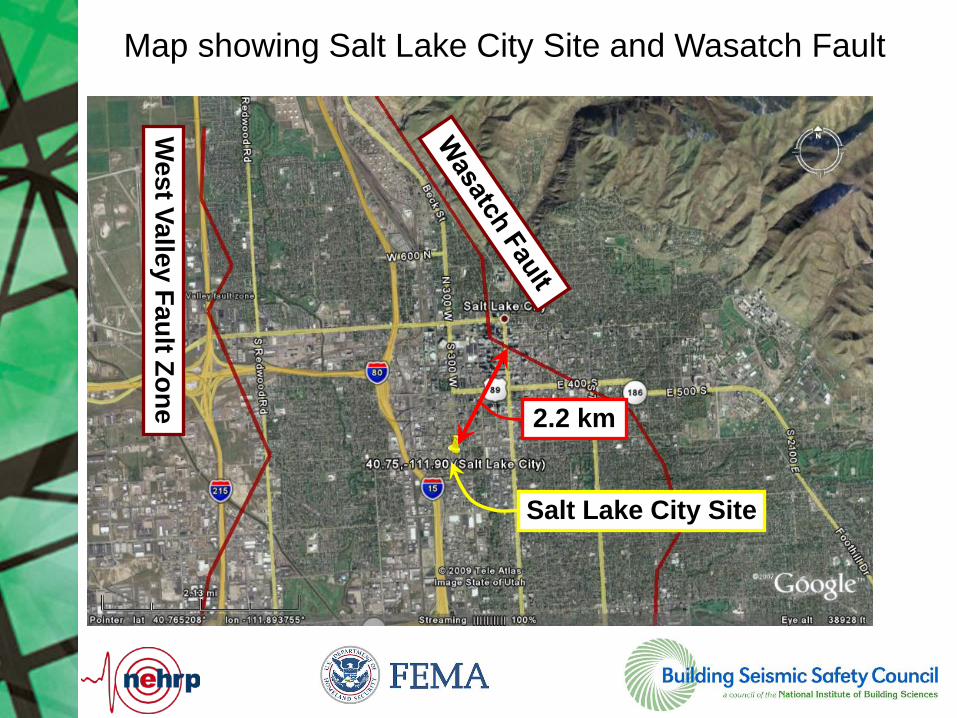
Map showing Salt Lake City Site and Wasatch Fault
Salt Lake City Site
West Valley Fault Zone 2.2 km

Pacific Northwest and Intermountain City Sites
Comparison of 1-second design values (SD1) and MCE parameters for Site Class D, return periods and 50-year collapse risk probabilities
Design
S D1 (g) F v S 1UH (g) C R1 S 1D (g)
Seattle 0.53 1.50 0.56 0.93 1.07 2,056 1.0% Tacoma 0.51 1.51 0.52 0.95 0.60 2,128 1.0% Everett 0.49 1.53 0.52 0.92 1.00 2,012 1.0% Portland 0.44 1.58 0.48 0.87 1.20 1,814 1.0% PNW Average 0.49 1.53 0.52 0.91 1.03 1,984 1.0%
Salt Lake City 0.56 1.50 0.67 0.81 1.55 1,785 1.0% Boise 0.17 2.38 0.11 0.97 0.60 2,292 1.0% Reno 0.52 1.50 0.55 0.95 0.60 2,137 1.0% Las Vegas 0.24 2.14 0.17 0.98 0.63 2,385 1.0%
Intermountain Avg. 0.34 1.93 0.33 0.93 0.87 2,186 1.0%
City (Site Location)
MCE (2009 NEHRP Provisions ) Return Period (years)
50-Year Collapse
Prob.

Pacific Northwest and Intermountain City Sites
Comparison of 1-second design ground motions (SD1) with prior (ASCE 7-05) values and older Code Values (Site Class D)
1.25(1.5)Z C v
1994 UBC 1997 UBC ASCE 7-98 ASCE 7-05 ASCE 7-10 Seattle 0.56 0.54 0.56 0.49 0.53 Tacoma 0.56 0.54 0.43 0.44 0.51 Everett 0.56 0.54 0.42 0.43 0.49 Portland 0.56 0.54 0.39 0.39 0.44 PNW Average 0.56 0.54 0.46 0.44 0.49 Salt Lake City 0.56 0.54 0.76 0.70 0.56 Boise 0.38 0.40 0.17 0.17 0.17 Reno 0.75 0.64 0.49 0.59 0.52 Las Vegas 0.38 0.40 0.26 0.25 0.24
Intermountain Avg 0.47 0.46 0.41 0.39 0.34
City (Site Location)
S D1 - ASCE 7

Pacific Northwest and Intermountain City Sites
Comparison of short-period design ground motions (SDS) with prior (ASCE 7-05) values and older Code values (Site Class D)
2.75*Z C a
1994 UBC 1997 UBC ASCE 7-98 ASCE 7-05 ASCE 7-10 Seattle 0.83 0.90 1.08 0.97 0.91 Tacoma 0.83 0.90 0.83 0.82 0.86 Everett 0.83 0.90 0.82 0.80 0.85 Portland 0.83 0.90 0.75 0.73 0.72 PNW Average 0.83 0.90 0.90 0.84 0.83 Salt Lake City 0.83 0.90 1.17 1.15 1.03 Boise 0.55 0.70 0.36 0.32 0.32 Reno 1.10 1.10 0.92 1.00 1.00 Las Vegas 0.55 0.70 0.55 0.51 0.46
Intermountain Avg 0.68 0.80 0.72 0.70 0.65
S DS - ASCE 7 City (Site Location)

Map showing selected Southern California city sites (11) used to evaluate proposed ground motions (WUS faults shown with red lines)

Southern California City Sites
Location and associated county population data
Name Latitude Longitude Name Population
Los Angeles 34.05 -118.25Century City 34.05 -118.40Northridge 34.20 -118.55Long Beach 33.80 -118.20Irvine 33.65 -117.80 Orange 3,002,048Riverside 33.95 -117.40 Riverside 2,026,803San Bernardino 34.10 -117.30 San Bernardino 1,999,332San Luis Obispo 35.30 -120.65 San Luis Obispo 257,005San Diego 32.70 -117.15 San Diego 2,941,454Santa Barbara 34.45 -119.70 Santa Barbara 400,335Ventura 34.30 -119.30 Ventura 799,720
22,349,098 Total Pop. - 8 Counties 21,374,778Total Pop. - S. California
City and Location of Site County
9,948,081Los Angeles

Map showing Los Angeles City Site and Nearby Faults
< 2 Km
Los Angeles City Site
Century City Site

Southern California City Sites
Comparison of 1-second design values (SD1) and MCE parameters for Site Class D, return periods and 50-year collapse risk probabilities
Design
S D1 (g) F v S 1UH (g) C R1 S 1D (g)
Los Angeles 0.84 1.50 0.88 0.96 1.01 2,228 1.0%Century City 0.80 1.50 0.84 0.96 1.05 2,240 1.0%Northridge 0.60 1.50 0.69 1.04 0.60 1,558 1.6%Long Beach 0.62 1.50 0.65 0.96 0.98 2,233 1.0%Irvine 0.57 1.50 0.56 1.01 1.24 2,556 1.0%Riverside 0.60 1.50 0.67 1.07 0.60 1,657 1.6%San Bernardino 1.08 1.50 1.43 0.96 1.08 1,155 1.7%San Luis Obispo 0.45 1.57 0.43 0.98 0.60 2,349 1.0%San Diego 0.49 1.52 0.56 0.87 1.05 1,940 1.0%Santa Barbara 0.99 1.50 1.10 0.90 1.17 1,863 1.0%Ventura 0.90 1.50 0.97 0.93 1.27 2,096 1.0%So Cal Average 0.70 1.50 0.77 0.97 0.98 1,993 1.2%
City (Site Location)
MCE (2009 NEHRP Provisions ) Return Period (years)
50-Year Collapse
Prob.

Southern California City Sites
Comparison of 1-second design ground motions (SD1) with prior (ASCE 7-05) values and older Code Values (Site Class D)
1.25(1.5)Z Cv
1994 UBC 1997 UBC ASCE 7-98 ASCE 7-05 ASCE 7-10Los Angeles 0.75 0.72 0.60 0.72 0.84Century City 0.75 0.93 0.62 0.72 0.80Northridge 0.75 0.64 0.65 0.61 0.60Long Beach 0.75 1.02 0.75 0.70 0.62Irvine 0.75 0.64 0.48 0.53 0.57Riverside 0.75 0.64 0.60 0.60 0.60San Bernardino 0.75 0.93 0.60 0.62 1.08San Luis Obispo 0.75 0.77 0.49 0.48 0.45San Diego 0.75 1.02 0.67 0.64 0.49Santa Barbara 0.75 1.02 0.78 0.81 0.99Ventura 0.75 1.02 0.82 0.86 0.90SoCal Average 0.75 0.83 0.63 0.65 0.70
SD1 - ASCE 7City (Site Location)

Southern California City Sites
Comparison of short-period design ground motions (SDS) with prior (ASCE 7-05) values and older Code values (Site Class D)
2.75*Z Ca
1994 UBC 1997 UBC ASCE 7-98 ASCE 7-05 ASCE 7-10Los Angeles 1.10 1.10 1.00 1.44 1.60Century City 1.10 1.32 1.13 1.22 1.44Northridge 1.10 1.10 1.00 1.09 1.13Long Beach 1.10 1.43 1.31 1.20 1.10Irvine 1.10 1.10 0.84 1.00 1.03Riverside 1.10 1.10 1.00 1.00 1.00San Bernardino 1.10 1.32 1.08 1.13 1.58San Luis Obispo 1.10 1.10 0.85 0.83 0.78San Diego 1.10 1.43 1.01 1.07 0.84Santa Barbara 1.10 1.43 1.58 1.38 1.89Ventura 1.10 1.43 1.45 1.64 1.59SoCal Average 1.10 1.25 1.06 1.16 1.22
SDS - ASCE 7City (Site Location)

Map showing selected Central and Eastern United states (CEUS) city sites (5) used to compare ground motions
St. Louis City Site
New York City Site
Charleston City Site
Chicago City Site
Memphis City Site

Central and Eastern United States city sites
Location and associated county population data (and total population for all United States counties)
Name Latitude Longitude Name Population
St. Louis 38.60 -90.20 St. Louis MSA (16) 2,786,728
Memphis 35.15 -90.05 Memphis MSA (8) 1,269,108
Charleston 32.80 -79.95 Charleston MSA (3) 603,178
Chicago 41.85 -87.65 Chicago MSA (7) 9,505,748
New York 40.75 -74.00 New York MSA (23) 18,747,320
48,340,918 Total Pop - 57 Counties 32,912,082
101,407,080 Total County Population All Regions 71,381,030
Metropolitan Statistical Area
Total State Population All Regions
Total Pop - MO/TN/SC/IL/NY
City and Location of Site

Central and Eastern United States City Sites
Comparison of 1-second design values (SD1) and MCE parameters for Site Class D, return periods and 50-year collapse risk probabilities
Design
S D1 (g) F v S 1UH (g) C R1 S 1D (g)
St. Louis 0.24 2.13 0.20 0.83 0.60 1,717 1.0%
Memphis 0.40 1.70 0.44 0.80 0.60 1,706 1.0%
Charleston 0.41 1.67 0.45 0.81 0.91 1,865 1.0%
Chicago 0.10 2.40 0.07 0.87 0.60 1,850 1.0%
New York 0.11 2.40 0.08 0.91 0.60 2,129 1.0%
CEUS Average 0.14 2.34 0.11 0.88 0.61 1,992 1.0%
CEUS City (Site Location)
MCE (2009 NEHRP Provisions ) Return Period (years)
50-Year Collapse
Prob.

Central and Eastern United States City Sites
Comparison of 1-second design ground motions (SD1) with prior (ASCE 7-05) values and older Code Values (Site Class D)
1.25(1.5)Z Cv
1994 UBC 1997 UBC ASCE 7-98 ASCE 7-05 ASCE 7-10
St. Louis 0.28 0.32 0.26 0.24 0.24
Memphis 0.56 0.54 0.44 0.42 0.40
Charleston 0.28 0.32 0.44 0.41 0.41
Chicago 0.00 0.00 0.10 0.10 0.10
New York 0.28 0.32 0.15 0.11 0.11
CEUS Average 0.21 0.24 0.16 0.14 0.14
City (Site Location)
SD1 - ASCE 7

Central and Eastern United States City Sites
Comparison of short-period design ground motions (SDS) with prior (ASCE 7-05) values and older Code Values (Site Class D)
2.75*Z Ca
1994 UBC 1997 UBC ASCE 7-98 ASCE 7-05 ASCE 7-10
St. Louis 0.41 0.55 0.53 0.52 0.42
Memphis 0.83 0.90 0.92 0.93 0.74
Charleston 0.41 0.55 0.95 1.01 0.80
Chicago 0.00 0.00 0.20 0.18 0.14
New York 0.41 0.55 0.41 0.37 0.29
CEUS Average 0.31 0.40 0.39 0.36 0.29
City (Site Location)
SDS - ASCE 7

Comparison of Short-Period Design Ground Motions
Comparison of average values of current (ASCE 7-10) and prior (ASCE 7-05) ground motions, and older Codes for each region and all 34 selected
sites in the continental United States
2.75*Z C a
1994 UBC 1997 UBC 7-98(7-02) 7-05 7-10
Southern CA 1.10 1.25 1.06 1.16 1.22
Northern CA 1.06 1.18 1.01 1.00 1.08
Pacific NW 0.83 0.90 0.90 0.84 0.83
Intermountain 0.68 0.80 0.72 0.70 0.65
CEUS 0.31 0.40 0.39 0.36 0.29
All Regions 0.69 0.80 0.72 0.73 0.72
United States Region
S DS - ASCE 7

Comparison of Short-Period Design Ground Motions
0.0
0.2
0.4
0.6
0.8
1.0
1.2
1.4
1.6
SouthernCA (11)
NorthernCA (10)
Pacific NW(4)
Mountain(4)
CEUS (5) Average -All (34)
Region of United States
S DS,
2.5C
a, or
2.7
5Z (g
)1994 UBC1997 UBC ASCE 7-98 (7-02)ASCE 7-05ASCE 7-10

Comparison of 1-Second Design Ground Motions
Comparison of average values of current (ASCE 7-10) and prior (ASCE 7-05) ground motions, and older Codes for each region and all 34 selected sites
in the continental United States
1.25(1.5)Z C v
1994 UBC 1997 UBC 7-98 (7-02) 7-05 7-10
Southern CA 0.75 0.83 0.63 0.65 0.70
Northern CA 0.73 0.81 0.64 0.61 0.65
Pacific NW 0.56 0.54 0.46 0.44 0.49
Intermountain 0.47 0.46 0.41 0.39 0.34
CEUS 0.21 0.24 0.16 0.14 0.14
All Regions 0.47 0.52 0.39 0.38 0.40
United States Region
S D1 - ASCE 7

Comparison of 1-Second Design Ground Motions
0.0
0.1
0.2
0.3
0.4
0.5
0.6
0.7
0.8
0.9
1.0
SouthernCA (11)
NorthernCA (10)
Pacific NW(4)
Mountain(4)
CEUS (5) Average -All (34)
Region of the United States
S D1,
Cv,
or 1
.25(
1.5)
Z 1994 UBC1997 UBC ASCE 7-98 (7-02)ASCE 7-05ASCE 7-10