multi-response optimization of edm drilling parameters of
TRANSCRIPT

The Journal of Engineering and Exact Sciences – jCEC, Vol. 07 N. 04 (2021) journal homepage: https://periodicos.ufv.br/ojs/jcec
ISSN: 2527-1075
1
Multi-response optimization of EDM drilling parameters of the Nitinol SMA
Otimização de múltiplas respostas de parâmetros de perfuração EDM do
Nitinol SMA
Article Info:
Article history: Received 2021-07-20 / Accepted 2021-08-16/ Available online 2021-08-16
doi: 10.18540/jcecvl7iss4pp13007-01-17e
Amiya Kumar Sahoo
ORCID: https://orcid.org/0000-0001-6572-4438
Jaypee University of Engineering and Technology, India
E-mail: [email protected]
Praneet Pandey
ORCID: https://orcid.org/0000-0003-1070-1727
Jaypee University of Engineering and Technology, India
E-mail: [email protected]
Dhananjay R Mishra
ORCID: https://orcid.org/0000-0002-5107-0012
Jaypee University of Engineering and Technology, India
E-mail: [email protected]
Resumo
A demanda por Nitinol (SMA) está aumentando rapidamente para várias aplicações. Com o objetivo
de otimizar os parâmetros de controle de EDM, 46 experimentos foram concluídos em seis corpos
de prova de 6,156 mm de espessura usando a máquina de perfuração EDM Sparkonix. Corrente (I),
tensão (V), tempo de carga (TON), tempo de descarga (TOFF) e pressão dielétrica (DP) foram tomados
como parâmetros de controle de entrada. A otimização de índice único da taxa de remoção de
material (MRR), taxa de desgaste da ferramenta (TWR) e grau de rosqueamento (DoT) são
avaliados usando o grau relacional cinza (GRG). Contribuições de parâmetros de controle
individuais são avaliadas usando Taguchi e ANOVA. Os parâmetros de controle de entrada ótimos
obtidos foram usados para o experimento de confirmação, e o resultado obtido dá uma boa
concordância com ele. V e TON são encontrados como os parâmetros mais significativos. Os valores
máximo e mínimo de MRR, TWR e DoT foram registrados como 0,0277 e 0,0074 g / min, 0,0177
e 0,0033 g / min e 0,032 e 0,01 radianos, respectivamente. MRR, TWR e DoT melhoraram em 49,1,
4,5 e 43,3%, respectivamente.
Palavras-chave: EDM. Nitinol. Eletrodo tubular rotativo de cobre. GRA. Taguchi.
Abstract
The demand for Nitinol (SMA) is increasing rapidly for various applications. With the aim of
optimum control parameters of EDM, 46 experiments completed on six specimens of 6.156 mm
thickness using Sparkonix EDM drill machine. Current (I), voltage (V), charging-time (TON),
discharging-time (TOFF), and dielectric pressure (DP) were taken as input control parameters. Single-
indexed optimization of material removal rate (MRR), tool-wear rate (TWR), and degree of
tapperness (DoT) are evaluated using gray relational grade (GRG). Individual control-parameter
contributions are evaluated using Taguchi and ANOVA. The obtained optimal input control
parameters were used for the confirmation experiment, and the obtained result gives good agreement
to it. V and TON are found as the most significant parameters. Maximum and minimum values of
MRR, TWR, and DoT have been recorded as 0.0277 & 0.0074 g/min, 0.0177 & 0.0033 g/min, and
0.032 & 0.01 radians respectively. MRR, TWR, and DoT improved by 49.1, 4.5, and 43.3 %,
respectively.
Keywords: EDM. Nitinol. Copper rotary tubular electrode. GRA. Taguchi.

The Journal of Engineering and Exact Sciences – jCEC
2
Nomenclature
DP dielectric pressure (kg/cm2)
I discharge current (A)
TON pulse on time (μs)
TOFF pulse off time (μs)
V gap voltage (V)
ANOVA analysis of variance
DoT degree of tapperness (rad)
EDM electric discharge machining
GRA gray relational analysis
GRG gray relational grade
MRR material removal rate (g/min)
SNR signal to noise ratio (db)
TWR tool wear rate (g/min)
1. Introduction
The EDM machining process has become famous and vital due to its numerous applications
in different industries (viz. aerospace, automotive, power plant) and its ability to produce precise,
axisymmetry and arbitrary shapes electrically conductive materials. As EDM has high initial and
operating costs, it needs to be operated on the parameters that give the desired unique quality at
minimum manufacturing time and cost for shortening payback.
Productivity and quality will get affected due to the selection of inappropriate control
parameters; hence, the choice of optimal control parameters is one of the significant concerns for
the manufacturing industry. The selection of optimum control parameters depends on the machine
and material. The most crucial process control parameters that affect the EDM drilling process
largely are dielectric pressure, gap voltage, discharge current, and type of electrode. Many
researchers have reported optimising electrode wear rate, material removal rate, hole circularity,
and taper angle for different materials on EDM (P. Sharma et al., 2014; Shin et al., 2019). Process
selection and evaluation of non-traditional machining using the generation of the standard through-
hole in glass and deep through cavities in titanium with the integration of roughness number by
using multi-attribute border approximation area comparison method for seventeen different
machines has been reported by Chakraborty et al. (2019).
Effect on mechanical properties of Nitinol (medical grade) and characterization (arcing
phenomena) in micro-EDM has been reported by Mwangi et al. (2020). They have reported that the
three peak-transformation behaviour arcing phenomena will play a vital role, and thermal damage
caused by arcing enhances residual strain, minimizes elongation to failure, machining accuracy, and
lower and upper plateau stresses. Liu et al. (2018) conducted wire-EDM on Nitinol SMA and found
that a thin white layer with less residual tensile stress slows down the crack formation and
propagation, enhancing fatigue life. K. E. Ch. Vidyasagar et al. (2020) reported improvement of
corrosion resistance of Nitinol in the presence of simulated body fluid by depositing titanium oxides
on its surface. Nguyen HuuPhan et al. (2020) reported an evenly distributed white layer using
titanium power with the dielectric fluid and copper electrode as the electrode's electrical and thermal
conductivity, and the powder affects the surface quality.
Himadri Majumder and Kalipada Maity (2018) optimized process parameters of WEDM of
Nitinol for surface roughness and micro-hardness by using general regression neural network and
fuzzy logic. Shape memory behaviour of Nitinol is a thermo-mechanical phase transformation
between the martensitic and austenitic phases. In micro-EDM, the high energy dissipated for
material removal can significantly change the SMA phase transformation behaviour to reduce
thermal hysteresis (Mwangi et al., 2018). Kannan et al. (2018) compared different post-heat
The Journal of Engineering and Exact Sciences – jCEC
3
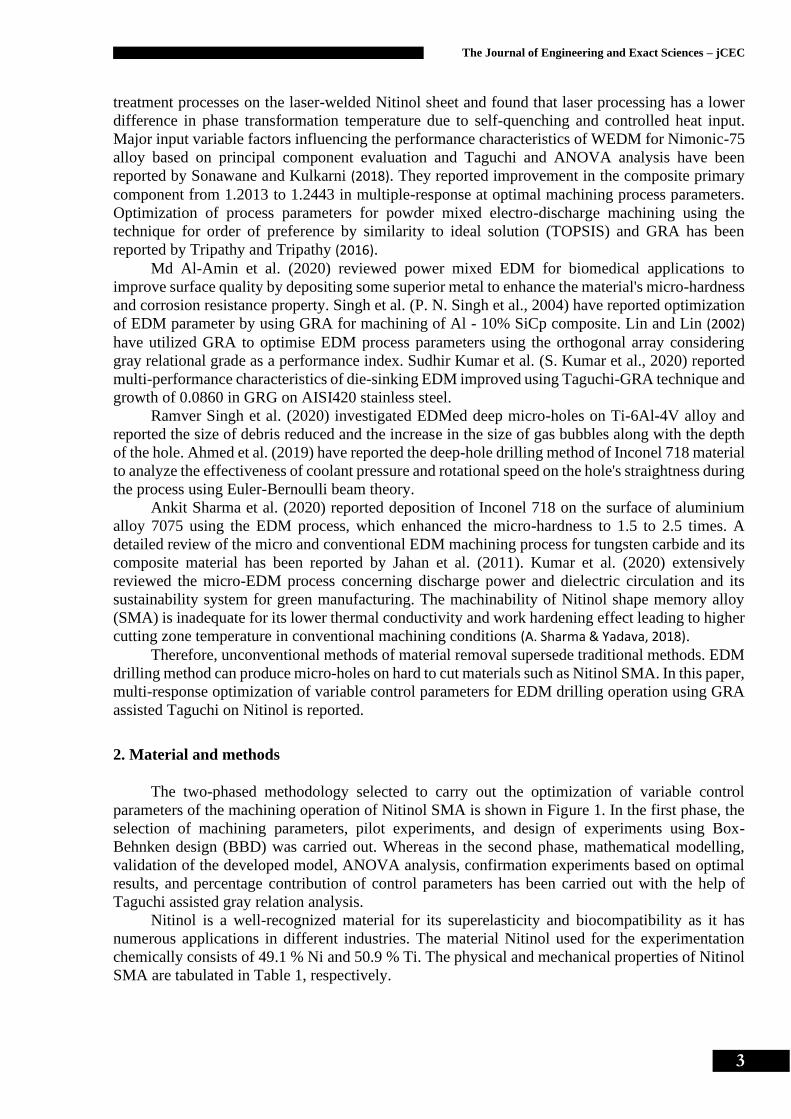
treatment processes on the laser-welded Nitinol sheet and found that laser processing has a lower
difference in phase transformation temperature due to self-quenching and controlled heat input.
Major input variable factors influencing the performance characteristics of WEDM for Nimonic-75
alloy based on principal component evaluation and Taguchi and ANOVA analysis have been
reported by Sonawane and Kulkarni (2018). They reported improvement in the composite primary
component from 1.2013 to 1.2443 in multiple-response at optimal machining process parameters.
Optimization of process parameters for powder mixed electro-discharge machining using the
technique for order of preference by similarity to ideal solution (TOPSIS) and GRA has been
reported by Tripathy and Tripathy (2016).
Md Al-Amin et al. (2020) reviewed power mixed EDM for biomedical applications to
improve surface quality by depositing some superior metal to enhance the material's micro-hardness
and corrosion resistance property. Singh et al. (P. N. Singh et al., 2004) have reported optimization
of EDM parameter by using GRA for machining of Al - 10% SiCp composite. Lin and Lin (2002)
have utilized GRA to optimise EDM process parameters using the orthogonal array considering
gray relational grade as a performance index. Sudhir Kumar et al. (S. Kumar et al., 2020) reported
multi-performance characteristics of die-sinking EDM improved using Taguchi-GRA technique and
growth of 0.0860 in GRG on AISI420 stainless steel.
Ramver Singh et al. (2020) investigated EDMed deep micro-holes on Ti-6Al-4V alloy and
reported the size of debris reduced and the increase in the size of gas bubbles along with the depth
of the hole. Ahmed et al. (2019) have reported the deep-hole drilling method of Inconel 718 material
to analyze the effectiveness of coolant pressure and rotational speed on the hole's straightness during
the process using Euler-Bernoulli beam theory.
Ankit Sharma et al. (2020) reported deposition of Inconel 718 on the surface of aluminium
alloy 7075 using the EDM process, which enhanced the micro-hardness to 1.5 to 2.5 times. A
detailed review of the micro and conventional EDM machining process for tungsten carbide and its
composite material has been reported by Jahan et al. (2011). Kumar et al. (2020) extensively
reviewed the micro-EDM process concerning discharge power and dielectric circulation and its
sustainability system for green manufacturing. The machinability of Nitinol shape memory alloy
(SMA) is inadequate for its lower thermal conductivity and work hardening effect leading to higher
cutting zone temperature in conventional machining conditions (A. Sharma & Yadava, 2018).
Therefore, unconventional methods of material removal supersede traditional methods. EDM
drilling method can produce micro-holes on hard to cut materials such as Nitinol SMA. In this paper,
multi-response optimization of variable control parameters for EDM drilling operation using GRA
assisted Taguchi on Nitinol is reported.
2. Material and methods
The two-phased methodology selected to carry out the optimization of variable control
parameters of the machining operation of Nitinol SMA is shown in Figure 1. In the first phase, the
selection of machining parameters, pilot experiments, and design of experiments using Box-
Behnken design (BBD) was carried out. Whereas in the second phase, mathematical modelling,
validation of the developed model, ANOVA analysis, confirmation experiments based on optimal
results, and percentage contribution of control parameters has been carried out with the help of
Taguchi assisted gray relation analysis.
Nitinol is a well-recognized material for its superelasticity and biocompatibility as it has
numerous applications in different industries. The material Nitinol used for the experimentation
chemically consists of 49.1 % Ni and 50.9 % Ti. The physical and mechanical properties of Nitinol
SMA are tabulated in Table 1, respectively.

The Journal of Engineering and Exact Sciences – jCEC
4
Table 1 - Physical and mechanical Properties of Nitinol.
Melting Temperature 1240 – 1310 °C
Resistivity (high temperature state) 82 μΩ-cm
Resistivity (low temperature state) 76 μΩ-cm
Thermal Conductivity 0.1 W/cm/°C
Heat Capacity 0.077 cal/gm/°C
Latent Heat 5.78 cal/gm
Magnetic Susceptibility (high temperature) 3.8 μemu/gm
Magnetic Susceptibility (low temperature) 2.5 μemu/gm
Tensile Strength Austenite: 195 – 690 MPa
Martensite: 70 – 140 MPa
Young's Modulus Austenite: 83 GPa
Martensite: 28 – 41 GPa
Density 6.45 g/cm3
Figure 1 - Phase diagram of the methodology.

The Journal of Engineering and Exact Sciences – jCEC
5
The machinability of Nitinol is low due to its mechanical and physical properties. Hence
nonconventional machining processes have mostly been taken into account for different material
removal operations. All designed experiments were carried out of this study using Sparkonix EDM
Drill Speed I machine. Its actual photograph is shown in Figure 2. Technical specifications and
details of the EDM machine are tabulated in Table 2. The machine's process parameters have ten
steps to control gap voltage, pulse-on time, and pulse-off time, whereas the discharge current has
25-steps of one ampere each.
Figure 2 - Actual photograph of Sparkonix EDM Drill Speed I.
Figure 3 - Schematic of EDM drilling process.
The Journal of Engineering and Exact Sciences – jCEC
6
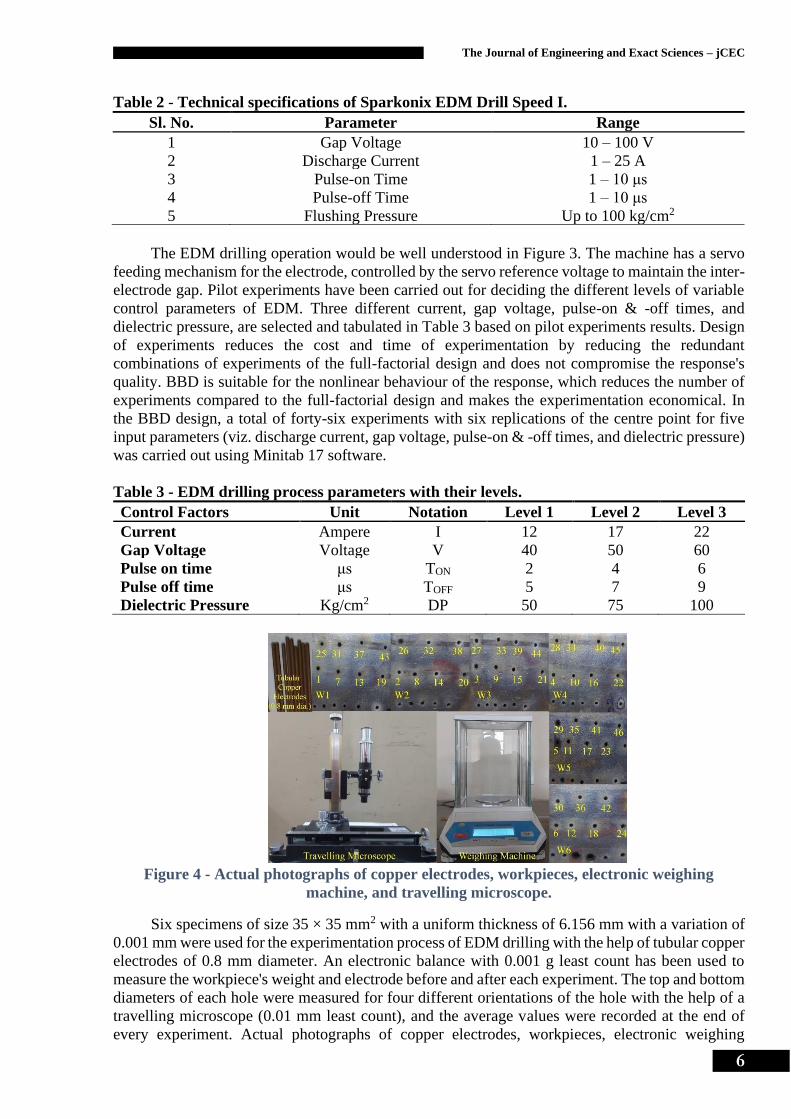
Table 2 - Technical specifications of Sparkonix EDM Drill Speed I.
The EDM drilling operation would be well understood in Figure 3. The machine has a servo
feeding mechanism for the electrode, controlled by the servo reference voltage to maintain the inter-
electrode gap. Pilot experiments have been carried out for deciding the different levels of variable
control parameters of EDM. Three different current, gap voltage, pulse-on & -off times, and
dielectric pressure, are selected and tabulated in Table 3 based on pilot experiments results. Design
of experiments reduces the cost and time of experimentation by reducing the redundant
combinations of experiments of the full-factorial design and does not compromise the response's
quality. BBD is suitable for the nonlinear behaviour of the response, which reduces the number of
experiments compared to the full-factorial design and makes the experimentation economical. In
the BBD design, a total of forty-six experiments with six replications of the centre point for five
input parameters (viz. discharge current, gap voltage, pulse-on & -off times, and dielectric pressure)
was carried out using Minitab 17 software.
Table 3 - EDM drilling process parameters with their levels.
Control Factors Unit Notation Level 1 Level 2 Level 3
Current Ampere I 12 17 22
Gap Voltage Voltage V 40 50 60
Pulse on time μs TON 2 4 6
Pulse off time μs TOFF 5 7 9
Dielectric Pressure Kg/cm2 DP 50 75 100
Figure 4 - Actual photographs of copper electrodes, workpieces, electronic weighing
machine, and travelling microscope.
Six specimens of size 35 × 35 mm2 with a uniform thickness of 6.156 mm with a variation of
0.001 mm were used for the experimentation process of EDM drilling with the help of tubular copper
electrodes of 0.8 mm diameter. An electronic balance with 0.001 g least count has been used to
measure the workpiece's weight and electrode before and after each experiment. The top and bottom
diameters of each hole were measured for four different orientations of the hole with the help of a
travelling microscope (0.01 mm least count), and the average values were recorded at the end of
every experiment. Actual photographs of copper electrodes, workpieces, electronic weighing
Sl. No. Parameter Range
1 Gap Voltage 10 – 100 V
2 Discharge Current 1 – 25 A
3 Pulse-on Time 1 – 10 μs
4 Pulse-off Time 1 – 10 μs
5 Flushing Pressure Up to 100 kg/cm2

The Journal of Engineering and Exact Sciences – jCEC
7
machine, and travelling microscope are shown in Figure 4, along with experiment numbers of each
hole. Process performance parameters of EDM one can get using Equation 1, 2 & 3.
𝑀𝑅𝑅 =(𝑖𝑛𝑖𝑡𝑎𝑙−𝑓𝑖𝑛𝑎𝑙)𝑤𝑒𝑖𝑡ℎ𝑡 𝑜𝑓 𝑤𝑜𝑟𝑘 𝑚𝑎𝑡𝑒𝑟𝑖𝑎𝑙
𝑚𝑎𝑐ℎ𝑖𝑛𝑖𝑛𝑔 𝑡𝑖𝑚𝑒 ×𝑑𝑒𝑠𝑛𝑖𝑡𝑦 𝑜𝑓 𝑤𝑜𝑟𝑘 𝑚𝑎𝑡𝑒𝑟𝑖𝑎𝑙 (1)
𝑇𝑊𝑅 =(𝑖𝑛𝑖𝑡𝑎𝑙−𝑓𝑖𝑛𝑎𝑙)𝑤𝑒𝑖𝑡ℎ𝑡 𝑜𝑓 𝑒𝑙𝑒𝑐𝑡𝑟𝑜𝑑𝑒
𝑚𝑎𝑐ℎ𝑖𝑛𝑖𝑛𝑔 𝑡𝑖𝑚𝑒 ×𝑑𝑒𝑠𝑛𝑖𝑡𝑦 𝑜𝑓 𝑒𝑙𝑒𝑐𝑡𝑟𝑜𝑑𝑒 (2)
𝐷𝑜𝑇 = 𝑡𝑎𝑛−1 [𝐷𝑡−𝐷𝑏
2𝐻] (3)
Dt and Db are the average top and bottom diameters, respectively, and H is the hole's depth.
Factors and their levels, along with the measured values of MRR, TWR, and DoT, are tabulated in
Table 4.
Table 4 - Values of MRR, TWR, and DoT and their GRCs, GRG, and order along with
experimental process parameter. Ex.
No.
Factors and their levels Responses Grey Relational
Coefficient
GRG Order
I V TON TOFF DP MRR TWR DoT MRR TWR DoT
1 12 50 4 7 100 0.0110 0.0067 0.0171 0.3786 0.6820 0.6086 0.5564 29
2 17 50 2 5 75 0.0128 0.0047 0.0284 0.4050 0.8364 0.3784 0.5399 32
3 22 50 4 7 100 0.0195 0.0091 0.0130 0.5535 0.5538 0.7777 0.6283 13
4 17 50 4 7 75 0.0149 0.0067 0.0146 0.4419 0.6803 0.6999 0.6074 18
5 17 50 6 5 75 0.0196 0.0065 0.0146 0.5552 0.6929 0.6999 0.6493 8
6 12 50 4 7 50 0.0076 0.0044 0.0154 0.3364 0.8729 0.6666 0.6253 14
7 12 50 4 9 75 0.0084 0.0041 0.0211 0.3455 0.9050 0.4999 0.5835 24
8 17 50 2 7 100 0.0075 0.0053 0.0284 0.3347 0.7805 0.3784 0.4979 40
9 22 50 4 5 75 0.0243 0.0084 0.0300 0.7466 0.5888 0.3590 0.5648 25
10 17 40 2 7 75 0.0094 0.0040 0.0252 0.3572 0.9100 0.4242 0.5638 27
11 17 40 4 7 50 0.0114 0.0046 0.0138 0.3838 0.8539 0.7368 0.6582 7
12 17 60 4 5 75 0.0277 0.0128 0.0268 1.0000 0.4329 0.4000 0.6110 16
13 17 50 6 7 50 0.0147 0.0036 0.0268 0.4390 0.9683 0.4000 0.6024 20
14 17 60 4 7 50 0.0178 0.0151 0.0300 0.5070 0.3794 0.3590 0.4151 44
15 12 50 6 7 75 0.0114 0.0057 0.0106 0.3835 0.7536 0.9333 0.6901 2
16 17 50 4 9 50 0.0091 0.0063 0.0227 0.3540 0.7108 0.4666 0.5105 38
17 12 60 4 7 75 0.0171 0.0171 0.0187 0.4895 0.3442 0.5599 0.4645 42
18 12 50 2 7 75 0.0098 0.0042 0.0268 0.3622 0.8912 0.4000 0.5511 30
19 22 50 4 7 50 0.0181 0.0062 0.0276 0.5147 0.7114 0.3889 0.5383 33
20 17 60 2 7 75 0.0126 0.0131 0.0268 0.4025 0.4252 0.4000 0.4092 45
21 17 40 4 9 75 0.0074 0.0045 0.0187 0.3341 0.8630 0.5599 0.5857 23
22 17 50 2 7 50 0.0107 0.0048 0.0268 0.3740 0.8290 0.4000 0.5343 34
23 22 50 6 7 75 0.0164 0.0064 0.0097 0.4736 0.6980 1.0000 0.7239 1
24 17 40 4 7 100 0.0143 0.0052 0.0122 0.4313 0.7933 0.8235 0.6827 3
25 17 40 4 5 75 0.0144 0.0046 0.0154 0.4324 0.8475 0.6666 0.6489 9
26 22 60 4 7 75 0.0222 0.0174 0.0171 0.6469 0.3392 0.6086 0.5316 35
27 17 50 4 7 75 0.0156 0.0068 0.0235 0.4563 0.6736 0.4516 0.5271 36
28 22 50 2 7 75 0.0175 0.0045 0.0325 0.4990 0.8616 0.3333 0.5646 26
29 17 50 4 5 50 0.0174 0.0045 0.0260 0.4959 0.8610 0.4117 0.5895 22
30 17 50 4 7 75 0.0203 0.0073 0.0122 0.5797 0.6423 0.8235 0.6818 4
31 17 50 4 7 75 0.0157 0.0049 0.0317 0.4587 0.8225 0.3415 0.5409 31

The Journal of Engineering and Exact Sciences – jCEC
8
32 17 50 4 7 75 0.0124 0.0062 0.0300 0.3988 0.7157 0.3590 0.4912 41
33 12 50 4 5 75 0.0112 0.0053 0.0284 0.3814 0.7814 0.3784 0.5137 37
34 22 40 4 7 75 0.0208 0.0046 0.0325 0.5940 0.8534 0.3333 0.5936 21
35 17 50 2 9 75 0.0075 0.0049 0.0317 0.3345 0.8218 0.3415 0.4992 39
36 17 50 4 7 75 0.0083 0.0047 0.0138 0.3441 0.8414 0.7368 0.6407 12
37 17 60 4 9 75 0.0186 0.0178 0.0300 0.5273 0.3333 0.3590 0.4065 46
38 12 40 4 7 75 0.0074 0.0033 0.0211 0.3333 1.0000 0.4999 0.6111 15
39 17 50 6 9 75 0.0147 0.0051 0.0146 0.4389 0.8059 0.6999 0.6483 10
40 17 50 4 5 100 0.0191 0.0052 0.0154 0.5429 0.7913 0.6666 0.6669 6
41 17 60 4 7 100 0.0211 0.0154 0.0146 0.6060 0.3741 0.6999 0.5600 28
42 17 50 4 9 100 0.0145 0.0070 0.0122 0.4344 0.6647 0.8235 0.6408 11
43 22 50 4 9 75 0.0153 0.0084 0.0130 0.4513 0.5866 0.7777 0.6052 19
44 17 40 6 7 75 0.0152 0.0041 0.0154 0.4480 0.9036 0.6666 0.6727 5
45 17 50 6 7 100 0.0218 0.0053 0.0260 0.6322 0.7833 0.4117 0.6091 17
46 17 60 6 7 75 0.0203 0.0158 0.0244 0.5794 0.3667 0.4375 0.4612 43
Mathematical modelling has been performed to establish the relationship between variable
control parameters of EDM and response parameters (viz. MRR, TWR, and DoT).
Complicated interrelationships between designated performance characteristics are
effectively analyzed with GRA's help as it gives an efficient solution to discrete uncertainty and
multi-input data problems (Datta et al., 2008; Gautam & Mishra, 2019). Data processing was carried
out by normalizing the results obtained from the experimentation. It has been used for multi-
response optimization of MRR, TWR, and DoT. First, the performance characteristics were
normalized: MRR has been normalized for larger the better using Equation 4, and TWR and DoT
have been normalized for smaller the better using Equation 5.
For larger the better performance characteristic:
𝑥𝑖 =𝑦𝑖 − min (𝑦𝑖)
max(𝑦𝑖) − min (𝑦𝑖) (4)
For smaller the better performance characteristic:
𝑥𝑖 =max(𝑦𝑖)− 𝑦𝑖
max(𝑦𝑖) − min (𝑦𝑖) (5)
Where yi is the ith response, and max(yi) and min(yi) are the maximum and minimum
values of the responses.
Before finding the value of gray relational coefficients (GRC) using Equation 7, the
deviational sequences were evaluated using Equation 6, and gray relational grades (GRG) were
assessed using Equation 8 tabulated and its order shown in Table 4.
Δ𝑥𝑖 = max(𝑥𝑖) − 𝑥𝑖 (6)
𝜉𝑖 =min(Δ𝑥𝑖)+ 𝜁max (Δ𝑥𝑖)
Δ𝑥𝑖+ 𝜁max (Δ𝑥𝑖) (7)
Where Δxi is the deviation sequence and 𝜁 = 0.5 (equal preference for all performance
parameters).
Based on GRG, the overall evaluation of multi-performance characteristics is evaluated as
GRG as a weighting sum of GRCs.
𝛾𝑖 =1
𝑛∑ 𝜉𝑖
𝑛1 (8)
Comparability sequence exerts over the reference sequence as GRG indicates the degree of
influence, and its more immense value indicates that the quality of product complements the
outstanding value.
Taguchi optimization technique is recognized for one response at a time approach. The multi-
response optimization using Taguchi was carried out with the assistance of GRA. Taguchi considers
the signal to noise ratio (SNR) as the quality characteristic of the response. According to the quality

The Journal of Engineering and Exact Sciences – jCEC
9
characteristics, the SNRs (Taguchi & Phadke, 1989) were calculated using Equation 9 or 10 and
tabulated in Table 5.
For larger the better:
𝜂 = −10 × 𝑙𝑜𝑔101
𝑛∑ (
1
𝑦𝑖2)𝑛
1 (9)
For smaller the better:
𝜂 = −10 × 𝑙𝑜𝑔101
𝑛∑ 𝑦𝑖
2𝑛1 (10)
Table 5 - S/N ratio for various response parameters and GRG.
Ex. No. S/N Ratio
MRR TWR DoT GRG
1 -39.1615 43.4957 35.3630 -5.0919
2 -37.8776 46.5048 30.9276 -5.3531
3 -34.1974 40.7786 37.7247 -4.0362
4 -37.7934 44.1744 32.9920 -4.8807
5 -34.1713 43.7137 36.7017 -3.7505
6 -42.3359 47.1967 36.2322 -4.0781
7 -41.4752 47.8006 33.5084 -4.6797
8 -42.5127 45.4353 30.9276 -6.0580
9 -32.3018 41.5498 30.4452 -4.9618
10 -40.5358 47.8954 31.9812 -4.9776
11 -38.8771 46.8359 37.1981 -3.6334
12 -31.1461 37.8620 31.4384 -4.2796
13 -36.6480 48.9940 31.4384 -4.4021
14 -34.9818 36.3935 30.4452 -7.6361
15 -38.8931 44.9137 39.5280 -3.2212
16 -40.7751 44.0713 32.8649 -5.8407
17 -35.3397 35.3397 34.5730 -6.6598
18 -40.1811 47.5407 31.4384 -5.1754
19 -34.8362 44.0842 31.1792 -5.3789
20 -37.9863 37.6585 31.4384 -7.7606
21 -42.5723 47.0093 34.5730 -4.6465
22 -39.4286 46.3644 31.4384 -5.4440
23 -35.7015 43.8168 40.2232 -2.8069
24 -36.8944 45.6811 38.2852 -3.3156
25 -36.8575 46.7158 36.2322 -3.7571
26 -33.0883 35.1831 35.3630 -5.4887
27 - - - -
28 -35.1399 46.9814 29.7684 -4.9646
29 -35.2047 46.9702 31.7055 -4.5901
30 - - - -
31 - - - -
32 - - - -
33 -39.0079 45.4523 30.9276 -5.7856
34 -33.6557 46.8265 29.7684 -4.5305
35 -42.5354 46.2259 29.9882 -6.0340
36 - - - -
37 -34.6128 34.9989 30.4452 -7.8179
38 -42.6580 49.5937 33.5084 -4.2779
39 -36.6488 45.9240 36.7017 -3.7649

The Journal of Engineering and Exact Sciences – jCEC
10
40 -34.3579 45.6434 36.2322 -3.5183
41 -33.5151 36.2395 36.7017 -5.0359
42 -36.7948 43.1432 38.2852 -3.8650
43 -36.2819 41.5002 37.7247 -4.3621
44 -36.3765 47.7740 36.2322 -3.4434
45 -33.2329 45.4885 31.7055 -4.3066
46 -33.8389 36.0218 32.2659 -6.7227
Note: As there are six center points, the S/N ratio of Exp. No. 4 only is available
The significance of individual process parameters and their effects on the performance
characteristics by decomposing the variance of the relative impact of different factors are evaluated
using ANOVA as it indicates the impact of the control parameters on the GRA. The ANOVA
analysis of GRA has been done, and the obtained results are tabulated in Table 6, which shows that
the V and TON are the most significant process parameter.
Table 6 - Analysis of variance of GRG.
Source SS DF Mean Square F-value p-value
Model 0.1814 20 0.0091 2.71 0.0098
A (I) 0.0015 1 0.0015 0.4456 0.5105
B (V) 0.0837 1 0.0837 24.99 < 0.0001
C (TON) 0.0503 1 0.0503 15.01 0.0007
D (TOFF) 0.0058 1 0.0058 1.73 0.2006
E (DP) 0.0085 1 0.0085 2.53 0.1240
AB 0.0018 1 0.0018 0.5336 0.4719
AC 0.0001 1 0.0001 0.0304 0.8630
AD 0.0002 1 0.0002 0.0644 0.8017
AE 0.0063 1 0.0063 1.88 0.1821
BC 0.0008 1 0.0008 0.2423 0.6269
BD 0.0050 1 0.0050 1.49 0.2337
BE 0.0036 1 0.0036 1.08 0.3085
CD 0.0004 1 0.0004 0.1172 0.7349
CE 0.0005 1 0.0005 0.1388 0.7126
DE 0.0007 1 0.0007 0.2092 0.6513
A² 0.0007 1 0.0007 0.1980 0.6601
B² 0.0081 1 0.0081 2.42 0.1324
C² 0.0000 1 0.0000 0.0107 0.9183
D² 0.0000 1 0.0000 0.0090 0.9252
E² 0.0003 1 0.0003 0.1000 0.7544
Residual 0.0838 25 0.0034
Lack of Fit 0.0567 20 0.0028 0.5253 0.8613
Pure Error 0.0270 5 0.0054
Total 0.2651 45

The Journal of Engineering and Exact Sciences – jCEC
11
3. Results and discussions
Interaction and main effect plots for MRR are shown in Figure 5 & 6, respectively. It is evident
that by increasing the discharge current, MRR increases to an average value of 0.0193 g/min due to
the liberation of higher energy in the spark gap, which raises melting and evaporation of the
workpiece material. The behaviour of gap voltage on MRR is the same as that of the discharge
current, and it reaches an average value of 0.0197 g/min, as enhancement in the gap voltage leads
to the rise in heat intensity. MRR increases to an average of 0.0168 g/min with a surge in TON,
whereas TOFF has a reverse impact on the MRR; its average value falls from 0.183 - 0.0119 g/min.
TON and TOFF indicate the sparking rate; when the sparking rate rises, more heat will carry from one
spark to the other, which increases the MRR. The influence of dielectric pressure DP has a direct
impact on MRR. By increasing DP, efficient flushing of the molten metal occurs, which increases
the average value of MRR to 0.0161g/min. The discharge current is the significant control variable
parameter for maximizing MRR.
Figure 7 & 8 show the interaction and main effect plots for TWR, respectively. These figures
indicate that the TWR increases to the average of 0.0081 g/min by increasing the discharge current.
It is because of enhancement in the spark energy, which leads to a higher temperature of the
electrode. The gap voltage has a higher impact on TWR and raises it to an average of 0.0156 g/min,
which is around nine times compared to the effect of discharge current. This massive jump in TWR
is because of the direct relation between gap voltage and total energy of discharge in one spark. In
contrast, the other control factors such as TON, TOFF, and DP have minor impacts on TWR. For
minimal TWR, gap voltage is the most significant control parameter.
Figure 5 - Interaction plot of process parameters for MRR.

The Journal of Engineering and Exact Sciences – jCEC
12
Figure 6 - Main effect plot for MRR.
Figure 9 & 10 show the interaction and main effect plot for DoT, respectively. These plots
indicate that by increasing the discharge current and the gap voltage, the DoT increased by 10 &
21 %, respectively, due to the spark's total discharge energy. By increasing TON, TOFF, and DP, the
value of DoT decreased by around 37, 11 & 26 %, respectively, because of an increase in discharge
time and cooling of the workpiece material. As DoT needs to be minimized, TON is the most
influencing process parameter followed by DP.
Figure 7 - Interaction plot of process parameters for TWR.

The Journal of Engineering and Exact Sciences – jCEC
13
Figure 8 - Main effect plot for TWR.
Figure 11, 12 & 13 shows the surface and contour plots for MRR, TWR and DoT, respectively,
as functions of the most significant control variable parameters (viz. viz. V and TON), at I = 22 A,
TOFF = 7 μs and DP = 100 kg/cm2. Figure 11 indicates that the maximum value of MRR is 0.0277
g/min at higher gap voltage & discharge time, and the minimum value is 0.0074 g/min at lower gap
voltage & discharge time. This variation occurs due to energy availability.
Figure 12 indicates that the maximum and minimum values of TWR are 0.0177 and 0.0033
g/min, respectively. Gap voltage has a more significant influence on it, whereas TON has the most
negligible impact. Maximum TWR is at a higher value of gap voltage as the energy received by the
electrode from the spark will rise. Figure 13 indicates that the DoT has its maximum and minimum
values of 0.032 and 0.01 radians, respectively. The DoT has a higher value nearer to the lower values
of gap voltage and the discharge time, whereas it is low at higher values of gap voltage and discharge
time. A minimum value will occur if the sparking will concentrate at the electrode's tip, leading to
the material removal for getting the hole drilled.
Figure 9 - Interaction plot of process parameters for DoT.

The Journal of Engineering and Exact Sciences – jCEC
14
Figure 10 - Main effect plot for DoT.
A confirmation test has been carried out to validate performance characteristics' improvement
after obtaining optimum control parameters of EDM, and optimal value has been evaluated using
Equation 13.
𝜂𝑒𝑠𝑡 = 𝜂𝑚 + ∑ (𝜂𝑖 − 𝜂𝑚)𝑛1 (13)
Where ηm & ηi are the mean and ith response, respectively.
L23 is found as the optimum conditions for maximizing MRR and minimizing TWR & DoT
from the GRG and its order simultaneously. The optimum combination of process control variable
parameters are I3, V2, TON3, TOFF2 & DP2, and their responses are MRR 0.0164 g/min, TWR 0.0064
g/min, DoT 0.0097 radians & SNR of GRG -2.8069 dB.
Figure 11 - Surface and contour plots for MRR.

The Journal of Engineering and Exact Sciences – jCEC
15
Figure 12 - Surface and contour plots for TWR.
Figure 13 - Surface and contour plots for DoT.
It has been observed that the optimum setting of input control parameters, comparing with the
initial set, that there are improvements in the quality characteristics. MRR was raised by 49.1 %,
where TWR and DoT were lowered by 4.5 and 43.3 %.
4. Conclusions
Based on the experimentation of EDM drilling on Nitinol SMA and its analysis using GRG
assisted Taguchi for multi-response optimization of the quality characteristics (viz. MRR, TWR,
and DoT), the following conclusions can be made:
i. Gap voltage and discharge time are the most significant process control variables.
ii. The optimum frame of parameters is higher discharge current (I) and time (TON) with average
gap voltage (V), charging time (TOFF) (higher than TON), and dielectric flushing pressure
(DP).
iii. MRR, TWR, and DoT are improved by 49.1, 4.5, and 43.3 %, respectively, compared to the
initial experiment.
The Journal of Engineering and Exact Sciences – jCEC
16
References
Ahmed, A., Lew, M. T., Diwakar, P., Kumar, A. S., & Rahman, M. (2019). A novel approach
in high performance deep hole drilling of Inconel 718. Precision Engineering,
56(January), 432–437. https://doi.org/10.1016/j.precisioneng.2019.01.012
Al-Amin, M., Abdul Rani, A. M., Abdu Aliyu, A. A., Abdul Razak, M. A., Hastuty, S., &
Bryant, M. G. (2020). Powder mixed-EDM for potential biomedical applications: A
critical review. Materials and Manufacturing Processes, 00(00), 1–23.
https://doi.org/10.1080/10426914.2020.1779939
Chakraborty, S., Sudhakar Dandge, S., & Agarwal, S. (2019). Non-traditional machining
processes selection and evaluation: A rough multi-attributive border approximation area
comparison approach. Computers & Industrial Engineering, 139(July 2019), 106201.
https://doi.org/10.1016/j.cie.2019.106201
Datta, S., Bandyopadhyay, A., & Pal, P. K. (2008). Grey-based taguchi method for
optimization of bead geometry in submerged arc bead-on-plate welding. The
International Journal of Advanced Manufacturing Technology, 39(11–12), 1136–1143.
https://doi.org/10.1007/s00170-007-1283-6
Deepan Bharathi Kannan, T., Pegada, R., Sathiya, P., & Ramesh, T. (2018). A comparison of
the effect of different heat treatment processes on laser-welded NiTinol sheets. Journal
of the Brazilian Society of Mechanical Sciences and Engineering, 40(12), 562.
https://doi.org/10.1007/s40430-018-1481-1
Gautam, G., & Mishra, D. (2019). Evaluation of geometrical quality characteristics in pulsed
Nd:YAG laser cutting of Kevlar-29/Basalt fiber reinforced hybrid composite using Grey
relational analysis based on genetic algorithm. FME Transactions, 47(3), 560–575.
https://doi.org/10.5937/fmet1903560G
HuuPhan, N., Muthuramalingam, T., Vu, N. N., & Tuan, N. Q. (2020). Influence of micro size
titanium powder-mixed dielectric medium on surface quality measures in EDM process.
International Journal of Advanced Manufacturing Technology, 109(3–4), 797–807.
https://doi.org/10.1007/s00170-020-05698-9
Jahan, M. P., Rahman, M., & Wong, Y. S. (2011). A review on the conventional and micro-
electrodischarge machining of tungsten carbide. International Journal of Machine Tools
and Manufacture, 51(12), 837–858. https://doi.org/10.1016/j.ijmachtools.2011.08.016
Kumar, D., Singh, N. K., & Bajpai, V. (2020). Recent trends, opportunities and other aspects
of micro-EDM for advanced manufacturing: a comprehensive review. Journal of the
Brazilian Society of Mechanical Sciences and Engineering, 42(5), 1–26.
https://doi.org/10.1007/s40430-020-02296-4
Kumar, S., Ghoshal, S. K., Arora, P. K., & Nagdeve, L. (2020). Multi-variable optimization in
die-sinking EDM process of AISI420 stainless steel. Materials and Manufacturing
Processes, 00(00), 1–11. https://doi.org/10.1080/10426914.2020.1843678
Lin, J. L., & Lin, C. L. (2002). The use of the orthogonal array with grey relational analysis to
optimize the electrical discharge machining process with multiple performance
characteristics. International Journal of Machine Tools and Manufacture, 42(2), 237–
244. https://doi.org/10.1016/S0890-6955(01)00107-9
Liu, J. F., Li, C., Fang, X. Y., Jordon, J. B., & Guo, Y. B. (2018). Effect of wire-EDM on
fatigue of nitinol shape memory alloy. Materials and Manufacturing Processes, 33(16),
1809–1814. https://doi.org/10.1080/10426914.2018.1512125
Majumder, H., & Maity, K. (2018). Prediction and optimization of surface roughness and
micro-hardness using grnn and MOORA-fuzzy-a MCDM approach for nitinol in
WEDM. Measurement, 118, 1–13. https://doi.org/10.1016/j.measurement.2018.01.003
Mwangi, J. W., Bui, V. D., Thüsing, K., Hahn, S., Wagner, M. F. X., & Schubert, A. (2020).
Characterization of the arcing phenomenon in micro-EDM and its effect on key
mechanical properties of medical-grade Nitinol. Journal of Materials Processing

The Journal of Engineering and Exact Sciences – jCEC
17
Technology, 275(March 2019), 116334.
https://doi.org/10.1016/j.jmatprotec.2019.116334
Mwangi, J. W., Weisheit, L., Bui, V. D., Zanjani, M. Y., & Schubert, A. (2018). Influence of
Micro-EDM on the Phase Transformation Behaviour of Medical-Grade Nitinol. Shape
Memory and Superelasticity, 4(4), 450–461. https://doi.org/10.1007/s40830-018-00195-
1
Sarmah, A., Kar, S., & Patowari, P. K. (2020). Surface modification of aluminum with green
compact powder metallurgy Inconel-aluminum tool in EDM. Materials and
Manufacturing Processes, 35(10), 1104–1112.
https://doi.org/10.1080/10426914.2020.1765253
Sharma, A., & Yadava, V. (2018). Experimental analysis of Nd-YAG laser cutting of sheet
materials – A review. Optics and Laser Technology, 98, 264–280.
https://doi.org/10.1016/j.optlastec.2017.08.002
Sharma, P., Singh, S., & Mishra, D. R. (2014). Electrical Discharge Machining of AISI 329
Stainless Steel Using Copper and Brass Rotary Tubular Electrode. Procedia Materials
Science, 5, 1771–1780. https://doi.org/10.1016/j.mspro.2014.07.367
Shin, M.-C., Kim, Y.-S., Cheong, H.-G., & Chu, C.-N. (2019). Performance of a TR-iso-pulse
generator in micro ED-drilling. Precision Engineering, June 2018, 0–1.
https://doi.org/10.1016/j.precisioneng.2019.01.013
Singh, P. N., Raghukandan, K., & Pai, B. C. (2004). Optimization by Grey relational analysis
of EDM parameters on machining Al–10%SiCP composites. Journal of Materials
Processing Technology, 155–156(1–3), 1658–1661.
https://doi.org/10.1016/j.jmatprotec.2004.04.322
Singh, R., Dvivedi, A., & Kumar, P. (2020). EDM of high aspect ratio micro-holes on Ti-6Al-
4V alloy by synchronizing energy interactions. Materials and Manufacturing Processes,
35(11), 1188–1203. https://doi.org/10.1080/10426914.2020.1762207
Sonawane, S. A., & Kulkarni, M. L. (2018). Optimization of machining parameters of WEDM
for Nimonic-75 alloy using principal component analysis integrated with Taguchi
method. Journal of King Saud University - Engineering Sciences, 30(3), 250–258.
https://doi.org/10.1016/j.jksues.2018.04.001
Taguchi, G., & Phadke, M. S. (1989). Quality Engineering through Design Optimization. In
Quality Control, Robust Design, and the Taguchi Method (pp. 77–96). Springer US.
https://doi.org/10.1007/978-1-4684-1472-1_5
Tripathy, S., & Tripathy, D. K. (2016). Multi-attribute optimization of machining process
parameters in powder mixed electro-discharge machining using TOPSIS and grey
relational analysis. Engineering Science and Technology, an International Journal,
19(1), 62–70. https://doi.org/10.1016/j.jestch.2015.07.010
Vidyasagar, K. E. C., Rana, A., & Kalyanasundaram, D. (2020). Optimization of laser
parameters for improved corrosion resistance of nitinol. Materials and Manufacturing
Processes, 1–9. https://doi.org/10.1080/10426914.2020.1784926