multi-tower synthesis scaling of regional carbon dioxide flux another fine mess of observed data,...
TRANSCRIPT
Multi-tower Synthesis Scaling of Multi-tower Synthesis Scaling of Regional Carbon Dioxide FluxRegional Carbon Dioxide Flux
Another fine mess of observed Another fine mess of observed data, remote sensing and data, remote sensing and
ecosystem model parameterizationecosystem model parameterization
Ankur DesaiPenn State UniversityMeteorology Dept.ChEAS Meeting VIIJune 2005

GoalsGoals
• Identify key processes of within-site and cross-site variability of carbon dioxide flux in space and time with stand-scale observations
• Develop simple multiple flux tower synthesis aggregation methods to test the hypotheses that stand-scale towers can sufficiently sample landscape for upscaling to regional flux
• Parameterize and optimize ecosystem models of varying complexity to the region using biometric inventory, remote sensing and component flux data and test effect of input parameter resolution and type on model performance
• Constrain top-down regional CO2 flux using multi-tower concentration measurements, and simple Eulerian and Lagrangian/stochastic transport schema
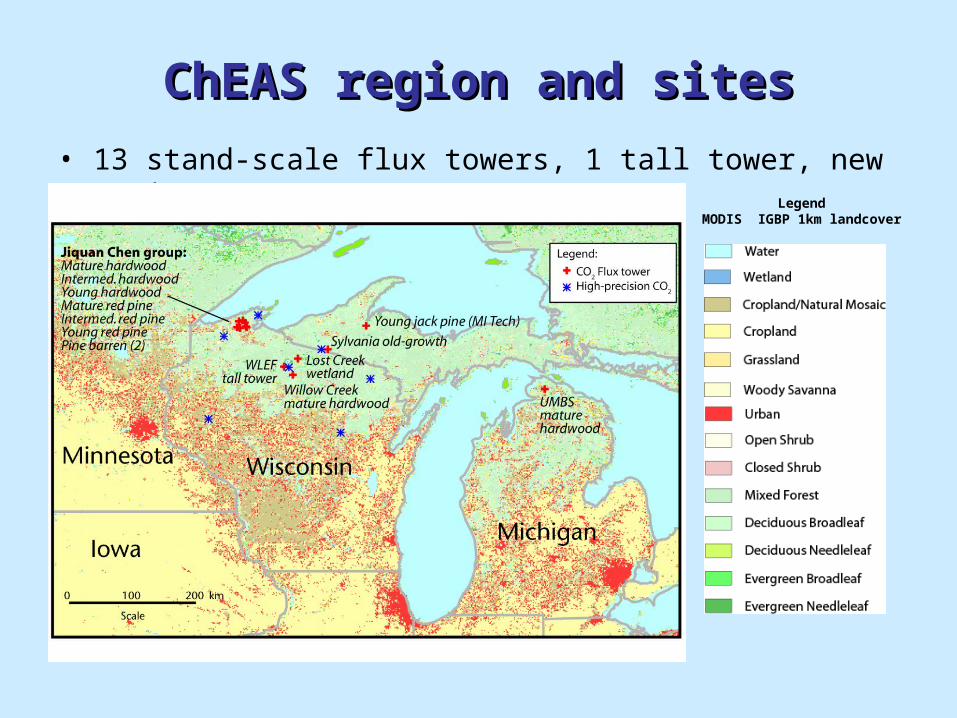
ChEAS region and sitesChEAS region and sites
• 13 stand-scale flux towers, 1 tall tower, new roving towersLegend
MODIS IGBP 1km landcover

Interannual variability of NEEInterannual variability of NEE
WLEF Lost Creek
Willow Creek
Sylvania
• Interannual variability of NEE is coherent at many but not all sites. This does not hold as well for GEP or ER

Intercomparisons and UpscalingIntercomparisons and Upscaling
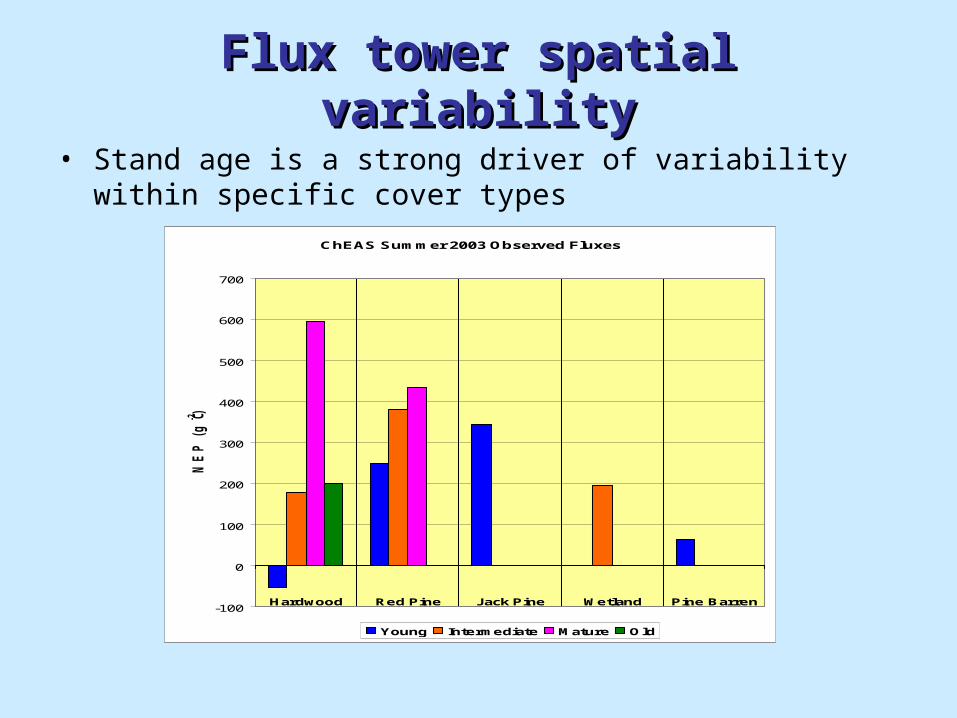
Flux tower spatial variabilityFlux tower spatial variability
• Stand age is a strong driver of variability within specific cover types
ChEAS Summer 2003 Observed Fluxes
-100
0
100
200
300
400
500
600
700
Hardwood Red Pine Jack Pine Wetland Pine Barren
NE
P (
g C
m-2)
Young Intermediate Mature Old
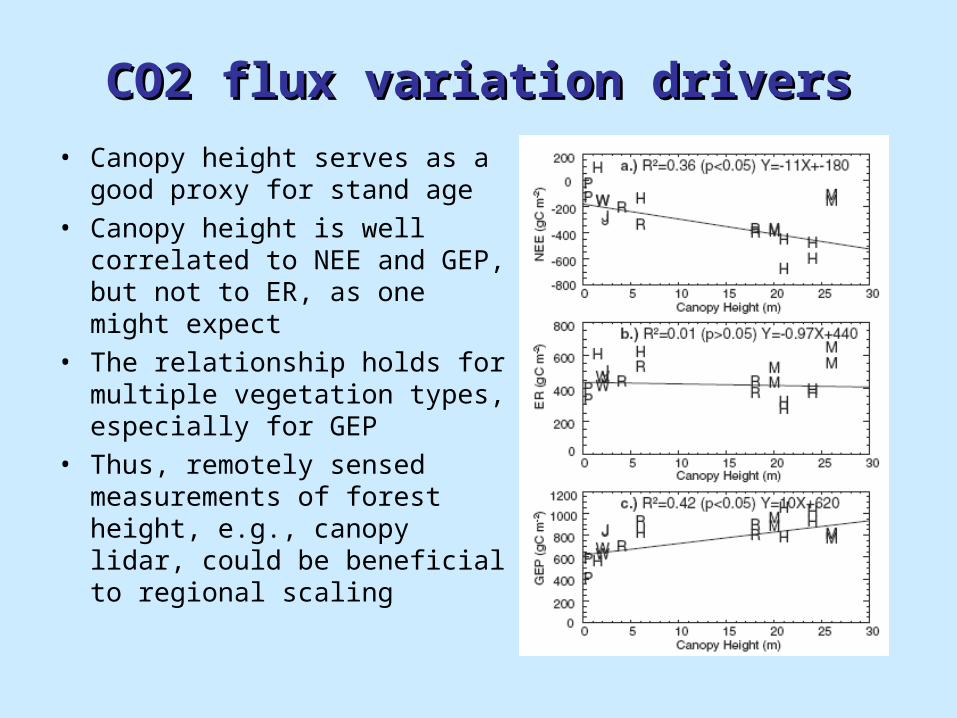
CO2 flux variation driversCO2 flux variation drivers
• Canopy height serves as a good proxy for stand age
• Canopy height is well correlated to NEE and GEP, but not to ER, as one might expect
• The relationship holds for multiple vegetation types, especially for GEP
• Thus, remotely sensed measurements of forest height, e.g., canopy lidar, could be beneficial to regional scaling

Multi-tower aggregation methodMulti-tower aggregation method
• While mature hardwood sites are dominant in the 40-km radius around WLEF region according to FIA and 30-m Wiscland data, wetlands and young and intermediate aspen sites cannot be ignored
ChEAS % Land Cover 40-km radius of tall tower
0%
5%
10%
15%
20%
25%
30%
35%
40%
45%
50%
Hardw ood Red Pine Jack Pine Wetland Pine Barren Other(Ag/Urban/Water)
% c
over
Young Intermediate Mature Old
• Simple method used to aggregate flux tower data using land cover and FIA data and tower derived parameters:

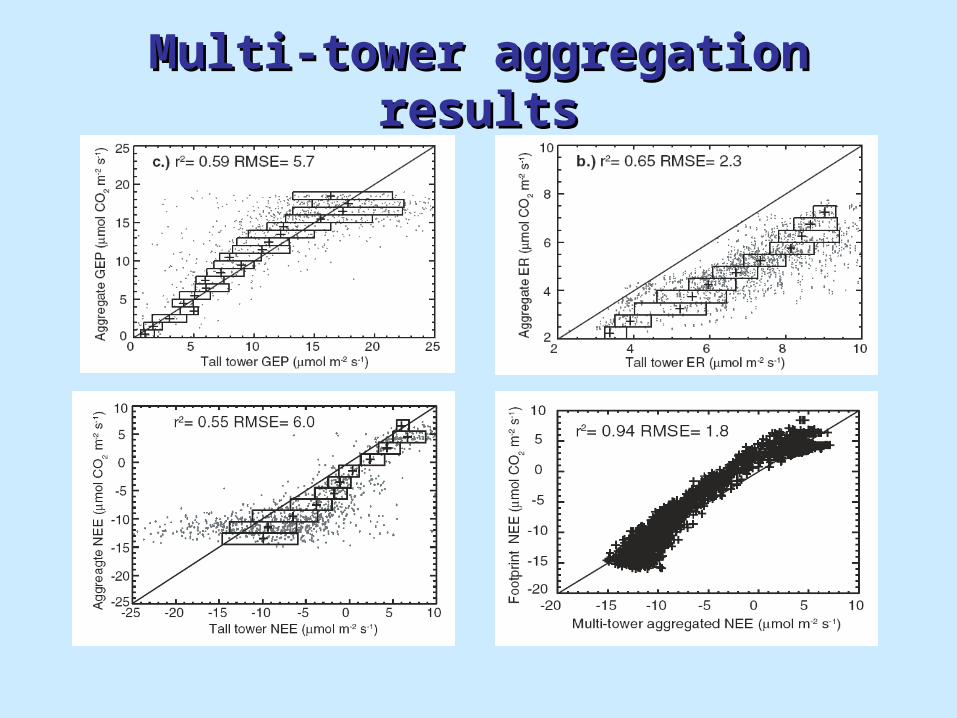
Multi-tower aggregation resultsMulti-tower aggregation results
• Multi-tower synthesis aggregation and footprint weighted decomposition results for 40-km radius are in very close agreement
• Tall tower has greater ER and smaller NEE compared to bottom-up methods
WLEF region bottom-up comparisons Jun-Aug 2003
0
100
200
300
400
500
600
700
800
NEE * -1 ER GEP
gC m
-2
Tall-tower Footprint weighted decomposition Multi-tower aggregation
Multi-tower aggregation resultsMulti-tower aggregation results
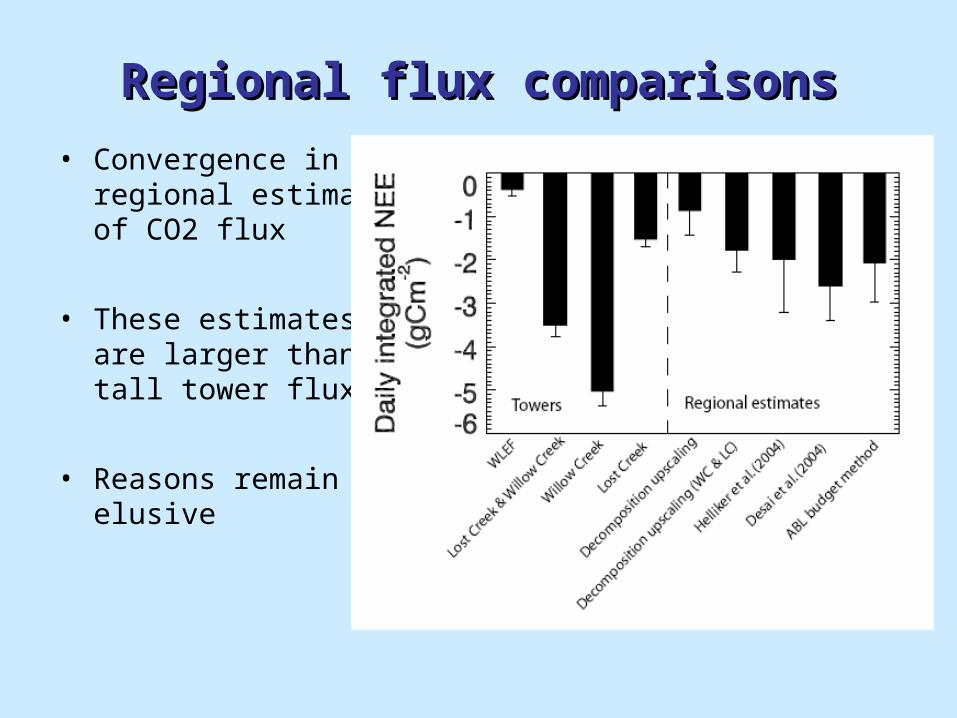
Regional flux comparisonsRegional flux comparisons
• Convergence in regional estimates of CO2 flux
• These estimates are larger than tall tower flux
• Reasons remain elusive

Ecosystem modelingEcosystem modeling
• Competing effects of ecosystem model complexity and data assimilation / parameterization in the upper Midwest– Examine two models
• BIOME-BGC –stand-scale single-layer BGC model• ED – gap-scale model with explicit disturbance/mortality/size• Assimilate ChEAS area ecosystem information• Remotely sensed land cover, phenology• FIA stand age distribution, harvest rates, land use• Component flux optimized PFT rates and decomposition rates
– Compare model to tall tower and other regional estimates• Compare to: multi-tower aggregation, footprint decomposition, ABL
budget based methods• Assess impact of model complexity• Assess role of data optimization, scale, density• Predict future changes in regional CO2 flux

Biome-BGCBiome-BGC
• Daily time step relatively simple biome/stand-scale ecosystem process model
• Stand age and disturbance can be externally prescribed
• Initial work here will be used with more elaborate scaling for currently ongoing roving tower/scaling project by F.A. Heinsch, U. Montana

Ecosystem Demography modelEcosystem Demography model
Moorcroft, P. R, G. C. Hurtt, S. W. Pacala, A method for scaling vegetation dynamics: the ecosystem demography model (ED), Ecological Monographs, 71, 557-585, 2001.
• Explicit consideration of stochastic disturbance events, effect of stand age and mortality

Remote-sensingRemote-sensing
• IKONOS 4-m 10x10 km around tall tower (courtesy B. Cook)
• Legend:

Spatial resolution and land coverSpatial resolution and land cover
• Land cover in region is highly sensitive to resolution due to large number of small area cover types, especially wetlands
• Land cover change is also important due to logging and disturbance
Cover Comparison 10x10 WLEF
0.00% 10.00% 20.00% 30.00% 40.00% 50.00% 60.00% 70.00% 80.00% 90.00%
N. Hardwood
Aspen/Birch
Evergreen
Mixed Forest
Shrubland/Woody savanna
Ag./Grassland
Shrub wetland
Forested wetland
Other wetland
Water
Built-up
Co
ve
r ty
pe
Percent Cover
IKONOS (4m) WISCLAND (30m) MODIS IGBP (1km)
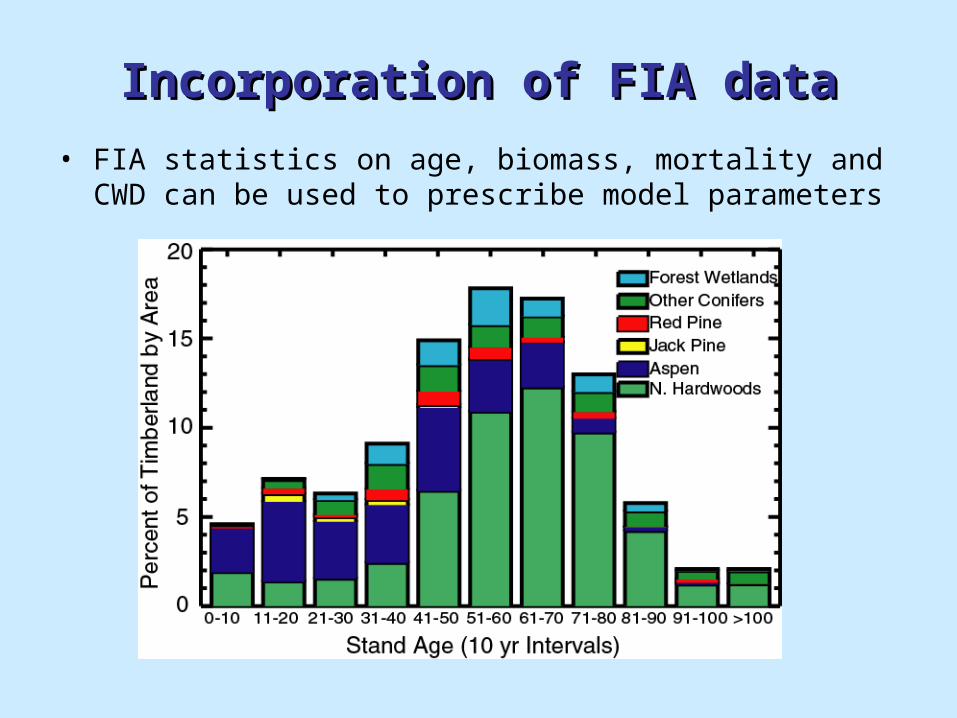
Incorporation of FIA dataIncorporation of FIA data
• FIA statistics on age, biomass, mortality and CWD can be used to prescribe model parameters

Multi-tower ABL budgetMulti-tower ABL budget
• Simple Eulerian models with 1-D ABL depth model and NOAA aircraft CO2 profile data can be used to test ring of tower validity and provide confidence for inversion
• More sophisticated stochastic Lagrangian model, similar to COBRA, to be developed to test methods to assimilate multi-tower synthesis data

ConclusionsConclusions
• Coherent variations in time for NEE across most sites but not as much for ER and GEP
• Stand age, canopy height, cover type can explain large proportion of cross-site variation
• Convergence is seen in bottom-up and top-down regional flux estimates – but they generally differ from tall-tower flux, except when “reweighted” for footprint contribution
• Ecosystem models to be run this summer• Resolution of remotely sensed data can have large impact on
scaling results in heterogeneous region • Simple budget methods with “ring of towers” suggests that more
complex inversions will work• Multi-tower work here complements single-tower footprint and
budget work of W. Wang and tall-tower modeling of D. Ricciuto
Some publicationsSome publications• Cook, B.D., Davis, K.J., Wang, W., Desai, A.R., Berger, B.W., Teclaw, R.M.,
Martin, J.M., Bolstad, P., Bakwin, P., Yi, C. and Heilman, W., 2004. Carbon exchange and venting anomalies in an upland deciduous forest in northern Wisconsin, USA. Agricultural and Forest Meteorology, 126(3-4): 271-295 (doi:10.1016/j.agrformet.2004.06.008).
• Desai, A.R., Bolstad, P., Cook, B.D., Davis, K.J. and Carey, E.V., 2005. Comparing net ecosystem exchange of carbon dioxide between an old-growth and mature forest in the upper Midwest, USA. Agricultural and Forest Meteorology, 128(1-2): 33-55 (doi: 10.1016/j.agrformet.2004.09.005).
• Desai, A.R., Noormets, A., Bolstad, P.V., Chen, J., Cook, B.D., Davis, K.J., Euskirchen, E.S., Gough, C.M., Martin, J.M., Ricciuto, D.M., Schmid, H.P., Tang, J. and Wang, W., submitted. Influence of vegetation and climate on carbon dioxide fluxes across the Upper Midwest, USA: Implications for regional scaling, Agricultural and Forest Meteorology.
• Heinsch, F.A., Zhao, M., Running, S.W., Kimball, J.S., Nemani, R.R., Davis, K.J., Bolstad, P.V., Cook, B.D., Desai, A.R., et al., in press. Evaluation of remote sensing based terrestrial producitivity from MODIS using regional tower eddy flux network observations, IEEE Transactions on Geosciences and Remote Sensing.
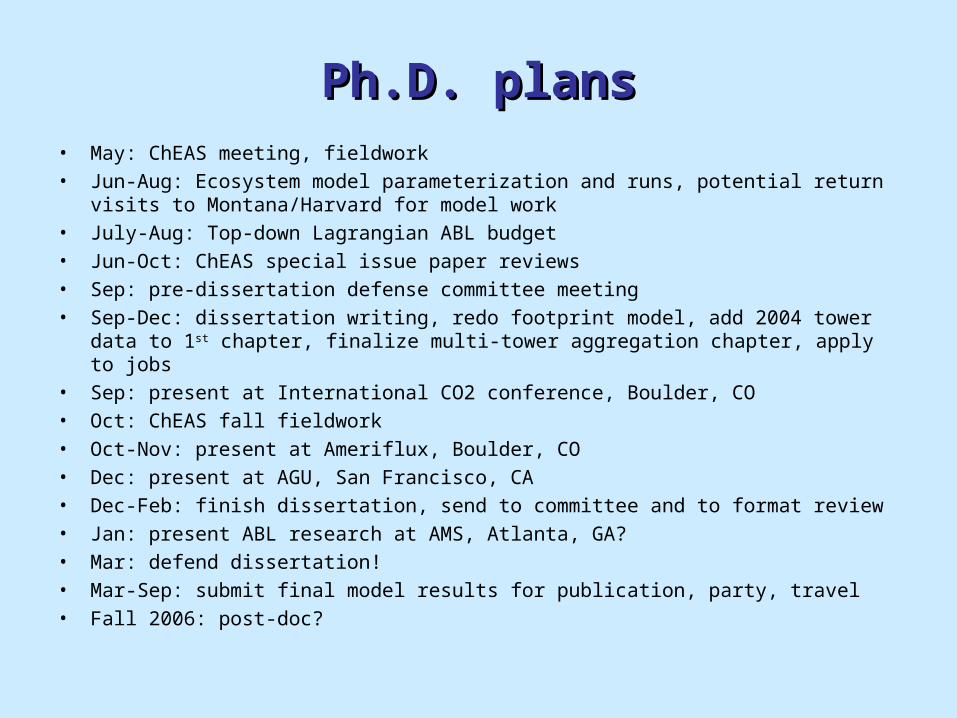
Ph.D. plansPh.D. plans• May: ChEAS meeting, fieldwork• Jun-Aug: Ecosystem model parameterization and runs, potential return visits to
Montana/Harvard for model work• July-Aug: Top-down Lagrangian ABL budget• Jun-Oct: ChEAS special issue paper reviews• Sep: pre-dissertation defense committee meeting• Sep-Dec: dissertation writing, redo footprint model, add 2004 tower data to 1st
chapter, finalize multi-tower aggregation chapter, apply to jobs• Sep: present at International CO2 conference, Boulder, CO• Oct: ChEAS fall fieldwork• Oct-Nov: present at Ameriflux, Boulder, CO• Dec: present at AGU, San Francisco, CA• Dec-Feb: finish dissertation, send to committee and to format review• Jan: present ABL research at AMS, Atlanta, GA?• Mar: defend dissertation!• Mar-Sep: submit final model results for publication, party, travel• Fall 2006: post-doc?

Thank YouThank You
ChEAS
