multi-year expert meeting on transport, trade …unctad.org/meetings/en/presentation/alan...
TRANSCRIPT

Multi-year Expert Meeting on Transport, Trade Logistics and Trade Facilitation
Sustainable Freight Transport Systems: Opportunities for Developing Countries
14-16 October 2015
TOWARDS AN ENVIRONMENTALLY-SUSTAINABLE FREIGHT TRANSPORT SYSTEM: SETTING THE SCENE
by
Mr. Alan McKinnon
Professor and Head of Logistics
Kühne Logistics University (KLU), Hamburg
14 October 2015
This expert paper is reproduced by the UNCTAD secretariat in the form and language in which it has been received.
The views expressed are those of the author and do not necessarily reflect the view of the United Nations.

• HAMBURG| 26 SEPTEMBER 2013
Towards an Environmentally-Sustainable Freight Transport System:
Setting the Scene
Sustainable Freight Transport Systems Meeting UNCTAD
Geneva October 2015
Professor Alan McKinnon
Kuehne Logistics University

5th Assessment Report of the IPCC
Transport:
2010: 7 billion tonnes of CO2
2050: 12 billion tonnes of CO2
2050 limit on CO2 emissions from all activity:
20 billion tonnes
To retain its 14% share transport must
reduce CO2 emissions to
2.8 billion tonnes by 2050
freight transport = one of the hardest sectors to decarbonise
On a BAU basis, freight share of total carbon emissions likely to rise from
7% (2010) to 16% (2050)
Climate Challenge for the Freight Transport Sector
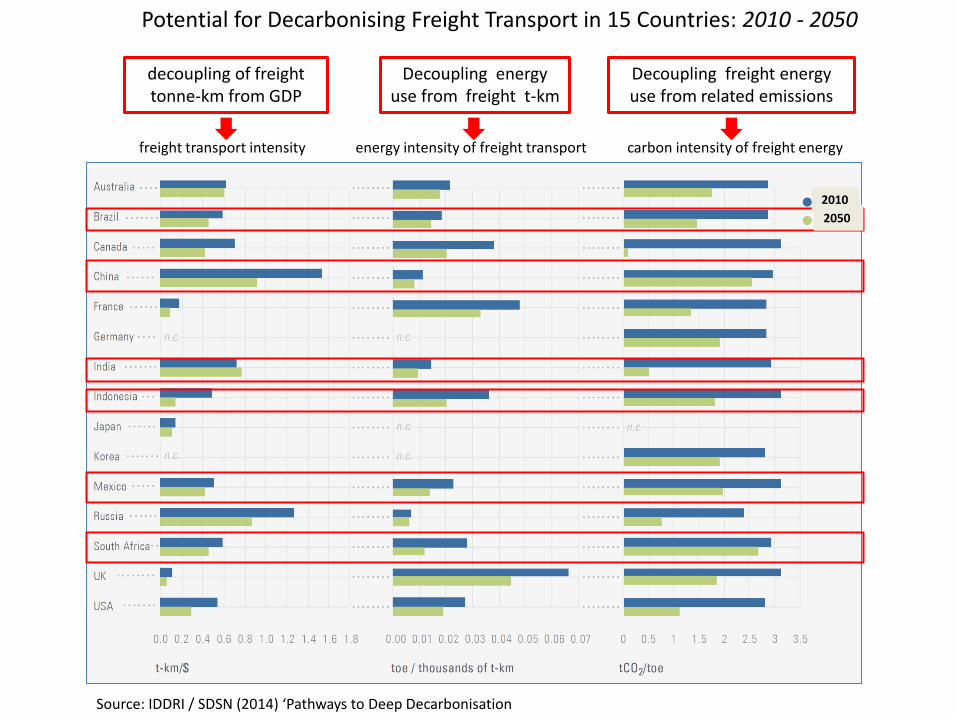
freight transport intensity energy intensity of freight transport carbon intensity of freight energy
Potential for Decarbonising Freight Transport in 15 Countries: 2010 - 2050
Source: IDDRI / SDSN (2014) ‘Pathways to Deep Decarbonisation
decoupling of freight tonne-km from GDP
Decoupling energy use from freight t-km
2010
2050
Decoupling freight energy use from related emissions

Average Exposure to PM10 in 1600 Urban Areas (2008-2013)
Other Freight Transport Pollutants
Transfer of Green Freight best practice from developed to developing countries?

National emissions standards for diesel trucks (2014)
Sulphur content in Diesel Fuel (2014)
0 5 10 15 20
Germany
US
EU (average)
Chile
South Africa
Indonesia
Brazil
Latin America (average)
Mexico
years
average age of
national truck fleet
0
1
2
3
4
5
6
7
Index1 - 7
WEF Global Competitiveness Report 2014-15
Index of road infrastructure quality
International Variations in Green Freight Parameters
Source: www.transportpolicy.net (ICCT / Dieselnet)
Truck
design and
capacity
Tyres

% growth 2014-2024
Average CAGR %
2014-2024
Forecast growth of global truck
market: 2014-2024
Source: Deloittes – ‘Truck Market 2024’
14.6 19.0
25.2
31.0 36.5
14.0 16.0 20.0
25.4
32.5
0.0
10.0
20.0
30.0
40.0
2010 2020 2030 2040 2050
Veh
icle
Po
pu
lati
on
(in
M
illio
n T
ruck
s)
Huo, Wang 2012 ICCT-Roadmap
Projected Growth in Freight Vehicles in China
0
200
400
600
800
1000
1200
2010 2020 2030 2040 2050
LCV
HCV
India: bn vehicle-km freight vehicles

Scope of a Green Logistics Programme
Logistics System Design
Vehicle Maintenance
Driving
Vehicle Loading
Vehicle Routing and Scheduling
Vehicle
Technology
Supply Chain Structure
emissions per vehicle-km
total vehicle-kms
total emissions

Weight of goods
produced / consumed
Weight of goods
transported by road
Road tonnes-lifted
Road tonne-kms
Total vehicle-kms
ENERGY CONSUMPTION
IN FREIGHT TRANSPORT
other noxious gasesgreenhouse gases
modal split
average handling factor
average length of haul
average load on laden trips
average % empty running
vehicle carrying capacity
by weight / volume
vehicle utilisation
on laden trips
split of vehicle-kms by vehicle size, age, weight and type
energy
efficiency
emissions per unit of energy
efficiency of vehicle routing
timing of
deliveries
spatial pattern
of delivery
supply chain structure
level of backhaulage
ENVIRONMENTAL IMPACT OF LOGISTICS OPERATIONS
ENERGY CONSUMPTION IN
WAREHOUSING AND TERMINALS
Driving behaviour
Vehicle technology
Vehicle maintenance
Vehicle purchasing
Logistics-related
vehicle /
technology-specific
Analytical Framework for Green Logistics
emissions per unit of energy
Relationship between
economic output and
logistics-related
externalities

Scoping of Logistics Interventions
logistics = transport
order processing
backloading
horizontal collaboration
port-centric logistics
network design
vertical collaboration
fleet management
vehicle routeing
primary consolidation
recycling
modal split
delivery scheduling
vendor managed inventory
sales and operations planning
packaging
product design
materials handling
sourcing
procurement
cross-docking
transport logistics related operations business single
company
multi-
business
delimiting the boundary around logistics initiatives
outsourcing
control tower

Improvements to transport
infrastructure – mainly road
Centralisation
Increased length of haul
Increased freight transport intensity:
ratio of tonne-km to output
Change in commodity mix
Industrialisation
Lower density / higher value products
Consolidate loads in
larger / heavier vehicles
Stronger just-in-time
pressures
Poorer utilisation of
vehicle capacity
Decline in rail
freight
New industrial /
warehousing
development not
rail-connected
Enhance inter-modal
capabilities
Economic development
Wider sourcing
New patterns of
consumption
Growth in output
Much more freight being moved By less green mode
Higher externalities per unit of freight movedGreater environmental
degradation
Improve fuel
efficiency
Improvements to transport infrastructure
In less full vehicles
Plotting a greener logistics development pathway
conventional pathway
internalise
environmental cost –
rebalance logistical cost
trade-offs
upgrade rail
infrastructure and
services
promote supply
chain collaboration
establish multi-modal
logistics hubs
online freight exchanges
to maximise backloading
land use planning
policies for
logistics
supply chain IT
and analytics to
optimise flows
opportunities for
deviating from the
conventional pathway
IBM supply chain maturity model (2005)
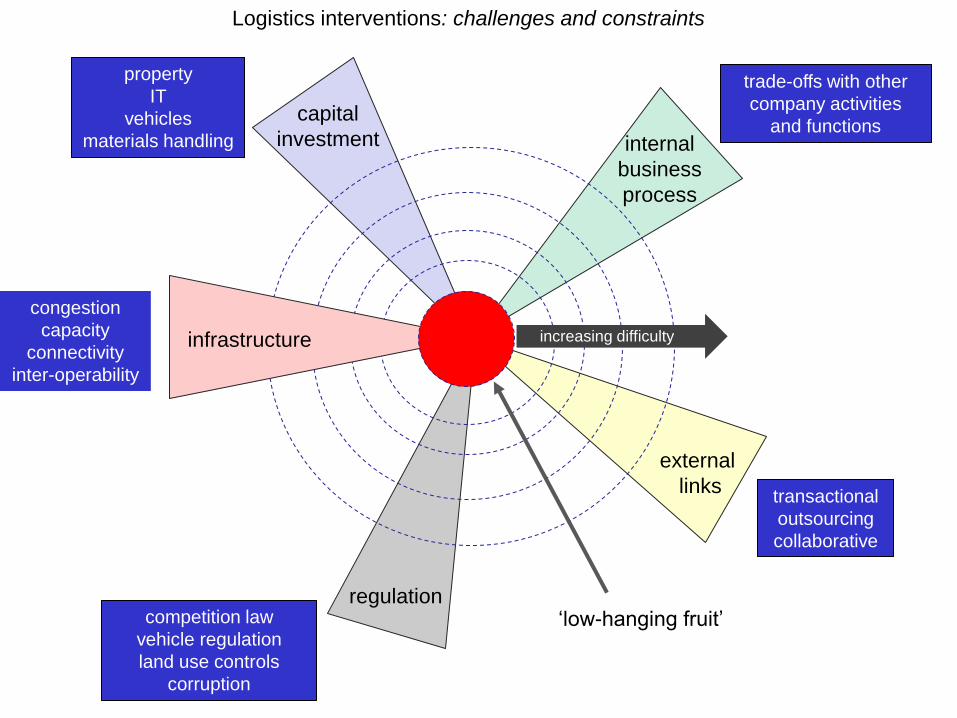
capital
investment internal
business
process
external
links
regulation
increasing difficulty
trade-offs with other
company activities
and functions
transactional
outsourcing
collaborative
property
IT
vehicles
materials handling
competition law
vehicle regulation
land use controls
corruption
Logistics interventions: challenges and constraints
‘low-hanging fruit’
infrastructure
congestion
capacity
connectivity
inter-operability
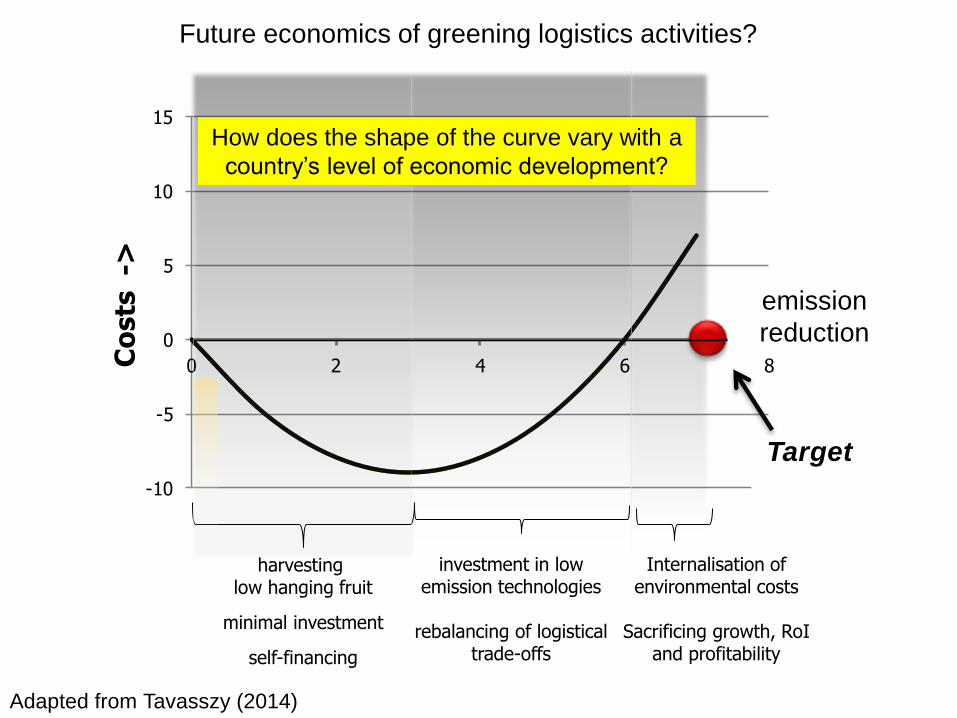
harvesting low hanging fruit
minimal investment
self-financing
Internalisation of environmental costs
Sacrificing growth, RoI
and profitability
-10
-5
0
5
10
15
0 2 4 6 8Co
sts
->
CO2 saved->
Target
investment in low emission technologies
rebalancing of logistical
trade-offs
Future economics of greening logistics activities?
Adapted from Tavasszy (2014)
How does the shape of the curve vary with a
country’s level of economic development?
emission
reduction

Company targets to reduce the carbon intensity of logistics
40% improvement in carbon intensity of global logistics between 2010 and 2020
Reconciling corporate carbon intensity targets with absolute targets of governments
company normaliser time period
% carbon
reduction target
Deutsche Post / DHL ‘every letter and parcel delivered,
every tonne of cargo transported and every sq.m. of warehouse space’
2007-2020 30%
DB-Schenker Tonne-km 2006-2020 At least 20%
UPS UPS Transportation Index 2010-2017 5%
UPS Airlines –Global Pounds of CO2 emitted for every ton of
capacity transported on nautical mile
2005-2020 20%
Fedex (aircraft) available ton mile (ATM) 2005-2020 20%
TNT (Mail and Express) not specified 2007-2020 45%
Maersk Line not specified 2007-2020 25%
NYK ‘unit of transportation from vessels’ 2006-2013 10%
Source: McKinnon and Piecyk, 2012
EU 2011 Transport White Paper target: 60% reduction in TOTAL CO2 from transport by 2050

Technology
Infrastructure
Market
Behaviour
Energy
Regulation
Modal split
Utilisation
Fuel efficiency
Energy mix
categories of external factor decarbonisation lever
TIMBER framework
Assessing the effect of external factors on the decarbonisation of logistics

Technology
Infrastructure
Market
Behaviour
Energy
Regulation
Modal split
Utilisation
Fuel efficiency
Energy mix
categories of external factor decarbonisation lever
TIMBER framework
Assessing the effect of external factors on the decarbonisation of logistics

Assessment of the Influence of External Factors on Logistics Decarbonisation
Europe: Germany / Austria / Switzerland, UK, Netherlands, France, Italy North America: US, Mexico Asia: China, India, Indonesia Africa: South Africa
Clean Air Asia (China)
University of Stellenbosch (South Africa)
Mr. Sudhir Gota (India and Indonesia)
Professor Cees Ruijgrok (Netherlands)
Dr Jacques Leonardi (France)
Publication of final report in November 2015
Kühne Logistics University – the KLU Wissenschaftliche Hochschule für Logistik und Unternehmensführung Grosser Grasbrook 17 20457 Hamburg tel.: +49 40 328707-271 fax: +49 40 328707-109 e-mail: [email protected] website: www.the-klu.org
Professor Alan McKinnon
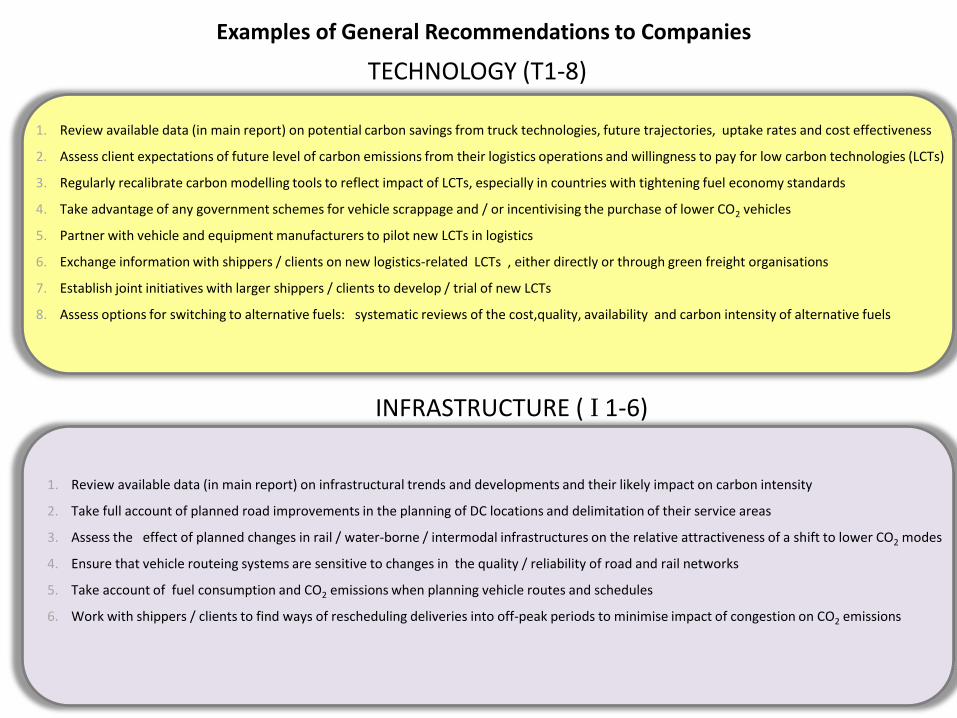
TECHNOLOGY (T1-8)
1. Review available data (in main report) on potential carbon savings from truck technologies, future trajectories, uptake rates and cost effectiveness
2. Assess client expectations of future level of carbon emissions from their logistics operations and willingness to pay for low carbon technologies (LCTs)
3. Regularly recalibrate carbon modelling tools to reflect impact of LCTs, especially in countries with tightening fuel economy standards
4. Take advantage of any government schemes for vehicle scrappage and / or incentivising the purchase of lower CO2 vehicles
5. Partner with vehicle and equipment manufacturers to pilot new LCTs in logistics
6. Exchange information with shippers / clients on new logistics-related LCTs , either directly or through green freight organisations
7. Establish joint initiatives with larger shippers / clients to develop / trial of new LCTs
8. Assess options for switching to alternative fuels: systematic reviews of the cost,quality, availability and carbon intensity of alternative fuels
INFRASTRUCTURE ( I 1-6)
Examples of General Recommendations to Companies
1. Review available data (in main report) on infrastructural trends and developments and their likely impact on carbon intensity
2. Take full account of planned road improvements in the planning of DC locations and delimitation of their service areas
3. Assess the effect of planned changes in rail / water-borne / intermodal infrastructures on the relative attractiveness of a shift to lower CO2 modes
4. Ensure that vehicle routeing systems are sensitive to changes in the quality / reliability of road and rail networks
5. Take account of fuel consumption and CO2 emissions when planning vehicle routes and schedules
6. Work with shippers / clients to find ways of rescheduling deliveries into off-peak periods to minimise impact of congestion on CO2 emissions

potential CO2 reduction
ease of implementation
I5
B4
E6
R6
M7
T5
T6 T7
T8
I2
I3 I4
I6
M1
M3
M5
B3
B1
B5
E2
E3
E5 E8
R3
R4
R5
E7
T1
T2
T4
I1
M2
M4 B2
E1 E4
R1
R2
T3
M6
high low
low
high
Rating of TIMBER recommendations by ease of implementation and potential CO2 saving
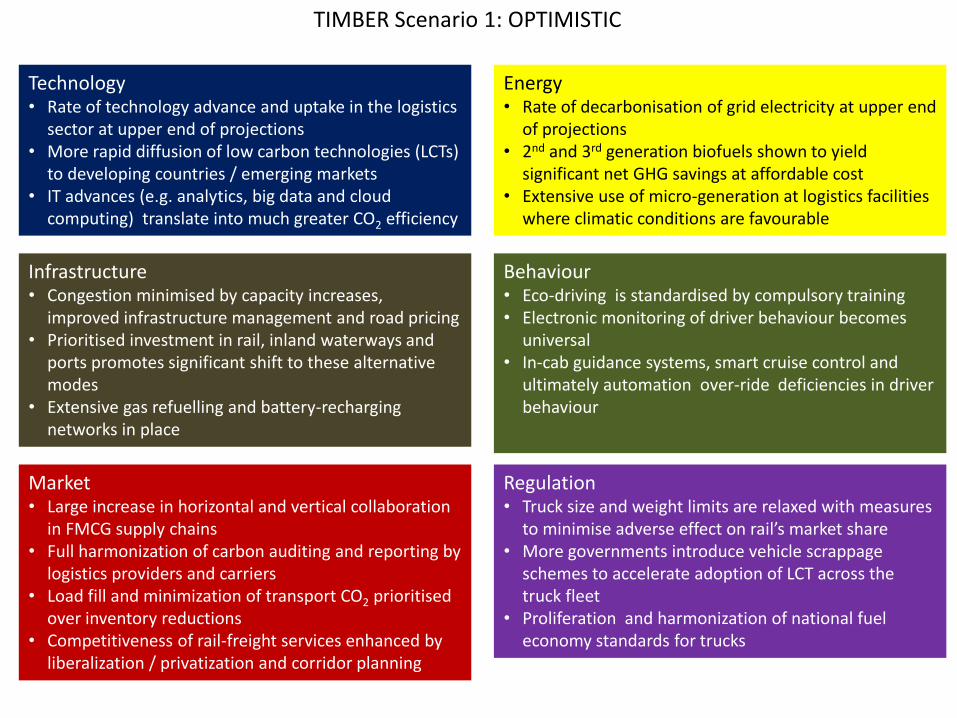
TIMBER Scenario 1: OPTIMISTIC
Technology • Rate of technology advance and uptake in the logistics
sector at upper end of projections • More rapid diffusion of low carbon technologies (LCTs)
to developing countries / emerging markets • IT advances (e.g. analytics, big data and cloud
computing) translate into much greater CO2 efficiency
Infrastructure • Congestion minimised by capacity increases,
improved infrastructure management and road pricing • Prioritised investment in rail, inland waterways and
ports promotes significant shift to these alternative modes
• Extensive gas refuelling and battery-recharging networks in place
Energy • Rate of decarbonisation of grid electricity at upper end
of projections • 2nd and 3rd generation biofuels shown to yield
significant net GHG savings at affordable cost • Extensive use of micro-generation at logistics facilities
where climatic conditions are favourable
Behaviour • Eco-driving is standardised by compulsory training • Electronic monitoring of driver behaviour becomes
universal • In-cab guidance systems, smart cruise control and
ultimately automation over-ride deficiencies in driver behaviour
Market • Large increase in horizontal and vertical collaboration
in FMCG supply chains • Full harmonization of carbon auditing and reporting by
logistics providers and carriers • Load fill and minimization of transport CO2 prioritised
over inventory reductions • Competitiveness of rail-freight services enhanced by
liberalization / privatization and corridor planning
Regulation • Truck size and weight limits are relaxed with measures
to minimise adverse effect on rail’s market share • More governments introduce vehicle scrappage
schemes to accelerate adoption of LCT across the truck fleet
• Proliferation and harmonization of national fuel economy standards for trucks

TIMBER Scenario 2: PESSIMISTIC
Technology • Rate of technology advance and uptake in the logistics
sector at the lower end of projections • Diffusion of low carbon technologies (LCTs) to emerging
markets restricted by cost factors, import controls etc • Business practices and corporate governance prevent
IT innovations from being fully exploited
Infrastructure • Traffic growth exceeds additional infrastructural
capacity increasing congestion and related CO2 emissions
• Limited improvement to rail and water-borne infrastructures as investment in passenger rail, highways and aviation are prioritised
• Gas refuelling and battery-recharging networks are slow and expensive to develop
Energy • Rate of decarbonisation of grid electricity at the lower
end of projections • Transport useage of biofuels remains low due to
concerns about net GHG impacts, land use effects etc • Low ‘feed-in’ tariffs and poor rates of return
discourage micro-generation at logistics facilities
Behaviour • Eco-driving remains patchy, particularly in the
developing world • Adoption electronic monitoring of driver behaviour
proceeds at a slow rate • Use of technology to control vehicle operation is
resisted by trade unions and owner drivers in many countries.
Market • Collaborative initiatives in the FMCG sector stabilise at
a low level because of corporate inertia, managerial scepticism, legal constraints etc
• Comparing the carbon / environmental performance of carriers remains inconsistent and difficult
• JIT pressures intensify in the FMCG sector forcing reductions in load fill and transport-CO2 increases
• Modal shift to rail continues to be inhibited by a lack of competitiveness in the rail / intermodal sectors
Regulation • Strong resistance from the railways and environmental
organisations discourages governments and EU from relaxing truck size and weight limits
• Governments are reluctant to commit the large sums requires to rejuvenate national truck fleets
• National fuel economy standards for trucks remain confined to the US, China and Japan