multiattribute seismic analysis on avo-derived · pdf file · 2015-09-11meters such...
TRANSCRIPT
Prospecting for reservoir zones in mature trends sometimesrequires unconventional exploration tools. AVO has beensuccessfully used as a direct hydrocarbon indicator in someclastic rocks. Lately, AVO inversion for Lamé parameters (λρand µρ) has been shown to enhance identification of reser-voir zones. Furthermore, integration of AVO-derived attributevolumes with other non-AVO-derived seismic attribute vol-umes can provide meaningful geologic information whentied back to well data and verified as correlating with rockproperties. This paper provides a case study of a 3D seismicsurvey in southern Alberta, Canada, where a probabilisticneural network solution was employed on AVO attributes.The results were integrated with other seismic attributes todevelop a more comprehensive interpretation.
The target area is a Lower Cretaceous glauconite-filled(cycles of shales and quartz sandstones) fluvial channel,deposited within an incised valley system. A 3D seismic sur-vey was acquired to create a stratigraphic model consistentwith all available well control and matching the productionhistory. The ultimate goal was to locate undeveloped poten-tial within the gas sands. The field has been producing sincethe early 1980s and two of the earliest, most prolific pro-ducers have begun to water out.
As the objective was stratigraphic in nature, the seismicdata were processed with the objective of preserving rela-tive amplitude relationships in the offset domain to allowfor AVO attribute analysis.
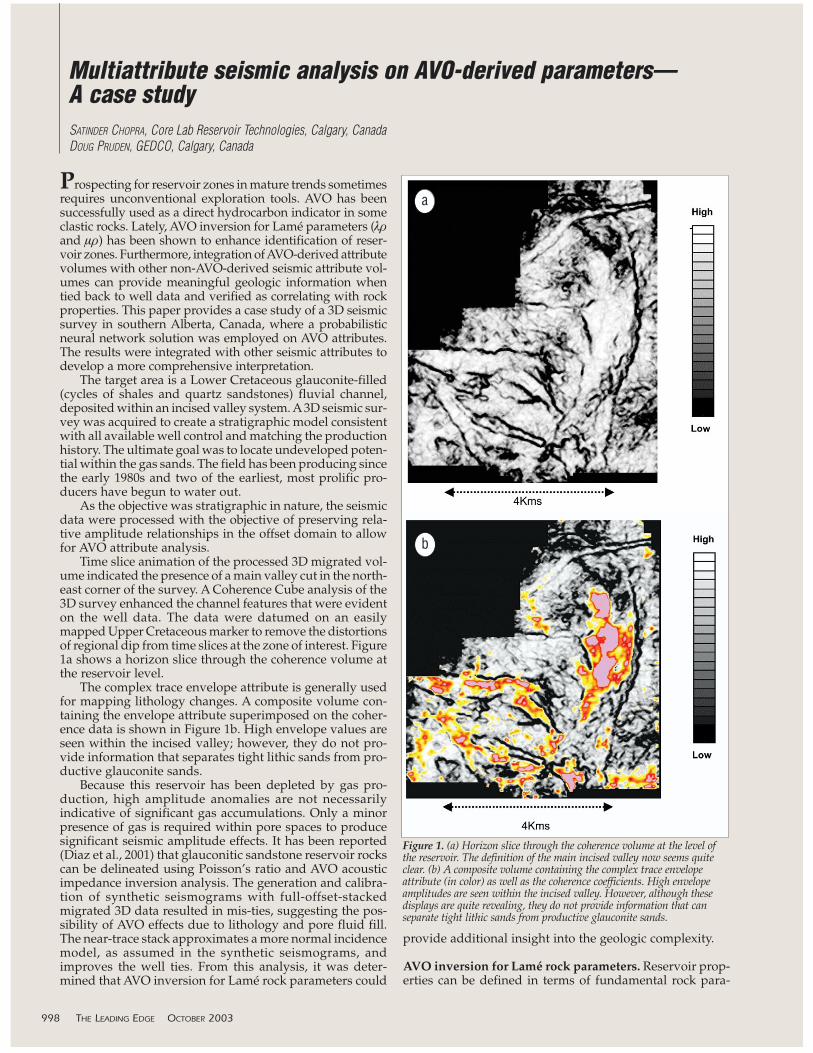
Time slice animation of the processed 3D migrated vol-ume indicated the presence of a main valley cut in the north-east corner of the survey. A Coherence Cube analysis of the3D survey enhanced the channel features that were evidenton the well data. The data were datumed on an easilymapped Upper Cretaceous marker to remove the distortionsof regional dip from time slices at the zone of interest. Figure1a shows a horizon slice through the coherence volume atthe reservoir level.
The complex trace envelope attribute is generally usedfor mapping lithology changes. A composite volume con-taining the envelope attribute superimposed on the coher-ence data is shown in Figure 1b. High envelope values areseen within the incised valley; however, they do not pro-vide information that separates tight lithic sands from pro-ductive glauconite sands.
Because this reservoir has been depleted by gas pro-duction, high amplitude anomalies are not necessarilyindicative of significant gas accumulations. Only a minorpresence of gas is required within pore spaces to producesignificant seismic amplitude effects. It has been reported(Diaz et al., 2001) that glauconitic sandstone reservoir rockscan be delineated using Poisson’s ratio and AVO acousticimpedance inversion analysis. The generation and calibra-tion of synthetic seismograms with full-offset-stackedmigrated 3D data resulted in mis-ties, suggesting the pos-sibility of AVO effects due to lithology and pore fluid fill.The near-trace stack approximates a more normal incidencemodel, as assumed in the synthetic seismograms, andimproves the well ties. From this analysis, it was deter-mined that AVO inversion for Lamé rock parameters could
provide additional insight into the geologic complexity.
AVO inversion for Lamé rock parameters. Reservoir prop-erties can be defined in terms of fundamental rock para-
998 THE LEADING EDGE OCTOBER 2003
Multiattribute seismic analysis on AVO-derived parameters—A case studySATINDER CHOPRA, Core Lab Reservoir Technologies, Calgary, CanadaDOUG PRUDEN, GEDCO, Calgary, Canada
Figure 1. (a) Horizon slice through the coherence volume at the level ofthe reservoir. The definition of the main incised valley now seems quiteclear. (b) A composite volume containing the complex trace envelopeattribute (in color) as well as the coherence coefficients. High envelopeamplitudes are seen within the incised valley. However, although thesedisplays are quite revealing, they do not provide information that canseparate tight lithic sands from productive glauconite sands.
a
b

OCTOBER 2003 THE LEADING EDGE 999
ba
Figure 2. (a) Horizon slice from Lambda-Rho volume showing the suspected gas anomaly. Low values of Lambda-Rho are blue. (b) Horizon slice fromMu-Rho volume showing the suspected gas anomaly. High values of Mu-Rho are yellow and red. (c) Lambda-Rho plotted against Mu-Rho. The yellowpoints come from the yellow polygon which encloses the suspected anomaly in Figures 2a and 2b. The red points come from the red polygon thatencloses all live data points on the horizon slices. The plot shows that the yellow points correspond to low values of Lambda-Rho and high values ofMu-Rho (as expected of a gas anomaly). (d) The points within the purple polygon represent low values of Lambda-Rho and high values of Mu-Rho.These points are highlighted on Figures 2e and 2f, confirming the anomaly. (e) Horizon slice from Lambda-Rho volume highlighting the portions corre-sponding to low values of Lambda-Rho and high values of Mu-Rho (purple polygon in Figure 2d). (f) Horizon slice from Mu-Rho volume highlightingthe portions corresponding to low values of Lambda-Rho and high values of Mu-Rho (purple polygon in Figure 2d).
c d
e f

meters such as incompressibility and rigidity. Goodway etal. (1997) suggested the use of Lambda-Mu-Rho analysis toextract lithology and pore fluid information from seismicand well log data. The basic theory for this analysis has beendiscussed by Burianyk (2000), Goodway (2001), Ma (2001),and Dufour et al. (2002).
P-wave and S-wave impedance reflectivity responseswere estimated by solving the Fatti simplification of theZoeppritz equations:
The VP/VS ratio was estimated from dipole sonic log dataproximal to the area of study.
Impedance reflectivities are related to Lamé parametersof incompressibility (λ) and rigidity (µ) by the relationshipsλρ = Ip
2 - 2Is2 and µρ = Is
2 where ρ is bulk density.The Lamé parameters cannot be directly extracted with-
out an estimation of the density parameter ρ.
Inversion for geologic parameters. AVO inversion asdescribed above yields several seismic attribute volumes whichall contain fluid and lithological information. These volumesare: density scaled compressibility, density scaled rigidity,derived normal incidence P-wave stack, P impedance reflec-tivity, S impedance reflectivity, and fluid factor stack.
Figures 2a and 2b show the Lambda-Rho and Mu-Rho sec-tions with an anomaly enclosed in a yellow polygon. Theplots for these two attributes are also shown in Figures 2c and2d. The yellow dots represent the values within the polygonson Figures 2a and 2b, respectively. The red polygon in Figure2d indicates where we would expect to find gas sands inLambda-Rho and Mu-Rho space. In addition to gas-sand iden-tification, significant lithological information can be derivedfrom the data.
Multivariate statistical analysis can be used as an aid indetermining whether the derived property volumes are relatedto gas saturation and lithology. Our approach examines therelationship between variables to determine whether commonclusters or groupings will form that represent a particularlithology or fluid fill. Figures 2c and 2d show a two-dimen-sional example of this approach in which gas sands tend toseparate themselves in Lambda-Rho, Mu-Rho space (pinkpolygon in Figure 2d). This approach becomes less intuitivewhen more than three variables are considered simultaneously.It is difficult to visualize n-dimensional cross-plot space if nis greater than four even when color is used as a fourth dimen-sional separator. It is within this n > 4 space that clustering orseparation of differing lithology and fluid fill may be mostevident.
Figure 3 is an example of the separation power of clusteranalysis. Within the zone of interest, the value for each of thesix variables has been subjected to a k-means cluster separa-tion analysis, assuming that four distinct classes exist withinthe data set. As can be seen in Figure 3, the cluster separationhas divided the data into separate zones, based on the com-mon relationships between the variables.
This type of unsupervised cluster separation analysis is
often capable of creating useful character mappings of the datain 3D space by reducing a large number of attributes downto one (assigned cluster) that can be visualized on a map. Figure4 is a small subset of the larger 3D that has had this analysisperformed. Different clusters may tend to associate them-selves with differing lithologies which can be verified by welldata.
1000 THE LEADING EDGE OCTOBER 2003
Figure 4. A subset of the 3D volume of the study area that has been sub-jected to K-means cluster analysis. Note that the analysis appears toreveal some lithological information, but the clusters have not yet beensubjected to classification according to the well control.
Figure 3. Lambda-Rho plotted against Mu-Rho with multiattribute clus-ter classifications and posted values at wells within the study area.

Analysis of this type has many inherent limitations. (1) Theresults are sensitive to the number of clusters selected by theuser. Testing is necessary in order to avoid underestimatingor overestimating the number of clusters that adequately rep-resent the data. (2) There is no guarantee that the derived clus-ters have anything to do with the lithology or fluid fill. Theresults must be calibrated to the well control. (3) There is noguarantee that the wells have exhaustively sampled the geo-logic space, or that the existing well control is representativeof the statistical variability of the lithology.
In this area, gamma ray logs are diagnostic of sands andexist for each well. There is also a fairly even sampling of welldata across the field. Therefore a deterministic approach wasfound that allowed us to quantitatively relate the measuredseismic attributes to the gamma ray data. A simple analysisof the relationship of gamma ray values to acoustic imped-ance (Figure 5) suggests that, while a general relationshipbetween the two is visually apparent, it is clearly a nonlinearrelationship. Further analysis of the other attributes with thegamma ray curve produces similar results.
Anonlinear multivariate determinant analysis between thederived multiple seismic attribute volumes and the measuredgamma ray values at wells is a problem ideally suited forneural networks. By training a neural network with a statis-tically representative population of the targeted log responsesand the multiple seismic attribute volumes available at eachwell, a nonlinear multiattribute transform can be computedto produce an inversion volume of the targeted log type.
Using the gamma ray, acoustic, and bulk density log curvesavailable over the zone of interest for the 16 wells, the proce-dure described by both Hampson et al. (2001) and Leiphartand Hart (2001) was employed to derive gamma ray and bulkdensity inversions across the 3D volume.
Discussion of results. The resulting gamma ray inversion isshown on the horizon slice in Figures 6a and 6b (the sameslice shown previously). The data are scaled to API gammaunits in Figure 6a and converted to porosity in Figure 6b usingthe following standard linear density relationship(Schlumberger, 1989):
ρb = φρf + (1-φ) ρma
where ρb = bulk density, φ = porosity, ρma = a clean formationof known matrix density, and ρf = a fluid of average density.
From log data, the sand filled channels are interpreted ashaving gamma values less than 50 API gamma units. This cut-
OCTOBER 2003 THE LEADING EDGE 1001
Figure 5. API gamma-ray values plotted against acoustic impedance.Note the nonlinear nature of the relationship.
Figure 6. (a) Neural network inverted gamma-ray response. The horizonslice is the same as referenced in Figure 1. Note the distinct separation ofsand from silt and shale not imaged in Figure 1. (b) Neural networkcomputed porosity from inverted density response. The horizon slice is thesame as referenced in Figure 1. Note the distinct separation of sand fromsilt and shale not imaged in Figure 1. The density values have beenmasked out for gamma ray values representative of silt or shale, giving arelative porosity indicator for the sands.
a
b

off value was used to mask out inverted density values forsilts and shales. Analysis of Figures 6a and 6b shows threedistinct sand-bearing channels. The coherence time slice indi-cates the boundaries of the channels clearly and the gammaray inversion helps in interpreting major sand bodies withinthe channels.
The incompressibility coefficient λ (Lambda) was deter-mined by dividing the Lambda Rho value by the inverted bulkdensity. The results are represented in Figure 7. High valuesof incompressibility are thought to represent brine and are col-ored blue. Lower (more compressible) values, green, suggestoil and red suggest gas.
Analysis of the rigidity coefficient µ (Mu) suggests thatthe sands observed within the longer, north-south trendingsand body on the eastern half of the survey contain a differ-ent rock type than the sand bodies in the western half of thesurvey. These results are consistent with the observed pro-duction from the two gas wells that penetrate the north-southchannel. The geomorphology of this north-south channel indi-cates that it was deposited during a different depositionalcycle than were the other channels, providing an opportunityfor a different lithology to be deposited.
Conclusions.AVO inversion results for the estimation of Laméparameters were successfully integrated with seismic attributevolumes derived from neural network analysis. The resultswere converted to volumes of log gamma ray and bulk den-sity. These geologically meaningful parameters contributed tothe estimation of relative sand distribution, porosity, and fluidcontent estimates.
Two new drilling locations derived from this work encoun-tered a new gas-charged reservoir, extending the life of thegas pool and adding new reserves to the operating company’sportfolio.
Suggested reading. “Amplitude versus offset and seismic rockproperty analysis: A primer” by Burianyk (CSEG Recorder, 2000).“Rock physics of glauconite and glauconitic sandstone reser-voirs” by Diaz et al. (AAPG Bulletin, 2001). “Integrated geologi-cal and geophysical interpretation case study, and Lamé rockparameter extractions using AVO analysis of the Blackfoot 3C-3D seismic data, southern Alberta, Canada” by Dufour et al.(GEOPHYSICS, 2002). “Detection of gas in sandstone reservoirsusing AVO analysis: A 3D seismic case history using Geostacktechnique” by Fatti et al. (GEOPHYSICS, 1994). “AVO and Lamé con-stants for rock parameterization and fluid detection” by Goodway(CSEG Recorder, 2001). “Use of multiattribute transforms to pre-dict log properties from seismic data” by Hampson et al.(GEOPHYSICS, 2001). “Comparison of linear regression and a prob-abilistic neural network to predict porosity from 3D seismic attrib-utes in Lower Brushy Canyon channeled sandstones, southeastNew Mexico” by Leiphart and Hart (GEOPHYSICS, 2001). “Arobustjoint inversion algorithm for rock property estimation” by Ma(CSEG Recorder, 2001). “Extracting meaningful geologic parame-ters using multiple attribute analysis on AVO derived Lamé rockparameter inversions: 3D seismic case study from southernAlberta, Canada” by Pruden (SEG 2002 Expanded Abstracts). LogInterpretation Principles/Applications (Schlumberger, 1989). TLE
Acknowledgments: We thank Kicking Horse Resources for permission topublish the results of this study. We also thank and acknowledge WendyOhlhauser and Rafed Kasim of Core Lab Reservoir Technologies, Calgaryfor help in processing the 3D survey and AVO analysis respectively.Coherence Cube is a trademark of Core Laboratories.
Corresponding author: [email protected]
1002 THE LEADING EDGE OCTOBER 2003
Figure 7. Computed Lambda representing relative fluid incompressibility.High values of incompressibility such as brine are blue; low incompress-ibility, red, suggests gas.