multicountry study of aedes aegypti · dana a. focks infectious disease analysis gainesville,...
TRANSCRIPT

TDR/IRM/DEN/06.1
Multicountry study of Aedes aegyptipupal productivity survey methodology
fi n d i n gs an d r ecom m en dat i o ns
Mu
lticou
ntry stu
dy o
f Aed
es aegypti pu
pal p
rod
uctivity su
rvey meth
od
olo
gy: fin
din
gs an
d reco
mm
end
ation
s


Multicountry study of Aedes aegypti
pupal productivity survey methodology:
findings and recommendations
Dana A. Focks
Infectious Disease Analysis
Gainesville, Florida, USA
Neal Alexander
Infectious Diseases Epidemiology Unit
London School of Hygiene and Tropical Medicine
London, UK
IN COLLABORATION WITH THE FOLLOWING PRINCIPAL INVESTIGATORS:
Dr. Elci Villegas, Universidad de los Andes, Trujillo, Venezuela
Dr. Claudia ME Romero-Vivas, Laboratorio de Enfermedades Tropicales, Departamento
de Ciencias Basicas Medicas, Universidad del Norte, Barranquilla, Colombia
Dr. Janet Theresa Midega, Kenya Medical Research Institute, Center for Geographic
Medicine Research, Kilifi, Kenya
Dr. Juan Bisset, Instituto de Medicina Tropical Pedro Kouri, Havana City, Cuba
Dr. Amy C Morrison (Proyecto Dengue, Iquitos, Peru), University of California, Department
of Entomology, Davis, California, USA
Dr. Roberto Barrera, Centers for Disease Control and Prevention, Dengue Branch, Division of Vector-Borne Infectious Diseases, San Juan, Puerto Rico
Dr. Philippe Barbazan, Research Center for Emerging Viral Diseases, Center for Vaccine Development, Mahidol University at Salaya, Nakhonpathom, Thailand
Dr. Vu Sinh Nam, General Department of Preventive Medicine and HIV/AIDS Control, Ministry of Health, Hanoi, Viet Nam
Juan I Arredondo-Jiménez, Centro de Investigación de Paludismo, Instituto Nacional de Salud Pública, Tapachula, Chiapas, Mexico

TDR/IRM/Den /06.1
Copyright © World Health Organization on behalf of the Special Programme for Research and Training in Tropical Diseases, 2006.All rights reserved.
The use of content from this health information product for all non-commercial education, training and information purposes is encouraged, including translation, quotation and reproduction, in any medium, but the content must not be changed and full acknowledgement of the source must be clearly stated. A copy of any resulting product with such content should be sent to TDR, World Health Organ-ization, Avenue Appia, 1211 Geneva 27, Switzerland. TDR is the World Health Organization-executed UNICEF/UNDP/World Bank/World Health Organization Special Programme for Research and Train-ing in Tropical Diseases (TDR).
This information product is not for sale. The use of any information or content whatsoever from it for publicity or advertising, or for any commercial or income-generating purpose, is strictly prohibited. No elements of this information product, in part or in whole, may be used to promote any specific indi-vidual, entity or product, in any manner whatsoever.
The designations employed and the presentation of material in this health information product, includ-ing maps and other illustrative materials, do not imply the expression of any opinion whatsoever on the part of WHO, including TDR, the authors or any parties cooperating in the production, concerning the legal status of any country, territory, city or area, or of its authorities, or concerning the delineation of frontiers and borders.
Mention and depiction of any specific product or commercial enterprise does not imply endorsement or recommendation by WHO, including TDR, the authors or any parties cooperating in the produc-tion, in preference to others of a similar nature not mentioned or depicted.
The views expressed in this health information product are those of the authors and do not necessarily reflect those of WHO, including TDR.
WHO, including TDR, and the authors of the health information product make no warranties or repre-sentations regarding the content, presentation, appearance, completeness or accuracy in any medium and shall not be held liable for any errors or omissions in this regard. Any alteration to the original content brought about by display or access through different media is not the responsibility of WHO, including TDR, or the authors.
WHO, including TDR, and the authors accept no responsibility whatsoever for any inaccurate advice or information that is provided by sources reached via linkages or references to this health information product.
Cover colour photos, L to R: WHO/TDR/Kroeger, WHO/M.B. Nathan, WHO/TDR/Kroeger Cover background image: WHO/TDR/Wellcome Trust
Design and layout by Inís—www.inis.ie

Table of contents
Introduction. . . . . . . . . . . . . . . . . . . . . . . . . . . . . . . . . . . . . . . . . . . . . . . . . . . . . . .1
Brief summary of each study. . . . . . . . . . . . . . . . . . . . . . . . . . . . . . . . . . . . . . . . . .5
Venezuela . . . . . . . . . . . . . . . . . . . . . . . . . . . . . . . . . . . . . . . . . . . . . . . . . . . . . . . . .6
Colombia . . . . . . . . . . . . . . . . . . . . . . . . . . . . . . . . . . . . . . . . . . . . . . . . . . . . . . . .11
Cuba . . . . . . . . . . . . . . . . . . . . . . . . . . . . . . . . . . . . . . . . . . . . . . . . . . . . . . . . . . . .12
Kenya . . . . . . . . . . . . . . . . . . . . . . . . . . . . . . . . . . . . . . . . . . . . . . . . . . . . . . . . . . .13
Peru . . . . . . . . . . . . . . . . . . . . . . . . . . . . . . . . . . . . . . . . . . . . . . . . . . . . . . . . . . . .14
Puerto Rico . . . . . . . . . . . . . . . . . . . . . . . . . . . . . . . . . . . . . . . . . . . . . . . . . . . . . . .16
Thailand . . . . . . . . . . . . . . . . . . . . . . . . . . . . . . . . . . . . . . . . . . . . . . . . . . . . . . . . .19
Viet Nam . . . . . . . . . . . . . . . . . . . . . . . . . . . . . . . . . . . . . . . . . . . . . . . . . . . . . . . . 20
Mexico . . . . . . . . . . . . . . . . . . . . . . . . . . . . . . . . . . . . . . . . . . . . . . . . . . . . . . . . . .22
Key findings of the multicountry study . . . . . . . . . . . . . . . . . . . . . . . . . . . . . . . .25
The pupal/demographic survey identifies epidemiologically important and unimportant types of container . . . . . . . . . . . . . . . . . . . . . . . . . . . . . . . . . . . . .26
Containers and sites can be classified using different schema . . . . . . . . . . . . . . . . . .26
Distribution of Ae. aegypti pupae per container is strongly clumped. . . . . . . . . . . . . 28
A potentially important class of container, the rare but extremely productive container. . . . . . . . . . . . . . . . . . . . . . . . . . . . . . . . . . . . . . . . . . . . . . . . . . . . . . . . 28
Survey size requirements to develop a targeted control strategy. . . . . . . . . . . . . . . . .29
Prospects and limitations of the pupal productivity survey methodology . . . . .39
Results are useful in developing targeted source reduction/control strategy for dengue . . . . . . . . . . . . . . . . . . . . . . . . . . . . . . . . . . . . . . . . . . . . . . . . 40
Difficulty of surveying large containers . . . . . . . . . . . . . . . . . . . . . . . . . . . . . . . . . 40
Conclusions, further research, and implications for dengue prevention and control programmes . . . . . . . . . . . . . . . . . . . . . . . . . . . . . . . . . . . . . . . . . . .41
Conclusions . . . . . . . . . . . . . . . . . . . . . . . . . . . . . . . . . . . . . . . . . . . . . . . . . . . . . .42
Further research . . . . . . . . . . . . . . . . . . . . . . . . . . . . . . . . . . . . . . . . . . . . . . . . . . .42
Implications for dengue prevention and control programmes . . . . . . . . . . . . . . . . . .46
References . . . . . . . . . . . . . . . . . . . . . . . . . . . . . . . . . . . . . . . . . . . . . . . . . . . . . . .47


�
Introduction
RATIoNAlE
Dengue fever and the potentially lethal haemorrhagic form of dengue are a fast growing public health problem worldwide (50 million cases with 500 000 man-ifesting shock and/or haemorrhage each year), and particularly important in the Americas and Asia. The only known strategy for reducing dengue transmission is to reduce the vector population, which is achieved through interventions in domes-tic and peri-domestic water containers. However, little is known about the efficacy of interventions targeted to specific classes of water-holding container, and there is uncertainty about the best indicators to use for measuring the success of interven-tions on vector populations.
TDR financed a multicountry study involving nine Latin American, Asian, and African countries, based on the rationale that certain water containers are partic-ularly productive of the dengue vector, Aedes aegypti (L.), and that, therefore, an intervention targeted to these containers would bring vector densities below the threshold for epidemic transmission. This pupal/demographic survey method was described recently.1
The objective of this multicountry study was to evaluate the practicality of the survey method and whether it can consistently identify and classify particularly productive classes of container, and so provide guidance on development of tar-geted control strategies. As will be discussed in greater detail, containers may be classified on any number of criteria such as descriptive name, volume, use, aban-donment, location indoors or out, etc. The results from this study will have impor-tant consequences for the development of improved dengue control strategies.
It is important to emphasize that operationally, pupal/demographic surveys are expected to be conducted infrequently, perhaps only at the beginning of a process to identify the epidemiologically important container classes to target. When tar-geted interventions via community participation methods are under way, the pri-mary survey goal would be simply to determine the actual amount of intervention in place without larvae or pupae being counted.
This document summarizes the large amount of data created by the nine study teams with the goal of serving as a reference text for other researchers as well as for control programmes which are expected to adopt the targeted intervention tech-nique. The document reflects the fact that today, most dengue control efforts are based on suppression of Ae. aegypti and not on eradication; these efforts would ben-efit from answers to the following questions: • How much suppression is adequate to be prophylactic for dengue outbreaks in a
particular location (table 7)? • How do we monitor the degree of suppression achieved in ongoing programmes?
Some have recently been advocating an additional question: • Given that the epidemiological importance of a particular class of container is
the product of the average adult productivity and the abundance of that class of container in the environment, how do we select subsets of containers for inter-vention such that we minimize labour and costs while maximizing reduction of adults?

�
Multicountry study of Aedes aegypti pupal productivity survey methodology: findings and recommendations TDR/IRM/DEN/06.�
And finally, • In developing a targeted strategy, how many households must be surveyed to be
confident that the important container classes have been identified?
Answering the first question involves an understanding of transmission thresh-olds—what they represent and how they are estimated. Thresholds are a function of many factors, but a key factor is the ratio of the numbers of adult Ae. aegypti and people, hence the need for a survey method that permits estimation of this impor-tant variable.2 Because pupae can be counted and are highly correlated with the standing crop of adults, a survey method involving counting pupae and people has been developed.3 Mechanistic and mathematical models of dengue transmission have been developed that allow estimation of transmission thresholds in terms of Ae. aegypti pupae per person as a function of temperature and herd immunity; it is only this statistic that can provide estimates of how much reduction is necessary to be prophylactic for dengue outbreaks (table 7). The practical challenges of obtain-ing this statistic and its usefulness in developing targeted strategies are the subject of this paper.
Several authors have recently made the case that use of the traditional Stegomyia indices as epidemiologic indicators of dengue transmission risk should be aban-doned as they have a number of serious shortcomings.1 The argument is that a pupal and demographic survey that provides an estimate of the number of pupae per person in a community by class of container, e.g. drums, flower vases and pots, cisterns, abandoned containers, discarded tyres, is more appropriate for assessing risk and directing control operations. The ratio of pupae per person is used for sev-eral reasons: • Unlike any of the other mosquito life-cycle stages, it is possible to actually count
the number of Ae. aegypti pupae in most domestic environments (for exceptions, see summary of the Viet Nam study below).
• Container-inhabiting Stegomyia pupae are easily and inexpensively separated from other genera and identified to species as pupae or adults.
• Because pupal mortality is slight and well-characterized, the number of pupae is highly correlated with the number of adults.
• The statistic of pupae per person can be related to transmission risk and provide target levels of reduction required in control efforts.2
The survey method being evaluated in these studies is called the pupal/demo-graphic survey, so named because we count both pupae and the number of people associated with them. In practice, such a survey involves visiting 100 or more resi-dences (see section on survey size requirements below), usually by two inspectors equipped with nothing more than a few litres of clean water, a sieve,� some large-mouth pipettes, a white enamel pan, and small shell vials. The inspectors request permission to examine the water-holding containers in a house, and enquire as to the number of people living in the house (or sleeping there the previous night). With permission, they proceed to strain the contents of each container at the loca-tion, re-suspending the sieved contents in a small amount of clean water in the enamel pan, from where the pupae from each container are pipetted into a labelled vial. If there are other container-inhabiting species in the area besides Ae. aegypti, the contents of each vial are transferred to small cups covered with bridal veil secured with a rubber band; these are held in the lab until the adults emerge, when
� USA standard sieve series, number 30 sieve (equivalent to ASTM designation E11, 600 μm [0.0243"] opening)

�
TDR/IRM/DEN/06.� Multicountry study of Aedes aegypti pupal productivity survey methodology: findings and recommendations
they can be identified. As a minimum, the data recorded for each container include the type of container (drum, bottle, etc.), location (indoors, outdoors, under vege-tation, etc.), method of filling (manually, by rain, roof runoff, etc.), and the number of pupae by species. These inputs are used to develop a classification scheme (see container classification section below). Data are usually summarized by container class on a spreadsheet; for each container class found, simply add up the number of pupae associated with that type in the survey, and divide by the sum of the number of people living in the residences inspected. Sorting the list of container classes by their associated number of pupae per person quickly identifies the productive and non-productive classes of container.
While exhaustive counts of pupae in every container are certainly more labour intensive than simply noting whether a container has larvae and/or pupae (as in the various traditional Stegomyia indices), the pupal/demographic survey permits us to know the number of pupae per person associated with the various classes of container in the environment. This statistic, Ae. aegypti pupae per person by class of container, is not an index after the fashion of the Stegomyia indices, rather it is the epidemiologically significant statistic, the ratio of hosts and vectors; published transmission thresholds permit us to appreciate this statistic in the context of esti-mates of herd immunity and ambient temperatures.2 What each of the studies sum-marized below demonstrates is that some classes of container are more important by virtue of their production of Ae. aegypti adults than others, and that this leads logi-cally to the development of targeted interventions. An earlier publication provides a discussion of the utility of other indices for dengue risk assessment and control.2
The objectives of this document are to: • Summarize the key findings from the nine study sites of the multicountry project
on pupal/demographic survey methodology. • Outline the prospects and limitations of this survey methodology. • Draw conclusions and propose further research and implications for dengue pre-
vention and control programmes.


�
Brief summary of each study
Table 1 lists, for each study, the number of premises surveyed, the dates of the sur-veys, the number and classes of container classified, and the number of Ae. aegypti pupae per person.
TaBle 1. Pupal/demographic surveys, �00�–�00�
CountryPremises surveyed Survey date/season
No. of container classes
identifiedaNo. of Ae. aegypti pupae per person
Venezuela ���9 Apr-May, Oct �004 wetJun �004 dry
9/0 0.4–0.7 wet0.� dry
Colombia �4����6�
Dec �00�–Jan, Jul �004 wetFeb-Mar �004 dry
��/0 �.0 wet0.4 dry
Cuba ��06 Apr-Dec �004 wet/dry 8/8 0.08
Kenya 4�00 Apr-Aug, Nov–Dec �004 wetJan-Mar, Sep–Nov �004 dry
7�/0 �.68�.�8
PeruResidential
�700 6400
�0 08�
Jan �999–Aug �00��0 surveys at intervals of about 4 monthsJan–Nov �004
�4/6 0.��–0.��0.0�–0.�9
PeruNon-residential
��74 Dec �00�–Nov �004(most sites surveyed twice)
�4/6 Not available(no denominator)b
Puerto Rico 6�48�9
May–Jul �004 wetOct–Dec �004 wet
�8/�0�8/�0
0.7��0.7��
Thailand ��6� Nov �004–Feb �00� wetAug-Oct �004, Mar-May �00� dry
�6/4 �.�–�.4(Range �–4)
Viet Nam �9�c May–Jun �004 wet ��/0 4.��
Mexico �600 Sep–Nov �004 wetDec–Mar �00� dry
�6/0 0.��–7.6�
a Number of container classes defined by descriptive name/number of container classes defined by use of some other schema such as volume, abandonment, shade, etc.
b Because the sites were non-residential, it was not always clear what an appropriate denominator would be. Refer to Morrison’s �004 description.6
c Of the �9� households surveyed using quantitative net sampling with field-derived calibration factors, �00 were immediately re-surveyed by absolute census of III/IV-instars and pupae in all containers.

6
Multicountry study of Aedes aegypti pupal productivity survey methodology: findings and recommendations TDR/IRM/DEN/06.�
VENEzuElA
Team: Elci Villegas, Carmen Elena Castillo, Milagros Oviedo, Universidad de los Andes, Trujillo, Venezuela; Audrey Lenhart, Liverpool School of Tropical Medicine, Liverpool, UK.
The objective of the Venezuelan study was to field test the pupal/demographic sur-vey technique as a method for identifying the most productive container habitats for Ae. aegypti. Both the consistency and practicality of this method as a tool for tar-geted control were assessed. The effort involved a longitudinal study comprised of four cross-sectional surveys carried out in the Tres Esquinas neighbourhood of Trujillo city, located 800 metres above sea level in the foothills of the Andes moun-tains in north-western Venezuela. The cross-sectional surveys involved a detailed container survey at the household level. All pupae were collected from containers positive for pupae and/or larvae, and taken to the laboratory where they were iden-tified to sex and species.
In addressing the practicality of the pupal survey technique, an alternative method in lieu of a complete census of pupae was tried for large containers, in which the logistics of pupal collection were difficult. An adaptation of the sweep method described by Tun-Lin et al.4 was employed for highly infested water bar-rels. Sweepers were constructed by attaching fine-mesh netting to a circular steel frame of approximately 30 cm diameter. This was attached to a slim one-metre-long pole. Prior to commencement of fieldwork, a laboratory study of the sweep method was conducted. Typical water barrels containing varying amounts of water (full, 2/3 full, or 1/3 full) were artificially infested with defined numbers of Ae. aegypti pupae (50, 250, or 500). The total number of pupae recovered by the sweep method using both 8 and 10 revolutions with the sweeper were counted for three replicates of each water level and pupal count. The resulting proportions of pupae recovered were used as calibration factors that could then be used to estimate the percentage of total pupae recovered in similar settings in the field.
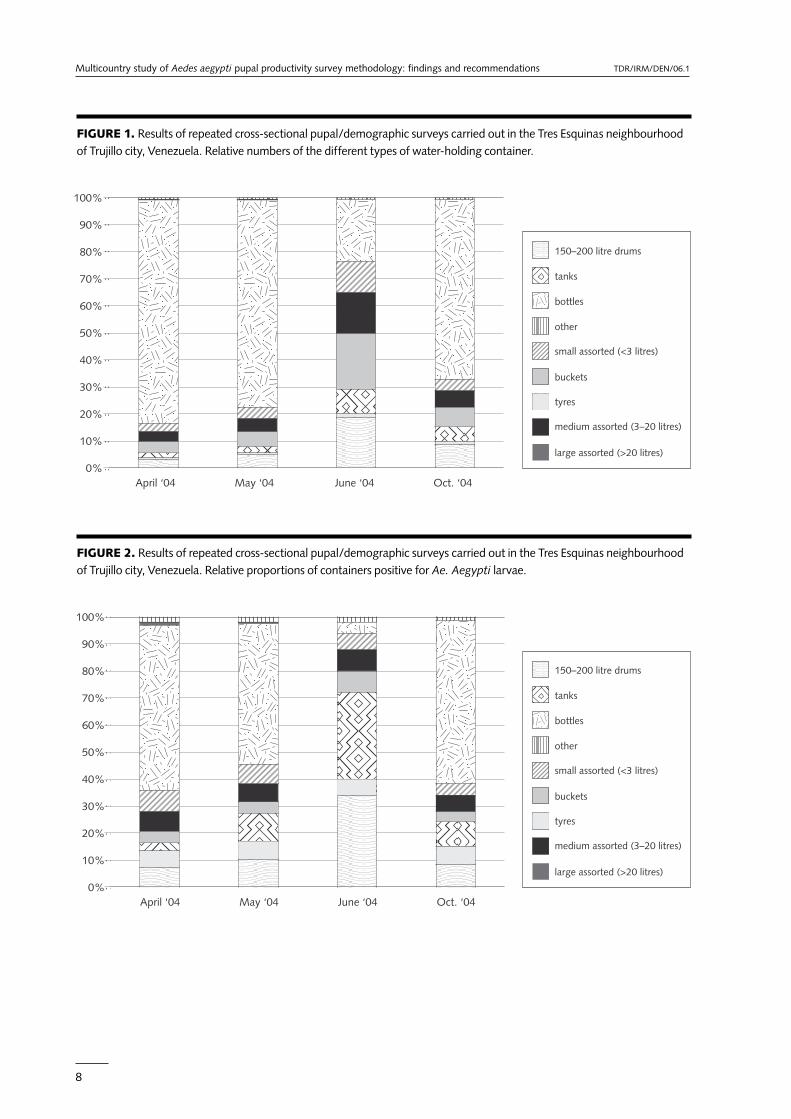
Table 2 presents a summary overview of the survey results, presenting traditional Stegomyia indices as well as Ae. aegypti pupae per person; this table and associated figures 1–4 serve as examples of how to clearly summarize the results of a survey when the goal is to identify key producers in the context of developing a targeted intervention strategy. Note that 20%–33% of households were positive for active Ae. aegypti immatures, that 6%–18% were positive for pupae, and that only 1.5%–2.1% of water containers had pupae.

7
TDR/IRM/DEN/06.� Multicountry study of Aedes aegypti pupal productivity survey methodology: findings and recommendations
TaBle 2. Results of four repeated surveys in the neighbourhood of Tres Esquinas, Trujillo, Venezuela; the data are for Ae. aegypti and represent complete counts of pupae.
Statistic Apr 04 May 04 Jun 04 oct 04
Premises visited �0�� 774 7�7 787
Number of residents 49�� �8�� �7�4 �797
Premises positive for pupae and larvae (HI) �40(��.9%)
��6(�7.9%)
��4(�8.�%)
�97(��.0%)
Premises positive for pupae (HPI) �8�(�7.�%)
86(��.�%)
4�(�.6%)
7�(9.�%)
Number of containers with water �7 �07 9�8� ���7 6�9�
Containers positive for pupae and larvae (CI) �448(8.4%)
667(7.�%)
�7�(7.8%)
740(��.0%)
Number of pupae positive containers (CPI) �0�(�.8%)
���(�.�%)
47(�.�%)
��0(�.�%)
Total number of pupae �404 �69� 94� �0�6
Number of pupae per person 0.7 0.4 0.� 0.�
Breteau Index �.4 0.9 0.� 0.9
The various containers were classified into eight classes, some by descrip-tive name e.g. ‘soda/beer bottles’, ‘tyres’, and ‘water tanks’, and others by size e.g. ‘diverse medium’ and ‘diverse small’ with volumes of approximately 3–20 litres and <3 litres respectively. Figures 1–4 highlight the advantage of the pupal survey. Note (fig. 1) that the class ‘bottles’ is overwhelmingly the most common water-filled con-tainer in the environment, and the most frequently encountered container with lar-vae (fig. 2). Note also that, with the exception of the dry season survey (June 2004, fig. 3), when small rain-filled containers dry out, the ‘bottle’ class is also commonly found with Ae. aegypti pupae. However, in terms of epidemiological significance, bottles pale in comparison to several other classes of container (figs. 3 and 4). In all four surveys, ‘large water barrels’ produced the greatest proportion of pupae (fig. 3). This was most marked in June, when 55% of all Ae. aegypti pupae were pro-duced from barrels. The proportion of pupae in water tanks also greatly increased in June, contributing 31.2% of the total. June marks the beginning of the first dry season, during which piped water is typically rationed and people begin to store large quantities of water, most commonly in barrels and tanks.
The Venezuelan team noted that in each survey, whether in the wet or dry season, barrels produced the greatest number of pupae, suggesting that a year-round inter-vention targeted at barrels should be recommended. Other interventions could be seasonal, targeting important containers prior to the rainy season and prior to the dry season. The easiest containers to target during the wet season (in addition to barrels) would be large buckets, tanks, and tyres. Combined, these containers pro-duced nearly 70% of total pupae during the rainy season (April, May and October). A dry season intervention could focus on only barrels and water tanks, as these pro-duced over 80% of the total pupae. These are all easily identifiable container classes and could feasibly be the focus of targeted, seasonal interventions. The amount of reduction, in terms of Ae. aegypti pupae per person, would vary seasonally as a function of temperature.2
8
Multicountry study of Aedes aegypti pupal productivity survey methodology: findings and recommendations TDR/IRM/DEN/06.�
FIgure 1. Results of repeated cross-sectional pupal/demographic surveys carried out in the Tres Esquinas neighbourhood of Trujillo city, Venezuela. Relative numbers of the different types of water-holding container.
FIgure 2. Results of repeated cross-sectional pupal/demographic surveys carried out in the Tres Esquinas neighbourhood of Trujillo city, Venezuela. Relative proportions of containers positive for Ae. Aegypti larvae.

9
TDR/IRM/DEN/06.� Multicountry study of Aedes aegypti pupal productivity survey methodology: findings and recommendations
FIgure 3. Results of repeated cross-sectional pupal/demographic surveys carried out in the Tres Esquinas neighbourhood of Trujillo city, Venezuela. Relative contribution of different types of container to total Ae. aegypti pupal production.
FIgure 4. Results of repeated cross-sectional pupal/demographic surveys carried out in the Tres Esquinas neighbourhood of Trujillo city, Venezuela. Relative proportions of containers positive for Ae. Aegypti pupae.

�0
Multicountry study of Aedes aegypti pupal productivity survey methodology: findings and recommendations TDR/IRM/DEN/06.�
Regarding rare but especially productive containers (REPCs, see below under ‘key findings’), during the four surveys only two containers were observed with more than 500 pupae. These were both large barrels, one from the June survey and one from the October survey, which contained 538 and 589 pupae respectively. While these were both atypical infestations, this container class was responsible for 57% and 29% of all pupae in the June and October surveys respectively. The next most productive container class was a water barrel from the October survey which contained 171 pupae or 8% of all pupae. This topic is further addressed in the sec-tion covering research needs.
The average number of pupae produced per container class varied over time. Most notably, in water tanks the average number of pupae produced more than doubled, from 28.2 per container in May to 59.0 in June, highlighting the impor-tance of this container during dry conditions. The percentage of containers that were positive for pupae over time was overall more consistent than the percentage of containers containing larvae (figs. 6 and 7); the June dip in containers positive for larvae was more marked than for containers containing pupae. However, the most marked decrease in pupal positivity was seen in tyres during the dry month of June. Since most tyres were encountered in outdoor areas exposed to rainfall, it would follow that in times of less rainfall, fewer tyres would provide adequate breeding sites for Ae. aegypti.
The laboratory study of the sweep method for water barrels showed that eight revolutions with the sweeper yielded the most consistent results. However, the team felt the results were inadequate for calculating a calibration factor for highly infested containers, and this was not pursued since only two containers out of a total of 613 pupae-positive containers over four survey periods could be consid-ered especially productive.

��
TDR/IRM/DEN/06.� Multicountry study of Aedes aegypti pupal productivity survey methodology: findings and recommendations
ColoMBIA
Team: Claudia M. E. Romero-Vivas, Andrew Falconar, Laboratorio de Enfermedades Tropicales, Departamento de Ciencias Basicas Medicas, Universidad del Norte, Barranquilla, Colombia.
The Colombian team conducted sequential pupal/demographic surveys during the wet (number of premises surveyed = 3433) and dry (number of premises surveyed = 3563) seasons in three neighbourhoods: Los Olivos, Rebolo, and Siape, in the coastal city of Barranquilla (table 1). All premises in Rebolo and Siape had piped water and were connected to the sewerage system. In contrast, 3% of the premises in Los Olivos had no piped water and 8% of the premises were not connected to the sewerage system, but had either septic tanks or latrines. A total of 131 336 water-filled containers were inspected and a total of 16 336 Ae. aegypti pupae observed.
Analysis of the pupal/demographic survey gave the team insight into production patterns in Barranquilla that would be useful in designing a targeted intervention: (1) The most common container class, bottles, accounted for 82.2% of all water-
filled containers but was responsible for only about 0.1% of Ae. aegypti pupae. Another container that could be safely ignored is the elevated water storage tank, in which no pupae were ever observed—perhaps due to lethal tempera-tures produced during day-long exposure to direct sunlight.
(2) Probably no effort should be directed at flower vases as this class of container accounts for only 2.7% of all pupal production; and besides, it would be intru-sive to the homeowner.
(3) Two targeted classes, ground tanks and drums, accounted for only 4.3% of the containers surveyed and yet were responsible for production of 81% of Ae. aegypti.
(4) In addition to controlling ground tanks and drums, adding a sanitation cam-paign to remove discarded and used containers including tyres (12.8% of all containers) would eliminate an additional 16.3% of pupal production. This would bring the total elimination of mosquito production to 97.3% if com-pletely effective.
(5) Note that a strategy of focusing on different container classes as a function of their abundance and ignoring their productivity of adult mosquitoes, i.e. of eliminating all used and discarded containers including bottles, would elimi-nate only 16.3% of Ae. aegypti production but would involve removing some 95% of all containers in the environment.
Properly administrated therefore, the strategy outlined in (3) alone would undoubt-edly eliminate current transmission.
Because much of the production of Ae. aegypti took place in large containers that were difficult to survey, the authors were interested in comparing actual counts of pupae with estimates based on a sweep-net technique using calibration factors that were empirically estimated during an earlier study.5 Correlation analysis indicated that about 90% of the variability in estimated counts could be attributed to the cen-sus counts. However, accuracy was seen to be a function of container type and level of water within the container; about a 50% difference between estimated and abso-lute counts was seen in small ground tanks, whereas in large tanks, the difference was 110%. The team recalibrated their conversion factors and thought they were sufficiently accurate to be used operationally. What is as yet unknown, however, is how applicable these conversion factors would be in other areas of Barranquilla or Colombia.

��
Multicountry study of Aedes aegypti pupal productivity survey methodology: findings and recommendations TDR/IRM/DEN/06.�
CuBA
Team: Juan Bisset (principal investigator), Maria del Carmen Marquetti, Silvia Suarez and Maria Magdalena Rodriguez, Instituto de Medicina Tropical Pedro Kouri, Havana City, Cuba; Harish Padmanabha, Harvard University, Boston, Massachusetts, USA.
The study was conducted in Playa, Havana City, a site with low but persistent pop-ulations of Ae. aegypti (table 1). In addition to evaluating the pupal/demographic survey methodology, the team documented the characteristics of containers associ-ated with high production and the ecological character of productive premises and blocks.
Compared to surveys in other countries, Ae. aegypti populations in Playa are unu-sually low (0.08 pupae per person, see table 1); of 2506 premises surveyed on 32 blocks, 57 premises (2.2%) and 26 blocks (81.3%) were positive. Of the 70 positive containers found, only 11% were located indoors; this is attributed to potable water being stored indoors in well maintained, clean, and lidded containers. Approxi-mately 78% of production was from containers that were abandoned, i.e. were not currently in use. The most common water-holding containers were ground tanks (31.1%) and small artificial containers (41.9%). In terms of epidemiological signifi-cance, the importance of a container vis-à-vis dengue is a product of the abundance of that particular class of container and the associated average crop of Ae. aegypti pupae. In Playa, ground tanks and small artificial containers accounted for 93% of all production.
As discussed below, the number of Ae. aegypti pupae per container does not have a normal distribution, rather it is highly clumped, with most containers usu-ally having no pupae or just a few pupae and the odd container having many. The Cuban study illustrated that, at the scale of the block, the distribution of Ae. aegypti pupae is also clumped; of the 26 blocks that had pupae, 20 had 20 or fewer pupae while the three highest blocks had 74–185 pupae.
In terms of the utility of the pupal/demographic survey, the Cuban team noted only a low correlation between pupal measures (pupae per person or per hectare) and the traditional Stegomyia indices; they concluded that the traditional measures were largely unrelated to the actual density of Ae. aegypti and the threat of transmis-sion. Analysis indicated that the traditional measures would: (1) identify correctly the importance of one class of container; (2) misidentify two other classes as being important when in reality they accounted for only 3% of adult production; and (3) would not identify as significant two other container classes which accounted for almost half of all production.
Based on the pupal/demographic survey results, the team developed a targeted control strategy involving only three classes of container; this sanitation strategy would reduce Ae. aegypti densities by an estimated 90%.

��
TDR/IRM/DEN/06.� Multicountry study of Aedes aegypti pupal productivity survey methodology: findings and recommendations
KENyA
Principal investigator: Janet Theresa Midega, Kenya Medical Research Institute, Center for Geographic Medicine Research—Coast, Kilifi 802108, Kenya.
The Kenyan team conducted a longitudinal study with four cross sectional sur-veys in urban, peri-urban, and rural areas of Malindi District, along the Kenyan Coast. Malindi district is located on the shores of the Indian Ocean, 108 km north of Mombasa; it has a population of about 225 800. During each survey, domes-tic containers on a total of 1050 premises (350 per site) were examined (table 1). A hierarchical system was used for classifying the containers: indoor vs. outdoors, then by descriptive name, and then, within this, by volume.
It was concluded that the pupal/demographic survey was a suitable and practical tool for identifying the container classes which contribute the highest numbers of Ae. aegypti pupae. The method was used to document spatial variation in the most productive container classes by location (indoors vs. outdoors, urban, peri-urban, or rural), and temporal variation by season (wet vs. dry). The number of Ae. aegypti pupae per person varied seasonally (3.68 and 1.58 for the wet and dry seasons, respectively) and as a function of location (urban [1.83], peri-urban [1.78], or rural [6.52]). This team too encountered a few extremely productive containers, e.g. the water trough in the rural site during survey 4 can be classified as an REPC (rare but extremely productive container). Overall, the outdoor jerrycan, metallic drum and tyres were found to be the most epidemiologically important container classes with consistent pupal productivity over the wet and dry seasons, and are suggested as some of the key containers to be targeted by vector control interventions.

�4
Multicountry study of Aedes aegypti pupal productivity survey methodology: findings and recommendations TDR/IRM/DEN/06.�
PERu
Team: Amy C. Morrison (principal investigator: Proyecto Dengue, Iquitos, Peru), Helvio Astete and Thomas Scott, University of California, Department of Entomology, Davis, California, USA; Peter Boldenow, University of Michigan School of Public Health, Ann Arbor, Michigan, USA; Moises Sihuincha and Elvira Zamora, Laboratorio de Referen-cia Regional de Salud de Loreto, Peru; Jeffrey Stancil and James Olson, US Naval Medical Research Institute Detachment, Lima, Peru.
The overall goal of the Peru studies was to evaluate the consistency and practical-ity of the Ae. aegypti pupal/demographic survey for use in determining the most productive classes of container in the Iquitos environment. Iquitos (population 350 000 in 1993) is located in the western Amazon basin rainforest in NE Peru; it is accessible only by river and air (table 1). The TDR-funded work builds on a five-year longitudinal US National Institutes of Health (NIH)-funded entomolog-ical study of dengue. In this earlier study,6 approximately 6000 households from eight regions of the city were surveyed 13 times for larvae, pupae, and adult Ae. aegypti. The TDR-funded project had two goals: data analysis of the existing data-base from the NIH project to elucidate sampling size requirements for targeted strategies (aims 1 and 2, below); and additional entomological surveys using the pupal/demographic technique to evaluate production patterns at non-residential or difficult-to-survey sites (aims 3 and 4, below).
Aim 1: To determine the most appropriate sample size and strategy for reliable estimation of pupal productivity patterns Computer simulation experiments were initiated to determine the optimal sam-ple size based on 100 replicate sets of geographically stratified random sub-samples ranging in size from 1000 houses (1.6% of total) to 59 458 houses (98% of all houses). Based on a comparison of pupae per house for each container class in each sample with pupae per house for each container class for the entire data set, a Ken-dall correlation coefficient and a Spearman correlation coefficient were calculated for each sample. The results indicated that a minimum sample size of 33%–50% of all houses would be necessary for predicting pupal production patterns with some confidence. Even under these conditions however, container classes with highly variable production patterns could skew the conclusions (manuscript in prepara-tion). Peter Boldenow is pursuing this research on sample size methods. This work should be compared with similar sample size efforts of the team in Puerto Rico (summarized below), and with that of the authors of the current report (see below under ‘key findings’).
Aim 2: To determine if the average crop of Ae. aegypti pupae per container from detailed surveys can be used to estimate entomological risk for other areas or the same area at different periods of time by applying the estimates to simple censuses of humans and water containers by class. Significant differences in pupal production patterns were observed between sequential surveys at the same location and significant differences were also seen between residential areas. The team recommended that surveys used for estimating production patterns be well stratified geographically and temporally.

��
TDR/IRM/DEN/06.� Multicountry study of Aedes aegypti pupal productivity survey methodology: findings and recommendations
Aim 3: To characterize the pupal productivity patterns in non-residential and infrequently sampled sites. Two replicate surveys of non-residential sites, including schools, factories, ports, public markets, gas stations, commercial zones and recreational areas, were con-ducted to compare pupal production patterns with those of residential sites. Production patterns by container type and characteristics varied with the type of site and from the patterns observed previously in residential sites. In general, non-traditional containers (drains, puddles, plastic tarpaulins) were responsible for a higher proportion of production in recreational sites, ports, markets, and indus-trial sites than in residential sites. Large tanks and medium storage containers were proportionally more productive in markets, ports, and industrial sites, while plastic containers were less important with the exception of commercial and school sites, where they were equally productive as in residential sites. Overall variation in pupal production patterns was high between surveys, and based in many cases on collec-tions of relatively low numbers of pupae.
Surveys of vacant lots and abandoned houses, sites not commonly examined, revealed low densities of Ae. aegypti and containers. Twenty-eight sites were sur-veyed, and of these, 26 had water containers but only one was positive for Ae. aegypti. This positive container was plastic and contained 81 pupae. More relevant, however, was the fact that 13 of the sites had no containers at all. The Peru team recommends surveying these sites if possible, but their data indicate that inabil-ity to survey the sites probably does not impact significantly on estimates of pupal production.
A potential bias in Ae. aegypti surveillance, passing over closed houses, was eval-uated by revisiting 129 previously uninspected residences. The team concluded that these houses had characteristics very similar to those observed in other sites in the area.
Aim 4: To further refine targeted control strategies proposed for Iquitos The Peruvian team investigated several variables for classifying containers: (1) if the container is considered useful or not; (2) if the container is located under a roof; (3) if the container is located under or within 1 metre of vegetation; (4) if the container has the insecticide temephos (Abate®) in it; and (5) if the container has organic material (scaled as 0, +, ++, or +++).
Their conclusions were as follows: • Lid status, container location (indoor/outdoor), and fill method (passively rain-
filled, actively rain-filled, manually filled) remain the most informative variables for productivity and development of a targeted control strategy in Iquitos.
• Proximity to vegetation and presence of organic material are important covariates for presence of pupae and could be included in targeted control strategies.
• Production in ‘not useful’ containers represents the most important category for pupal production in Iquitos. Targeted control strategies should incorporate this information.

�6
Multicountry study of Aedes aegypti pupal productivity survey methodology: findings and recommendations TDR/IRM/DEN/06.�
PuERTo RICo
Team: Roberto Barrera, Manuel Amador, and Gary G. Clark, Centers for Disease Con-trol and Prevention, Dengue Branch, Division of Vector-Borne Infectious Diseases, San Juan, Puerto Rico.
The study involved two surveys of mosquito immatures in outdoor containers (table 1) in urban areas on the coast of the Caribbean Sea, southern Puerto Rico. The following data were recorded for each container with water: generic or descrip-tive name, container use, water volume and temperature, presence of early instars (I/II), number of advanced instars (III/IV), and pupae. Also recorded were: source of water (manually-filled, direct rain, rain through foliage, rain off the roof), sun exposure (full, partial, shade), material (plastic, metal, porcelain, glass, cement/clay, rubber, cloth/paper, plant), and presence of tree canopy (identified to spe-cies) over the container. As in the Peruvian study, extensive statistical analyses were conducted.
The hypotheses tested were: • Most pupae of Ae. aegypti are produced in a few classes of container (container
type, container use, two-step cluster analysis of container variables) and in a few premises (two-step cluster analysis of premises and their containers), such that vector control efforts could concentrate on eliminating the most productive con-tainers to prevent dengue outbreaks.7
• Ae. aegypti pupal productivity is influenced by aquatic environmental factors and by the density of immature mosquitoes.8 The sample size (premises, contain-ers) required for a reliable estimation (10%–20% precision) of proxy variables (female pupae per premise, pupae per type of container) was also investigated using various approaches (Barrera et al., unpublished).
The hypothesis that most pupae of Ae. aegypti are produced in a few classes of con-tainer was supported by the data for container type (80% of pupae were found in large and small buckets, plastic sheets used to cover large objects, discarded imple-ments, toys, and drums) and container use (more than 75% of pupae were found in discarded containers, ornamental vessels, cover sheets, and toys), and from clus-ter analysis (more than 75% of pupae found in containers—mostly unattended or discarded containers in yards—in two of four clusters). It was also found through cluster analysis that a few premises (6%) with large yards, a number of trees, and containers with a large volume of water, had more than 60% of all Ae. aegypti pupae. These results are consistent with observations from Australia.9 The team also reported that the yards of inhabited premises, as opposed to public areas, were most productive of Ae. aegypti. An important finding in both surveys was that some uncommon containers had unusually large numbers of Ae. aegypti pupae, thus determining a weak correlation between the abundance of container types and their numbers of pupae. It was also shown, using the number of Ae. aegypti larvae, that the Breteau Index, or the presence of immature stages as indicators of pupal pro-ductivity, is not as efficient in identifying the most productive types of container as the direct pupal count.
Pupal productivity was greater in premises with more trees, in containers with larger volumes of water, and at lower water temperatures. Larval and pupal abun-dance was greater in containers with leaf litter or algae, and varied with the species of tree. Aedes aegypti larvae and pupae were correlated but there was a negative rela-tionship between larval density and mass of emerging females. Factor analysis sug-gested that food limitation and/or competition could be limiting factors in many

�7
TDR/IRM/DEN/06.� Multicountry study of Aedes aegypti pupal productivity survey methodology: findings and recommendations
containers, but in some containers (with large water volumes and low tempera-tures) there was no negative larval density effect and emerging females did not seem to have been under nutritional stress. Most Ae. aegypti females emerging in the field from a variety of unmanaged container types had an average body mass compara-ble to females produced in the laboratory with the lowest feeding regime. Previous field studies had reported the importance of food limitation or larval competition in water storage containers.10 The results of this study showed that nutritional stress is important as a limiting factor for Ae. aegypti in this area where water storage con-tainers were uncommon.
In the two surveys (May–July vs. October–December), the team observed dif-ferences in the number of water containers and the mean number of Ae. aegypti pupae per container; however the number of pupae per residence was not statisti-cally different. During the second survey, most female pupae came from discarded containers (>70% of all pupae). Thus the observed temporal change in pupal pro-ductivity per class of container did not change the conclusion that reduction of a few classes of container could eliminate an important proportion of the female pupae population.
The team addressed the question of what sample size is required for a reliable estimation of the mean number of female pupae of Ae. aegypti per container (15% in error of the true mean—i.e. the mean of the complete dataset—with 95% C.I.). They used traditional statistical inference techniques based on the parameters of negative binomial distribution and concluded that the sample size required was 3500 containers or more than 3000 premises in Salinas (actually more premises than those in town [1344]). A similar result was reported from India.11,� Thus the authors used two approaches: (1) random sub-sampling of the database with increasing sample size and observing the point at which statistical parameters sta-bilized; and (2) sequential sampling. Specifically the team wanted to know how the estimated relative abundance of the most productive containers would change with sample size.
Assuming that the sample of 624 premises was a large enough proportion of the total (1344) to have achieved low sampling error, they randomly sampled the database while gradually increasing the sample size to obtain 5%, 10%, 15%, 20%, 30%, 40%, 50%, 60%, 80% or 100% of the total sample. For each sample size, the percentage of each of the ten container types (the classification scheme based on use) was calculated and compared with the profiles of container types among sam-ple sizes. The relative abundance of the most common containers varied little with sample size, as opposed to the less common containers (fig. 5). Also, as sample size approached the total sample size, the profiles varied little, and the structure of con-tainer types seemed to stabilize at sample sizes greater than 30% (>180 premises). The conclusion was that a moderate sample size would be required to assess what containers are the most abundant in an urban area. Using a similar approach to evaluate the number of pupae per container, the authors concluded that statistical parameters stabilized above a sample size of 680 containers with water.
A sequential sampling approach was employed using the alternative hypotheses that mean female pupae per premise was less than or equal to 0.10 (an arbitrarily set safe level) or greater or equal to 0.19 (an estimate of the dengue epidemic thresh-old for the study area—Focks et al., 20002), and statistical parameters were calcu-lated from the whole samples. It was determined that pupal densities were above the threshold (female pupae/person ≥ 0.19) after sampling only 25 or 125 premises
� A finite population correction is now available (Alexander et al., in press15). This ensures that the calcu-lated sample size does not exceed the total number in the population.

�8
Multicountry study of Aedes aegypti pupal productivity survey methodology: findings and recommendations TDR/IRM/DEN/06.�
for the first and second surveys respectively. Thus, sequential sampling provided substantial reductions in the sample size required to determine if vector control was needed. Further validation of the Ae. aegypti thresholds required for dengue trans-mission could confer viability and efficiency to dengue vector surveillance and con-trol programmes. From these results, a targeted strategy could be developed for this location focusing only on unmanaged and discarded containers in yards and plac-ing special emphasis on tree-shaded containers and premises with large yards.
FIgure 5. Relative abundance of containers classified by use at increasing sampling efforts (%), which were selected at random (with replacement) from a sample of ��67 (�00%) containers sampled May–July �004 in Salinas, Puerto Rico.

�9
TDR/IRM/DEN/06.� Multicountry study of Aedes aegypti pupal productivity survey methodology: findings and recommendations
ThAIlAND
Principal investigator: Philippe Barbazan, Research Center for Emerging Viral Dis-eases, Center for Vaccine Development, Mahidol University at Salaya, Nakhonpathom, Thailand.
The primary goal of the Thai study was to identify the most productive classes of container for pupae of Ae. aegypti in representative areas of Thailand. Surveys were conducted in areas with different types of climate and socioeconomic development; the goal was to extend the conclusions of the study to other areas of Thailand in the Ministry of Public Health’s dengue control efforts. Most of the surveys included about 100 houses and were conducted during dry and wet seasons. Contain-ers were classified according to type (n = 16)—fish bowl, jar, cement tank, toilet tank, etc., and according to typical use (n = 4)—‘permanent’ for containers used for long-term storage of water (weeks, months), of large volume (100–3000 litres), and mostly filled with tap water but may receive rain water; ‘useful’ for containers used daily to store or to move water to the kitchen and garden; ‘trash’ for containers that are no longer used and are rain-filled; ‘other’ for various containers that do not fall into the other three classes.
Examples of the different areas and seasons surveyed include Khon Kaen, an iso-lated village in north eastern Thailand, where the containers accounting for (an arbritary) ≥70% of all pupae were the jar and the toilet tank in three of four sur-veys, and in the fourth survey, an additional container was the plastic bucket. In the urban site in Chiang Mai (northern Thailand), during the rainy season, four con-tainers types were responsible for 70% of all pupae: indoor small jars and plas-tic buckets, and outdoor fish bowls and other; while at the start of the dry season, 70% of all Ae. aegypti pupae were found in indoor containers, in flower pots, plastic buckets, and toilet tanks. In three suburban sites in Surat Thani, in the south of the country, although three or four containers were responsible for 70% of pupal pro-duction, during the dry season, just one container—the toilet tank—accounted for >70% of production.
The Thai team reached several conclusions from the pupal/demographic survey: • Several classes of container labelled by type or description—jars, toilet tanks, fish
bowls, and plastic pans—appear to be the most productive in most areas. Hope-ful for the development of a targeted strategy, the team observed that these con-tainers are used in most villages and suburban areas of the country and are easy to locate and survey. Designing a strategy to control dengue transmission should include these particular types even if they are not locally the most productive.
• Specific information provided by the pupal/demographic survey allows develop-ment of a targeted control and surveillance programme in Thailand.
• The density of positive containers is very high in most of the areas surveyed (Bre-teau indices >95 in 29 of 31 surveys), and a control strategy based on targeting the most productive classes of container appears to be more realistic than the cur-rent untargeted approach of global reduction on the basis of the Breteau Index.

�0
Multicountry study of Aedes aegypti pupal productivity survey methodology: findings and recommendations TDR/IRM/DEN/06.�
VIET NAM
Team: Peter Ryan (principal investigator), Vu Sinh Nam, Brian Kay, Tessa Knox, Nguyen Thi Yen, General Department of Preventive Medicine and HIV/AIDS Control, Ministry of Health, Hanoi, Viet Nam and Queensland Institute of Medical Research, Brisbane Hospi-tal, Brisbane, Australia.
Currently, dengue and dengue hemorrhagic fever are among the leading causes of hospitalization and death of children in Viet Nam. The majority of the disease bur-den occurs in the South; the disease is especially prevalent in the Mekong Delta region. Here, as in other areas of Viet Nam lacking a piped water supply, water for household usage is commonly stored in medium to large artificial containers. These containers lack mosquito-proof lids and are rarely completely emptied as are other containers such as vessels used in the kitchen, so they provide a suitable breeding habitat for the main dengue vector in Viet Nam, Ae. aegypti. In the South, ceramic jars (50–500 litres) are the primary water storage vessels, with up to eight standard jars (140–200 litres) per house in some communes. These containers are particu-larly difficult to carry out a census of simply because of their large size. Moreover, a recent publication notes that for some large container types, there is a relationship between container size and productivity suggesting that larger containers are likely to be epidemiologically important.12 An important goal in Viet Nam was to evalu-ate sweep nets as an alternative to absolute counts using field-developed calibration factors developed from absolute counts.
A single survey of a hamlet within the Tan Lan Commune in southern Viet Nam was conducted during May and June 2004. Using net sampling, all water-holding containers associated with 592 randomly-selected households were examined for immature mosquitoes (pupae and III/IV-instar larvae). All the containers found in a subset of these households (n = 59) were subsequently emptied to obtain absolute counts; these counts were then used to develop calibration factors for the various types of large container where sweep nets were used.
Based on the absolute counts, 146 containers (standard jars, large jars, cylindri-cal tanks and box tanks) were positive for pupae; previously 28.1% of these were scored pupae negative by sweep net sampling. This is not surprising as III/IV-instar larvae outnumber pupae by a factor greater than 12. In standard jars with absolute counts of 1–10 pupae per jar (n = 76), 38.2% were incorrectly scored as negative by net sampling. At higher pupal densities of 10 to 112 per jar (n = 31), all contain-ers were correctly scored as positive. For cylindrical tanks, 42.9% of pupae positive containers were incorrectly identified as negative, indicating that better sampling methods are required for this container type. Similar results were found with net sampling for III/IV-instars.
The household level data obtained from direct counts of all immature mosquito stages at 59 households were compared to the estimated numbers obtained using quantitative net sampling and the field derived calibration factors. Total estimated numbers of pupae (986) were accurate to within 12.6% of the absolute pupal count (1128), and estimated numbers of III/IV-instars (14 322) were accurate to within 0.3% of the absolute III/IV-instar count (14 360). In terms of the combined rela-tive percentage pupal contribution of the four major container classes (standard jar, large jar, cylindrical tank, and small jar), based on estimated numbers these containers contributed 98.5% of Ae. aegypti production compared with 94.4% of production based on absolute counts. These differences do not seem to be signifi-cant in terms of defining important container types for a targeted strategy. Similar results were found with III/IV-instars. Based on estimated numbers of III/IV-instars,

��
TDR/IRM/DEN/06.� Multicountry study of Aedes aegypti pupal productivity survey methodology: findings and recommendations
the same four container types contributed 98.4% of production compared with 94.3% of production based on absolute counts. These results verify the standard survey results from 592 households and clearly show that the containers used to store water for household use (jars and tanks) are responsible for almost all of the Ae. aegypti production in Tan Lan Commune.
A final analysis indicated that there was no correlation between presence or abundance of pupae or III/V-instars and the presence of covers or lids or the source of water (rain or well water); abundance was negatively correlated with predators (Mesocyclops, fish, and Micronecta) found in 31.9% of containers.
The Viet Nam team concluded that the pupal/demographic survey method was unsuitable for routine vector control where the goals are to identify productive classes of container and to identify individual containers as positive or negative for Ae. aegypti larvae or pupae so they may be treated on the spot. They note that if the presence or absence of pupae is the criterion, then almost 50% of containers would be inappropriately labelled as negative when in fact they were positive for larvae but negative for pupae.
Their work highlights the obvious, that the survey method should reflect the needs of the control programme. If the goal is to identify particular containers for immediate treatment, sweep-nets are an excellent choice. However, if the survey is intended to identify epidemiologically-significant classes of container for subse-quent mass treatment and/or to conduct a risk assessment for transmission, then the pupal/demographic survey is the method of choice. Counting pupae and peo-ple is a technique designed to provide information on the epidemiological signif-icance of the various classes of water-holding container that are related to risk of transmission, and on the degree of suppression required for limiting transmission.2

��
Multicountry study of Aedes aegypti pupal productivity survey methodology: findings and recommendations TDR/IRM/DEN/06.�
MExICo
Team: Juan I. Arredondo-Jiménez and Kenia M. Valdez-Delgado, Centro de Investigación de Paludismo, Instituto Nacional de Salud Pública, Tapachula, Chiapas, Mexico.
The Mexican team evaluated two sampling methods—random and transect—in four surveys conducted in three cities in Chiapas, southern Mexico. A total of 600 houses were sampled twice in each city. From 107 297 surveyed contain-ers belonging to 26 classes, only 16 032 had water, and, of these, 96% and 92% were respectively negative for pupae or III-IV instar larvae. There was no statisti-cal difference between the two sampling methods (random and transect), but pupal production varied with locality and container type. The most epidemiologically-sig-nificant class of container was the cement washbasin (84% of all Ae. aegypti pupae); this container is present in virtually all households. Association with the premise condition index indicated that moderate or high risk houses were about four times more likely to harbour pupae compared to low risk houses.
The team concluded, given three of every four Ae. aegypti pupae came from washbasins and that every house had at least one basin, that a targeted strategy aimed solely at this container would be efficacious for dengue control. The number of Ae. aegypti pupae by container class and city is presented in table 3.

��
TDR/IRM/DEN/06.� Multicountry study of Aedes aegypti pupal productivity survey methodology: findings and recommendations
TaBle 3. Numbers of Ae. aegypti pupae by container name and survey site in the Mexican surveys; list sorted by total number of pupae collected in all surveys.
Container nameTapachula Ciudad hidalgo Cacahoatan All villages
Number Sum Mean Number Sum Mean Number Sum Mean Number Sum Mean
Cement wash basin ��06 �7�0 �.08 ��66 6894 �.0� �4�0 6�� 0.46 408� �0 ��7 �.��
Plastic container 447 �4� 0.�� �0� ��� 0.46 444 49 0.�� ��9� 4�� 0.�
Bucket 998 ��� 0.�� 88� �00 0.�� 846 �8 0.07 �7�9 �79 0.�
Pot �49 �� 0.04 �7� �� 0.�� 97 ��� �.�9 ��� �68 0.��
Glass container �0� �� 0.�� ��6 ��6 0.6� 77 0 0 �94 �49 0.�8
Tyre 79 �� 0.�4 68 �0 0.�� 8� ��4 �.49 ��0 �4� 0.6�
��-gallon drum �64 �8 0.�� 4�0 ��� 0.�8 ��0 0 0 7�4 �4� 0.�
Disposable plastic container
�� 6� �.77 �� �7 �.68 �� �8 0.�8 7� ��6 �.��
Others 6� 4� 0.67 �� �4 �.69 88 6 0.07 �8� �0� 0.�6
Tin bucket ��6 � 0.0� �8� 79 0.�8 ��� 4 0.0� 6�4 8� 0.��
Disposable pewter container
�9 60 �.�6 �� � 0.�7 �9 �0 �.0� 49 8� �.69
Cement wash basin (small)
88 4 0.0� 70 76 �.09 60 0 0 ��8 80 0.�7
Can �0 �8 �.8 �7 �� 0.4� �06 �� 0.�� �4� 60 0.��
Animal drinking container (mobile)
�79 0 0 ��� �� 0.�� ��6 0 0 646 �� 0.08
Pewter 4� 7 0.�6 4� 0 0 84 �9 0.46 �7� 46 0.�7
Flower pot �09 �8 0.�� �7 � 0.09 9� � 0.0� ��9 44 0.�7
WC � 0 0 � 9 �.8 � �� � �� �4 �.6
Cistern 48 0 0 ��7 �� 0.� �� 0 0 �88 �� 0.07
Disposable glass container
9 0 0 �4 � 0.04 �� � 0.08 4� � 0.04
Clay pot �4 0 0 �7 0 0 �6 0 0 �7 0 0
Elevated storage tank
��7 0 0 49 0 0 6� 0 0 ��8 0 0
Animal drinking container (fixed)
�� 0 0 �� 0 0 40 0 0 ��� 0 0
Animal eating container (fixed)
� 0 0 � 0 0 � 0 0 � 0 0
Glass bottle �08 0 0 8�� 0 0 �4�� 0 0 �7�4 0 0
Animal eating container (mobile)
� 0 0 �� 0 0 � 0 0 �7 0 0
Barrel � 0 0 � 0 0 � 0 0 6 0 0
Discarded store 0 0 0 � 0 0 � 0 0 � 0 0
Totals 4884 3258 0.67 5558 7859 1.41 5590 1154 0.21 16 032 12 271 0.77


��
Key findings of the multicountry study

�6
Multicountry study of Aedes aegypti pupal productivity survey methodology: findings and recommendations TDR/IRM/DEN/06.�
ThE PuPAl/DEMogRAPhIC SuRVEy IDENTIFIES EPIDEMIologICAlly IMPoRTANT AND uNIMPoRTANT TyPES oF CoNTAINER
Every pupal/demographic survey summarized in this document led to the iden-tification of epidemiologically important and unimportant classes of container. For example, the Venezuelan study found that a single class, large water barrels, produced between 25% and 55% of all Ae. aegypti pupae, and that bottles, while numerically the most common container with larvae, contributed only 0%–5%; the survey permitted observation of how seasonal rainfall patterns influence pupal production by class of container. The Colombian study also found that bottles accounted for >80% of all containers but were responsible for only 0.1% of pupae; note that an intervention based on any of the traditional Stegomyia indices would target this epidemiologically unimportant class of container. In terms of epidemi-ologically significant classes, ground tanks and drums, while accounting for <5% of the containers, were responsible for >80% of all adult Ae. aegypti production. The survey in Cuba indicated that indoor containers accounted for 11% of adult mosquito production, and that containers classified as unused or abandoned were associated with 54% of production; the Peruvian study also identified this class as especially important. The Cubans noted that traditional Stegomyia indices were largely unrelated to the actual density of Ae. aegypti and transmission risk. The Ken-yan study was able to identify and quantify both the important and unimportant classes of container, and documented the variation in production and number of Ae. aegypti per person by location (outdoors vs. indoors, and urban, peri-urban, or rural) and by season (wet vs. dry).
Similar statements can be made for the other studies, i.e. that the pupal/demo-graphic survey identifies and quantifies the relative and absolute epidemiologic sig-nificance and insignificance of the various classes of container in the environment, and leads logically to the development of targeted control strategy with endpoints. The survey results from the Vietnamese study, which encountered many large con-tainers whose mosquito instars could not easily be counted, were used to cali-brate a sweep net method to estimate late instar larvae and pupae. High correlation between pupal count and sweep net count was reported, and both methods iden-tified the same classes of container for inclusion in a targeted strategy. Additional pupal/demographic surveys would be needed for areas outside the Mekong Delta region to calibrate the sweep net method for different environments.
CoNTAINERS AND SITES CAN BE ClASSIFIED uSINg DIFFERENT SChEMA
Classification schemes reflect the purpose for which objects are categorized. Say you are planning a dinner party and need vases on each table to hold flowers. You send someone to the store with instructions to buy short, small and inexpensive plastic flower vases that are either pink or red. Short and small because you want your guests to be able to see each other across the table, inexpensive because you are on a budget, plastic because there will be children at the party and you worry about breakage, and pink or red because it is a Valentine’s Day party or Chinese New Year celebration. From our perspective of community-based source control/reduction, none of the variables size, colour, or material are probably important; one class, the flower vase, may be sufficient because of certain features common to most vases—

�7
TDR/IRM/DEN/06.� Multicountry study of Aedes aegypti pupal productivity survey methodology: findings and recommendations
typically they are indoors and, while commonly positive for larvae and eggs, they are not productive by virtue of size and frequency of water change.
Well then, what are the sometimes competing objectives of a container classifica-tion scheme for our survey method and subsequent targeted strategy? We are begin-ning to see that developing a useful scheme is an evolving art that involves multiple facets. As presented in the sample size section below, one consideration concerns the total number of container classes; schemes with a smaller number of container types are to be preferred for statistical reasons. More specifically, to achieve relia-ble ranking of container types when the classification scheme is fine-grained and has many classes, larger surveys are needed. In practice, this will need to be traded off against the extra work induced, at the control stage, in grouping together two or more classes to give a coarser-grained scheme. Another consideration is that we will often want a scheme that separates the various containers into classes such as ground tanks, elevated water tanks, and drums that are well recognizable to the homeowner, who would clearly recognize them during implementation of a tar-geted control effort. Moreover, these classes may vary considerably in productivity; recall the results from Colombia where elevated water tanks were without pupae and could be ignored in a control effort yet ground tanks and drums, while account-ing for <5% of all containers, produced >80% of the Ae. aegypti pupae. Here, the commonly-known descriptive type name is also a useful class name.
In contrast, survey results often indicate that, from an entomological standpoint, we can classify a number of different types of container, each known by a unique descriptive name, into one class by the fact that they are, say, used or discarded. Sometimes, while containers of this class are commonly found in the environment, the class may not be a significant producer. Again, recall the Colombian experi-ence above where the class ‘used or discarded’, which included bottles, accounted for 95% of the water-holding containers in the environment but was responsible for only 16% of pupal production. Developers of a targeted strategy may decide to ignore them by virtue of their low productivity or include them if they thought a community-based sanitation campaign would be effective and sustainable. This notion of a container being abandoned, unused, discarded, or not useful was seen in many surveys to be an excellent variable for classification, both from the per-spective of conducting the survey itself and from the perspective of a subsequent targeted control effort. Note also that this variable was associated with high produc-tion in several studies (e.g. Peru) and low production in others (e.g. Colombia).
The studies in Peru and Puerto Rico are very informative regarding the utility of recording a host of variables for each container at the onset of the survey; once the pupae are counted, subsequent statistical analysis identifies which variables are actually correlated with production and are useful in a classification scheme. In addition, the Puerto Rican study draws our attention to the potential utility of clas-sifying not only containers but the sites themselves using variables such as land use (church, school, residence, abandonment, etc.) and vegetative cover. The excellent work of Tun Lin et al. should be reviewed in this context.9 Our goal is to reduce the labour associated with control by targeting the productive classes of container that are amenable to control. In a similar vein, if there is heterogeneity in Ae. aegypti pro-duction among the various classes of land use, perhaps some classes can safely be ignored and others targeted.
Finally, developing a scheme will be easier in some locations than others. Com-pare South Viet Nam, where a single class—water-holding containers for house-hold use—accounted for 94%–98% of all production, with Peru and Puerto Rico, where many variables were recorded for each container and subsequent statistical analysis identified which variables, location, fill-method, abandonment, etc., were

�8
Multicountry study of Aedes aegypti pupal productivity survey methodology: findings and recommendations TDR/IRM/DEN/06.�
actually covariates of productivity and therefore useful for classification. Given the results of the studies summarized here, control efforts will likely
increasingly use targeted strategies based on the pupal/demographic survey. Based on practical considerations, a targeted strategy, developed from a well-conducted survey with some modicum of analysis as suggested above, will likely be applied in neighbouring villages, towns, and hamlets or entire provinces, without further sur-vey. To the degree that this is true, it highlights the need to make adequate resources available for the process of survey, classification, and strategy development; the impact of subsequent control efforts will depend on this initial investment.
DISTRIBuTIoN oF AE. AEgyPTI PuPAE PER CoNTAINER IS STRoNgly CluMPED
The number of Ae. aegypti pupae per container in a survey does not usually have a normal distribution,2 nor a Poisson distribution which would reflect uniform-ity in pupal production. Rather, the distributions are typically highly clumped with a high variance/mean ratio reflecting the fact that most containers usually have no pupae or just a few, but the odd container has many. Some of the studies suggested that the variation appears to follow a negative binomial distribution. Regardless of the exact underlying distribution(s), the clumped distribution has important rami-fications for determining the sample size of a survey designed to develop a targeted strategy. This topic is covered in the next section on survey size requirements.
A PoTENTIAlly IMPoRTANT ClASS oF CoNTAINER, ThE RARE BuT ExTREMEly PRoDuCTIVE CoNTAINER
At the far right of the distribution of the number of Ae. aegypti pupae per container is the rare but extremely productive class of containers (REPC). This label, or some-thing like it, is arguably a better name than an earlier one, ‘mother foci’. Chandler, in documenting the seasonal dynamics of Ae. aegypti in Texas some 60 years ago, was perhaps the first to document this phenomenon, calling them mother foci.13 This name reflects the fact that Chandler’s mother foci (very large wooden containers located indoors in cotton dock warehouses, elevated water tanks along rail lines for steam locomotives, and fire brigade water barrels) were over-wintering sites for Ae. aegypti; they were foci that served to repopulate smaller containers that were devoid of Ae. aegypti following the freezing temperatures of wintertime. Because of thermal inertia, these mother foci were too large to freeze. The key feature of REPCs in trop-ical and sub-tropical locations is that they are rare and extremely productive. What is unknown is how important they are in terms of transmission. Perhaps their rarity and the limited movement of Ae. aegypti adults during their short, typically 10-day lifespan, limits their significance at the scale of the majority of urban areas. Perhaps they are the single most important type. Right now, we simply do not know.
Some of the studies also found the pupal/demographic survey to be useful in documenting the clumped distribution of Ae. aegypti at the level of household and block, and elicited interest in finding covariates that would facilitate identifying especially productive sites or blocks. A summary of the literature on this approach was presented in a recent publication.1

�9
TDR/IRM/DEN/06.� Multicountry study of Aedes aegypti pupal productivity survey methodology: findings and recommendations
SuRVEy SIzE REquIREMENTS To DEVEloP A TARgETED CoNTRol STRATEgy
We have seen earlier that the distribution of Ae. aegypti pupae per container and per house is clumped, with the ratio of means and variances typically large. This is one reason why estimating the required number of houses we need to sample, in order to be confident that we have identified the important classes of producer, turns out not to be a trivial statistical problem. Another reason is that the required sample size depends not only on the proportions of pupae in those important classes, but also on the proportions in the remaining ones. This is because it is harder to filter out ‘unimportant’ classes if their proportions of pupae are closer to the threshold which defines importance. A provisional approach to estimating size has been developed and will be summarized below. It is planned to develop a Windows®-based appli-cation for these calculations and make it available without cost.
The aim of this effort was to provide simple guidelines as to the sample size (in terms of inspected houses) required to identify important, or key, container classes with acceptable accuracy. These key container classes are those which, between them, contain a high proportion (70%) of the total number of pupae. The work is based on 38 surveys conducted in Colombia, Mexico, Peru, Puerto Rico, Thai-land and Venezuela (table 4). The number of houses per survey ranged from 76 to 6341. Only those houses positive for pupae yield information on the distribution of pupae among container classes. The number of these pupae-positive houses per survey ranged from 8 to 1072, with the proportion of positive houses ranging from 3% to 60%.

�0
Multicountry study of Aedes aegypti pupal productivity survey methodology: findings and recommendations TDR/IRM/DEN/06.�
TaBle 4. Summary of surveys used to develop a sample size algorithm
Reprinted from: Alexander et al.,�� with permission from Maney Publishing as copyright holder on behalf of Liverpool School of Tropical Medicine.
Location, survey number, description
Number of houses with
water contain-ers (positive for pupae)
Number of containers
(positive for pupae)
Total pupae Container types positive for pupae (m)
Dispersion index N�
Colombia (Barranquilla)*
� Los Olivos wet (Dec �00�) ��40 (�78) �8�4 (4�6) 8898 8 �.�
� Los Olivos dry (Mar �004) 98� (�4�) �4�7 (�64) �70� 7 4.�
� Rebolo wet (Jul �004) ��� (��) �9� (��) 8�4 � �.�
4 Rebolo dry (Feb �004) �97 (�0) 67� (�0) 64� 4 �.�
Mexico**
�a Tapachula random � �98 (�7) �4�� (6�) ��8� �� �.�
�b Tapachula transect � �9� (�0) �047 (�0) ��7 � �.�
�c Tapachula random � �97 (�9) ��7� (�9) 896 4 �.4
�d Tapachula transect � �98 (��) ���� (��) ��4 6 �.�
�a Ciudad Hidalgo random � �8� (�00) ��46 (���) ���� �0 �.�
�b Ciudad Hidalgo transect � �00 (��) �70� (6�) ���� �� �.7
�c Ciudad Hidalgo random � �90 (�6) �48� (4�) ��69 � �.�
�d Ciudad Hidalgo transect � �9� (�8) ���6 (64) ��08 8 �.�
�a Cacahoatán random � �99 (�4) �6�9 (�0) �8� �� �.8
�b Cacahoatán transect � �97 (�0) ���8 (�4) �0� �� �.9
�c Cacahoatán random � �97 (��) 97� (�6) �68 � �.7
�d Cacahoatán transect � �99 (8) �6�� (9) �0� � �.4
Peru
� Iquitos �999 6�4� (�07�) �6 49� (��49) �0 9�0 8 7.�
� Iquitos �999–�000 �6�� (808) �8 4�0 (�080) �0 ��� 8 7.�
� Iquitos �999–�000 �8�6 (9�0) �8 948 (���8) �� �8� 8 7.�
4 Iquitos �000 �7�6 (7��) �6 �6� (988) �� 40� 8 6.7
� Iquitos �000–�00� �90� (707) �8 ��� (9��) �0 6�9 8 6.8
6 Iquitos �00� 60�0 (86�) �9 �79 (����) �0 0�4 8 7.0
7 Iquitos �00� 6069 (7��) �0 �7� (98�) �7 ��4 8 7.0
8 Iquitos �00� �809 (78�) �8 000 (��0�) �� ��8 8 6.8
9 Iquitos �00� �867 (��6) �7 �49 (698) 9�97 8 6.7
�0 Iquitos �00� �7�� (�0�) �6 746 (67�) �0 �84 8 6.8
Puerto Rico
� Salinas May-Jul �004 �80 (��8) ��66 (���) ��88 �6 ��.0
� Salinas Oct-Dec �004 �6� (���) �8� (�0�) ��89 �6 9.8
Thailand
� Chiang Mai Aug �004 9� (4�) �8� (6�) ��� �0 8.�

��
TDR/IRM/DEN/06.� Multicountry study of Aedes aegypti pupal productivity survey methodology: findings and recommendations
� Chiang Mai Nov �004 �09 (�4) ��0 (��) ��0 9 6.8
� Khon Kaen Sep �004 ��� (69) 789 (��8) �06� �0 4.9
4 Khon Kaen Dec �004 �0� (�4) 4�� (98) �608 9 �.8
� Surat Thani July �004 76 (��) 49� (7�) 489 �� 6.8
6 Surat Thani Oct �004 87 (�6) �8� (69) ��� �� 6.4
Venezuela
� Trujillo Apr �004 �0�� (�78) �7 076 (�98) ���8 8 6.�
� Trujillo May �004 7�8 (84) 9090 (���) �686 7 6.0
� Trujillo June �004 7�� (40) ��6� (46) 9�8 6 �.0
4 Trujillo Oct �004 777 (7�) �9�� (��6) �889 7 4.�
* Numbers may differ slightly in subsequent publications, due to ongoing data cleaning.** At each site in Mexico, there were two random-sample surveys (in September–October �004 and December–January �00�) and two transect
surveys (in October–November �004 and February–March �00�).
Analytic approach We start from the intuitive observation that the required sample size should be smaller if pupae are more highly concentrated in a smaller number of classes. In such a situation, the key container classes should become obvious relatively soon in the course of a survey. Conversely, we would expect the required sample size to be larger if pupae are evenly dispersed between a larger number of classes. Making an analogy with analysis of ecological niche breadth and species diversity, we quantify the degree of dispersion of pupae between container classes by the disperson index N1, which is the exponential of H', the Shannon-Wiener (or Shannon-Weaver) index:14
dispersion index (N1) = 10H' where
Shannon-Wiener index (H') = ( )∑−i
ii pp 10log
and pi is the proportion of pupae in the i-th container class, and the Σ symbol denotes a sum over the container classes which contain at least one pupa.
This dispersion index (N1) has the following properties: (1) N1 is larger when pupae are distributed more evenly across container classes; (2) the maximum value of N1 occurs when equal proportions of pupae occur in each container class—if there are m such container types then N1 = m; and (3) an even spread over a larger number of container types gives a larger value of N1 than does an even spread over a smaller number of container types.
So, for example, a dispersion index of 5 means that the pupae have the same degree of dispersion as if they were equally distributed over five container types (i.e. 20% of pupae in each type). Examples of dispersion index calculations are shown in table 5. Such calculations can easily be done in a spreadsheet such as Microsoft® Excel®.

��
Multicountry study of Aedes aegypti pupal productivity survey methodology: findings and recommendations TDR/IRM/DEN/06.�
TaBle 5. Examples of calculation of dispersion index
5a) Third Venezuelan survey N1 = 3.0
Container type Proportion of pupae (p) log10(p) p×
log10(p)
Bucket 0.04 -�.4� -0.0�
Assorted medium 0.07 -�.�7 -0.08
Assorted small 0.0� -�.86 -0.0�
Drum 0.�� -0.�6 -0.�4
Tank 0.�� -0.� -0.�6
Tyre 0.0� -�.89 -0.0�
H’ = -total = 0.48
N� = �0H’ = �.0
5b) Third Venezuelan survey, after merging the two ‘assorted’ types and reducing the dispersion index In this case the reduction is small (from �.0 to �.9) because one of the original types had few pupae. Merging more productive types would result in a larger reduction.
Container type Proportion of pupae (p) log10(p) p×
log10(p)
Bucket 0.04 -�.4� -0.0�
Assorted 0.08 -�.�0 -0.08
Drum 0.�� -0.�6 -0.�4
Tank 0.�� -0.� -0.�6
Tyre 0.0� -�.89 -0.0�
H’ = -total = 0.46
N� = �0H’ = �.9

��
TDR/IRM/DEN/06.� Multicountry study of Aedes aegypti pupal productivity survey methodology: findings and recommendations
FIgure 6. Distribution of repeatability as sample size increases
The vertical axis identifies each survey by the initial letter of each country followed by the survey number from table 4. Each panel shows the results for one sample size (increasing from left to right), with a vertical dashed line at the target P = 70%. Each horizontal solid line shows the 9�% range of repeatability for that survey and sample size.
Reprinted from: Alexander et al.,�� with permission from Maney Publishing as copyright holder on behalf of Liverpool School of Tropical Medicine.

�4
Multicountry study of Aedes aegypti pupal productivity survey methodology: findings and recommendations TDR/IRM/DEN/06.�
Figure 7 shows bar charts of pupae by container type, for a subset of 14 surveys, with the dispersion indices. The survey with the smallest dispersion index (1.5) is the fourth Colombian one (C4), in which the pupae were almost all (91%) found in ground tanks. Of the 14 surveys, the one with the largest dispersion index (8.3) is the first Thai survey (T1), which reported pupae in ten different container types, four of which had more than 10% of the Ae. aegypti pupae each, and three of which had between 5% and 10%.
The utility of the dispersion index (N1) was assessed in terms of the repeatability of multiple surveys in the same location. For example, a survey of ten pupae-pos-itive houses was simulated by drawing that number from the full dataset (without replacement). From that first subsample, the key container classes were identified. Then thee classes were evaluated in a second subsample of ten, which was chosen at random from the houses not included in the first subsample. We define ‘repeatabil-ity’ to be the percentage of pupae which the first subsample’s key container classes yield when applied to the second subsample’s data. More details are given by Alex-ander et al.15
FIgure 7. Distribution of pupae among container types in a selection of six surveys, with the dispersion index (N�)
The vertical axis for each graph is the number of pupae in each container type.
Reprinted from: Alexander et al.,�� with permission from Maney Publishing as copyright holder on behalf of Liverpool School of Tropical Medicine.

��
TDR/IRM/DEN/06.� Multicountry study of Aedes aegypti pupal productivity survey methodology: findings and recommendations
The above subsampling process was performed many times in order to estimate the distribution of repeatability. Ideally, we would like the repeatability to have a high probability of being near, or above, 70%. This would indicate good consist-ency between surveys because 70% is, by definition, the minimum level achieved by the set of container types in the first subsample.
The above process was done for sample sizes of between 10 and 100 pupae-pos-itive houses. Based on between-survey variation in the proportion of houses posi-tive, between 17 and 374 houses would be needed to obtain ten positive ones. To obtain 100 positive houses, between 167 and 3738 would be needed. It is notice-able that a few surveys, in particular the fourth Colombian survey (C4), had con-sistently high repeatability for ten positive houses (fig. 6). However, for this small sample size, the other surveys have very variable repeatability. As expected, the repeatability increased with increasing sample size, although very slowly in some cases. These results imply that a ‘one size fits all’ sample size is not appropriate.
Repeatability was found to generally follow an inverse relationship with the diversity index. Fig. 8 shows the 20th percentile of repeatability for sample sizes of 10, 25, 50, and 100 positive houses; the choice of the 20th percentile is arbitrary. Each symbol shows one survey for one sample size. The dispersion index is taken from the full dataset, so if a survey has multiple data points they occur in a vertical line.
For example, the leftmost ‘+’ sign refers to sample size 50 and has a value of about 0.7 on the vertical axis. Since we are plotting the 20th percentile, this means that only 20% of the time would we expect a repeatability of 0.7 or less. In other words (based on our definition of repeatability), if we take a sample of 50 houses, identify the set of container types yielding 70% of pupae, and then take a second sample of 50 different houses, then only 20% of the time will the types identified from the first dataset have less than 70% of pupae in the second dataset. This is acceptable. By contrast, the rightmost ‘+’ sign has a value of about 0.4, so the same procedure in that survey, which has a much higher dispersion index, would not be repeatable with a sample size of 50 positive houses.
As expected, within each survey, increasing sample size leads to increasing repeatability. In other words, within the same vertical set of symbols, the symbol for 50 houses (if possible with that survey) always appears above that for 25, which in turn appears above that for 10.
In fig. 8, the dashed lines show fits from regressing the logistic transformation of the repeatability on the dispersion index. Each line extends only over the range of data available for that sample size. Therefore, the line for 100 houses has a wider range of dispersion index than that for 50 houses, which in turn has a wider range than that for 25.
other possible approaches to sample size Investigators from Peru and Puerto Rico used subsampling to simulate datasets of various sizes, and then examined how large a sample size was needed to achieve similar results to those from the full data sets. The validity of the conclusions depends on the full datasets being large enough to be an acceptable ‘gold stand-ard’ or, in statistical terms, to have small sampling error. This may be true for these large surveys, but could not be assumed for the other available datasets. This raises the question of how large a dataset should be in order to be a ‘gold standard’ for its location. But this is really just a restatement of our original sample size problem. To escape from this circular reasoning, the approach in this current section has been to concentrate on repeatability, which can be estimated from all datasets (except the very smallest), without needing to assume ‘gold standard’ status.

�6
Multicountry study of Aedes aegypti pupal productivity survey methodology: findings and recommendations TDR/IRM/DEN/06.�
Another approach might be to use parametric statistical methods, in particu-lar the negative binomial distribution. However, although sample size methods are available for univariate distributions (e.g. numbers of pupae in a single container type), a major extension would be necessary to cover our complex hypotheses about multivariate distributions (e.g. the joint consideration of multiple container types). This seemed likely to require a major mathematical statistical effort. So the current approach, based on the dispersion index and resampling methods, was given priority because it was thought more likely to yield practical guidelines for targeted control efforts.
Algorithm for sample size The sample size algorithm shown in fig. 9 is based on fig. 8. The goal is to achieve a repeatability of approximately 60% with approximately 80% probability. The pos-sible sample sizes (10, 25, 50 or 100) are in terms of numbers of pupae-positive houses. This means that the total number of houses sampled will depend on the proportion of houses which are positive.
At each stage, if the algorithm indicates an increase in sample size, it is possi-ble instead to recategorize the containers to give fewer types (see table 5), and then re-analyse the data based on the reduced number of types. In other words, with a smaller number of types, the dispersion index may be small enough to allow the survey to stop. In this case, the key container types should be identified on the basis of the simplified classification.
Please remember that this work is provisional and is the subject of another report (Alexander et al.,15 in press).
FIgure 8. Repeatability (R) and dispersion index (N�)
Reprinted from: Alexander et al.,�� with permission from Maney Publishing as copyright holder on behalf of Liverpool School of Tropical Medicine.

�7
TDR/IRM/DEN/06.� Multicountry study of Aedes aegypti pupal productivity survey methodology: findings and recommendations
FIgure 9. Flow chart for sample size algorithm.

�9
Prospects and limitations of the pupal productivity survey methodology

40
Multicountry study of Aedes aegypti pupal productivity survey methodology: findings and recommendations TDR/IRM/DEN/06.�
RESulTS ARE uSEFul IN DEVEloPINg TARgETED SouRCE REDuCTIoN/CoNTRol STRATEgy FoR DENguE
In each study, the pupal/demographic survey led directly to targeted control strat-egy. The surveys not only identified the epidemiologically important containers for targeting, but also identified those not important from a transmission perspec-tive. We usually think of the method as identifying types with large productivities, yet in developing a targeted strategy, it is just as important to know which classes can safely be ignored. In one instance, flower vases were seen to be a minor con-tributor and could be ignored, eliminating the need to deal with a very common container. Another study found that bottles, accounting for >80% of all containers, were responsible for only 0.1% of pupae; note that an intervention based on any of the Stegomyia indices would inappropriately target this class of container. Many of the studies were longitudinal, allowing seasonal comparisons to be made; this led to the development of specific strategies reflecting cyclic changes in the abundance of rain-filled containers and water storage habits.
In situations with a high dispersion index, either an alternative classification scheme has to be developed or a non-targeted intervention method employed.
DIFFICulTy oF SuRVEyINg lARgE CoNTAINERS
Because very large containers were so common, the Vietnamese team concluded that the pupal/demographic survey method was too laborious for use in directing routine vector control operations. Large containers present a significant problem in pupal/demographic surveys. Understandably, the owner is often reluctant to give permission for the water to be pumped out through a sieve and wasted on the ground. Obviously, including one or more large drums that could be used to save the water presents the survey team with a logistical problem, but perhaps under some circumstances, this would be appropriate. Of our nine studies, three investi-gated the use of sweep nets; absolute pupal counts were used to develop calibration factors reflecting the efficiency of capture with the nets. The Venezuelan team did not pursue developing what they felt were sufficiently accurate factors as there was no pressing need; they were interested in an alternate method when REPCs with >500 pupae were encountered. The Colombian team found that much of the pupal production came from large containers which were difficult to obtain absolute counts from. They too used absolute counts to develop calibration factors that they thought were sufficiently accurate to be used operationally. Because sweep net sur-veys are part of the national dengue control programme of Viet Nam, the absolute pupal/demographic counts presented an opportunity to develop calibration factors and then evaluate them. The sweep net method was seen to be inadequate for deter-mining whether a container is positive or negative for pupae, especially when the numbers were low or in cylindrical tanks. However, calibrated sweep net estimates were very close to absolute counts, and using either method identified the same containers as being important.
When contemplating using sweep nets, two points should be kept in mind. The first is that calibration factors developed in one location may provide faulty esti-mates in another location. Second, accuracy can vary substantially between differ-ent types of container.4

4�
Conclusions, further research, and implications for dengue prevention and control programmes

4�
Multicountry study of Aedes aegypti pupal productivity survey methodology: findings and recommendations TDR/IRM/DEN/06.�
CoNCluSIoNS
The studies have confirmed that the pupal/demographic survey provides the nec-essary data for developing targeted strategies. The method certainly requires more labour than do the traditional Stegomyia indices, but on a cost/benefit analysis, the traditional measures fail because, regardless of cost, they cannot inform targeted strategy nor can they be used for transmission risk assessment. Unpublished long-term (>5 years) and repeated longitudinal pupal/demographic surveys in Iquitos, Peru,6 and Yogyakarta, Indonesia, indicate that pupal production by container type is remarkably stable over time and suggest, as stated above, that only an initial, high quality survey may be required.
Calibrated sweep net surveys may provide a method for estimating absolute numbers of pupae for some types of container. However, calibration factors deter-mined in one location should be used with great caution in another area, where subtle differences in climate, elevation, methods of handling water, etc., may influ-ence productivity, and hence accuracy.
FuRThER RESEARCh
Evaluate dengue control strategies using transmission thresholds and pupal/demographic survey methodologySince the appearance of dengue haemorrhagic fever in South-East Asia in the 1960s and its subsequent spread to the Americas and Oceania, several control strategies have been advocated. Ultra low volume (ULV) spray applications applied through national control programmes were given prominence for several decades. While it was documented that the sprays certainly killed adult mosquitoes, their use in controlling epidemics was harder to demonstrate. Transitory but infrequent depres-sions in adult mosquito survival simply could not suppress dengue transmission in endemic locations. As appreciation of the inadequacies of ULV grew in the public health community, the focus of control efforts turned to involving affected commu-nities, and much was made of community participation for the purpose of source reduction and/or control. Yet experience, with the exception of the two vertical and national programmes of Singapore and Cuba, has been disappointing. Some thought the problem lay with an inadequate understanding on the part of the com-munities and that, with time and education, dengue control could be achieved. Others suggested that another factor was at work—that the public was in fact con-ducting a cost–benefit analysis with regard to dengue—and simply concluded that preventing mosquito breeding in all containers every day indefinitely was, as indicated by practice, simply not worthwhile from a labour/time perspective. The promise of targeted source reduction and control, building on the significant accomplishments to date in the area of community participation, lies with reducing the labour and costs in the cost–benefit calculation. With few exceptions, evalua-tions of community-based interventions were based on sociological evidence such as an increase in knowledge, change in practice, etc., and not on measurements of transmission or disease prevalence. Perhaps this is understandable in light of the time and effort required to change human behaviour with regard to cigarettes, seat belts, etc.
In light of the foregoing comments, the chief research recommendation of this summary is to conduct targeted interventions with the dependent variable being some measure of transmission. Studies with significant funding can measure trans-mission directly using longitudinal serosurveys of infants and adolescents using

4�
TDR/IRM/DEN/06.� Multicountry study of Aedes aegypti pupal productivity survey methodology: findings and recommendations
the prevalence of anti-dengue IgM as a proxy; other studies will have to rely on case data. In addition, evaluations of interventions should monitor the actual impact on pupal production in the targeted containers.�∗ If a targeted intervention effort fails, it is critical to know whether failure is attributable to inadequate control in targeted containers or if the problem lies with the notions of targeted intervention and trans-mission threshold.
Estimate the amount of suppression required in interventions using transmission thresholds Mechanistic models of the dynamics of dengue have been used to estimate trans-mission thresholds (the number of Ae. aegypti pupae per person) as a function of pre-existing antibody levels in the human population (herd immunity) and ambi-ent air temperature (table 6).2 The threshold, an epidemiological concept central to infectious disease control, is simply the breaking or tipping point; at levels below threshold, infection rates and viral persistence decline in the human population. Threshold levels were estimated to range between 0.5 and 1.5 Ae. aegypti pupae per person for an ambient air temperatures of 28oC and initial seroprevalence of 0% to 67%. The concept of transmission threshold has given us a new and hopefully useful tool for monitoring targets for source reduction/control efforts. Moreover, in terms of risk assessment, transmission thresholds provide estimates of the level of elimination or control necessary to preclude transmission (table 7). In targeted interventions, attempts should be made to reduce the number of Ae. aegypti pupae per person to below the threshold estimate. Note in table 7 that several locations would require >70% reduction in adult production to be prophylactic.
It goes without saying that we see exceeding the threshold as being a necessary but not sufficient cause of transmission. The table of transmission thresholds (table 6) takes into account the degree of susceptibility in the human population (and indicates the possible consequences of inadequately knowing the herd immunity level). But transmission thresholds obviously make no statement about the pres-ence or type of viruses that may or may not be circulating or introduced. Transmis-sion thresholds are useful for risk assessment and risk reduction. In the absence of virus and a control programme, they speak of receptivity to virus; in the endemic situation, they provide targets and end points for targeted source reduction/con-trol programmes. In targeted interventions, account should be taken of seasonal variations in transmission threshold due to temperature fluctuation, and strategies should provide sufficient reduction in Ae. aegypti production to suppress transmis-sion. In dengue endemic areas where herd immunity levels (prevalence of anti- dengue IgG by serotype) are unknown, conservative estimates should be used, e.g. 33%, to estimate the target level of reduction in number of pupae per person.
� A current evaluation in Yogyakarta, Indonesia, using pyriproxyfen to prevent adult emergence involves: weekly visual inspection of targeted containers for the presence or absence of the compound; laboratory bio-assay of water collected from treated containers in the field; and laboratory observation of field- collected pupae for emergence success and deformities. Transmission is monitored using: case data, and seroprevalence of IgM in children and infants measured every three months.

44
Multicountry study of Aedes aegypti pupal productivity survey methodology: findings and recommendations TDR/IRM/DEN/06.�
TaBle 6. Transmission thresholds in terms of Ae. aegypti pupae per person as a function of ambient temperature and prevalence of dengue antibody. This table shows the estimated number of Ae. aegypti pupae per person required to result in a �0% probability of a �0% or greater rise in seroprevalence of dengue antibody during the course of a year resulting from monthly viral introductions of a single viraemic individual.�
Reprinted from: Focks DA et al.,� with permission from the American Society of Tropical Medicine and Hygiene.
Temperature (oC)
Transmission threshold by initial seroprevalence of antibody
0% 33% 67%
�� 7.�� �0.70 ��.��
�4 �.�0 �.47 7.��
�6 �.0� �.�� �.4�
�8 0.4� 0.6� �.�7
�0 0.�0 0.�� 0.�0
�� 0.06 0.09 0.�6
The Cuban team noted that two measures, the number of Ae. aegypti pupae per person and the number of pupae per hectare, were highly correlated (89%); they suggested that ‘pupae per person’ does not require documentation of human den-sity and is, therefore, perhaps the more desirable statistic. It is important to note, however, that ‘pupae per hectare’ (an index) cannot be related to risk of transmis-sion because, among other factors such as temperature and herd immunity, den-gue infection is a function of the ratio of vector and host abundance, i.e. of pupae per person. The difference in cost is minimal, but only ‘pupae per person’ permits estimation of the degree of reduction necessary to effect control (tables 6 and 7).2 High correlation between pupae per person and pupae per hectare was also noted in the Peru study, and in Iquitos it was difficult to estimate the number of people per house with much confidence.
Continue evaluation of calibrated sweep nets Based on the experiences of some study groups, obtaining absolute pupal counts in some types of large container is a significant problem, suggesting that efforts to eval-uate the calibrated sweep net method are warranted. The Viet Nam team was able to identify the same container types to be targeted as identified by the pupal/demo-graphic survey method. If the linear relationship between abundance of late instars and pupae is consistent, it may be possible to use sweep net counts to estimate pupal abundance and evaluate strategies in terms of reduction in pupae per person.
Develop better classification schemes for containers, and methods to locate rare but especially productive containers at house and block scales When rare but especially productive containers (REPCs) are encountered, priority should be given to: • elucidating the factors responsible for the anomalous production• identifying the common features among REPCs discovered during the survey
(location, association with vegetation, type of container with respect to material, use/non-use, etc.)

4�
TDR/IRM/DEN/06.� Multicountry study of Aedes aegypti pupal productivity survey methodology: findings and recommendations
• developing a classification scheme that includes factors to facilitate the locating of REPCs without exhaustive survey.
The fact that REPCs are infrequently found, that they appear as anomalies and are not typical, should not mean serious consideration is not given to this potentially important class of container. Rare they may be, but most reasonably sized surveys discover one or more REPCs often accounting for a significant proportion of pro-duction. In addition to discovering common factors associated with REPCs which might be useful in developing a search strategy targeting them, another important question is whether their production is stable over time. If it is stable (the likely case) then we should probably always include an REPC class in our surveys to keep us mindful of their existence and importance, helping us to think in terms of answering the three points above.
The container classification schemes developed in the studies in Peru, Puerto Rico, and other countries, involving the concepts of abandonment, location with respect to vegetation or placement, etc., are very good examples of the utility of thinking in terms of new covariates of production and should be studied and applied to local surveys. Rapid location of especially productive classes of container could serve to further reduce the labour associated with targeted strategies.
TaBle 7. Comparison of observed numbers of Ae. aegypti pupae per person in various dengue-endemic or dengue-receptive locations with estimated transmission thresholds based on average summertime temperatures and an initial seroprevalence of ��%.�
The column ‘% control’ is the degree of reduction in pupae per person necessary to reduce the observed field level to that of the threshold.
Reprinted from: Focks DA et al.,� with permission from the American Society of Tropical Medicine and Hygiene.
location Temp (oC)a Pupae per personb Thresholdc Ratiod % Controle
Reynosa, Mexicof �9.4 �.7� 0.�6 �0.4 90
Mayaguez, Puerto Ricof �6.6 �.7� �.0� �.7 40
Trinidad (�0 sites) �7.0 ��.7g 0.86 �6.4 96
El Progreso, Honduras �9.� 0.�4 0.�� �.� �0
San Juan, Puerto Ricof �7.8 �.7� 0.�8 4.7 79
Bangkok, Thailand �9.� �.69 0.�9 �.8 8�
a Temp refers to average temperature during the months of June–August or December–February in locations above and below the equator, respectively.
b Pupae per person refers to the average number of Ae. aegypti pupae per person observed in the survey. c Threshold refers to the estimated number of Ae. aegypti pupae per person that will preclude epidemic
transmission. These estimates were derived from dengue transmission models.� Because the models are stochastic, around this tipping point or transmission threshold, multiple model runs under the same conditions typically have little or no subsequent transmission following the introduction of a single viraemic individual �� times per year. The values shown in the table are based on thresholds assuming an initial seroprevalence of ��%.
d Ratio is the ratio of observed pupae per person and the estimated temperature—and seroprevalence-specific threshold.
e % Control is the degree of reduction in pupae per person necessary to reduce the observed field level to that of the threshold.
f Unpublished studies conducted by Focks in collaboration with others. Surveys in Puerto Rico and Mexico were limited and preliminary.
g Observed range: �.4–6�.4 pupae per person; the island-wide average is used for calculation.

46
Multicountry study of Aedes aegypti pupal productivity survey methodology: findings and recommendations TDR/IRM/DEN/06.�
IMPlICATIoNS FoR DENguE PREVENTIoN AND CoNTRol PRogRAMMES
The results of these studies are encouraging—they suggest that control of transmis-sion may be possible with the treatment or elimination of only a small portion of the large number of classes of water-holding container found in the environment. Each study identified the important classes of container to be controlled, and also the classes that could safely be ignored. Commonly, the more productive classes were larger containers that were stable through time, a feature that may make them more amenable to control with biological control agents or chemicals. Given that all control programmes are resource limited, this new and quantitative understanding of productivity can lead to targeted interventions that may be sustainable because control that relies on targeted strategy requires substantially less labour. A TDR supported multicentre study on the cost-effectiveness of targeted vs. non-targeted interventions will provide answers to this question.
Reducing the number of breeding containers will not cause an increase in productivity of the remaining containers A common concern regarding targeted strategies is the notion that, immediately following the elimination of one or more classes of container, more oviposition, and hence more adult production, will occur in the remaining containers. How-ever, adult production is in equilibrium with, and is a function of, the rate at which food arrives (or is produced) in the container; adult production is not a function of, nor is it limited by, the rate of oviposition. In the population dynamics of Ae. aegypti there is a surfeit of eggs and a paucity of food.16 Consider a location with ten con-tainers, each producing an average of two adults per day. If we assume an even sex ratio and an average lifespan of about 10 days, these 10 containers would be asso-ciated with a standing crop of 100 females (10 days x 10 containers x 1 new female per day per container). Further, lets assume an average fecundity of 25 eggs per day per female. Expected daily oviposition at our location would be 2500, or 250 eggs per container—each day 250 eggs are laid, yet each day only 2 adults emerge from each container. The high rate of mortality between oviposition and emergence is due to a number of factors including egg predation and density-dependent larval mortality; there are simply more eggs laid than the larval environment can support. As there are no density-dependent survival factors in the adult stage, elimination of 25% or 50% of adult production results in a similar reduction in the standing crop of adults.17
In a targeted source reduction campaign, in addition to removing the water-holding containers, the associated Ae. aegypti larval food is removed from the envi-ronment and productivity of the environment goes down, as does the standing crop of adults. Any transient rise in oviposition in untreated containers is met with increased density-dependent larval mortality as productivity is a function of food availability—recall the large ratio of daily oviposition and emergence. In contrast, in an intervention involving larvicides, biological control agents, or insect growth regulators, neither the number of oviposition sites nor the amount of food declines. Our treatment has eliminated the production in some containers, thereby lower-ing the standing crop of adults and oviposition. One might wonder if productivity would go down in untreated containers, oviposition rates in them being somewhat lower, as a lower number of females is associated with the same number of contain-ers. Simulation and field studies in Kenya suggest that until adult populations are reduced by >40%, container productivity will not be limited by lowered oviposi-tion rates because food-based density-dependent larval mortality decreases.16

47
references
1 Focks DA. A review of entomological sampling methods and indicators for dengue vectors. Geneva,
UNICEF, UNDP, World Bank, WHO Special Programme for Research and Training in Tropical
Diseases, 2003 (TDR/IDE/Den/03.1).
2 Focks DA et al. Transmission thresholds for dengue in terms of Aedes aegypti pupae per person
with discussion of their utility in source reduction efforts. American Journal of Tropical Medi-
cine & Hygiene, 2000, 62:11–18.
3 Focks DA, Chadee DD. Pupal survey: An epidemiologically significant surveillance method
for Aedes aegypti: An example using data from Trinidad. American Journal of Tropical Medicine
and Hygiene, 1997, 56:159–167.
4 Tun-Lin W, Kay BH, Burkot TR. Quantitative sampling of immature Aedes aegypti in metal
drums using sweep net and dipping methods. Journal of the American Mosquito Control Associa-
tion, 1994, 10:390–396.
5 Romero-Vivas CME, Wheeler JG, Falconar AKI. 2002. An inexpensive intervention for the
control of larval Aedes aegypti assessed by an improved method of surveillance and analysis.
Journal of the American Mosquito Control Association, 2002, 18(1):40–46.
6 Morrison AC et al. Spatial and temporal abundance patterns of Aedes aegypti production in
Iquitos, Peru. Journal of Medical Entomology, 2004, 41(6):1123–1142.
7 Barrera R, Amador M, Clark G. Use of the pupal survey technique for measuring Aedes aegypti
(Diptera: Culicidae) productivity in Puerto Rico. American Journal of Tropical Medicine and
Hygiene (in press).
8 Barrera R, Amador M, Clark G. Ecological factors influencing Aedes aegypti (Diptera: Culici-
dae) productivity in artificial containers in Salinas, Puerto Rico. American Journal of Tropical
Medicine and Hygiene (in press).
9 Tun-Lin W, Kay BH, Barnes A. The Premise Condition Index: A tool for streamlining surveys
of Aedes aegypti. American Journal of Tropical Medicine & Hygiene, 1995, 53:591–594.
10 Arrivillaga J, Barrera R. Food as a limiting factor for Aedes aegypti in water-storage containers.
Journal of Vector Ecology, 2004, 29:11–20.
11 Reuben R et al. Estimation of daily emergence of Aedes aegypti (Diptera: Culicidae) in Sonepat,
India. Journal of Medical Entomology, 1978, 14:705–714.
12 Knox T et al. Optimising surveillance for dengue vector immatures in large water storage con-
tainers in Vietnam. Arbovirus Research in Australia, 2005, 9:184–187.

48
Multicountry study of Aedes aegypti pupal productivity survey methodology: findings and recommendations TDR/IRM/DEN/06.�
13 Chandler AC. Factors influencing the uneven distribution of Aedes aegypti in Texas cities.
American Journal of Tropical Medicine, 1945, 25:145–149.
14 Krebs CJ. Ecological methodology. Menlo Park CA, Benjamin/Cummings, 1999.
15 Alexander N et al. Sample sizes for identifying the key types of container occupied by dengue-
vector pupae: the use of entropy in analyses of compositional data. Annals of Tropical Medicine
and Parasitology (in press).
16 Subra R, Mouchet J. The regulation of preimaginal populations of Aedes aegypti, Diptera: Culi-
cidae, on the Kenya coast: 2. Food as a main regulatory factor. Annals of Tropical Medicine and
Parasitology, 1984, 78:63–70.
17 Focks DA et al. Dynamic life table model for Aedes aegypti (L.) (Diptera: Culicidae). Analysis of
the literature and model development. Journal of Medical Entomology, 1993, 30:1003–1017.


TDR/IRM/DEN/06.1
Multicountry study of Aedes aegyptipupal productivity survey methodology
fi n d i n gs an d r ecom m en dat i o ns
Mu
lticou
ntry stu
dy o
f Aed
es aegypti pu
pal p
rod
uctivity su
rvey meth
od
olo
gy: fin
din
gs an
d reco
mm
end
ation
s