multidimensional ranking: a new transparency tool for ... · a new transparency tool for higher...
TRANSCRIPT
Higher Education Management and Policy
Volume 22/3
© OECD 2010
Multidimensional ranking: a new transparency tool
for higher education and research
by
byFrans A. van Vught and Don F. Westerheijden
Center for Higher Education Policy Studies (CHEPS), University of Twente, the Netherlands
This paper sets out to analyse the need for better “transparencytools” which inform university stakeholders about the quality ofuniversities. First, we give an overview of what we understand bythe concept of transparency tools and those that are currentlyavailable. We then critique current transparency tools’methodologies, looking in detail at the question of data sources, therisks involved in constructing league tables and the challenges inusing composite indicators. Lastly, we argue in favour ofdeveloping a new principle for transparency tools: that ofmultidimensional ranking.
1
Higher Education Management and Policy
Volume 22/3
© OECD 2010
Classement multidimensionnel : un nouvel outil de transparence pour l’enseignement
supérieur et la recherche
by
parFrans A. van Vught et Don F. Westerheijden
Centre d’étude sur les politiques d’enseignement supérieur (CHEPS), Université de Twente, Pays-Bas
Cet article tente d’analyser la nécessité de créer de meilleurs« outils de transparence » destinés à informer les étudiants etautres acteurs de l’enseignement supérieur sur la qualité desuniversités. En premier lieu, nous offrons une vue d’ensemble surce que nous entendons par le concept d’outils de transparence etsur les outils déjà disponibles à l’heure actuelle. Ensuite, nousanalysons en détail les techniques d’utilisation des outils detransparence existants, notamment la question des sources dedonnées, des risques sous-jacents à l’établissement de systèmes declassement et les défis posés par l’utilisation d’indicateurscomposites. Enfin, nous exprimons notre avis favorable audéveloppement d’un nouveau principe d’utilisation d’outils detransparence : celui du classement multidimensionnel.
2
MULTIDIMENSIONAL RANKING: A NEW TRANSPARENCY TOOL FOR HIGHER EDUCATION AND RESEARCH
Introduction: the rise of transparency tools
International discussions on higher education and higher educationpolicies have given rise to a new concept: that of “transparency”. Transparencyin this context relates to the need to provide information on higher educationinstitutions’ efforts and performance in their various fields of activity. It is alsorelated to the concept of quality assurance. If the latter is perceived as a set ofactivities intended to provide proof of quality to higher education institutions’external stakeholders, then creating transparency entails providing theinformation which these stakeholders need in order to form judgements andtake decisions. Such decisions can range from students choosing betweenspecific educational programmes to public or private agencies awardingresearch contracts and governments deciding on accountability issuesrelating to funding. Therefore, transparency instruments are informationtools designed to communicate information on higher education institutions’efforts and performance to external stakeholders.
Transparency tools are urgently needed in higher education and more sothan in many societal sectors. In economic terms, higher education is eitheran “experience good” or a “credence good”. In the case of an experience good,the quality can only be judged after it has been consumed (and by implication,after it has been paid for), unlike search goods, whose quality and price areclear in advance. Credence goods are those whose quality remains unknowneven after consumption, for example, a medical consultation or computerrepairs (Bonroy and Constantatos, 2008; Dulleck and Kerschbamer, 2006). Fromthis perspective we question whether students can ever really gauge to whatextent their university experience has enhanced their knowledge, skills andcompetencies. Also, to what extent is that enhancement specificallyattributable to the institution at which they studied? (We distinguish initialfrom post-initial higher education in this respect; cf. Westerheijden, 2003.)Whether higher education is seen as an experience or credence good, we maysafely assume that students cannot know the quality of their educationalexperience beforehand. Similar arguments can be advanced for otherstakeholders in higher education such as businesses, professions andgovernments. This implies that information asymmetry exists; the value oftransparency tools is in rectifying these asymmetries in order to maximise thesocial benefits of higher education.
HIGHER EDUCATION MANAGEMENT AND POLICY – VOLUME 22/3 – © OECD 2010 3
MULTIDIMENSIONAL RANKING: A NEW TRANSPARENCY TOOL FOR HIGHER EDUCATION AND RESEARCH
Transparency instruments have become increasingly widespread overthe last decade. Classifications, rankings and league tables (three of the best-known transparency tools) have become part of the global higher educationscene. It is widely recognised now that, although these transparency tools aresometimes controversial, they are both well-established and increasinglyinfluential, impacting on both university and national decision makers. Theyreflect growing international competition among universities for talent andresources; at the same time their results reinforce competition. On a positivenote, they encourage decision makers to heighten their ambitions and tochallenge their higher education institutions to perform even better,especially in the case of research universities that dominate global leaguetables. However, major concerns remain in relation to the league tables’methodological underpinnings (Bowden, 2000; Clarke, 2002; Wende, 2008; Dilland Soo, 2005; Gottlieb, 1999; Harvey, 2008; King et al., 2008; Marginson, 2008;Usher and Savino, 2006; Dyke, 2005; Yorke, 1998) and to their policy impact onstratification rather than the diversification of their mission (IHEP, 2009;Marginson, 2008; Vught, 2008). Harvey summarised much of this criticism aspointing to a failure to follow accepted methodological rules in relation todeductive analysis (spanning from concept to indicators) and synthesis(spanning from indicators to a composite ranking). Instead, rankings are madefrom whatever indicators are measurable and available (Harvey, 2008).
While we agree with the principle of conceptual soundness and the needfor the deductive development of indicators, the main problem with Harvey’ssummary is that there is not a single theory explaining the link betweenhigher education and stakeholders’ information needs. Higher educationinstitutions have many stakeholders and target groups; these have multipleactions and intentions and sometimes lack clarity when expressing their owninformation needs. Moreover, “Not all nations or systems share the samevalues and beliefs about what constitutes ‘quality’ in tertiary institutions, andranking systems should not be devised to force such comparisons”(International Ranking Expert Group, 2006, principal number 5). Given thatthere are such different needs, different actors require different informationon different subjects. Consequently, multi-dimensional transparency toolstailored to individual needs are one obvious solution to complex, unclearinformation needs.
In terms of multiple stakeholders, we distinguish between:
● Students at the micro level of teaching.
● The same persons at the meso level, i.e. graduates of whole studyprogrammes.
● Employers (businesses and other organisations) who are “users” ofgraduates.
HIGHER EDUCATION MANAGEMENT AND POLICY – VOLUME 22/3 – © OECD 20104
MULTIDIMENSIONAL RANKING: A NEW TRANSPARENCY TOOL FOR HIGHER EDUCATION AND RESEARCH
● To some extent, the same companies who are users of research andinnovation.
● Local, regional and national authorities who are often users of highereducation institutions’ “third mission” (i.e. their mission to disseminateknowledge and innovation to their environment). In addition, they usuallyact as the guardians of the broader interests of society in terms of economicand social development and are often major funders.
At the same time, universities’ teaching and research staff are experts par
excellence who have cutting edge subject knowledge and, by using educationalmethods and research technologies, are in the unique position of being able to“delight the customers” (Juran and Gryna, 1988).
In this multi-stakeholders context, quality “is in the eye of the beholder”;it is a multi-dimensional concept which differs according to particularstakeholder perspectives, and it may be more accurate to talk of a “multitudeof qualities” (Brennan et al., 1992; Houston, 2008; Westerheijden, 2007).Transparency tools should reflect this conceptual multiplicity in order tocommunicate higher education institutions’ quality effectively to their users.
An assessment of current classifications and rankings
The preceding analysis requires some conceptual clarifications or at leastworking definitions. We regard “transparency tool” as an overarching term,covering all means of providing information on effort and performance inhigher education. We make an important distinction within transparencytools between classifications and rankings and, within rankings, betweenleague tables and multi-dimensional approaches.
A classification is a system that allocates objects to groups on the basis oftheir characteristics. Classifications show horizontal diversity, wheredifferences do not imply ordinal scales of “more”, “bigger” or “better”.
Rankings display vertical diversity in terms of performance by usingindicators. Most existing higher education rankings take the form of a leaguetable, a single-dimensional list going from “best” to “worst”, assigning ordinalnumbers to the entities which relate only to rank and not scales of difference.Other approaches to ranking use:
● multi-dimensional approaches, which do not try to combine education andresearch rankings, for example, into a single, composite measure and whichare often user-driven because they enable an interactive display of data;and/or
● robust group ratings rather than individual rankings, such as in leaguetables.
HIGHER EDUCATION MANAGEMENT AND POLICY – VOLUME 22/3 – © OECD 2010 5
MULTIDIMENSIONAL RANKING: A NEW TRANSPARENCY TOOL FOR HIGHER EDUCATION AND RESEARCH
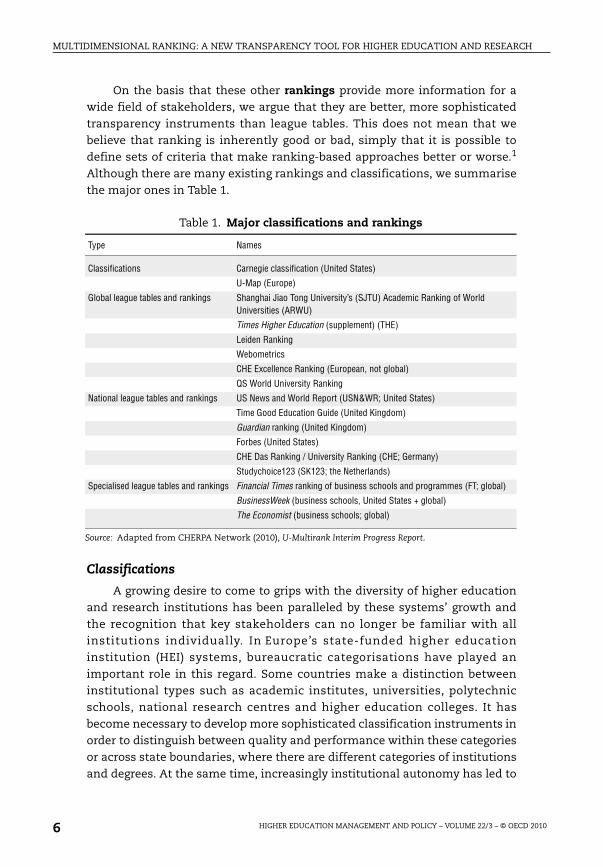
On the basis that these other rankings provide more information for awide field of stakeholders, we argue that they are better, more sophisticatedtransparency instruments than league tables. This does not mean that webelieve that ranking is inherently good or bad, simply that it is possible todefine sets of criteria that make ranking-based approaches better or worse.1
Although there are many existing rankings and classifications, we summarisethe major ones in Table 1.
Classifications
A growing desire to come to grips with the diversity of higher educationand research institutions has been paralleled by these systems’ growth andthe recognition that key stakeholders can no longer be familiar with allinstitutions individually. In Europe’s state-funded higher educationinstitution (HEI) systems, bureaucratic categorisations have played animportant role in this regard. Some countries make a distinction betweeninstitutional types such as academic institutes, universities, polytechnicschools, national research centres and higher education colleges. It hasbecome necessary to develop more sophisticated classification instruments inorder to distinguish between quality and performance within these categoriesor across state boundaries, where there are different categories of institutionsand degrees. At the same time, increasingly institutional autonomy has led to
Table 1. Major classifications and rankings
Type Names
Classifications Carnegie classification (United States)
U-Map (Europe)
Global league tables and rankings Shanghai Jiao Tong University’s (SJTU) Academic Ranking of World Universities (ARWU)
Times Higher Education (supplement) (THE)
Leiden Ranking
Webometrics
CHE Excellence Ranking (European, not global)
QS World University Ranking
National league tables and rankings US News and World Report (USN≀ United States)
Time Good Education Guide (United Kingdom)
Guardian ranking (United Kingdom)
Forbes (United States)
CHE Das Ranking / University Ranking (CHE; Germany)
Studychoice123 (SK123; the Netherlands)
Specialised league tables and rankings Financial Times ranking of business schools and programmes (FT; global)
BusinessWeek (business schools, United States + global)
The Economist (business schools; global)
Source: Adapted from CHERPA Network (2010), U-Multirank Interim Progress Report.
HIGHER EDUCATION MANAGEMENT AND POLICY – VOLUME 22/3 – © OECD 20106
MULTIDIMENSIONAL RANKING: A NEW TRANSPARENCY TOOL FOR HIGHER EDUCATION AND RESEARCH
strategic diversity, creating a heterogeneous picture of institutional goals,missions and priorities for institutions within the same category. Twoclassifications used to date stand out on an international level: the USCarnegie classification and the European U-Map classification tool.
The Carnegie Foundation first published its classification in 1973 as a toolfor researchers; this subsequently turned into an authoritative concept acrossthe United States and beyond (McCormick and Zhao, 2005). The Carnegieclassification was used widely and turned into something of a league table: tobe a “research I university” was prestigious, although this was not theobjective of its originators. To counteract this tendency, a major systemoverhaul in 2005 resulted in a multi-dimensional classification. The newclassifications were presented as “different lenses” on the higher educationlandscape:
They are organized around three fundamental questions: what is taught(Undergraduate and Graduate Instructional Program classifications), whoare the students (Enrollment Profile and Undergraduate Profile), andwhat is the setting (Size and Setting). The original Carnegie Classificationframework – now called the Basic classification – has also beensubstantially revised.2
The European U-Map classification methodology (Vught, 2009; Vughtet al., 2010) is currently being populated with HEI data.3 U-Map was originallydeveloped as a user-driven, multidimensional European classificationinstrument allowing all higher education and research institutions to beclassified in function of their efforts in six dimensions:
● research
● innovation
● education profile
● student profile
● internationalisation
● regional outreach
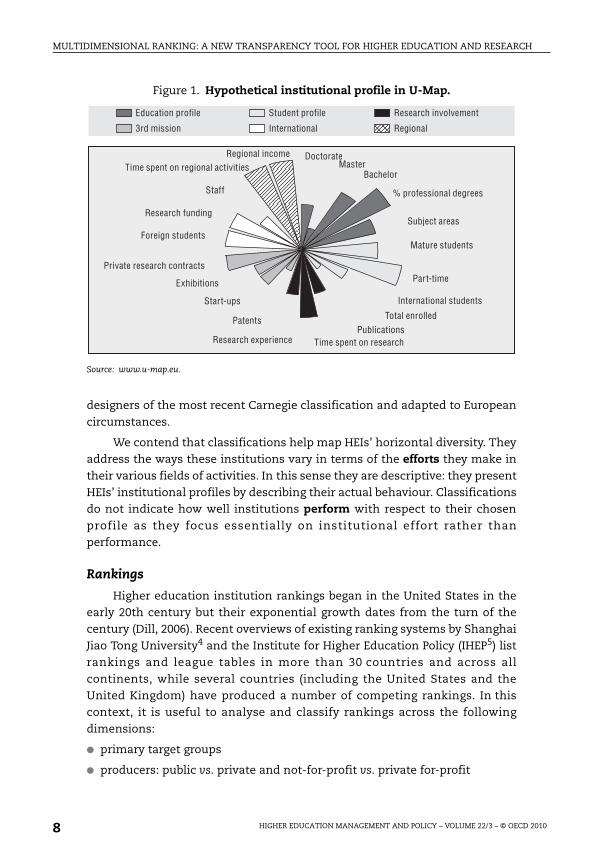
Each dimension is made up of several indicators. Ideally these reflectinstitutional efforts in different areas, the intention being to phase outperformance (output) indicators as effort-based indicators become available.At the heart of the U-Map concept is the creation and analysis of specific“institutional profiles”. This enables users to generate institutional “pictures”showing the various indicators in some or all of the six dimensions (Figure 1).U-Map has also developed access to data through two online tools (a profilefinder and a profile viewer) which permits stakeholders to analyseinstitutional profiles and undertake comparative analysis or institutionalstrategic profiling. U-Map was developed in close co-operation with the
HIGHER EDUCATION MANAGEMENT AND POLICY – VOLUME 22/3 – © OECD 2010 7
MULTIDIMENSIONAL RANKING: A NEW TRANSPARENCY TOOL FOR HIGHER EDUCATION AND RESEARCH
Figure 1. Hypothetical institutional profile in U-Map.
Source: www.u-map.eu.
designers of the most recent Carnegie classification and adapted to Europeancircumstances.
We contend that classifications help map HEIs’ horizontal diversity. Theyaddress the ways these institutions vary in terms of the efforts they make intheir various fields of activities. In this sense they are descriptive: they presentHEIs’ institutional profiles by describing their actual behaviour. Classificationsdo not indicate how well institutions perform with respect to their chosenprofile as they focus essentially on institutional effort rather thanperformance.
Rankings
Higher education institution rankings began in the United States in theearly 20th century but their exponential growth dates from the turn of thecentury (Dill, 2006). Recent overviews of existing ranking systems by ShanghaiJiao Tong University4 and the Institute for Higher Education Policy (IHEP5) listrankings and league tables in more than 30 countries and across allcontinents, while several countries (including the United States and theUnited Kingdom) have produced a number of competing rankings. In thiscontext, it is useful to analyse and classify rankings across the followingdimensions:
● primary target groups
● producers: public vs. private and not-for-profit vs. private for-profit
Student profileEducation profile Research involvement
3rd mission International Regional
% professional degrees
Subject areas
Mature students
Part-time
International students
Total enrolledPublications
Time spent on research
Patents
Start-ups
Exhibitions
Private research contracts
Foreign students
DoctorateMaster
Bachelor
Research funding
Staff
Time spent on regional activitiesRegional income
Research experience
HIGHER EDUCATION MANAGEMENT AND POLICY – VOLUME 22/3 – © OECD 20108
MULTIDIMENSIONAL RANKING: A NEW TRANSPARENCY TOOL FOR HIGHER EDUCATION AND RESEARCH
● level: institutional vs. field-based
● scope: national vs. international
● focus: education vs. research
We will discuss these dimensions in the following subsections, and thendiscuss methodological problems regarding data sources, league tables andcomposite indicators.
Primary target groups
Most national rankings expressly aim to inform (prospective) studentsand their parents about the quality of universities and programmes in theircountry. It is a challenge for these rankings to balance simplicity andsophistication. One of the principles of “good ranking” as specified in theBerlin Principles (International Ranking Expert Group, 2006) is that rankingsshould be geared towards their target group, but in this case there areopposing information needs. Prospective students are among those leastinformed about higher education, and for them, league table informationmust be simple and focused on education. At the same time, in order to gainlegitimacy within higher education communities, more sophisticatedinformation is needed to avoid accusations of oversimplification andinsensitivity to sectoral complexity (Federkeil, 2006). As HEIs also haveinterests to promote other than just their educational programmes, manyleague tables seek to include research information to help increase theauthoritativeness of their rankings. However, this means that until recentlyranking systems tended to give the impression that all available indicatorsmust be relevant for all types of users (King et al., 2008).
A similar problem faces international discipline- or field-based rankings,e.g. rankings of business schools which are published by, inter alia,6 theFinancial Times,7 These international field-based rankings first appeared ininternationally integrated professional fields such as business studies.Recently, other rankings have begun to address specific academic fieldsseparately, e.g. the CHE Excellence Ranking and the field rankings in theShanghai, Taiwanese and THE league tables.
It is important to recognise that not all students are alike: the US Newsand World Report (USN&WR) ranking and websites such as Studychoice123.nl(SK123) or CHE mainly target students entering higher education for the firsttime, i.e. typically adolescents completing secondary education. The FinancialTimes targets adults with at least several years of professional experiencewanting to gain specific skills. These are groups of completely differentlearners with their own study cost/benefit calculus, with different teachingexpectations, different knowledge about HEIs, different information needsand different social preferences and mobility. Given the importance of
HIGHER EDUCATION MANAGEMENT AND POLICY – VOLUME 22/3 – © OECD 2010 9
MULTIDIMENSIONAL RANKING: A NEW TRANSPARENCY TOOL FOR HIGHER EDUCATION AND RESEARCH
responding to diverse student needs, good rankings are those which providerobust information about investment considerations (e.g. future job chances;gaining specific competencies; having well-known teachers [e.g. in performingarts] or additional income [Westerheijden, 2009]). Good rankings should alsoprovide information on consumption considerations (e.g. the availability ofsports facilities at HEIs; the possibility of living on campus; acquiring a broadacademic education). Considerations relating to consumption may beparticularly important to first-time students, while those related toinvestment may be more important for returning students.
It is important to note that even specific target groups have multipleinformation needs. In addition, socially-excluded groups’ needs in relation toHEIs are severely constrained by a lack of contextual information such as thekinds of benefits or qualities they might acquire by attending university.League tables further contribute to a stratification of the student body in thatit is those with the highest social capital who tend to take them most intoaccount when making strategic higher education choices.
International or global rankings of HEIs do not generally refer explicitly toa defined target group, rather a broad audience closely or loosely involvedwith higher education. The most prominent global league table, Shanghai’sAcademic Ranking of World Universities (ARWU), was initially designed tocompare Chinese universities’ research performance in the fields of scienceand technology, and to compare performance between the Chinese nationalhigher education sector and the rest of the world, especially the United States.The ARWU was primarily a tool for steering national research policy andplanning; it therefore targeted policy makers and public authorities (inparticular the ministries of education, science and technology).
Detailed research rankings such as the Leiden Ranking (which analysesuniversity performance by using citation data) target university managers(i.e. institutional leaders and their support staff) by giving them informationon similar kinds of universities which are either their competitors or againstwhich they might mutually benchmark. Similarly, the Webometrics rankinginforms institutional leaders about their higher education or researchinstitutions’ relative prominence on the web, which is potentially useful forinforming decisions concerning open access publishing. Both of these focusedrankings (the Leiden Ranking and Webometrics) are designed to answerinstitutional staff’s specific information needs associated with strategicdecision making.
Rankings are also of interest to those beyond the primary target group.For example, politicians consult research-based league tables or rankingstargeted at prospective students. Leaders of HEIs are generally interested in alltypes of rankings because of their impact on institutional prestige, and in
HIGHER EDUCATION MANAGEMENT AND POLICY – VOLUME 22/3 – © OECD 201010
MULTIDIMENSIONAL RANKING: A NEW TRANSPARENCY TOOL FOR HIGHER EDUCATION AND RESEARCH
particular the negative prestige that results from low rankings. This raisesquestions about universities’ impartiality as data suppliers, and alerts us tothe risk that some institutions might be tempted to “adjust” the rankings inorder to enhance themselves or discredit their competitors (Bowman andBastedo, 2010; Dill and Soo, 2005; Hazelkorn, 2007; Sharp, 1995).
Producers of rankings
The majority of national rankings are produced by media companies, atrend started in the United States with the US News and World Report.Previously, some rankings had already been produced by academicinstitutions themselves (e.g. in economics), but in contrast to the mediarankings they did not receive substantial public attention. Other examples ofmedia rankings include The Times Good University Guide, league tablescompiled by the UK newspapers the Guardian and Independent, nationalrankings in France (Nouvel Observateur) and Italy (Sole 24 Ore). As commercialpublishers are interested in profit and sales, this raises the risk that they areless concerned by sound and stable methodology than garnering spectacularheadlines (Gottlieb, 1999; Stella and Woodhouse, 2006).
A minority of rankings are published by independent, national non-profitorganisations. These include the CHE rankings in Germany (although theyhave a media partner, Die Zeit), Studychoice123 in the Netherlands and aPolish ranking published by the Perspektywy Foundation.8 Furthermore, thereare a few examples of national rankings published by public institutions,e.g. the Higher Education Evaluation and Accreditation Council of Taiwan(HEEACT) and the Nigerian Rectors’ Conference.
There are six “global” rankings; these are differentiated in function oftheir geographical and disciplinary coverage. Three of them are compiled byacademic institutions (CWTS/Leiden University, École des Mines and ConsejoSuperior de Investigaciones Científicas [CSIC] in Spain). Whilst ARWU wasinitially produced by the Shanghai Jiao Tong University (SJTU), the unitresponsible for it became independent in 2009 and formed the ShanghaiRanking Consultancy.9 The THE ranking is an outlier among global rankings asit is generated by a major newspaper. Since THE changed its data supplierin 2009 in order to have more direct access to citation data and develop itsreputation survey, its previous partner (QS) launched its own product, WorldUniversity Rankings, so as of 2010 there are two commercial global rankingproducers.
Chinese Taipei’s HEEACT and the Dutch consortium SK123 (whichincludes many categories of stakeholders and benefits from a governmentalsubsidy) seem to be the rankers most closely related to public authorities.They are not involved with policy making in relation to higher education and
HIGHER EDUCATION MANAGEMENT AND POLICY – VOLUME 22/3 – © OECD 2010 11
MULTIDIMENSIONAL RANKING: A NEW TRANSPARENCY TOOL FOR HIGHER EDUCATION AND RESEARCH
research institutions, although some branches of HEEACT work on evaluationand accreditation issues. Most academic institutions which produce globalleague tables are public actors, but both CHE and Perspektywy are public-private partnerships; they are independent non-profit organisations withclose ties to national rectors’ conferences.
Increasingly, authors of rankings are revealing information on theirmethodology, often on their websites. However, as the AUBR Expert Group putit, it was “found that the results of the Shanghai Jiao Tong Academic Rankingof World Universities (ARWU) are not replicable, thus calling into question thecomparability and methodology used” (AUBR Expert Group, 2010, p. 56).
Institutional and field-based rankings
In broad terms, it is possible to distinguish between users who areinterested in institutional rankings and those interested in “fields”, which wedefine as smaller organisational units like faculties, schools or departmentsfocusing on a single area of knowledge. Fields may include academicdisciplines like economics and physics, interdisciplinary areas like businessstudies and nano-technology and single study programmes or researchprogrammes in a given area. Field-level rankings are of particular interest tostudents or individual researchers looking for a study or research base, sinceprogrammes across institutions may have quite different qualities. Indicatorsonly showing averages for whole institutions mask particularly strong or weakprogrammes, implying that for these users institutional rankings areirrelevant or even misleading.
Institutional-level rankings, on the other hand, are popular withgovernment policy makers and institutional leaders who have a legitimateinterest in overall characteristics at the institution level. In fact, somecharacteristics (such as an institution’s mission or its policies relating toparticipation) only apply at this level. Likewise, the institutional level is usefulfor mapping more detailed characteristics and identifying similar institutionsfor co-operation or benchmarking exercises. Besides, policy makers often limitthemselves to the institutional level, because it is here that they make policyand funding decisions.
Most global rankings (such as ARWU, THE, QS, Leiden, HEEACT,Webometrics) rank whole higher education and research institutions, and it isin this connection that they are generally associated with the “reputationrace” (Vught, 2008).10 ARWU, HEEACT and THE rankings also publish results forbroad fields, but they do not identify the “best institutions in the world” (orwhatever designates “best” according to the indicators used) for these fields.Instead, they create a new rank order of institutions from their generalranking in function of individual fields. This means that theoretically the
HIGHER EDUCATION MANAGEMENT AND POLICY – VOLUME 22/3 – © OECD 201012
MULTIDIMENSIONAL RANKING: A NEW TRANSPARENCY TOOL FOR HIGHER EDUCATION AND RESEARCH
rankings may miss out the best institutions if these do not figure in the overalltop scores. This way they put small, specialised institutions at a disadvantage.Some global rankings only focus on one specific field: the Financial Timesranking is solely concerned with business studies, irrespective of whetherthese are taught in comprehensive institutions or business schools. In thatsense, the FT ranking straddles the field vs. institution divide.
Several national rankings also focus on institutions as a whole, such asUSN&WR and Perspektywy. More typically, however, national rankings such asCHE Ranking and SK123 are geared to help prospective students make aninformed study programme choice in step with their individual preferences.
National vs. international rankings
The earliest rankings which were published compared colleges across50 US states. This was comparable to a national level from a technical point ofview, but in fact 50 states and around 4 000 HEIs constitute as large and ascomplex a higher education system as the European Higher Education Area,which comprises 47 countries and several thousand HEIs. Nevertheless, theUSN&WR league tables are more like national rankings in other countries andaim to inform US students about the best study options available across thewhole country. Similarly, at field level, the CHE Ranking aims to informstudents looking for undergraduate study programmes across all 16 Germanfederal states. These examples point to the fact that national-level rankingstend to be designed for a clearer purpose and with a more focused target groupin mind than global ones.
International rankings like the ARWU and THE primarily rank wholehigher education institutions. They are currently the most controversial andmost discussed rankings, as they are said to make or break institutionalreputations. Other international rankings such as the Leiden Ranking orWebometrics are more explicit about the limitations of their scope and claims,i.e. research performance and impact (Leiden Ranking) and web presence andactivity (Webometrics). That way, they evoke less vehement debate than theformer two.
There is a growing demand for more international transparency in thecontext of international mobility of students, and here we see two primarytrends. First, national rankings are expanding to neighbouring areas. Thus, theCHE ranking now includes institutions from inter alia Austria, Switzerland andthe Netherlands, although a pan-European ranking does not exist yet. Second,more focused international rankings are beginning to emerge: the CHEExcellence Ranking, for example, focuses on the European market for Mastersand PhD students. First piloted in 2007, this covers a limited number of fields
HIGHER EDUCATION MANAGEMENT AND POLICY – VOLUME 22/3 – © OECD 2010 13
MULTIDIMENSIONAL RANKING: A NEW TRANSPARENCY TOOL FOR HIGHER EDUCATION AND RESEARCH
and is restricted to international, research-oriented universities throughoutEurope.
Education vs. research
Rankings can have two different foci. First, they may set out to provideinformation about either education or research. For instance, the professedaim of the CHE rankings and SK123 is to inform students about the best placesto study, indicating a focus on education. Likewise, the Leiden Rankingexplicitly focuses on the research performance of HEIs. Also, the originalobjective of the ARWU was to inform policy makers in China about theposition of Chinese research universities (mainly in the fields of science andtechnology).
Second, another facet of the word “focus” relates to the actual indicatorsused to compose the ranking. A good ranking system is one in which theindicators used to establish a ranking (e.g. research productivity and impact)correspond to the focus the ranking claims to have (e.g. to inform institutionalleaders about the research strengths of their institution). Most nationalrankings which focus on informing (prospective) students do indeed haveindicators on teaching or use a mix of education and research indicators (plussome context variables). The majority of indicators used in the six main globalrankings give the ranking a tendency to evaluate research. Given its objective,this practice makes the Leiden Ranking a good one, but the same practice canbecome problematic if research-based rankings are used in any way asequivalent measures of general prestige or even quality.
Methodological issues
A substantial part of the current discussions on the “use and abuse” ofranking and categorisation relates to a set of methodological issues. In thissection we consider three issues that appear to be at the heart of thesediscussions, namely data sources, league tables and composite indicators inrankings.
Data sources
When reviewing the workings of the main ranking methodologies itappears that the data can be broken down into three broad categories:databases and statistics (national and international), data elicited from theinstitutions to be ranked (“self-reports”) and surveys from different types ofrespondent.
HIGHER EDUCATION MANAGEMENT AND POLICY – VOLUME 22/3 – © OECD 201014
MULTIDIMENSIONAL RANKING: A NEW TRANSPARENCY TOOL FOR HIGHER EDUCATION AND RESEARCH
Existing databases
The ideal solution from the point of view of validity, reliability andparsimoniousness of data collection (not bothering higher educationinstitutions with unnecessary questionnaires) is to use an existing database.An instructive example of this is the Carnegie Classification,11 whichdistinguishes higher education institutions in function of a large number ofcriteria and indicators. The information needed to construct these indicatorsis derived almost uniquely from a publicly available US-wide database, theIntegrated Postsecondary Education Data System (IPEDS). IPEDS is based onsurveys conducted annually by the United States’ Department of Education’sNational Center for Education Statistics (NCES).12 It is a legal obligation forHEIs benefiting from federal student aid programmes to report enrolments,programme completion, graduation rates, staff, finances, tuition fees andstudent financial aid data to IPEDS. IPEDS checks the quality of the self-reported data, which means that the Carnegie Foundation is neither burdenedwith data collection nor its verification. Institutions only have to report dataonce, rather than to both the government and the Carnegie classification.Almost all data used is freely available at the federal level in the United Sates.
The system described above is ideal for a classification or ranking, but israre. Databases exist in a number of countries, but few exist on aninternational level. The European U-Map project has been disadvantaged inrelation to the Carnegie Foundation given the absence of a Europe-widedatabase on individual higher education and research institutions.13 U-Maphas had to work with national databases and statistics, which raises twodifficulties. First, national-based data are notoriously difficult to gatherinternationally, given the plethora of national sources governed by differentdata protection laws. They are also hard to compare, due to different databeing collected across countries, which moreover often use differentdefinitions of what seem to be the same data. International publications onstatistics, such as the OECD’s annual Education at a Glance, therefore have anabundance of footnotes in every table or indicator, showing the limits ofcomparability of international statistics. A final problem that arises is thatinternational databases tend to gather information at the national systemlevel rather than for individual institutions or at the field level withininstitutions.
One area where it has been easy to effectively compare international datais in the field of bibliometric indicators. The two major databases used forlarge-scale comparative bibliometric studies are Web of Science (WoS) andScopus, which cover journal articles published in peer-reviewed journals.Nevertheless, the use of such data comes with its own problems, sincepublication cultures and modes vary considerably between different fields
HIGHER EDUCATION MANAGEMENT AND POLICY – VOLUME 22/3 – © OECD 2010 15
MULTIDIMENSIONAL RANKING: A NEW TRANSPARENCY TOOL FOR HIGHER EDUCATION AND RESEARCH
(e.g. Moed, 2005). Peer-reviewed journals are the prime vehicles for knowledgedissemination in the natural sciences, medical sciences and life sciences.However, in many applied sciences and in engineering, conferenceproceedings are more important than journal articles. In the social sciencesand humanities, book publications play an important role. Focusing the datacollection on journal articles (which are easily gathered) creates a bias infavour of the sciences and medicine. The corollary of this is that existingindicators penalise universities which are leaders in fields where journals areless important. However, both WoS and Scopus databases are rapidly repairingmajor lacunae by increasing coverage of journals in under-representeddomains of knowledge production, as well as that of international journalcoverage and conference proceedings. Nonetheless, the coverage of bothdatabases is likely to remain unsatisfactory for the arts and humanities in theforeseeable future.
A further problem comes from the fact that the journals included in thedatabases have so far been biased towards English language publications.Output from non-English speaking countries is therefore under-represented,as are publications from major countries which have a long tradition ofscientific research (e.g. France, Germany, China and Japan). A further drawbackis that this language bias also contains a disciplinary bias. The sciences aremostly international (English) in their modes of publication, while severalother fields in the humanities and social sciences have much strongernational research cultures, publishing in the languages of the countriesinvolved. Citation indicators in English therefore reinforce a bias towardssciences. WoS and Scopus have been trying to address this, in particular bydeveloping alternative databases covering humanities journals in moreEuropean languages.
Bibliometry also suffers from biases. For instance, publications by largeuniversities are cited more often than those by small ones. Also, the process ofcleansing data to assign publications to persons and institutions (or to ascribeweb pages to institutions), is far from straightforward, and this lowers thereliability of indicators unless rankers use them with great care (Moed, 2005;Raan, 2005).
Self-reports from higher education and research institutions
Where (international) databases fall short, self-reporting by highereducation and research institutions becomes the most used data source(Thibaud, 2009). Many types of data are efficiently gathered from institutionsthemselves such as staff composition, institutional facilities, budgetreallocation and licence income, if this is not available elsewhere. Institutions’virtual monopolies on such data create a “principal-agent” problem and openthe door to rankings being “adjusted” by manipulating data. Individual
HIGHER EDUCATION MANAGEMENT AND POLICY – VOLUME 22/3 – © OECD 201016
MULTIDIMENSIONAL RANKING: A NEW TRANSPARENCY TOOL FOR HIGHER EDUCATION AND RESEARCH
institutions’ definitions may differ, and almost certainly differ acrosscountries. Normalisation of data to a single, globally-used definition is rarelystraightforward. For these reasons, the plausibility of self-reported data needsto be externally tested and validated. Analysis also needs to be carried out onextreme cases e.g. through using time series data, triangulation with otherdata sources and using the expertise and knowledge of an advisory board.
Surveys
A number of rankings use data resulting from peer surveys (i.e. THE, QS,USN&WR and CHE) notably on institutions’ reputations, as well as informationon satisfaction levels from surveys among students and graduates (CHE,SK123).
The degree of satisfaction with which students (and graduates) rate theiruniversity experience is a category of data which is particularly valid forrankings that address prospective students (quality “is in the eye of thebeholder”). Experience from the CHE and SK123 rankings as well as nationalstudent surveys in the United Kingdom and Australia show that student andgraduate surveys produce robust comparative information about highereducation programmes. But to date little work has been done on theinternational comparability of this type of survey data. Clearly, it is affected bya range of country-specific factors such as culture (notably the acceptability ofcritiquing teachers) and scales (Westerheijden et al., 2008).
Another variable for which surveys are often used is institutionalreputation. An analysis of CHE data on the reputation of German, Swiss andAustrian universities (Federkeil, 2009) showed that reputation has to betreated with extreme caution in international rankings. Clearly, peers can bebiased as a result of unawareness of all but the most famous internationalhigher education and research institutions. The quality of the results dependsheavily on the quality and size of the sample. In 2009, a heated discussioneven broke out in the United States about the trustworthiness of USN&WR’speer reports: respondents to the ranking survey were accused of downgradingother higher education institutions in order to improve their own institutionalstandings.14
League tables
A focus on a specific category of data leads to a very restricted concept ofquality, and this narrowness has consequences. Nevertheless, such a narrowconcept of quality is what characterises many current rankings, where thefocus is on “world class research universities”. Governments have madesignificant efforts to build “world-class universities” through special funding.They have also been stimulating mergers or taking other measures in favour
HIGHER EDUCATION MANAGEMENT AND POLICY – VOLUME 22/3 – © OECD 2010 17
MULTIDIMENSIONAL RANKING: A NEW TRANSPARENCY TOOL FOR HIGHER EDUCATION AND RESEARCH
of these universities (Salmi, 2009). This approach has been criticised forconcentrating efforts at the expense of interest in, and resources for, otherparts of higher education systems. Similarly, AACSB, a specialist accreditationorganisation in the field of management, criticised MBA programme rankingsfor taking the risk of narrowing the diversity of business studies to a single,highly specific course, the MBA (AACSB, 2005, p. 7).
Most rankings, both national and international, are published as leaguetables and to be ranked at the top implies higher quality. This kind of leaguetable is ranked on an ordinal scale, and this poses problems. A change in rankdoes not necessarily signify a change in institutional quality if theperformance of others has changed. Further problems can arise when rankingdifferences are within the margins of error of the methodologies used. Also,there is a strong risk of random ranking fluctuations arising frommeasurement errors. For example, in the 2008 THE World Rankings, thedifference between the universities ranked number 27 (Brown university) and43 (University of Queensland) was only 4.5 points, and between numbers50 and 100 it was only 10 points. In the QS rankings, between 2009 and 2010,10 institutions varied more than 20 places in the league tables. Hence, thesetend to exaggerate differences between institutions and put an extremeemphasis on vertical stratification.
Composite indicators
Composite indicators in rankings are scores that are derived fromcombining a set of underlying variables which produce a single score.Obviously, the choice of variables and the weighting given to individualvariables influence the outcomes, as well as the rankings, which emerge inthese situations. This raises three issues which need further reflection.
First, assigning weights to individual indicators needs a conceptualmodel with a set of arguments about the relative weight of the indicatorswhen defining quality. A 1997 study by the National Opinion Research Centeron the USN&WR rankings confirmed that “the weights used to combine thevarious measures into an overall rating lack any defensible empirical ortheoretical basis”.15 To this day, the problem persists that there are neithergenerally accepted theoretical nor definite empirical arguments for assigningparticular weights to individual indicators (Dill and Soo, 2005). Moreover, theweighting choices create an implicit bias in favour of specific types of highereducation institution. Reputation, as measured by international surveys, is forinstance enhanced by HEIs being located in a major, well-known city – and byestablishing a university brand (Marginson, 2008).
Second, rankings target different groups and these have differentpriorities and preferences when it comes to comparing universities and
HIGHER EDUCATION MANAGEMENT AND POLICY – VOLUME 22/3 – © OECD 201018
MULTIDIMENSIONAL RANKING: A NEW TRANSPARENCY TOOL FOR HIGHER EDUCATION AND RESEARCH
making choices. Moreover, individual users have different priorities andpreferences, e.g. prospective students use heterogeneous criteria for selectinga university. To be relevant for users’ decision-making processes, rankingsystems must account for this heterogeneity and potentially leave thedecision about the relevance – and weighting – of indicators to the users.A composite indicator with fixed weights risks patronising the users ofrankings by predetermining the importance and relevance of differentindicators. Eccles (Eccles and Gootman, 2002) pointed out that fixed weightsalso fail to acknowledge non-traditional students’ interests, as these may havepriorities and interests different from “mainstream” weighting systems.To offer a more user-driven approach, some web-based rankings haveintroduced an interactive tool in order to let users decide about the relevanceof indicators. Some rankings (including the Guardian) do this by allowing theuser to assign their own weights to the indicators forming the compositeindicator. Others such as SK123, CHE and HEEACT allow users to give priorityto a number of indicators, resulting in a personalised ranking of programmesor institutions.
Third, the methodology used by the THE and Shanghai Jiao TongUniversity rankings to construct their composite indicator has been analysedstatistically and was found to be relatively unrobust (Saisana and D’Hombres,2008). Through a sensitivity analysis and simulations using differentweightings, Saisana and D’Hombres showed that 67% of universities in theTHE ranking and 60% in the Shanghai Ranking were highly sensitive to thecomposition of the overall score. The variation of league table positionsaccording to different indicator models in general is greatest in the lowerranks, but even the Massachusetts Institute of Technology drifted from the10th to the 25th position according to THE data (ibid., p. 53). Saisana andD’Hombres concluded that “no conclusive inference regarding the relativeperformance for the majority of the universities can be drawn from eitherranking” (ibid., p. 8).
Discussion
All over the world higher education and research systems are becomingmore complex. Stakeholders are looking for valid and reliable informationabout their own systems but increasingly also across national borders. Morenational and international classifications and rankings are being produced torespond to this need for greater transparency.
Asbhy’s well-known Law of Requisite Variety makes us realise that themore complex higher education systems become, the more complex our wayof looking at them needs to be. In other words, for a simple system of uniformuniversities, perhaps all we need is an elementary league table. However,
HIGHER EDUCATION MANAGEMENT AND POLICY – VOLUME 22/3 – © OECD 2010 19
MULTIDIMENSIONAL RANKING: A NEW TRANSPARENCY TOOL FOR HIGHER EDUCATION AND RESEARCH
given contemporary complexities, more complex instruments are needed ifwe are to obtain the degree of transparency we are looking for (cf. Vught, 1993).Sophisticated transparency tools are also needed because the role of highereducation in society is expanding. As different kinds of stakeholders comeinto contact with universities they bring their own information needs, whichtransparency tools need to serve if they are to effectively meet their own goals.
Transparency tools are designed to help stakeholders form judgementsand take decisions. In this context, information needs among differentstakeholders in higher education are diverse (see, for example, AUBR ExpertGroup, 2010). Moreover, stakeholders are not homogeneous groups: specificcategories of professionals may need tailored study programmes, quite unlikethose of secondary-school leavers. Transparency tools therefore must bedesigned with flexiblity to cater for these different needs.
Our analysis builds on a growing literature that critiques existingtransparency tools. Our aim, however, is not to suggest that we should stoppublishing rankings: many groups of stakeholders show a clear and legitimateneed for information on higher education, research institutions and studyprogrammes. Transparency tools such as classifications and rankingstherefore have an important role to play in the further development of theexternal quality assurance of higher education and research. The wayforward, in our opinion, is to improve transparency tools, and there are twoavenues to achieve this.
The first requires rankers to “self-regulate” by articulating more clearlythe principles of ranking and what constitutes “good” ranking. With this inmind, a number of rankers and experts have established the InternationalRanking Expert Group (IREG), which convenes regularly. At its meeting inBerlin in 2006, it agreed on a set of basic principles for good ranking practice,commonly called the Berlin Principles (International Ranking Expert Group,2006). The Berlin Principles set out to establish good practice in relation to thepurposes and goals of rankings, the design and weight of indicators, thecollection and processing of data and the presentation of ranking results.Accordingly, they call for:
● Clarity about purpose and target groups.
● Recognition of the diversity of institutions.
● Transparency in ranking methodologies.
● The measurement of outcomes, not inputs.
● Providing consumers with a clear understanding of how a given rankingwas developed and offering them a choice of how rankings are displayed.
● The application of quality assurance principles to the ranking itself.(N.B. From 2011 onwards, the IREG plans to audit and recognise rankings.)
HIGHER EDUCATION MANAGEMENT AND POLICY – VOLUME 22/3 – © OECD 201020
MULTIDIMENSIONAL RANKING: A NEW TRANSPARENCY TOOL FOR HIGHER EDUCATION AND RESEARCH
In general, the Berlin Principles are perceived as relevant guidance onwhat should constitute “good” rankings. Their application reflects themultidimensional understanding of the concept of quality.
The second avenue is via the recognition of the multiplicity ofstakeholders’ interests in higher education and research and hence of theimportance of creating multidimensional ranking tools. At CHEPS we arecurrently preparing a feasibility study to do exactly that, i.e. develop amultidimensional global ranking tool that is able to address differentstakeholders’ needs. The study in question is the “U-Multirank” project,16
which is undertaken by an international research consortium. In addition toCHEPS it involves producers of well-established specialised rankings, namelyCHE (which contributes experience with student-focused programmerankings), and CWTS (from the Leiden research ranking). Applied research andinnovation – something which has hitherto not featured widely in ranking – isrepresented in U-Multirank by INCENTEM, which is located at the Universityof Leuven in Belgium. The Paris-based Observatoire des Sciences et desTechniques (OST) is also part of the research team. The researchers’ diverseareas of expertise reflect the project’s goal, which is to design in a deductiveway a ranking that reflects all missions of higher education and researchinstitutions, while recognising that not all institutions need to perform on alldimensions.
A deductive rather than opportunistic approach calls for bringingtogether existing indicators (that effectively measure what matters) anddeveloping new ones, such as regional impact indicators, where they do not.The project involves a pilot field test to explore the extent to which indicatorsmay be developed in such a way that they reflect higher education andresearch institutions’ performance in the most varied contexts. The rankingexercise seeks to reflect various stakeholders’ needs, developing both focusedrankings for higher education and research institutions as a whole (forinstitutional decision makers and national policy makers) and field-basedrankings to inform (prospective) students.
This is clearly a large, difficult and potentially risky undertaking, and thefact that existing rankings have focused on available data underscores that“measuring what matters” is extremely difficult. To ensure legitimacy as wellas validity, the development of the U-Multirank project is embedded in acontext in which both international experts and stakeholders are represented.The final report will be published in 2011 and will furnish empirically-grounded answers to the question of whether it is possible to make highereducation and research transparent on a world-wide scale.
Only future research will tell whether it is possible to design andimplement a multidimensional ranking tool on an international scale. But
HIGHER EDUCATION MANAGEMENT AND POLICY – VOLUME 22/3 – © OECD 2010 21
MULTIDIMENSIONAL RANKING: A NEW TRANSPARENCY TOOL FOR HIGHER EDUCATION AND RESEARCH
such a tool will only make higher education and research transparent if it canalso address the various methodological problems discussed above.In addition, this tool should at least address the following three issues. First,higher education institutions should be allowed to present their own specific“institutional performance profiles”. Second, rankings should be able to meetdifferent stakeholders’ needs, and third, higher education and researchinstitutions should be able to showcase their strengths. If these threeconditions can be fulfilled, then multidimensional ranking may well mark thenext generation of transparency tools.
The authors:
Frans A. van VughtHonorary Professor and former President of the University of TwenteCenter for Higher Education Policy Studies (CHEPS)University of TwenteP.O. Box 2177500 AE EnschedeThe NetherlandsE-mail: [email protected]
Don F. WesterheijdenSenior research associateCenter for Higher Education Policy Studies (CHEPS)University of TwenteP.O. Box 2177500 AE EnschedeThe NetherlandsE-mail: [email protected]
The authors wish to thank Dr. Paul Benneworth of the Center for HigherEducation Policy Studies (CHEPS) for his contribution in finalising this text.They would also like to mention that parts of this text are drawn from twoproject reports – to which they contributed – which are available online: Designand Testing the Feasibility of a Multi-dimensional Global University Ranking (CHEet al., n.d.) and U-Multirank: Interim Progress Report (CHERPA Network, 2010).
This project has been funded with support from the European Commission.
HIGHER EDUCATION MANAGEMENT AND POLICY – VOLUME 22/3 – © OECD 201022
MULTIDIMENSIONAL RANKING: A NEW TRANSPARENCY TOOL FOR HIGHER EDUCATION AND RESEARCH
Notes
1. This is complicated by the fact that “ranking” may be a noun or a verb, while thereis no corresponding verb for “league table”; some confusion stemming from ouruse of verbs may be unavoidable. More confusion comes from many league tablesbeing called “rankings”.
2. See: The Carnegie Foundation for the Advancement of Teaching, http://classifications.carnegiefoundation.org/.
3. See: www.u-map.eu.
4. See: www.arwu.org/RankingResources.jsp.
5. See: www.ihep.org/Research/nationalrankingsystems.cfm.
6. For an overview, see www.find-mba.com/mba-rankings.
7. See: http://rankings.ft.com/businessschoolrankings.
8. See: www.perspektywy.org.
9. See: www.arwu.org.
10. Reputation is an efficient, therefore attractive indicator of “quality” for actors whodo not have the time or resources to search for detailed information (Stigler, 1961).Therefore, Rankings enjoy a high level of acceptance among stakeholders and thewider public because of their simplicity and consumer-type information (AUBRExpert Group, 2010).
11. See: www.carnegiefoundation.org/classifications.
12. See: http://nces.ed.gov/ipeds.
13. The EU has launched a project to investigate options of getting institutional-leveldata; see the EUMIDA project (www.eumida.org). Also, the AUBR Expert Grouprecommends setting up a regular observatory on research information from HEand research institutions (AUBR Expert Group, 2010).
14. See: www.insidehighered.com/news/2009/08/19/rankings.
15. See: www.washingtonmonthly.com/features/2000/norc.html.
16. See: www.u-multirank.eu. This article reflects the views only of the authors. TheCommission cannot be held responsible for any use which may be made of theinformation contained therein.
References
AACSB (2005), The Business School Rankings Dilemma: A Report from a Task Force of AACSBInternational’s Committee on Issues in Management Education, AACSB, Tampa.
AUBR Expert Group (2010), Assessing Europe’s University-Based Research, EuropeanCommission, Directorate General for Research, Brussels.
Bonroy, O. and C. Constantatos (2008), “On the use of labels in credence goodsmarkets”, Journal of Regulatory Economics, Vol. 33, No. 3, pp. 237-252.
Bowden, R. (2000), “Fantasy higher education: University and College League Tables”,in Quality in Higher Education, Vol. 6, No. 1, Routledge, pp. 41-60.
HIGHER EDUCATION MANAGEMENT AND POLICY – VOLUME 22/3 – © OECD 2010 23
MULTIDIMENSIONAL RANKING: A NEW TRANSPARENCY TOOL FOR HIGHER EDUCATION AND RESEARCH
Bowman, N.A. and M.N. Bastedo (2010), “Anchoring effects in world universityrankings: exploring biases in reputation scores”, in Higher Education, SpringerScience.
Brennan, J. et al. (1992), Towards a methodology for comparative quality assessment inEuropean higher education: A pilot study on economics in Germany, the Netherlands andthe United Kingdom, CNAA/CHEPS/HIS, London/Enschede/Hannover.
Clarke, M. (2002), “Quantifying Quality: What Can the US News and World ReportRankings Tell us About the Quality of Higher Education?”, in Education PolicyAnalysis Archives, Vol. 10, No. 16.
Dill, D.D. (2006), “Convergence and Diversity: The Role and Influence of UniversityRankings”, paper presented at the CHER 19th Annual Research Conference, Kassel,7-9 September.
Dill, D.D. and M. Soo (2005), “Academic Quality, League Tables, and Public Policy:A Cross-National Analysis of University Ranking Systems”, in Higher Education,Vol. 49, pp. 495-533.
Dulleck, U. and R. Kerschbamer (2006), “On Doctors, Mechanics, and ComputerSpecialists: The Economics of Credence Goods”, Journal of Economic Literature,Vol. 44, No. 1, pp. 5-42.
Dyke, N. (van) (2005), “Twenty Years of University Report Cards”, Higher Education inEurope, Vol. 30, No. 2, pp. 103-125.
Eccles, J.S. and J.A. Gootman (eds.) (2002), Community programs to promote youthdevelopment, National Academy Press, Washington.
Federkeil, G. (2006), “Rankings and Quality Assurance in Higher Education”, in HigherEducation in Europe, Vol. 33, pp. 209-218.
Federkeil, G. (2009), “Reputation indicators in rankings of higher educationinstitutions”, in B.M. Kehm and B. Stensaker (eds.), University Rankings, Diversityand the New Landscape of Higher Education, Sense Publishers, Rotterdam/Taipeh,pp. 19-34.
Gottlieb, B. (1999), “Cooking the School Books: How US News cheats in picking its ‘bestAmerican colleges’”, in Slate, 1 September.
Harvey, L. (2008), “Rankings of Higher Education Institutions: A Critical Review”,Editorial, Quality in Higher Education, Vol. 14, No. 3, pp. 187-207.
Hazelkorn, E. (2007), “The impact of league tables and ranking systems on highereducation decision-making”, in Higher Education Management and Policy, Vol. 19,No. 2, pp. 87-110.
Houston, D. (2008), “Rethinking Quality and Improvement in Higher Education”, inQuality Assurance in Education, Vol. 16, No. 1, pp. 61-79.
IHEP (2009), Impact of College Rankings on Institutional Decision Making: Four Country CaseStudies, Institute for Higher Education Policy, Washington DC.
International Ranking Expert Group (2006), Berlin Principles on Ranking of HigherEducation Institutions, www.che.de/downloads/Berlin_Principles_IREG_534.pdf,accessed 24 June 2006.
Juran, J.M. and F.M. Gryna (1988) (ed.), Juran’s Quality Control Handbook (4th ed.),McGraw-Hill, New York.
HIGHER EDUCATION MANAGEMENT AND POLICY – VOLUME 22/3 – © OECD 201024
MULTIDIMENSIONAL RANKING: A NEW TRANSPARENCY TOOL FOR HIGHER EDUCATION AND RESEARCH
King, R. et al. (2008), Counting what is measured or measuring what counts? League tablesand their impact on higher education institutions in England, April 2008/14, HigherEducation Funding Council for England, s.l.
Marginson, S. (2008), Global, multiple and engaged: Has the ‘Idea of a University’ changed inthe era of the global knowledge economy?, paper presented at the Fifth InternationalWorkshop on Higher Education Reforms “The Internationalization of HigherEducation and Higher Education Reforms”, accessed 26 May 2009.
McCormick, A.C. and C.M. Zhao (2005), “Rethinking and Reframing the CarnegieClassification” in Change, pp. 51-57, September/October.
Moed, H.F. (2005), Citation Analysis in Research Evaluation, Springer, Dordrecht.
Raan, A.F.J. (van) (2005), “Fatal attraction: Conceptual and methodological problems inthe ranking of universities by bibliometric methods”, in Scientometrics, Vol. 62,No. 1, Akadémiai Kiadó, Budapest and Springer, Dordrecht, pp. 133-143.
Saisana, M. and B. D’Hombres (2008), Higher Education Rankings: Robustness Issues andCritical Assessment. How much confidence can we have in Higher Education Rankings?Office for Official Publications of the European Communities, Luxembourg.
Salmi, J. (2009), The Challenge of Establishing World-Class Universities, World Bank,Washington DC.
Sharp, W. (1995), “Building reputations: How the game is played”, in 21st CenturyResearch at Columbia, Vol. 1, No. 1.
Stella, A. and D. Woodhouse (2006), Ranking of higher education institutions, AUQA,Melbourne.
Stigler, G. J. (1961), “The economics of information”, in Journal of Political Economy, LXIX,pp. 213-225.
Thibaud, A. (2009), Vers quel classement européen des universités ? Étude comparative duclassement de Shanghai et des autres classements internationaux (Note deBenchmarking 4), Institut Thomas More, Paris/Brussels.
Usher, A. and M. Savino (2006), A world of difference: A global survey of university leaguetables, Educational Policy Institute, Toronto.
Vught, F.A. (van) (2008), “Mission diversity and reputation in higher education”, HigherEducation Policy, Vol. 21, No. 2, pp. 151-174.
Vught, F.A. (van) (1993), Governmental Strategies and Innovation in Higher Education(2nd ed.), Jessica Kingsley, London.
Vught, F.A. (van) (ed.) (2009), Mapping the Higher Education Landscape: Towards a EuropeanClassification of Higher Education, Springer, Dordrecht.
Vught, F.A. (van) et al. (2010), U-Map: The European Classification of Higher EducationInstitutions, CHEPS, Enschede.
Wende, M. (van der) (2008), “Rankings and Classifications in Higher Education,A European perspective”, in J.C. Smart (ed.), Higher Education: Handbook of Theoryand Research, Vol. 23, pp. 49-71, Springer, Dordrecht.
Westerheijden, D.F. (2003), “Movements towards a European Dimension in QualityAssurance and Accreditation”, in D.F. Westerheijden and M. Leegwater (eds.),Working on the European Dimension of Quality: Report of the conference on qualityassurance in higher education as part of the Bologna process, Amsterdam, 12-13 March2002, Ministerie van Onderwijs, Cultuur en Wetenschappen, Zoetermeer, pp. 16-41.
HIGHER EDUCATION MANAGEMENT AND POLICY – VOLUME 22/3 – © OECD 2010 25
MULTIDIMENSIONAL RANKING: A NEW TRANSPARENCY TOOL FOR HIGHER EDUCATION AND RESEARCH
Westerheijden, D.F. (2007), “The Changing Concepts of Quality in the Assessment ofStudy Programmes, Teaching and Learning”, in A. Cavalli (ed.), Quality Assessmentfor Higher Education in Europe, Portland Press, London, pp. 5-16.
Westerheijden, D.F. (2009), “Information of Quality and Quality of Information toMatch Students and Programme”, in J. Newton and R. Brown (eds.), The Future ofQuality Accurance, EAIR, Amsterdam.
Westerheijden, D.F. et al. (2008), “Excellence goes international: Piloting the CHEranking of study programmes in Flanders and the Netherlands”, paper presentedat the 21st Annual CHER Conference, Pavia, 11-13 September.
Yorke, M. (1998), “The Times’ league table of universities, 1997: A statistical appraisal”,in Quality Assurance in Education, Vol. 6, No. 1, pp. 58.
HIGHER EDUCATION MANAGEMENT AND POLICY – VOLUME 22/3 – © OECD 201026