multidimensional signal processing -...
TRANSCRIPT

MultiDimensional Signal ProcessingMaster Degree in “Ingegneria delle Telecomunicazioni”
A.A. 2015-2016
Pietro Guccione, PhD
Pietro Guccione – Assistant Professor in Signal Processing
([email protected], http://dee.poliba.it/guccioneweb/index.html )
DEI - DIPARTIMENTO DI INGEGNERIA ELETTRICA E DELL’INFORMAZIONEPOLITECNICO DI BARI

Lecture 1 - Summary
Introduction to the class
What is the MultiDimensional (MultiVariate) Signal Processing
The main elements of multidimensional signal processing
Examples of the problems that can be solved.
2

Motivation
Multidimensional Signal Processing (MDSP) is a powerful and well-established set of methods for extracting information or build models ormake prediction starting from multivariate datasets.
It consists in a statistical, mathematical (sometimes also graphical) set of techniques that consider multiple variables simultaneously.
Multidimensional Signal Processing includes / is included / is synonym of:
Multivariate Analysis
Multivariate Statistical Analysis
Multivariate Statistical Processing
… and has some relation with
Machine learning
Data mining
Big data analysis
Fields of applications:
Engineering, chemistry, physics, astrophysics, biology, economics, geology, geophysics, social studies, …
3
What is the focus of the class?
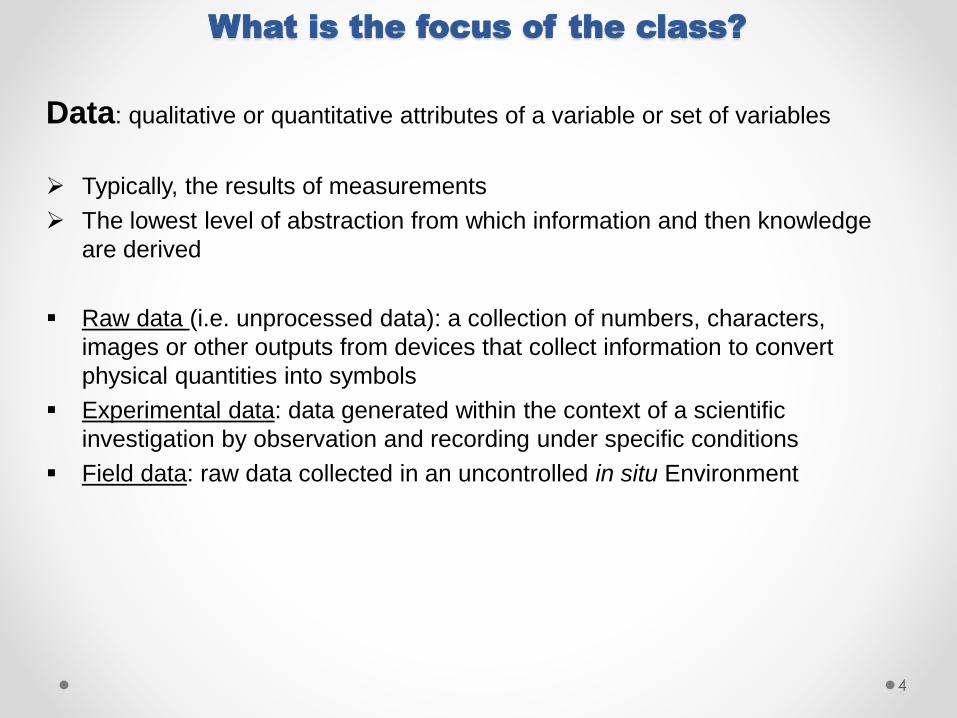
Data: qualitative or quantitative attributes of a variable or set of variables
Typically, the results of measurements
The lowest level of abstraction from which information and then knowledge
are derived
Raw data (i.e. unprocessed data): a collection of numbers, characters,
images or other outputs from devices that collect information to convert
physical quantities into symbols
Experimental data: data generated within the context of a scientific
investigation by observation and recording under specific conditions
Field data: raw data collected in an uncontrolled in situ Environment
4

Types of Data
Quantitative
– Counts
'there are 1024 pixels in the image'
‘the number of planets is 8’
– Measurements
'the distance from Rome to Milan is 540km’
'the temperature at 18:00 pm is 15.0° C'
'the snow depth is 1.2m‘
Qualitative
– Categorical
The subject has disease X (among a finite number of diseases)
– Binary (a special case of categorical)
The sex of that subject is ‘female’
That subject has a ‘positive’ diagnosis for disease X (positive/negat)
5

How to collect data
6
Data can be collected from observation of natural (i.e. from nature) phenomena or
human activity. Usually, physical quantities coming from natural phenomena are
continuous (not all!)
So data must be (in such cases)
Spatially sampled (example:
images)
Temporally sampled (example:
time series)
Spatially-Temporally sampled
(example: video, or a set of
images as in a MRI)

Data Representation
7
In Signal Processing and Multidimensional SP, ‘data’ are represented
and/or considered outcomes of random variables or samples of
realization of stochastic processes
We assume our ‘data’ as the result of an experiment
or
The sampling of a time (or spatial) realization of a more complex stochastic
process.
Terminology:
– Outcome X (the value of a random variable)
– A set of possible values {a1, a2, …, aN} for X (alphabet/dynamic/range)
– A set {p1, p2, …, pN} of probabilities associated to each possible value of
X
There are many different types of data, each characterized by different
properties (numerical, ordinal, binary, categorical, percentage, …)

Pre-requisites of Multidimensional Signal
Processing
Multidimensional Signal Processing (MDSP) grounds on mathematical
concepts.
For this reason, the following knowledge are required:
Basics of Linear Algebra (vector/matrix representation and operations,
matrix decomposition, eigenvalues/eigenvectors, etc);
Basics of Signal Theory (signal representation, 1-D and multi-dimensional
signal, correlation, etc);
Basics of Probability Theory (random variable, pdf, elementary r.v., etc);
Basics of Stochastic Processes (definition, properties, statistics, stationarity,
correlation, spectrum, etc);
Basics of Signal Processing (Nyquist Theorem, aliasing, filtering);
Basics of MatLab® / R® programming language and database organization.
8

MDSP: a lot of techniques/words…
9
Dimensionality
Reduction
Multivariate
Analysis
Cluster
Analysis
Supervised
Principal
Component
Analysis
Independent
Component
Analysis
Support
Vector
Machine
Multiple/Multivariate
Linear
Regression
Unsupervised
Canonical
Correlation
Analysis
K-nearest
Neighbor
Partial Least
Square
Regression
Linear
Discriminant
Analysis
Regression
Discrimination

Multiple/Multivariate
Linear
Regression
… to be sorted
10
Dimensionality
Reduction
Multivariate
Analysis
Cluster
Analysis
Supervised
Principal
Component
Analysis / CCA
Independent
Component
Analysis
Support
Vector
Machine
Unsupervised
Non Negative
Matrix
Factorization
K-nearest
Neighbor
Partial Least
Square
Regression
Linear
Discriminant
Analysis
Regression
Discrimination

Learning
11
Learning= observe data, get ‘best’ model
Learning might refer to
– model structure (topology)
– model parameters (also called ‘systems identification’)
– both
Another important distinction:
– all the variables are observed
– some variables are hidden (i.e. cannot be observed)

Learning Process
12
Imagine an agent (organism or machine) which experiences a
series of inputs:
x1,…,xN

Unsupervised Learning
13
The goal is to build representations of X that can be used
for reasoning, decision making, predicting things,
communicating etc.
x1,…,xN
P(X) ???

Supervised Learning
14
The system is also given desired outputs y1, y2, . . ..
The goal is to learn how to produce the correct output given a
new input.
x1,…,xN
y(x) ??y1,…,yN yN+1
Supervised / Unsupervised Learning
15
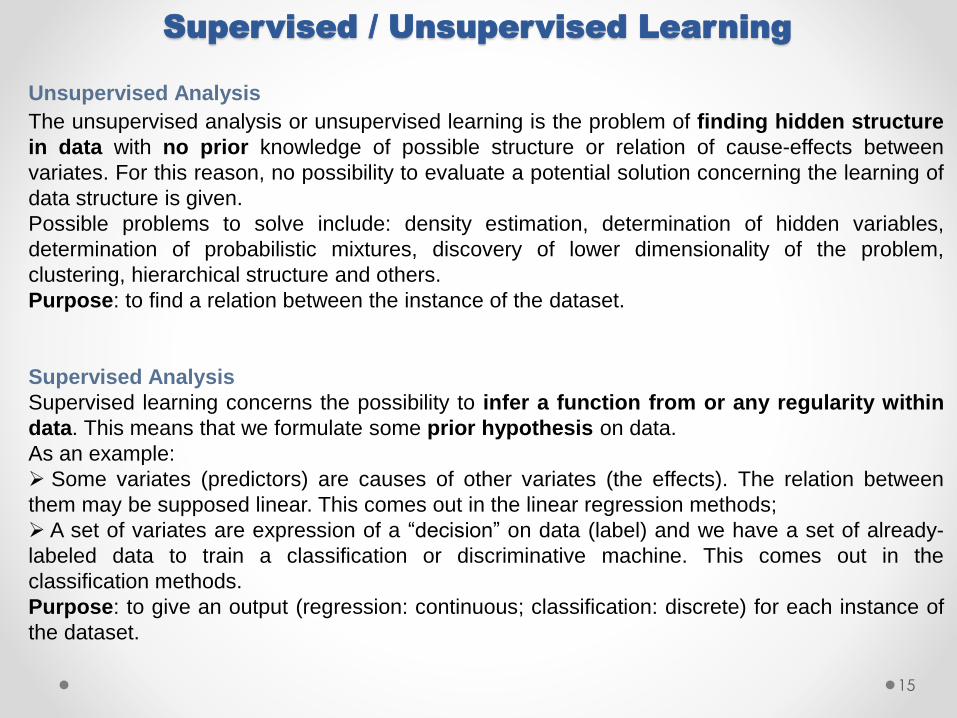
Unsupervised Analysis
The unsupervised analysis or unsupervised learning is the problem of finding hidden structure
in data with no prior knowledge of possible structure or relation of cause-effects between
variates. For this reason, no possibility to evaluate a potential solution concerning the learning of
data structure is given.
Possible problems to solve include: density estimation, determination of hidden variables,
determination of probabilistic mixtures, discovery of lower dimensionality of the problem,
clustering, hierarchical structure and others.
Purpose: to find a relation between the instance of the dataset.
Supervised Analysis
Supervised learning concerns the possibility to infer a function from or any regularity within
data. This means that we formulate some prior hypothesis on data.
As an example:
Some variates (predictors) are causes of other variates (the effects). The relation between
them may be supposed linear. This comes out in the linear regression methods;
A set of variates are expression of a “decision” on data (label) and we have a set of already-
labeled data to train a classification or discriminative machine. This comes out in the
classification methods.
Purpose: to give an output (regression: continuous; classification: discrete) for each instance of
the dataset.

Evaluation of ouput
/ components /
regressors / model
General appoach to a MV problem
16
Data Pre-processing
[normalization]
Component
Analysis (Biplot)
R2 and Q2
analysis
Cluster
analysis
PCA PLSR Clustering …
Example of application: chemometrics
17
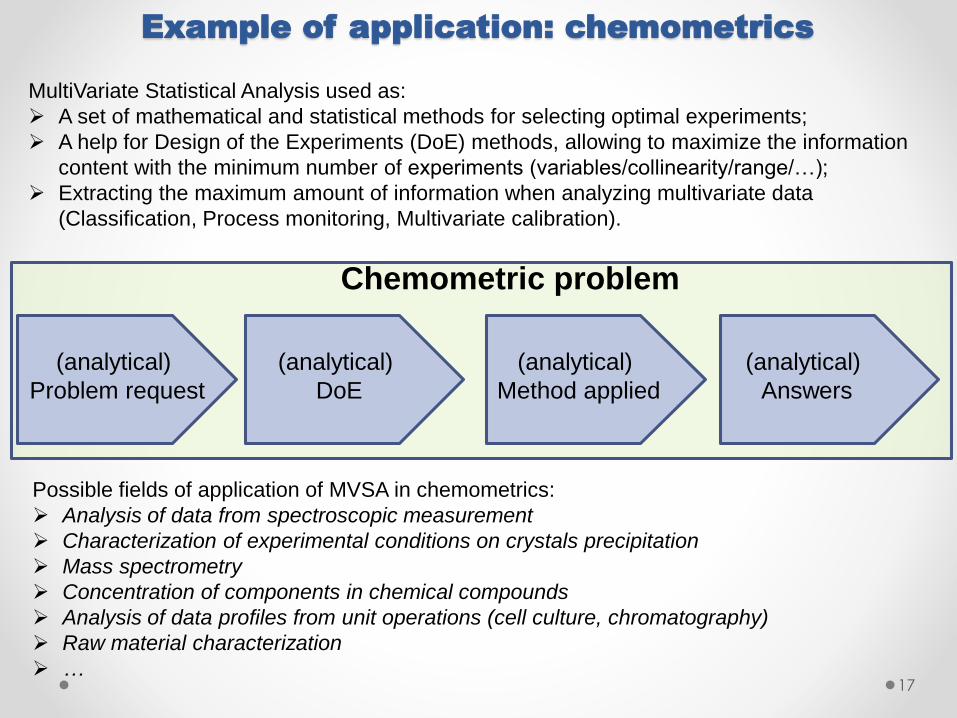
MultiVariate Statistical Analysis used as:
A set of mathematical and statistical methods for selecting optimal experiments;
A help for Design of the Experiments (DoE) methods, allowing to maximize the information
content with the minimum number of experiments (variables/collinearity/range/…);
Extracting the maximum amount of information when analyzing multivariate data
(Classification, Process monitoring, Multivariate calibration).
(analytical)
Problem request
(analytical)
DoE
(analytical)
Method applied
(analytical)
Answers
Chemometric problem
Possible fields of application of MVSA in chemometrics:
Analysis of data from spectroscopic measurement
Characterization of experimental conditions on crystals precipitation
Mass spectrometry
Concentration of components in chemical compounds
Analysis of data profiles from unit operations (cell culture, chromatography)
Raw material characterization
…

Example of application: chemometrics
18
~
X

Example of application: crystals
19
Optimal grouping of crystals on the basis of their shape (good feature extraction is an
open problem)
A
B
XB
Y

Example of application: astrophysics
20
Astronomers want to know if
groups of absolute magnitude
are correlated with each other
Just one-two of the projected correlations are large,
the other are very small

Example of application: remote sensing
21
50 100 150 200 250 300
100
200
300
400
500
600
10
20
30
40
50
60
70
80
90
50 100 150 200 250 300
100
200
300
400
500
6000
0.05
0.1
0.15
0.2
0.25
0.3
0.35
0.4
0.45
0.5
Residual of the first 3
components

Example of application: pattern recognition
22
Scatterplot of the first three principal component of a database of hand writing
of digits. Automatic recognition of pattern is the final purpose. The problem is very
sensible to the selection of the features

Lectures / Class Goals
23
Goal of the class is twofold: (1) to provide the scholars with some mathematical and
engineering methods to investigate, understand, process and predict behavior or hidden
patterns in multivariate data; (2) to have a view of the main methods of machine learning
(mainly dimensionality reduction, source separation, clustering and classification), applied to
large volume of data.
The class is organized in 16 lectures where basic concepts, in-depth analysis and case
study are illustrated and laboratory activities (8 sessions) where specific examples of data
processing are carried on by the scholars.
It is expected the students to have proficiency in signal theory, basics of probability and
random processes, signal processing and MatLab® programming.
Lectures / Organization of the class /1
24
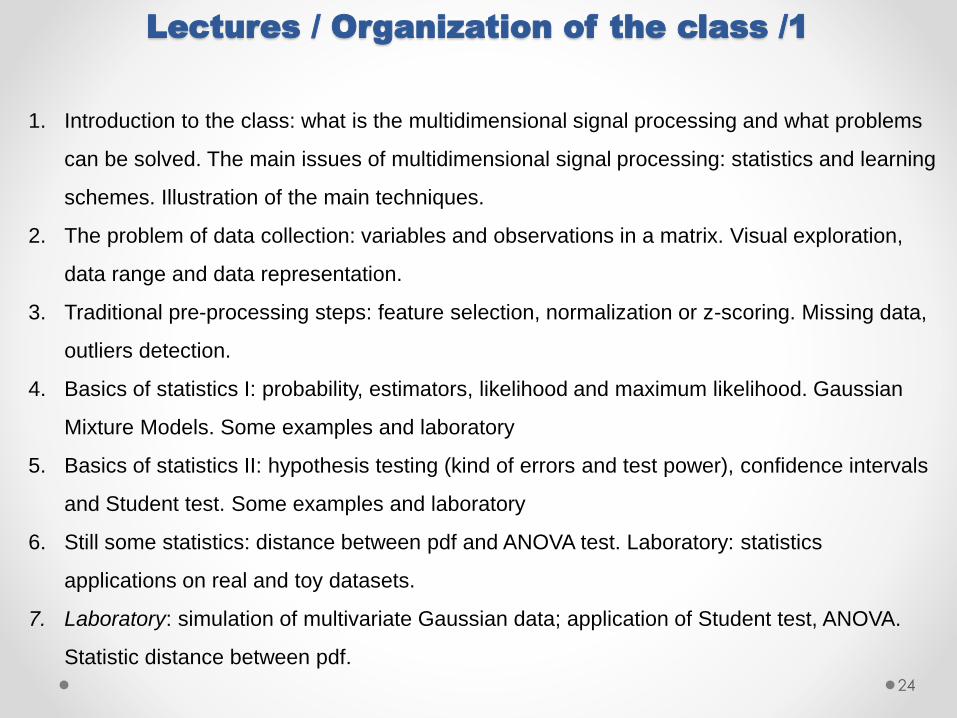
1. Introduction to the class: what is the multidimensional signal processing and what problems
can be solved. The main issues of multidimensional signal processing: statistics and learning
schemes. Illustration of the main techniques.
2. The problem of data collection: variables and observations in a matrix. Visual exploration,
data range and data representation.
3. Traditional pre-processing steps: feature selection, normalization or z-scoring. Missing data,
outliers detection.
4. Basics of statistics I: probability, estimators, likelihood and maximum likelihood. Gaussian
Mixture Models. Some examples and laboratory
5. Basics of statistics II: hypothesis testing (kind of errors and test power), confidence intervals
and Student test. Some examples and laboratory
6. Still some statistics: distance between pdf and ANOVA test. Laboratory: statistics
applications on real and toy datasets.
7. Laboratory: simulation of multivariate Gaussian data; application of Student test, ANOVA.
Statistic distance between pdf.
Lectures / Organization of the class /2
25
8. Linear Dimensionality Reduction: Principal Component Analysis, Canonical Correlation
Analysis, M-CCA.
9. Laboratory: PCA / CCA on multidimensional signals (hyperspectral remote sensing image).
10. Further focus on dimensionality reduction: NNMF and constrained PCA. Laboratory: on
PCA.
11. Basics of Blind Source Separation: Independent Component Analysis – Laboratory: ICA
applied on hyperspectral remote sensing image
12. The general problem of statistical learning. Regression vs. Classification – Laboratory: ICA
or previous topics.
13. Supervised learning: Multiple Regression, Multivariate Regression and Partial Least Square.
14. Laboratory: comparison of MLR and PLS on specific datasets.
15. Laboratory: comparison of previous techniques on specific datasets.
16. Clustering, K-means and medoids.
17. Hierarchical clustering and density based clustering. Selection of the number of clusters

Lectures / Organization of the class /3
26
18. Introduction to classifiers: linear discriminant analysis. Gaussian LDA, Logistic
Discrimination, Multiclass LD.
19. Basics of k-NN (k Nearest Neighbors) and Support Vector Machines.
20. Laboratory: build a classifier for hyperspectral remote sensing dataset I.
21. Distance geometry, Nonlinear Dimensionality Reduction, Manifold Learning and IsoMap.
Regularization and Bootstrap.
22. Laboratory: build a classifier for hyperspectral remote sensing dataset II.
23. Laboratory: summary laboratory on previous topics.
24. Laboratory: summary laboratory on previous topics.
[1] A.J. Izenmann, “Modern Multivariate Statistical Techniques”, Springer, New York 2008.
[2] C. M. Bishop, “Pattern Recognition and Machine Learning”, Springer, Information Science and
Statistics Series, USA 2006.
[3] P.H. Garthwaite, I.T. Jolliffe, B. Jones, ‘Statistical Inference’, Oxford Science Publications, New
York 2006.

Examples / Case Study
27
Statistics
Multivariate Gaussian data: generation of different toy examples
Data Collection
Multivariate Gaussian data: generation of toy examples with outliers
Possible example: medical datasets (e.g.: the well-known Wisconsin breast cancer study)
[https://archive.ics.uci.edu/ml/datasets/Breast+Cancer+Wisconsin+(Diagnostic)
https://archive.ics.uci.edu/ml/machine-learning-databases/breast-cancer-wisconsin/]
Dimensionality Reduction
Hyperspectral remote sensed image
[http://www.ehu.eus/ccwintco/index.php?title=Hyperspectral_Remote_Sensing_Scenes]
X-raw Powder Diffraction data [ provided by the lecturer ]
Regression, Classification
Data from a biocrystallization experiment [ provided by the lecturer ]
Hyperspectral remote sensed image / other datasets
Complex Analysis – Multivariate Analysis
Speech emotional database
[ provided by the lectures, but publicly available online ]
PROVIDE YOUR OWN DATA!

Most popular case study
28
Taken from the website:
https://archive.ics.uci.edu/ml/datasets.html
- Medicine/Biology (breast/lung cancer, extended studies on population, …)
- Meteo data (mainly pollution)
- Machine control (aeromobiles, cars, …)
- Social data (buying, social trend, users behavior, …)
Not yet been experimented:
- Images
- Character recognizing
- Time series

Work Opportunity
29
Multivariate Statistical Analysis is a flexible discipline prone to the following
applications:
Business Functional Analyst (finance)
Data Scientist (in the wider area of Computer and Information Research field)
Biomedical Data Scientist (in the wider area of Biomedical Engineering)
Climate Data Scientist
Remote Sensing Data Scientist
Big Data Analyst
…
2015

Work Opportunity
30
226 results on my linkedin page in march 2016 to the query “data scientist”
(February 2018: Data Scientist: 197 results; Data Analyst: 107 results)

3114/09/2015
Available tools
Multivariate Statistical Analysis tools can be found in many programming environment (just
avoid the tools created for specific purposes such as the financial analysis tools):
Toolkit for Multivariate Data Analysis with ROOT
[http://tmva.sourceforge.net/
http://it.mathworks.com/
https://www.r-project.org/
https://root.cern.ch/drupal/]

Lecture Summary
32
Multivariate Statistical Analysis is a collection of techniques grounding on a robust
mathematical basis
It requires knowledge of signal processing, probability, statistics, linear algebra,
optimization methods and machine learning
MV methods permeate many aspects of the science disciplines
We will apply MV processing to several examples (simulated and from real world)