multidisciplinary investigation of active shallow ... - pip.ie
TRANSCRIPT

1
Multidisciplinary investigation of active shallow
pockmarks in Dunmanus Bay.
Dublin City University
Report for the Petroleum Infrastructure Programme (PIP), 2014 Contributors: Shane O’ Reilly, Brian Kelleher (DCU)1
Michal Szpak (DCU)1 and Xavier Monteys (GSI)2 1. School of Chemical Sciences, Dublin City University, Glasnevin, Dublin 9 2. Geological Survey of Ireland, Beggars Bush, Haddington Road, Dublin 4 * Correspondence to [email protected]

2
Table of contents
1 Introduction ………………………………………………………………………3
2 Materials and Methods ……………………………………………………………4
2.1 Environmental and Geological Setting …………………………………………4
2.2 Core sampling …………………………………………………………………..5
2.3 Gas and porewater analysis ……………………………………………………..5
2.3 Multi sensor core logging ……………………………………………………….6
2.4 Bulk physical and chemical analysis ……………………………………………6
2.5 DNA extraction, PCR and denaturing gradient gel
electrophoresis ………………………………………………………………………7
2.6 Sedimentary organic matter composition ……………………………………….7
2.7 Pore water dissolved organic matter composition ……………………………….8
2.8 Lipid biomarker analysis ………………………………………………………..8
2.9 Biomarker and DGGE data analysis and statistical treatment .............................8
3 Results and Discussion …………………………………………………………..10
3.1 Possible lithological control on pockmark formation and
geochemical processes ……………………………………………………………..10
3.2 Microbial activity and overall diversity ………………………………………..15
3.5 Possible evidence for alternative sources of gas ………………………………..24
4 Conclusions …………………………………………………………………… 27
5 References ……………………………………………………………………….28

3
1 Introduction
Pockmarks are circular or sub-circular seabed depressions, which may reach
diameters of hundreds of metres and depths of tens of metres (Judd and Hovland
2007). They occur in a variety of settings, which include estuaries (Garcia-Gil et al.,
2003; Garcia-Gil 2003) shallow bays (Knebel and Scanlon 1985; Kelley et al., 1994;
Ussler et al., 2003), continental shelves (Nelson et al., 1979;Fader 1991), continental
slopes and rises (Paull et al., 2002; Gay et al., 2006), and lakes (Pickrill 2006). Sub-
seabed fluid escape is usually invoked as the primary formation mechanism for these
features, and the current leading formation theory was proposed by (Hovland and
Judd 1988). This includes three primary stages: (1) the formation of a seabed dome
due to excessive fluid pressure underneath the seabed; (2) discharge of the fluid in a
single event, expelling the sediment into the water column, winnowing fine-grained
sediment and leaving lag deposits; and (3) continuation of pockmark formation due to
continual or episodic seepage. Thus lithology is thought to be one of the primary
parameters for pockmark occurrence, since fine-grained clay/silt has a lower
permeability than coarser grains and hence facilitate gas accumulation and
overpressurisation. The main associated fluid is gas, which may be thermogenic or
microbial gas from organic-rich sedimentary deposits (Judd and Hovland 2007).
Frequently however, surveyed pockmarks are not associated with evidence, be that
geophysical or geochemical, of gas (or other fluids) migration and are deemed
inactive or that another formation mechanism may be possible (Paull et al., 2002;
Ussler et al., 2003; Rogers et al., 2006). Alternative pockmark formation theories
inlcude pore water escape (Harrington 1985), fresh/groundwater seepage (Whiticar
2002; Christodolou et al., 2003), ice-rafting (Paull et al., 1999), biological activity and
meteorite impacts (Judd and Hovland 2007). Thus significant questions remain
regarding pockmark formation, distribution and processes.
To date there have been few studies of biological productivity associated with
pockmarks and most have focused on macrofaunal assemblages present (Dando 1991;
Ondreas et al., 2005; Judd and Hovland 2007; Webb et al., 2009). In contrast to active
deep sea sites, biological productivity at shallow pockmarks settings does not seem to
be very different from surrounding sediment. Studies of microbial diversity in
pockmarks have reported microbes known to be involved in the anaerobic oxidation
of methane (AOM), similar to other cold seep features with moderate/high CH4 flux.

4
(Wegener et al., 2008; Boulabassi et al., 2009; Cambon-Bonavita et al., 2009; Merkel
et al., 2010; Shubenvova et al., 2010; Roalkvam et al., 2011, 2012). However at
present little is known about the effect of pockmark formation and seepage processes
on microbial communities, and vice-versa about the role, if any, is played by microbes
in pockmarks formation and seepage.
A pockmark field was discovered in Dunmanus Bay, south west Ireland, in
2007 during multibeam mapping of the bay in shallow water depths of about 40 m.
Over 60 pockmarks have been mapped that reach a maximum diameter of 20 m, do
not appear to exceed 1 m in depth. These pockmarks occur in clusters, possibly
comprising composite features, and also small (1 to 2 m diameter) satellite features.
The lithology of the bay is dominated by coarse to medium sand, while mud to fine
sand is dominant closer to the mouth of the bay. The Dunmanus Bay pockmark field
(DBPF) is coincident with an area of comparatively finer particle size (Szpak 2012a).
Initial surveys highlighted that acoustic evidence of minor subsurface gas seepage is
widespread across the region. However regions of shallow (< 10 mbsf) acoustic
turbidity (AT), indicating gas accumulations, are coincident with fine-grained muddy
seabed occurring in the mapped pockmark field. Furthermore the DBPF coincides of
subtle water column acoustic echofacies, indicating low to moderate fluid seepage is
occurring (Szpak 2012a). A number of faults bisect and cross the region, and are
thought to be likely routes of gas migration to shallow sediments.
However the exact nature of the seeping fluid, its relationship with seabed
lithology and the key biogeochemical processes occurring at this site have not been
studied comprehensively and are poorly understood at present. The purpose of this
study was to conduct a geochemical and microbiological investigation of pockmarked
and non-pockmarked sediment within DBPF, and surrounding sediments in order to
elucidate distinct chemical and physical processes within the pockmark field.
2 Materials and Methods
2.1 Environmental and Geological Setting
Dunmanus Bay is located in southwest Ireland, between the Sheep’s Head and Mizen
peninsulas (Fig. 2.1). The bay is nearly 7 km wide at its widest point and 22 km long.
The Durrus River drains into the bay at Durrus. INFOMAR surveys aboard the RV
Celtic Explorer mapped the outer region of Dunmanus Bay in 2006, followed by the
5
intermediate depths in 2007 (RV Celtic Voyager). A Tenix LADS lidar survey was
also conducted in 2006 and mapped the nearshore and shallow waters of the bay.
Water depths range from 0 to 70 m to the southwest at the mouth of the bay.
Dunmanus Bay lies in the South Munster Basin. The Dunmanus Fault runs along the
centre of the Bay parallel to the landmass, whereby two minor faults, the Gortavallig
Fault and the Letter Fault, occur perpendicular to the Dunmanus Fault in the vicinity
of the pockmark field (Szpak 2012a). Two other notable faults to the north west are
the Rossmore Fault and the Glanlough Fault (MacCarthy 2007). The northern part of
the bay is dominated by coarse to medium sand, while mud to fine sand is dominant
closer to the mouth of the bay. Localised occurrences of rock outcroppings and
gravels also occur, and generally in proximity to the landmasses. Quaternary sediment
thickness does not generally exceed 22 m (Monteys et al., 2010). The DBPF consists
of an area of seabed of approximately 222000 km2 and is located in proximity to the
landmass (620m east of Dooneen Point) in about 40 m water depth. Seabed in this
area is dominated by mud to fine sand. For an in-depth discussion of the geological
and environmental setting of Dunmanus Bay, see Szpak (2012a).
2.2 Core sampling
Sediment vibrocores were sampled using a GeoResources Geo-Corer 6000. Cut and
capped core sections were split and archive halves photographed and logged.
Sediment sub-samples were taken from working sections after gas and pore water
sampling (see section 2.2.3), and stored onboard at -20oC, and at -80oC back in the
laboratory. Sub-samples for bulk chemical and physical parameters were stored at
4oC.
2.3 Gas and pore water analysis
Interstitial gas sampling was carried out immediately upon core retrieval. 10 mL
sediment plugs were sampled from windows cut in the core liner, transferred to a 20
mL headspace vial and 1.2 M NaCl solution containing approximately 70 mg L-1
thimerosal (Sigma Aldrich, Dorset, UK) was then added to the vial leaving a 3 mL
headspace. Sealed vials were stored in the dark at 4oC prior to analysis. CH4 analysis
was performed according on an Agilent 7820A GC-FID with a 30 m HP-PLOTQ
column (Agilent, Santa Clara, USA). Column conditions were isothermal (20oC). CH4
was quantified using calibration standards prepared from a 99.992% CH4 standard
6
(Sigma Aldrich, Dorset, UK). Sediment pore water was sub-sampled from core liner
windows using Rhizon samplers (Rhizosphere Research Products, Wageningen, NL).
1 mL aliquots for H2S analysis were preserved by addition of 400 µL 20 mM zinc
acetate. Aliquots for PO43- and NH4
+ analysis were preserved with 1-2 drops of
chloroform. Spectrophotometric analysis of H2S and PO43- was performed using
leucomethylene blue and phosphomolybdate complexation respectively (Grasshoff et
al., 1983). Analysis was conducted on a BIOTEK Powerwave HT plate reader and
calibration standards were prepared in artificial seawater prepared from commercially
available sea salts (Sigma Aldrich, Dorset, UK). NH4+ analysis was performed using a
SCHOTT NH1100 ion selective electrode and using NH3 ISE ion strength adjustment
buffer and NH3 ISE calibration solution (Reagecon, Clare, Ireland). Calibration and
quantification was performed according to manufacturer guidelines. SO42- and Cl-
anions were determined by suppressed ion chromatography on a DX-120 Dionex Ion
Chromatograph with an eluent generator (K2CO3). Separation was achieved on a
chromatographic system composed of an anion exchange column (IonPak C18) and a
guard column. The mobile phase was Nanopure grade water (18MΩ), which was
automatically amended with hydroxide ions to a preset concentration (12 mM of OH-
). The mobile phase flow was set to 1.0 ml min-1 and suppressor current was set to 22
mA. Data processing and peaks integration was conducted using the Chromelion
software package.
2.4 Multi sensor core logger (MSCL)
Duplicate cores from each station were scanned using a GEOTEK MSCL-S multi
sensor core logger. Cores were scanned in split mode and bulk density, magnetic
susceptibility, P-wave velocity, electrical resistivity, fractional porosity and colour
parameters were determined. Scanning was conducted at a resolution of 1 cm-1 after
calibration according to manufacturer’s guidelines (GEOTEK, Daventry, UK). Data
was processed using GEOTEK MSCL software (Ver. 7.92.4).
2.2 Bulk chemical and physical analysis
Particle size analysis was performed using laser granulometry (Malvern MS2000) for
sediment fractions <1000 µm and dry sieving for fractions >1000 µm. Percentage per
size class calculated using the MS2000 were converted to total sample percentages
and integrated with the >1000 µm data. Total organic carbon and total nitrogen was

7
analysed using an Exeter Analytical CE440 elemental analyser, after oven-drying and
removal of inorganic carbonate using 1M HCl. Loss-on-ignition (LOI) was
determined in higher resolution by combusting 300 to 200 mg oven-dried sediment to
constant weight at 440oC for 8 hours in a muffle furnace.
2.6 DNA extraction, PCR and DGGE
DNA was extracted using the POWERSOIL DNA isolation kit (MO BIO, Carlsbad,
US) according to manufacturer guidelines. Bacterial and archaeal 16S rRNA PCR and
DGGE was performed as outlined previously (see Chapter 3).
2.7 Sedimentary organic matter composition
Sediment OM was isolated according to previously described methods (Gonçalves et
al., 2003; Szpak et al., 2012b). Freeze-dried sediment (~120 g accurately weighed)
was extracted with deionised water (x3). OM was concentrated and ferromagnetic
minerals removed by shaking samples overnight in 10% 1:1 (v/v) HCl/HF (x2),
followed by 10% HF (x8). Concentrated OM was then exhaustively extracted with 0.1
M NaOH. Water and NaOH extracts were centrifuged and supernatants were filtered
through 0.22 µm polyvinylidene fluoride membrane filters (Merck Millipore,
Billerica, USA). Water extracts were combined and dried by rotary evaporation and
stored at -80oC. NaOH extracts were ion-exchanged using AMBERJET 1200H cation
exchange resin to remove Na+ ions. NaOH extracts were subsequently freeze-dried
and all extracts were desiccated for 48 hr prior to further analysis.
Each sample (40 mg) was resuspended in 1 mL of D2O and titrated to pH 13
using NaOD (40% by wt) to ensure complete solubility. Samples were analysed using
a Bruker Avance 200MHz NMR spectrometer equipped with a 1H–19F–13C–12N 2mm,
quadrupole resonance inverse probe (QXI) fitted with an actively shielded Z gradient.
1-D solution state 1H NMR experiments were performed at a temperature of 298 K
with 128 scans, a recycle delay of 3 s, 16384 time domain points, and an acquisition
time of 0.8 s. Solvent suppression was achieved by presaturation utilizing relaxation
gradients and echoes (Simpson and Brown 2002). Spectra were apodised through
multiplication with an exponential decay corresponding to 1-Hz line broadening, and
a zero-filling factor of 2. Diffusion-edited (DE) experiments were performed using a
bipolar pulse longitudinal encode-decode sequence (Wu et al., 1992). Scans (1024)
were collected using a 1.22 ms, 22.2 gauss cm-1, sine-shaped gradient pulse, a
8
diffusion time of 100 ms, 16384 time domain points and 819 ms acquisition time.
Spectra were apodised through multiplication with an exponential decay
corresponding to 10 Hz line broadening and zero-filling factor of 2.
2.8 Porewater dissolved organic matter
At least 10 mL aliquots of selected porewater samples were additionally filtered
through 0.22 µm PVDF membrane filters and dissolved organic matter (DOM) was
subsequently preserved in sodium azide (final concentration of 0.1 %). All NMR
experiments were carried out according to Lam and Simpson (2007) on a Bruker
Avance 200 MHz equipped with a 2 mm 1H-BB-13C TBI probe with an actively
shielded Z-gradient. 1D solution state 1H NMR experiments were acquired with a
recycle delay of 2 s, and 32768 time domain points. Spectra were apodized by
multiplication with an exponential decay producing a 10 Hz line broadening in the
transformed spectrum, and a zero-filling factor of 2. Where appropriate, pre-saturation
was applied on resonance generated by a 60 W amplifier attenuated at 20 dB during
the relaxation delay. Direct 1H NMR was performed using WATER suppression by
GrAdient-Tailored Excitation (WATERGATE) and was carried out using a W2 train
and a 122 µs binomial delay such that the ‘sidebands’ occurred at ca. 12 ppm and 2
ppm and were outside the spectral window. W2-WATERGATE was preceded by a
train of selective pulses: 2000, 2 ms, calibrated π (180o) pulses were used, each
separated by a 4 µs delay.
2.9 Lipid biomarker analysis
Freeze-dried powdered samples were extracted by a modified Bligh-Dyer method
(White and Ringelberg 1998) as described previously. Desulphurised TLE’s were
fractionated and phospolipid fatty acids analysed as described previosuly (See
Chapter 2).
2.10 Biomarker and DGGE data analysis and statistical treatment
Hierarchical cluster analysis of PLFA data was performed using the software PAST
(v1.72) (Hammer et al. 2001), using the Bray-Curtis similarity matrix. DGGE gels
were digitised and subjected to hierarchical cluster analysis after background
subtraction and band matching using the Phoretix 1D gel analysis software (Total
Labs Inc., Newcastle, UK).

9
Figure 1: Map showing location of Dunmanus Bay (inset) and bathymetric map of Dunmanus Bay showing location and outline of Dunmanus Bay pockmark field. Sampling
stations for the 2009 and 2011 surveys are shown. Inset: Sub-bottom pinger profile showing a transect across the Dunmanus Bay pockmark field. Acoustic turbidity,
providing indirect evidence of gas accumulations, is evident and coincident with the pockmark field.

10
3 Results and Discussion
3.1 Dunmnaus Bay Pockmark field: Lithological control on pockmark formation
and geochemical processes?
Downcore physical and chemical profiles for cores VC1, VC2 and VC3 are shown in
Fig. 2.2, 2.3 and 2.4, respectively. Specifically sediment class (based on percentage
silt, clay and sand composition), bulk organic matter content (expressed as percentage
loss-on-ignition), interstitial CH4, SO42-, H2S, PO4
3-, NH4+ and sediment porosity are
given. Surface sediments in VC1 from 0 to 1.4 mbsf were characterised by poorly
sorted mud, with silt and clay averaging 74.2% and 12.7%, respectively. From 1.4 to
1.6 mbsf sediment is characterised by very poorly sorted muddy sand to sandy mud,
followed by a transition to poorly sorted/very poorly sorted sandy mud to 3.0 mbsf.
Between 3.0 to 3.8 mbsf there is a gradual transition from sandy mud to muddy sand,
followed by a sharp contact and a transition from sandy gravel to coarse gravel until
about 4.2 mbsf. From 4.2 mbsf until 2.62 mbsf sediment consists of primarily well
sorted sand. VC2 exhibits a lower clay content, higher sand content, and overall a
more variable lithology in the first 2 mbsf compared to VC1. Below about 1.8 mbsf
sediment type is comparable between VC1 and VC2 (Fig. 4). In contrast, the
reference core VC3 displays a more homogeneous lithology over the 2.72 mbsf.
Sediment porosity for both VC1 and VC2 was relatively low close to the SWI (~0.4),
while the presence of a high porosity layer in the first 12 cm of VC3 was observed
(Fig. 2.4). In all 3 cores a distinct gravel stratum was observed at about 4 mbsf. This
has been identified as the source of the enhanced reflector in acoustic profiles (Fig.
2.1). Sandy sediments (and indeed gravels) are characterized by a relatively high
permeability compared to mud (Wilson et al., 2008). Thus the lithology within DBPF
is likely a significant factor controlling the occurrence pockmarks withing this region
and not surrounding coarser-grained sediment types. Gas migration via permeable
strata and accumulation in muddy layers and eventual expulsion via fluidisation of
gas, water and sediment into the water column, as proposed by Judd and Hovland
(1988), is thus most likely formation mechanism for pockmarks in Dunmanus Bay.

11
Figure 2: Downcore profiles of physical and chemical parameters from core VC1, sampled from within a pockmark cluster.

12
Figure 3: Downcore profiles of physical and chemical parameters from core VC2, sampled from acoustically-turbid non-pockmarked sediment within the Dunmanus Bay
pockmark field

13
Figure 4: Downcore profiles of physical and chemical parameters from core VC3, sampled from representative sandy sediment in Dunmanus Bay.
14
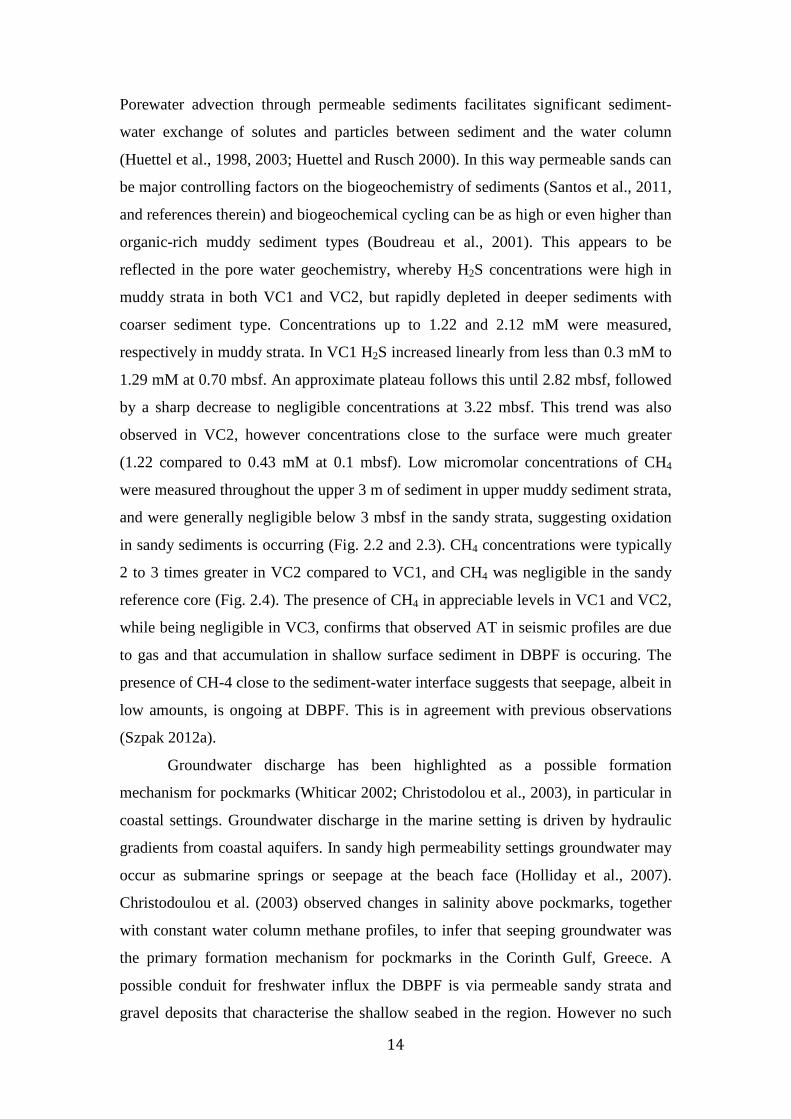
Porewater advection through permeable sediments facilitates significant sediment-
water exchange of solutes and particles between sediment and the water column
(Huettel et al., 1998, 2003; Huettel and Rusch 2000). In this way permeable sands can
be major controlling factors on the biogeochemistry of sediments (Santos et al., 2011,
and references therein) and biogeochemical cycling can be as high or even higher than
organic-rich muddy sediment types (Boudreau et al., 2001). This appears to be
reflected in the pore water geochemistry, whereby H2S concentrations were high in
muddy strata in both VC1 and VC2, but rapidly depleted in deeper sediments with
coarser sediment type. Concentrations up to 1.22 and 2.12 mM were measured,
respectively in muddy strata. In VC1 H2S increased linearly from less than 0.3 mM to
1.29 mM at 0.70 mbsf. An approximate plateau follows this until 2.82 mbsf, followed
by a sharp decrease to negligible concentrations at 3.22 mbsf. This trend was also
observed in VC2, however concentrations close to the surface were much greater
(1.22 compared to 0.43 mM at 0.1 mbsf). Low micromolar concentrations of CH4
were measured throughout the upper 3 m of sediment in upper muddy sediment strata,
and were generally negligible below 3 mbsf in the sandy strata, suggesting oxidation
in sandy sediments is occurring (Fig. 2.2 and 2.3). CH4 concentrations were typically
2 to 3 times greater in VC2 compared to VC1, and CH4 was negligible in the sandy
reference core (Fig. 2.4). The presence of CH4 in appreciable levels in VC1 and VC2,
while being negligible in VC3, confirms that observed AT in seismic profiles are due
to gas and that accumulation in shallow surface sediment in DBPF is occuring. The
presence of CH-4 close to the sediment-water interface suggests that seepage, albeit in
low amounts, is ongoing at DBPF. This is in agreement with previous observations
(Szpak 2012a).
Groundwater discharge has been highlighted as a possible formation
mechanism for pockmarks (Whiticar 2002; Christodolou et al., 2003), in particular in
coastal settings. Groundwater discharge in the marine setting is driven by hydraulic
gradients from coastal aquifers. In sandy high permeability settings groundwater may
occur as submarine springs or seepage at the beach face (Holliday et al., 2007).
Christodoulou et al. (2003) observed changes in salinity above pockmarks, together
with constant water column methane profiles, to infer that seeping groundwater was
the primary formation mechanism for pockmarks in the Corinth Gulf, Greece. A
possible conduit for freshwater influx the DBPF is via permeable sandy strata and
gravel deposits that characterise the shallow seabed in the region. However no such

15
deviation in Cl- (data not shown) or SO42- (Fig. 2.2 to 2.4) was observed. Together
with previous water column salinity profiling (Szpak 2012a), these results support the
conclusion that GD is not a formation mechanism for Dunmanus Bay pockmarks.
However as noted by Szpak (2012a) periodic GD, such as in times of heavy rainfall,
cannot be ruled out at present.
In the absence of observable freshwater influence, the rapid depletion of H2S
and CH4 in sandy sediments (Fig. 2.2 and 2.3) suggests seawater influx may be
occurring. This hypothesis is supported by the observation that SO42- profiles increase
to seawater levels from 1.27 mbsf in VC2 after initially reducing. Similar SO42- trends
were observed in a core from the 2009 survey, whereby SO42- reduction was apparent
in the first 1 m before increasing (Szpak 2012a). The presence of permeable sand and
gravel layers may provide a conduit for the reintroduction of seawater from depth and
oxidation of reduced chemical species. This may also be a possible mechanism for
lateral migration of seeping gas from the below DBPF to surrounding sediments. This
is one factor that might explain the observed subtle acoustic gas escape signatures
(Szpak 2012a) and the low measured CH4 concentrations on two separate surveys.
Based on the multiple analysis performed here differences in lithology are a key
parameter controlling the location of pockmarks in Dunmnaus Bay, the accumulation
of gas and geochemical processes at the DBPF. Microbial and geochemical processes
are discussed in more details in sections 2.3.2 and 2.3.3.
3.2 Distinct microbial activity and populations at the DBPF
NH4+ in sediment pore waters is derived from the microbial breakdown of marine and
terrestrial organic nitrogen and is consumed in the microbial nitrification and
denitrification processes that involve reduction of NO3- and NO2
- to N2. In anoxic,
organic-rich marine sediments, the nitrogen transformation reactions cease at the
conversion of organic nitrogen to NH4+ (Batley and Simpson 2009). NH4
+ reach mM
concentrations very close to the sediment water interface for VC2, which suggests a
net flux to the water column and also significant degradative processes occurring.
NH4+ displays linear increasing trends with depth for both VC1 and VC2 (Fig. 2.2 and
2.3). Close to the SWI NH4+ is 2.2 times greater at VC2 compared to VC1 (0.60 mM
compared to 1.69 mM at 0.1 mbsf, respectively). NH4+ levels in VC2 were twice that
of VC1 for the first 3 mbsf before approaching comparable levels in deeper sandy
sediment strata (Fig. 2.2 and 2.3). VC3 displayed a distinct profile with much lower

16
NH4+ concentrations (Fig. 2.4). PO4
3- in porewater reflects the microbial degradation
of proteinaceous OM and also from microbial metabolism (released from ATP). PO43-
profiles for VC1 exhibited maximum concentrations around 0.7 mbsf to 1.22 mbsf,
after a comparatively sharp increase from the SWI, while in contrast PO43- profiles for
VC2 exhibited maximum levels close to the SWI and an clear linear decreasing trend
with depth (Fig. 2.3). These profiles indicate higher OM degradation rates and
microbial activity in muddy sediments in DBPF, particularly at VC2.
Phospholipid fatty acids (PLFA) are of utility as a measure of viable
sedimentary microbial biomass, both eukaryotic and bacterial (Guezennec and Fiala-
Medioni 2006; Mills et al., 2006). PLFA analysis provide broad chemotaxonomic
information, for example in determining the relative abundance of algal vs. bacterial
biomass or the relative abundance of gram negative vs. gram positive bacteria (White
et al., 1997). PLFAs ranged from up 0.80 µg g dw-1 at depths close to the surface, to
very low concentrations in coarse sands in the deepest section of the cores (Fig.
2.2A). This trend reflects the particle size dependence of microbial biomass in marine
sediments (Jackson and Weeks 2008). PLFA abundance was comparable between all
three cores after 2.2 mbsf, but was 1.7 times higher in VC1 than VC2 and 2.7 times
higher than VC3. PLFA’s ranged from C14 to C24 carbons and were dominated by the
C16:0 (21.6 and 30.2%). Negligible polyunsaturated fatty acids (PUFA) were observed
in samples downcore, indicating a low contribution of viable eukaryotic biomass in
these cores.

17
Figure 5: Downcore profiles of total phospholipid fatty acid (PLFA) abundances (A) and relevant
PLFA ratios (B to D).
Gram-positive and anaerobic gram-negative bacteria primarily synthesize branched
saturated fatty acids (brFA) while aerobic gram-negative bacteria are characterised by
larger relative abundances of monounsaturated fatty acids (MUFA) (White et al.,
1997). The ratio of brFA to MUFA was found to increase with depth initially in all
cores, before decreasing again in sandy sediment. Assuming a predominantly
bacterial source for MUFA in this setting (in the absence of PUFA), this likely
reflects the increased abundance of gram-positive and anaerobic gram-negative
bacteria with depth in muddy sulphidic sediments and the increased abundance of
aerobic bacteria in sandy oxic sediments below muddy layers (and throughout VC3).
Specific changes in relative abundances of populations within these groups are also
likely and can be postulated based on relative changes in certain PLFAs. The ratio of
iC12:0 to aiC12:0 was consistently higher in VC2 when compared to VC1 and VC3, in
particular at 1.32 mbsf (Fig. 2.2B). The ratios of iC17:0/C17:0 and C18:1ω9/C18:1ω7 were
also variable between cores and at different depths (Fig. 2.2C and D). Sulphate-
reducing bacteria (SRB) have consistently higher ratios of iC12:0 to aiC12:0 (Dowling et
al., 1986), which suggests that SRB are more prominent in VC2 compared to VC1
and VC3. This correlates with observed SO42- reduction in this core (Fig. 2.3). In
marine sediments 10MeC16:0 has often been used as a diagnostic fatty acid for the
Desulfobacter genera (Dowling et al., 1986; Rajendran et al., 1993), although its
specificity may be questionable (Boschker et al., 2001). This fatty acid did not display
comparable trends with iC12:0/aiC12:0. While being of limited taxonomic use these
ratios do provide evidence of relative changes in bacterial populations between cores
and with depth in the sediment column. Further evidence for the occurrence of
distinct bacterial communities in DBPF was obtained from hierarchical cluster
analysis (Fig. 2.6). Two major groupings were produced, whereby populations in
muddy sediment strata in VC1 and VC2 clustered together and populations from
deeper sandy strata and in VC3 clustered together. Inter-cluster similarity was less
than 20%. Sub-groupings were evident also, whereby populations at the surface and
1.3 mbsf in VC1 displayed 92% similarity to each other and the corresponding depths
in VC2 were 84% similar.

18
Figure 6: Hierarchical cluster analysis of PLFA profiles using the Bray-Curtis similarity matrix.
Cluster analysis of digitized DGGE lanes supports the conclusions drawn from PLFA
interpretation. Fig. 2.7 indicates that bacterial populations close to the surface and at
about 1 mbsf in VC1 and VC2 display 72% similarity. The near-surface bacterial
population in VC3 displays the highest species richness based on the number of bands
present, while in comparison the cores within DBPF exhibit lower richness. The near-
surface bacterial community is only 32% similar to all other samples. Whether these
observed changes change in bacterial biomass abundance and community structure is
related primarily to lithological differences, or whether this as a result of seepage
activity in the pockmark field cannot be distinguished at present. Population diversity
may be expected to decrease in an active seepage setting, in particular with the
presence of toxic by-products such as H2S, such as observed here. Archaeal diversity,
based on analysis of samples from 1 mbsf (including a control core GC14) is low and
indicates a very similar archaeal community structure within DBPF, and one that this
is very similar to sediment outside the pockmark field (Fig. 2.8). Archaeal
biomarkers, (e.g. archaeol, crocetane and pentamethyl-eicosane) were not observed in
neutral lipid fractions from these cores (data not shown). This suggests that archaea

19
may play a minor role in ongoing processes at DBPF and that existing populations
likely belong to extant groups in this setting rather than distinct seepage-affiliated
phylotypes.
Figure 7: 16S rRNA bacterial denaturing gradient gel electrophoresis (DGGE) profiles and hierarchical
cluster analysis.
Figure 8: 16S rRNA archaeal denaturing gradient gel electrophoresis profiles of samples from the
survey in 2009. Sampling depth for DGGE analysis was 1 mbsf. See Fig. 2.1 for locations. GC14 is the
control core, taken from outside the pockmark field.
1D 1H-NMR analysis of NaOH extracts allow an overview of total OM composition
and specific regions can be assigned to molecular classes in complex environmental
20
samples (Kelleher and Simpson 2006; Simpson et al., 2007; Simpson et al., 2011;
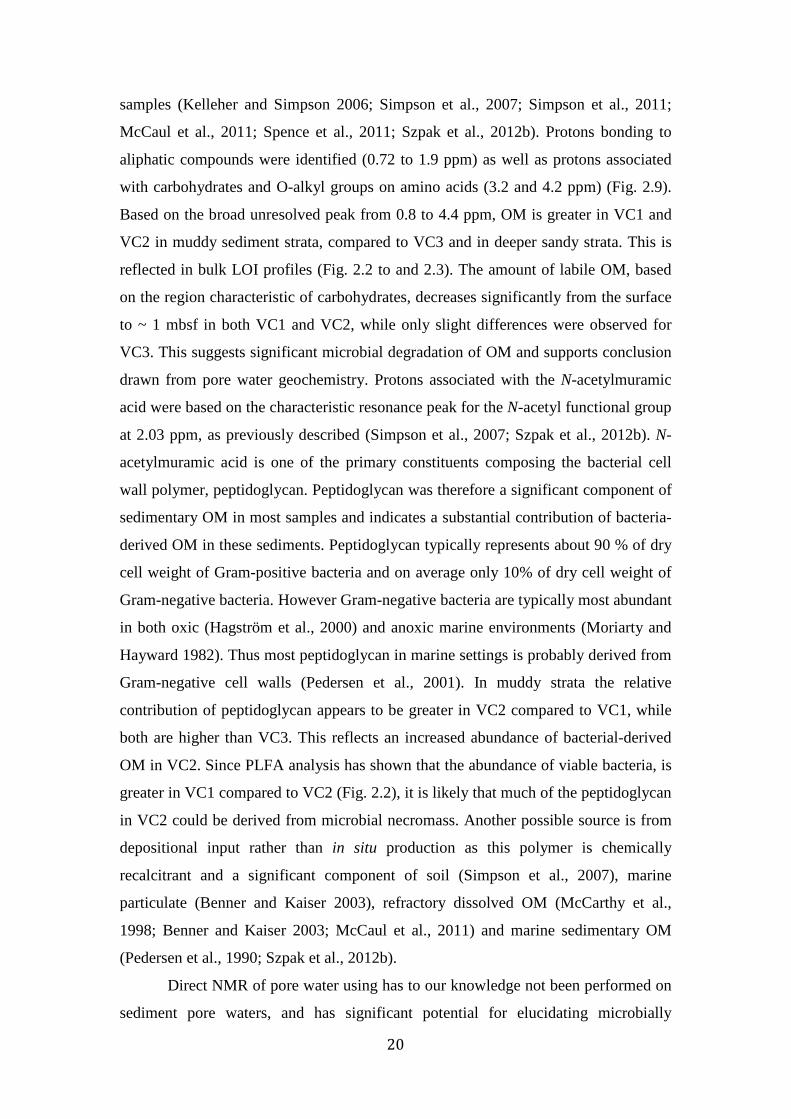
McCaul et al., 2011; Spence et al., 2011; Szpak et al., 2012b). Protons bonding to
aliphatic compounds were identified (0.72 to 1.9 ppm) as well as protons associated
with carbohydrates and O-alkyl groups on amino acids (3.2 and 4.2 ppm) (Fig. 2.9).
Based on the broad unresolved peak from 0.8 to 4.4 ppm, OM is greater in VC1 and
VC2 in muddy sediment strata, compared to VC3 and in deeper sandy strata. This is
reflected in bulk LOI profiles (Fig. 2.2 to and 2.3). The amount of labile OM, based
on the region characteristic of carbohydrates, decreases significantly from the surface
to ~ 1 mbsf in both VC1 and VC2, while only slight differences were observed for
VC3. This suggests significant microbial degradation of OM and supports conclusion
drawn from pore water geochemistry. Protons associated with the N-acetylmuramic
acid were based on the characteristic resonance peak for the N-acetyl functional group
at 2.03 ppm, as previously described (Simpson et al., 2007; Szpak et al., 2012b). N-
acetylmuramic acid is one of the primary constituents composing the bacterial cell
wall polymer, peptidoglycan. Peptidoglycan was therefore a significant component of
sedimentary OM in most samples and indicates a substantial contribution of bacteria-
derived OM in these sediments. Peptidoglycan typically represents about 90 % of dry
cell weight of Gram-positive bacteria and on average only 10% of dry cell weight of
Gram-negative bacteria. However Gram-negative bacteria are typically most abundant
in both oxic (Hagström et al., 2000) and anoxic marine environments (Moriarty and
Hayward 1982). Thus most peptidoglycan in marine settings is probably derived from
Gram-negative cell walls (Pedersen et al., 2001). In muddy strata the relative
contribution of peptidoglycan appears to be greater in VC2 compared to VC1, while
both are higher than VC3. This reflects an increased abundance of bacterial-derived
OM in VC2. Since PLFA analysis has shown that the abundance of viable bacteria, is
greater in VC1 compared to VC2 (Fig. 2.2), it is likely that much of the peptidoglycan
in VC2 could be derived from microbial necromass. Another possible source is from
depositional input rather than in situ production as this polymer is chemically
recalcitrant and a significant component of soil (Simpson et al., 2007), marine
particulate (Benner and Kaiser 2003), refractory dissolved OM (McCarthy et al.,
1998; Benner and Kaiser 2003; McCaul et al., 2011) and marine sedimentary OM
(Pedersen et al., 1990; Szpak et al., 2012b).
Direct NMR of pore water using has to our knowledge not been performed on
sediment pore waters, and has significant potential for elucidating microbially

21
mediated reactions between sedimentary aqueous and solid phases. 1D water
suppressed 1H NMR spectra for selected depths from each core are given in Fig. 2.10.
Pore water DOM should correspond to both high molecular weight and low molecular
weight products of depolymerisation of detrital OM (Burdige 2007). The broad
unresolved peak from 0.8 to 4.2 ppm reflects the amount of complex DOM and
comparison between cores indicates highest relative abundance of total DOM in VC1
and VC2 in the first 1 m approximately. This amount of DOM is comparable between
cores in sandy strata. This correlates with the increased microbial activity and OM
degradation observed from pore water NH4+ and PO4
3-. A range of volatile organic
acids and microbial metabolic end-products were identified in porewater 1H NMR
spectra (Fig. 2.10). Specific assignments were leucine (1), ethanol (2), lactic acid (3),
acetic acid (4), dimethyl sulphide (2), acetone (6), pyruvic acid (7), methanol (8),
glycerol (9), Tyrosine, phenylalanine and formic acid (not shown). Volatile organic
acids such as acetic acid, formic acid, lactic acid and pyruvic acid are considered
important intermediate products of the anaerobic metabolism of higher molecular
weight organics (carbohydrates, fatty acids and proteins) to CH4 and CO2 (Sansone
and Martens 1982; Finke et al., 2007a). Acetic acid is thought to be the primary
organic substrate for sulphate reducing bacteria (Sørensen et al., 1981). These volatile
organic are significant components of porewater DOM and in highest relative
abundance in porewater from muddy strata in VC1 and VC2 and in agreement with
pore water geochemistry, indicate significant anaerobic degradation OM in the first 1
m of sediment in both VC1 and VC2. The occurrence of dimethyl sulphide (DMS)
and methanol are discussed in detail in section 2.3.3.
22
Figure 9: 1D 1H NMR spectra (0 to 4.2 ppm region) obtained from NaOH extracts. General region
assignments correspond to aliphatics (1), ?? (2), carbohydrates and amino acids (3), anomeric carbon
(4). More specific assignments are protons associated with CH3 groups in amino acid side chains (2),
protons associated with methylene groups in aliphatic compounds (6), protons associated with N-acetyl
functional groups in peptidoglycan (7) and protons associated with naturally occurring silicates
compounds (*). The grey arrow highlights the resonance peak associated with peptidoglycan.

23
Figure 10: 1D water-suppressed 1H NMR spectra of porewater dissolved organic matter from selected
depths in VC1, VC2 and VC3. Specific assignments correspond to leucine (1), ethanol (2), lactic acid
(3), acetic acid (4), dimethyl sulphide (2), acetone (6), pyruvate (7), methanol (8) and glycerol (9).
Tyrosine, phenylalanine and formate were also identified in the 6.8 to 8.2 ppm region but are not
included for clarity.
The results presented here confirm that distinct bacterial populations are present in
muddy surface layers in acoustically turbid pockmarked and non-pockmarked
sediment in DBPF. Distinct variation in overall community composition has been
observed based on relative changes in bacterial PLFAs, whereby anaerobic bacteria
appear to be in highest abundance in VC2. The occurrence and increased relative
abundance of peptidoglycan in these sediments relative to VC3 indicates an increased
contribution of bacterial-derived OM, in particular in VC2. Peptidoglycan signals
most likely reflect significant bacterial necromass and/or depositional input, rather

24
than viable bacterial biomass. Comparison of NH4+ and PO4
3- pore water profiles and
pore water DOM indicate that microbial activity and OM degradation is enhanced in
muddy sediments in VC1 and VC2, and that this is enhanced in non-pockmarked
gassy sediments in DBPF (VC2).
3.3 Evidence for alternative sources of gas?
SO42- reduction and H2S production in marine sediments is generally linked, whereby
the utilization of SO42- as an electron acceptor in OM mineralization yields reduced
H2S (Jørgensen 1982). H2S is typically precipitated as pyrite or else reoxidised to
SO42-. The presence of significant levels H2S in VC1 and VC2 in the absence of SO4
2-
depletion (Fig. 2.2 and 2.3) are atypical and indicates there must be an alternative
source of H2S. In all cores fine-grained muddy strata were dominated by olive-green
to grey sediment and did not exhibit highly reduced grey/black sediments typical of
pyrite precipitation. Numerous layers with significant high densities shell hash and
organic material was observed throughout the first 2 m of sediment in both VC1 and
VC2. These layers were also characterised by horizontal cracking and strong sulphide
odours. These coincide in a number of cases with spikes in H2S levels (Fig. 2.3).
Hence these layers organic-rich shelly layers are a potential source of H2S. A possible
explanation for the presence of mM concentrations of H2S in the presence of SO42- is
the anaerobic decomposition of the sulphur-containing proteinaceous OM (Dunnette
et al., 1982). In the marine environment algal and macrophyte decomposition is the
most common source of proteinaceous OM (Fry 1987).
There is evidence that there is considerable input from dead and decaying
biomass in DBPF. During the CV09_23 survey in 2009 a dark-coloured organic-rich
sample was retrieved from a boxcore from within a pockmark cluster in the northeast
of the field (Fig. 2.1, BG10). This sample had distinct putrefying odour. PLFAs were
dominated by very high abundances of C20, C22 and C24 polyunsaturated fatty acids,
which are likely derived from eukaryotic biomass such as micro- or macroalgae
(Volkman 2006). Sterols profiles were also distinct, whereby C29∆2,24(28) (fucosterol)
and its isomers (∆2- and ∆7-avenasterol) were present in much higher abundance
compared to commonly major sterols (e.g. C27∆2 and C29∆
2). C29∆2,24(28) sterols are
typically the major sterols in Phaeophyceae (brown algae) (Patterson 1971).
Therefore the sediment within this pockmark was composed a significant component
fresh and decaying macroalgal OM, probably kelp or seaweed.

25
DMS was identified as a major component in porewater DOM in most sub-samples
analysed, in particular in muddy strata in VC1 and VC2 (Fig. 2.10). DMS (along with
methanthiol) is a significant volatile component of the organic sulphur cycle and one
of the most common gaseous compounds emitted from coastal marine environments
(Bates et al., 1992). The major source of DMS is from degradation of organo-sulphur
compounds such as dimethylsulfonioproponate (DMSP) or sulphur-containing amino
acids (Kiene 1988; Taylor and Kiene 1989), or from methylation of H2S (Finster et
al., 1990). DMSP is an osmolyte found in macroalgal (Sørensen 1988) and halophilic
higher plants (Finster et al., 1990). Microbial degradation of DMS and methanethiol
produces CO2 and CH4, whereby in high concentrations CH4 is favoured and in low
concentrations CO2 is favoured (Lyimo et al., 2009). It has also been proposed that
their degradation in freshwater environments is mediated by methanogenic archaea,
and predominantly produces CH4, while in marine environments both SRB and
methanogenic archaea are involved, with CO2 being the dominant product (Lomans et
al., 1997). This provides a clear potential metabolic route for the in-situ production of
CH4 in low amounts, and in the presence of SO42-. Further evidence for a source of
H2S, other than from SO42- reduction was obtained from analysis of amplified and
sequenced dominant bands from DGGE gels (2009 survey, data not shown). A major
band present at 1 mbsf in DBPF, and which was not observed in a control core
(GC14) was closely related (99%) to Dethiobacter sp. The model representative from
this genus, Dethiobacter alkaliphilus, is an obligately anaerobic non-sulphate
reducing representative of the reductive sulphur cycle (Sorokin 2008).
In the presence of SO42-, SRB typically outcompete methanogens for
substrates such as acetate or H2 (Jørgensen 1982). However it has been shown that
non-competitive substrates may be utilised by methanogens and allow
methanogenesis and sulphate reduction simultaneously (Oremland and Polcin 1982a).
This has been demonstrated in a number of settings including anoxic salt marsh
sediments (Oremland et al., 1982b), estuarine sediments (Oremland and Polcin
1982a), in continental margin carbonate sediments (Mitterer et al., 2001), active mud
volcanos (Lazar et al., 2012). In addition it has been observed that appreciable levels
of CH4 occur in SO42- rich sediments in about one sixth of all Deep Sea Drilling
Project and Ocean Drilling Project open ocean sites (D’Hondt et al., 2002). To main
non-competitive substrates known are methanol, methylamine and trimethylamine
(King et al., 1983; King 1984; Finke et al., 2007b). Methanol was a major compound

26
in porewater DOM from VC1 and VC2, in particular in the first 1 m of sediment (Fig.
2.9). Therefore there is enough evidence to hypothesis that in situ production of CH4
is occurring in DBPF via non-competitive substrate utilization.
Assuming that the observed AT in Fig. 2.1 reflects the distribution of gas in
the sediment column, it appears that gas is present in a relatively shallow layer in the
first 2 m of sediment. No AT or other associated gas signatures were observed below
these depths, although overlying gas and the gravel deposits could have caused signal
starvation. This AT region correlates well with measured CH4 concentrations in both
VC1 and VC2. Gas is present either as a result of migration from depth or
alternatively is produced in situ, or it may be a combination of both. The peak in CH4
between 1.4 and 2.0 mbsf (highlighted in red in Fig. 2.3) suggest that in situ
production is occurring at these depths. Interestingly this region correlates well with
the observed peak in total OM content, and suggests that OM degradation has a role
in CH4 production. It could be a by-product of OM degradation via DMSP and DMS.
DMS is an important gaseous compound in coastal settings and could itself be a
source of gas in the DBPF. Microbial production of CH4 via DMS metabolism is also
possible. Thus there appears to be multiple lines of evidence to suggest that in situ
production of CH4 is occurring in DBPF. The outlined processes are therefore
possible mechanisms for gas production and pockmark formation, in particular in
shallow coastal settings and bays. If this were the case this would represent the first
link between these biogeochemical processes and seabed fluid flow and pockmark
formation.
27
4 Conclusions
Particle size profiles and sediment type within the DBPF exhibited clear stratification
with depth, whereby fine-grained sediment is succeeded by progressively coarser
strata. The occurrence of fine-grained sandy mud and mud appears to be localized to
DBPF and thus this characteristic lithology may account for the pockmark formation
within DBPF and not in surrounding sediment. The occurrence of low concentrations
of CH4 in sediments strata where SO42- was not depleted suggests that CH4 migration
from depth may be occurring. However evidence presented here also indicates in-situ
production of volatile compounds such as DMS, as well as CH4 are a possible source
of gas. CH4 production via non-competitive substrate utilization of methanol may be
occurring as well as the production of CH4 (and CO2) from microbial reduction of
volatile sulphur compounds such as DMS. This is supported by the atypical pore
water profiles whereby significant concentrations of CH4 and H2S are observed in the
presence of SO42-. A possible source for DMS and H2S is from putrefactive
degradation of proteinaceous macroalgal OM. Bacterial activity appears to be higher
within the DBPF, and in particular microbial activity appears to be greater in non-
pockmarked acoustically turbid sediment. The effect of underlying permeable sands
and gravel on gas migration and fate, as well as other factors such as tidal and
hydrographic regime, and ground water escape remain a distinct unknown at present.

28
5 References Bates T, Lamb B, Guenther A, Dignon J, Stoiber R. 1992. Sulfur emissions to the atmosphere from
natural soures. J Atmos Chem 1992 14(1):312-337.
Batley GE, Simpson SL. 2009. Development of guidelines for ammonia in estuarine and marine water
systems. Mar Pollut Bull 28(10):1472-1476.
Benner R, Kaiser K. 2003. Abundance of amino sugars and peptidoglycan in marine particulate and
dissolved organic matter. Limnol Oceanogr 118-128.
Boschker H, Graaf W, Köster M, MeyerReil LA, Cappenberg T. 200. Bacterial populations and
processes involved in acetate and propionate consumption in anoxic brackish sediment. FEMS
Microbiol Ecol 32(1):97-103.
Boudreau BP, Huettel M, Forster S, Jahnke RA, McLachlan A, Middelburg JJ, et al. 2001. Permeable
marine sediments: overturning an old paradigm. Eos, Transactions American Geophysical
Union 82(11):133-136.
Burdige DJ. 2007 Preservation of organic matter in marine sediments: controls, mechanisms, and an
imbalance in sediment organic carbon budgets? Chem Rev 107(2):467- 482.
Christodoulou D, Papatheodorou G, Ferentinos G, Masson M. 2003. Active seepage in two contrasting
pockmark fields in the Patras and Corinth gulfs, Greece. Geo-Mar Lett 23(3):194-199.
D'Hondt S, Rutherford S, Spivack AJ. 2002. Metabolic activity of subsurface life in deep-sea
sediments. Science 292(2262):2067-2070.
Dowling NJE, Widdel F, White DC. 1986. Phospholipid ester-linked fatty acid biomarkers of acetate-
oxidizing sulphate-reducers and other sulphide-forming bacteria. J Gen Microbiol
132(7):1812-1822.
Dunnette DA, Chynoweth DP, Mancy KH. 1982. The source of hydrogen sulfide in anoxic sediment.
Water Res 19(7):872-884.
Fader GBJ. 1991. Gas-related sedimentary features from the eastern Canadian continental shelf. Cont
Shelf Res 11(8):1123-1123.
Finke N, Vandieken V, Jørgensen BB. 2007a. Acetate, lactate, propionate, and isobutyrate as electron
donors for iron and sulfate reduction in Arctic marine sediments, Svalbard. FEMS Microbiol
Ecol 29(1):10-22.
Finke N, Hoehler TM, Jørgensen BB. 2007b. Hydrogen ‘leakage’ during methanogenesis from
methanol and methylamine: implications for anaerobic carbon degradation pathways in
aquatic sediments. Environ Microbiol 9(4):1060-1071.
Finster K, King GM, Bak F. 1990. Formation of methylmercaptan and dimethylsulfide from
methoxylated aromatic compounds in anoxic marine and fresh water sediments. FEMS
Microbiol Lett 74(4):292-301.
Fry J. 1987. Functional roles of major groups of bacteria associated with detritus. In: Moriarty DJW
and Pullin RSV (eds.) Detritus and microbial ecology in aquaculture. INCLARM Conference
Proceedings: Philippines p83-122.

29
Garcia-Gil S. 2003. A natural laboratory for shallow gas: the Rías Baixas (NW Spain). Geo-Mar Lett
23(3):212-229.
Garcia-Gil S, Vilas F, Garcia-Garcia A. 2002. Shallow gas features in incised-valley fills (Rıa de Vigo,
NW Spain): a case study. Cont Shelf Res 22(16):2303-2312.
Gay A, Lopez M, Ondreas H, Charlou JL, Sermondadaz G, Cochonat P. 2006. Seafloor facies related
to upward methane flux within a Giant Pockmark of the Lower Congo Basin. Mar Geol
226(1):81-92.
Gonçalves CN, Dalmolin RSD, Dick DP, Knicker H, Klamt E, Kögel-Knabner I. 2003. The effect of
10% HF treatment on the resolution of CPMAS 13C NMR spectra and on the quality of
organic matter in Ferralsols. Geoderma 116(3):373-392.
Grasshoff K, Ehrhardt M, Kremling K, Almgren T. 1983. Methods of seawater analysis. : Wiley
Online Library
Guezennec J, FialaMedioni A. 2006. Bacterial abundance and diversity in the Barbados Trench
determined by phospholipid analysis. FEMS Microbiol Ecol 19(2):83-93.
Hagström Ä, Pinhassi J, Zweifel UL. 2000. Biogeographical diversity among marine bacterioplankton.
Aquat Microb Ecol 21(3):231-244.
Harrington P. 1982. Formation of pockmarks by pore-water escape. Geo-Mar Lett 2(3):193-197.
Holliday D, Stieglitz T, Ridd P, Read W. 2007. Geological controls and tidal forcing of submarine
groundwater discharge from a confined aquifer in a coastal sand dune system. J Geophys
Res: Oceans 112:1-10.
Hovland M, Judd A. 1988. Seabed pockmarks and seepages: impact on geology, biology, and the
marine environment. Springer.
Huettel M, Røy H, Precht E, Ehrenhauss S. 2003. Hydrodynamical impact on biogeochemical
processes in aquatic sediments. Hydrobiologia 494(1):231-236.
Huettel M, Rusch A. 2000. Transport and degradation of phytoplankton in permeable sediment.
Limnol Oceanogr 234-249.
Huettel M, Ziebis W, Forster S, Luther G. 1998. Advective transport affecting metal and nutrient
distributions and interfacial fluxes in permeable sediments. Geochim Cosmochim Acta
62(4):613-631.
Jackson CR, Weeks AQ. 2008. Influence of particle size on bacterial community structure in aquatic
sediments as revealed by 16S rRNA gene sequence analysis. Appl Environ Microbiol
74(16):2237-2240.
Jørgensen BB. 1982. Mineralization of organic matter in the sea bed—the role of sulphate reduction.
Nature 296:643-642.
Judd A, Hovland M. 2007. Seabed fluid flow: the impact on geology, biology and the marine
environment. Cambridge University Press.
Kelleher BP, Simpson AJ. 2006. Humic substances in soils: Are they really chemically distinct?
Environ Sci Technol 40(12):4602-4611.
Kelley JT, Dickson SM, Belknap DF, Barnhardt WA, Henderson M. 1994. Giant sea-bed pockmarks:
evidence for gas escape from Belfast Bay, Maine. Geology 22(1):29-62.

30
Kiene RP. 1988. Dimethyl sulfide metabolism in salt marsh sediments. FEMS Microbiol Lett 23(2):71-
78.
King GM. 1984. Utilization of hydrogen, acetate, and “noncompetitive”; substrates by methanogenic
bacteria in marine sediments. Geomicrobiol J 3(4):272-306.
King GM, Klug M, Lovley D. 1983. Metabolism of acetate, methanol, and methylated amines in
intertidal sediments of Lowes Cove, Maine. Appl Environ Microbiol 42(6):1848-1823.
Knebel HJ, Scanlon KM. 1982. Sedimentary framework of Penobscot Bay, Maine. Mar Geol
62(3):302-324.
Lam B, Simpson AJ. 2007. Direct 1H NMR spectroscopy of dissolved organic matter in natural waters.
Analyst 133(2):263-269.
Lazar CS, John Parkes R, Cragg BA, L'Haridon S, Toffin L. 2012. Methanogenic activity and diversity
in the centre of the Amsterdam Mud Volcano, Eastern Mediterranean Sea. FEMS Microbiol
Ecol 81(1):243-224
Lomans BP, Smolders A, Intven LM, Pol A, Op D, Van Der Drift C. 1997. Formation of dimethyl
sulfide and methanethiol in anoxic freshwater sediments. Appl Environ Microbiol
63(12):4741-4747.
Lyimo TJ, Pol A, Harhangi HR, Jetten MSM, Op den Camp HJM. 2009. Anaerobic oxidation of
dimethylsulfide and methanethiol in mangrove sediments is dominated by sulfatereducing
bacteria. FEMS Microbiol Ecol 70(3):483-492.
MacCarthy IAJ. 2007. The South Munster Basin of southwest Ireland. J Maps 3(1):149-172.
McCarthy MD, Hedges JI, Benner R. 1998. Major bacterial contribution to marine dissolved organic
nitrogen. Science 281(2374):231-234.
McCaul MV, Sutton D, Simpson AJ, Spence A, McNally DJ, Moran BW, et al. 2011. Composition of
dissolved organic matter within a lacustrine environment. Environ Chem 8(2):146-124.
Mills CT, Dias RF, Graham D, Mandernack KW. 2006. Determination of phospholipid fatty acid
structures and stable carbon isotope compositions of deep-sea sediments of the Northwest
Pacific, ODP site 1179. Mar Chem 98(2):197-209.
Mitterer RM, Malone MJ, Goodfriend GA, Swart PK, Wortmann UG, Logan GA, et al. 2001. Co-
generation of hydrogen sulfide and methane in marine carbonate sediments. Geophys Res Lett
28(20):3931-3934.
Monteys X, Bloomer S, Chapman R. 2010. Multi-frequency acoustic seabed characterisation in
shallow gas-bearing sediments in Dunmanus Bay, SW Ireland. Geophysical Research
Abstracts 12, EGU2010-10707-2, EGU General Assembly, Vienna
Moriarty D, Hayward A. 1982. Ultrastructure of bacteria and the proportion of Gram-negative bacteria
in marine sediments. Microb Ecol 8(1):1-14.
Nelson H, Thor D, Sandstrom M, Kvenvolden K. 1979. Modern biogenic gas-generated craters (sea-
floor “pockmarks”) on the Bering Shelf, Alaska. Geological Society of America Bulletin
90(12):1144-1122.
Oremland RS, Polcin S. 1982a. Methanogenesis and sulfate reduction: competitive and
noncompetitive substrates in estuarine sediments. Appl Environ Microbiol 44(6):1270-1276.

31
Oremland RS, Marsh LM, Polcin S. 1982b. Methane production and simultaneous sulphate reduction
in anoxic, salt marsh sediments. Nature 296:143-142.
Patterson GW. 1971. The distribution of sterols in algae. Lipids 6(2):120-127.
Paull C, Ussler III W, Maher N, Greene H, Rehder G, Lorenson T, et al. 2002. Pockmarks off Big Sur,
California. Mar Geol 181(4):323-332.
Paull C, Ussler III W, Borowski W. 1999. Freshwater ice rafting: an additional mechanism for the
formation of some high-latitude submarine pockmarks. Geo-Mar Lett 19(1):164-168.
Pedersen AGU, Thomsen TR, Lomstein BA, Jorgensen NOG. 2001. Bacterial influence on amino acid
enantiomerization in a coastal marine sediment. Limnol Oceanogr 46(6):1328-1369.
Pickrill R. 2006. Shallow seismic stratigraphy and pockmarks of a hydrothermally influenced lake,
Lake Rotoiti, New Zealand. Sedimentology 40(2):813-828.
Rajendran N, Suwa Y, Urushigawa Y. 1993. Distribution of phospholipid ester-linked fatty acid
biomarkers for bacteria in the sediment of Ise Bay, Japan. Mar Chem 42(1):39-26.
Rogers JN, Kelley JT, Belknap DF, Gontz A, Barnhardt WA. 2006. Shallow-water pockmark
formation in temperate estuaries: A consideration of origins in the western gulf of Maine with
special focus on Belfast Bay. Mar Geol 222(1):42-62.
Sansone FJ, Martens CS. 1982. Volatile fatty acid cycling in organic-rich marine sediments. Geochim
Cosmochim Acta 46(9):1272-1289.
Santos IR, Eyre BD, Huettel M. 2011. The driving forces of porewater and groundwater flow in
permeable coastal sediments: A review. Estuar Coast Shelf Sci 98:1-12.
Simpson AJ, Brown SA. 2002. Purge NMR: effective and easy solvent suppression. J Magn Reson
172(2):340-346.
Simpson AJ, McNally DJ, Simpson MJ. 2011. NMR spectroscopy in environmental research: from
molecular interactions to global processes. Prog Nucl Magn Reson Spectrosc 28(3):97-172.
Simpson AJ, Simpson MJ, Smith E, Kelleher BP. 2007. Microbially derived inputs to soil organic
matter: are current estimates too low? Environ Sci Technol 41(23):8070-8076.
Sørensen J. 1988. Dimethylsulfide and methane thiol in sediment porewater of a Danish estuary.
Biogeochemistry 6(3):201-210.
Sørensen J, Christensen D, Jørgensen BB. 1981. Volatile fatty acids and hydrogen as substrates for
sulfate-reducing bacteria in anaerobic marine sediment. Appl Environ Microbiol 42(1):2-11.
Sorokin DY, Tourova T, Mußmann M, Muyzer G. 2008. Dethiobacter alkaliphilus gen. nov. sp. nov.,
and Desulfurivibrio alkaliphilus gen. nov. sp. nov.: two novel representatives of reductive
sulfur cycle from soda lakes. Extremophiles 12(3):431-439.
Spence A, Simpson AJ, Mcnally DJ, Moran BW, McCaul MV, Hart K, et al. 2011. The degradation
characteristics of microbial biomass in soil. Geochim Cosmochim Acta 72(10):2271-2281.
Szpak M. 2012a. Chemical and physical dynamics of marine pockmarks with insights into the organic
carbon cycling on the Malin Shelf and in the Dunmanus Bay, Ireland.
Szpak M, Monteys X, O'Reilly S, Simpson A, Garcia X, Evans RL, et al. 2012b. Geophysical and
geochemical survey of a large marine pockmark on the Malin Shelf, Ireland. Geochem
Geophy Geosy 13(1):1-18.

32
Taylor BF, Kiene RP. 1989. Microbial metabolism of dimethyl sulfide. Biogenic sulfur in the
environment. ACS Symposium Series: ACS Publications.
Ussler W, Paull CK, Boucher J, Friederich G, Thomas D. 2003. Submarine pockmarks: a case study
from Belfast Bay, Maine. Mar Geol 202(3):172-192.
Volkman JK. Lipid markers for marine organic matter. Marine Organic Matter: Biomarkers, Isotopes
and DNA 2006, p.27-70.
White DC, Ringelberg DB. 1998. Signature lipid biomarker analysis. Techniques in microbial
ecology.Oxford University Press, New York, NY p.222-272.
White DC, Ringelberg DB, Macnaughton SJ, Srinivas A, David S. 1997. Signature Lipid Biomarker
Analysis for Quantitative Assessment In Situ of Environmental Microbial Ecology.
American Chemical Society. p 22.
Whiticar MJ. 2002. Diagenetic relationships of methanogenesis, nutrients, acoustic turbidity,
pockmarks and freshwater seepages in Eckernförde Bay. Mar Geol 182(1):29-23.
Wilson AM, Huettel M, Klein S. 2008. Grain size and depositional environment as predictors of
permeability in coastal marine sands. Estuar Coast Shelf Sci 80(1):193-199.
Wu D, Chen A, Johnson CS. 1992. An improved diffusion-ordered spectroscopy experiment
incorporating bipolar-gradient pulses. J Magn Reson A 112(2):260-264.