multifamily market overview - f.tlcollect.com · multifamily market overview 2019. macro-level...
TRANSCRIPT

g r e a t e r d a y t o n a p a r t m e n t a s s o c i a t i o n
presented by:
Kurt shoemaKer | First Vice president
multifamily m arke t overv ie w 2019

macro-leveleconomicindicators
01micro-leveleconomicindicators
022018 cBre rent & occupancy
survey results
03investment
markethighlights
2019Forecast
multiFamilydevelopment
04 0605
agenda

01 macro-level economic
indicators
greater dayton apartment association | 2019 multiFamily marKet oVerView |

greater dayton apartment association | 2019 multiFamily marKet oVerView |
source: u.s. bureau oF labor statistics, seasonally-adJusted data through January 2018. wage growth is based on aVerage hourly earnings.
CYCLICAL DRIVER - U.S. ECONOMY
Despite 3.7% unemployment, job creation maintaining pace; 2.5 million jobs added in past year
Historical Employment Growth Rate Year-over-Year
1.7
-5-4-3-2-10123
Oct-08 Oct-10 Oct-12 Oct-14 Oct-16 Oct-18
%
Wage GrowthOctober 2018 y-o-y
+3.1%
Jobs + 1.7% | Wages + 3.1% | 220,000 Monthly Job Growth
cyclical driversU.S . economy
DESPITE 3.9% UNEMPLOYMENT, JOB CREATION MAINTAINING PACE
0 4
JoBS
+1.7%waGeS
+3.1%monthlyJoB Growth
220,000

greater dayton apartment association | 2019 multiFamily marKet oVerView |
source: bloomberg.com, accessed 1/22/2019
key r ateshiStorical
05
Prime Rate
1/2015 1/2016 1/2017 1/2018 1/20192.00%
2.50%
3.50%
3.00%
4.00%
4.50%
5.00%
5.50%
3.25%3.50%
3.75%
4.50%
5.50%
5-Year Treasury
1/2015 1/20171/2016 1/2018 1/20190.50%
1.00%
2.00%
1.50%
2.50%
3.00%
1.33% 1.45%
1.89%
2.60%2.45%
10-Year Treasury3.00%
2.60%
2.20%
1.80%
1.40%
1.00%
1/2015 1/2016 1/2017 1/2018 1/2019
1.80%2.02%
2.39%2.65% 2.75%
LIBOR (3 mo)2.00%
1.60%
1.20%
0.80%
0.40%
0.00%
1/2015 1/2016 1/2017 1/2018 1/2019
0.26%0.61%
1.01%
2.40%
2.80% 2.78%
1.73%

greater dayton apartment association | 2019 multiFamily marKet oVerView |
interest r ates10-year treaSUry | 2 year hiStory
THREE POTENTIAL TWEAKS TO FEDERAL FUNDS RATE IN 2019
06
source: marKetwatch.com
ma
y-17
no
V-17
au
g-1
7
Feb-1
8
Jul-
18
J un
-17
dec
-17
sep-
17
ma
r-18
au
g-1
8
ma
y-18
oc
t-18
Jul -
17
Jan
-18
oc
t-17
apr
-18
sep-
18
Jun
-18
no
V-18
dec
-18
0.00%
0.50%
1.00%
1.50%
2.00%
2.50%
3.00%
3.50%
Jan
-19
8-YEARHIGH AT
3.22%

source: tradingeconomics.com | dow Jones
DOW JONES INDUSTRIAL AvERAGE
07
greater dayton apartment association | 2019 multiFamily marKet oVerView |
2008 2010 2012 2014 2016 2018
5000
10000
15000
20000
25000
30000-7.31% firSt neGative year Since 2009
Growth in 2018

TAx & TRADE REFORMWHAT’S IMPACTING OUR ECONOMY
08
greater dayton apartment association | 2019 multiFamily marKet oVerView |

greater dayton apartment association | 2019 multiFamily marKet oVerView |
BUyinG a hoUSe may not Be financially attainaBle
DemoGraphicS remain favoraBle
lifeStyle chanGeS favor mUltifamily
DEMOGRAPHICSanD a chanGinG mentality
SECULAR DEMAND DRIvERS
09

greater dayton apartment association | 2019 multiFamily marKet oVerView |
source: cbre research, cbre econometric adVisors, national association oF realtors, u.s. bureau oF labor statistics, Q3 and Q4 2018. home price, earnings and inFlation data through october 2018.
+37% rent growth since recession; yet affordability is not just a multifamily problem
Historical Multifamily Effective Rent ($/Month/Unit)
1,190
1,634
1,100
1,200
1,300
1,400
1,500
1,600
1,700
Q3 2006 Q3 2008 Q3 2010 Q3 2012 Q3 2014 Q3 2016 Q3 2018
Comparative Price Changes Since Recession
% Change Total Annual
Multifamily Rent 37.5 3.7
Single-Family HomeMedian Sales Price 57.4 5.3
Average Hourly EarningsAll Workers 22.0 2.3
Average Hourly Earnings Production & Non-Supervisory Workers
21.5 2.2
Inflation - CPI All Cities 16.3 1.7
AFFORDABILITYU.S. mUltifamily rentS
+37% RENT GROWTH SINCE RECESSION; YET AFFORDABILITY IS NOT JUST A MULTIFAMILY PROBLEM.
10
greater dayton apartment association | 2019 multiFamily marKet oVerView |
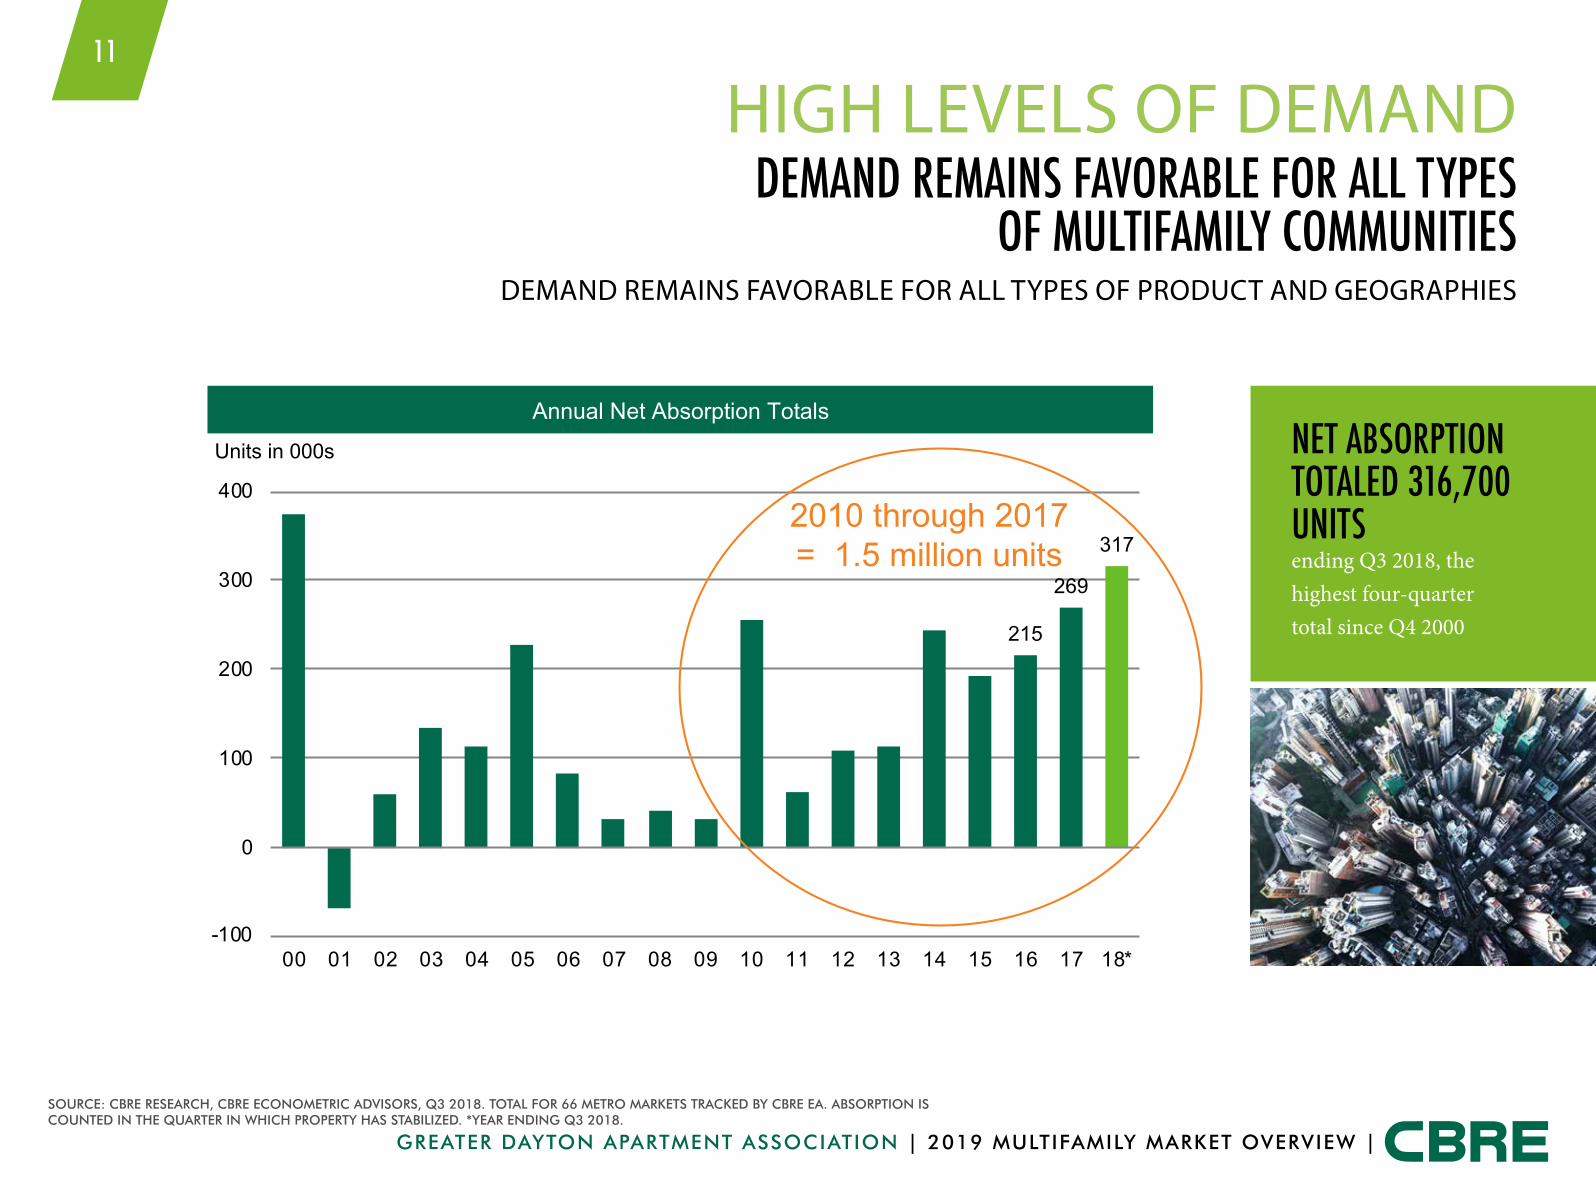
source: cbre research, cbre econometric adVisors, Q3 2018. total For 66 metro marKets tracKed by cbre ea. absorption is counted in the Quarter in which property has stabilized. *year ending Q3 2018.
Annual Net Absorption Totals
215
269
317
-100
0
100
200
300
400
00 01 02 03 04 05 06 07 08 09 10 11 12 13 14 15 16 17 18*
Units in 000s
2010 through 2017= 1.5 million units
HIGH LEvELS OF DEMANDDemanD remainS favoraBle for all typeS
of mUltifamily commUnitieSDEMAND REMAINS FAvORABLE FOR ALL TYPES OF PRODUCT AND GEOGRAPHIES
11
net aBSorption totaleD 316,700 UnitS
ending Q3 2018, the highest four-quarter total since Q4 2000

greater dayton apartment association | 2019 multiFamily marKet oVerView |
source: cbre research, cbre econometric adVisors, Q3 2018.
Historical Vacancy Rate and Year-over-Year Change
0
1
2
3
4
5
6
7
-150
-100
-50
0
50
100
150
200
Q3 2006 Q3 2008 Q3 2010 Q3 2012 Q3 2014 Q3 2016 Q3 2018
Y-o-Y Vacancy Change (bps) Vacancy Rate (%)
U.S. MULTIFAMILY vACANCYvacancy incheD Up in 2017, BUt Still healthy
vACANCY FELL IN BOTH 2Q AND 3Q, REvERSAL OF FORMER TWO-YEAR TREND OF MODEST INCREASES
12
Same for both “baseline” and “Moody’s Analytics” forecasts
Down 40 bps year-over-year
Outlook over next year: +40 bps rise to 4.4% in Q3 2019
Q3 2018 = 4.0%

02 micro-level economic
indicators
greater dayton apartment association | 2019 multiFamily marKet oVerView |

greater dayton apartment association | 2019 multiFamily marKet oVerView |
source: esri
AREA DEMOGRAPHICSDayton ohio mSa
14
eDUcation | popUlation 25+
popUlation
hoUSeholD income
2 0 1 8 8 0 5 , 7 4 62 0 1 8 - 2 0 2 3 P R O J . G R O W T H 0 . 1 5 %U S A V G : 0 . 8 3 %
A S S O C I AT E S D E G R E E 9 . 8 %B A C H E L O R ’ S D E G R E E + 2 9 . 1 %C O M B I N E D 3 9 %U S A V G : 4 0 %
2 0 1 8 A V E R A G E $ 7 0 , 5 1 8 U S A V E R A G E $ 8 3 , 6 9 4H O U S E H O L D S E A R N I N G $ 2 5 K - $ 3 4 . 9 K 1 0 . 4 %H O U S E H O L D S E A R N I N G $ 3 5 K - $ 4 9 . 9 K 1 3 . 8 %H O U S E H O L D S E A R N I N G $ 5 0 K - $ 7 4 . 9 K 1 8 . 7 %H O U S E H O L D S E A R N I N G + 7 5 K 3 4 %

greater dayton apartment association | 2019 multiFamily marKet oVerView |
OHIO 4.6%KENTUCKY 4.5%INDIANA 3.6%NATIONAL 3.9%
source: bureau oF labor statistics
DAYTON MSA 4%
UNEMPLOYMENTSeaSonally aDJUSteD Unemployment
rateS aS of novemBer, 2018
15

source: united states census bureau > building permits surVey > permits by metropolitan area
JAN-NOV 2018 MLS SINGLE-FAMILY & CONDO SALES
LISTING
SOLDS
TOTAL SALE PRICE
% SALE/L IST PRICE
2018 2017 % Change
MEDIAN SALES PRICE
19,834 19,617 1.11%
15,195 15,036 1.06%
$2.52B $2.34B 7.49%
98.5 98.1 0.41%
$142,000 $134,000 5 .97%
AVERAGE SALES PRICE $165,733 $155,822 6 .36%
SINGLE FAMILY SALESDayton mSa SaleS
16
greater dayton apartment association | 2019 multiFamily marKet oVerView |
25%overall increaSeSince the receSSion

greater dayton apartment association | 2019 multiFamily marKet oVerView |
source: cbre
WHAT IS AN OPPORTUNITY zONE?Definition
THE DEPLOYMENT OF DEBT & EQUITY IN ECONOMICALLY CHALLENGED COMMUNITIES TO SUPPORT LONG-TERM, SUSTAINABLE GROWTH
17
of census tracts in a state could be designated as
“opportunity zones”
census tract must have at least 20%
poverty rate
of median income must not exceed 80% of metro or state level
designation of opportunity zone remains in effect
through the end of 2028

greater dayton apartment association | 2019 multiFamily marKet oVerView |
OPPORTUNITY zONEStax aDvantaGeS
18
KEY BENEfITS• Temporary Deferral of Capital Gains Taxes• Step up Basis• Tax-Free Earnings after Year 10
investors can defer taxes on capital gains
until 2026
capital must be placed in an opportunity fund
within 180 days
unlimited amount of capital can be reinvested into an opportunity fund
source: cbre

greater dayton apartment association | 2019 multiFamily marKet oVerView |
source: bureau oF labor statistics
SKILLED LABOR SHORTAGEinDUStry trenDS
19
80% of conStrUction firmS report havinG a harD time fillinG craft poSitionS
conStrUction JoBS are expecteD to Grow By 11% Until 2026, exceeDinG the averaGe for all other occUpationS

greater dayton apartment association | 2019 multiFamily marKet oVerView |
source: http://Fox45now.com/news/local/dayton-and-cincinnati-metroplex-within-the-decade
. . . w i l l c o m e t o f r u i t i o n w i t h i n t h e n e x t d e c a d e a n d t h e t i m i n g i s r i p e
- J i l l M e y e r, Pr e s i d e n t & C E O C i n c i n n a t i U S A R e g i o n a l C h a m b e r
18thlargest
CINCINNATI DAYTON
metroplexCOMBINED MSA’S ESTIMATED TO BECOME:
20

greater dayton apartment association | 2019 multiFamily marKet oVerView |
MULTIFAMILY MARKET CYCLEmarket poSition aS of q3 2018
21
source: cbre
82 JEANETTE I. RICE | STATE OF U.S. MULTIFAMILY MARKETCBRE
Source: CBRE Research, Q3 2018.
STABILIZATIONRents still declining or stable,
vacancy increasing, or decreasing slowly and limited
or new supply additions
EXPANSIONRents rising at faster pace, vacancy declining, and new supply additions underway
or on the horizon
MATURATIONRents increasing at slower pace, vacancy stable, and
increased new supply additions
CONTRACTIONRents declining, vacancy increasing, and excess new supply additions
MULTIFAMILY MARKET CYCLEMARKET POSITION AS OF Q3 2018
AlbuquerqueAustinChicagoClevelandDallasLexingtonNashvilleNew YorkSan AntonioSeattleSt. LouisTulsaU.S. Infill Multifamily
AtlantaBaltimoreCharlotteColorado Sprs.DenverFt. WorthKansas CityLouisvilleMiamiMinneapolisNewarkNorfolkOaklandOklahoma CityOmahaOrange CountyPortlandRaleighWashington, D.C.West Palm Beach
Inland EmpireJacksonvilleLas VegasLong IslandOrlandoPhoenixProvidenceRichmondTampa
BirminghamBostonCincinnatiColumbusDaytonDetroitEl PasoFt. LauderdaleGreensboroGreenvilleHartfordHonoluluHoustonIndianapolis
Los AngelesMemphisPhiladelphiaPittsburghSacramentoSalt Lake CitySan DiegoSan FranciscoSan JoseTucsonVenturaU.S. Suburban Multifamily
Dayton

03 2018 cBre rent and
occupancy survey
greater dayton apartment association | 2019 multiFamily marKet oVerView |

greater dayton apartment association | 2019 multiFamily marKet oVerView |
source: cbre
CBRE SURvEY RESULTS5-year occUpancy hiStory
23
NORTH
89.5%
94.0% 95.3%93.0%
201475.0%
80.0%
85.0%
90.0%
95.0%
100.0%
2015 2016 2017 2018
CENTRAL
201475.0%
80.0%
85.0%
90.0%
95.0%
2015 2016 2017 2018
84.3%
95.3% 96.4%
91.4%
100.0%
EAST
201475.0%
80.0%
85.0%
90.0%
95.0%
2015 2016 2017 2018
93.1%95.2% 94.2% 93.6%
100.0%
SOUTH
201475.0%
80.0%
85.0%
90.0%
95.0%
2015 2016 2017 2018
93.9% 95.0%93.5% 94.2%
100.0%
94.2%
95.5%93.3%
94.1%

greater dayton apartment association | 2019 multiFamily marKet oVerView |
source: cbre
CBRE SURvEY RESULTS5-year occUpancy hiStory
24
Greater Dayton MSA, Overall
201475.0%
80.0%
85.0%
90.0%
95.0%
100.0%
2015 2016 2017 2018
91.9%94.9% 94.2% 93.6% 94.4%

greater dayton apartment association | 2019 multiFamily marKet oVerView |
source: cbre
CBRE SURvEY RESULTSye 2018 averaGe effective rent
25
$805 / UNITAVERAGE ASKING RENT
$667 / UNITAVERAGE ASKING RENT
$837 / UNITAVERAGE ASKING RENT
$825 / UNITAVERAGE ASKING RENT
$827 / UNITAVERAGE ASKING RENT
$700 1 Bed / 1 Bath
$703 2 Bed / 1 Bath
$971 2 Bed / 2 Bath
$987 3 Bed average
}
$581 1 Bed / 1 Bath
$670 2 Bed / 1 Bath
$709 2 Bed / 2 Bath
$809 3 Bed average
} }
$693 1 Bed / 1 Bath
$666 2 Bed / 1 Bath
$1,012 2 Bed / 2 Bath
$1,100 3 Bed average
} }OVERALL NORTH SOUTH EAST CENTRAL
$748 1 Bed / 1 Bath
$743 2 Bed / 1 Bath
$969 2 Bed / 2 Bath
$1,110 3 Bed average
$714 1 Bed / 1 Bath
$683 2 Bed / 1 Bath
$1,367 2 Bed / 2 Bath
$1,300 3 Bed average
+ 10.7%+ 5.3%+ 5.5% + 5.2% + 4.3%
YOY 2017 - 2018 AvERAGE EFFECTIvE RENT GROWTH

greater dayton apartment association | 2019 multiFamily marKet oVerView |
CBRE SURvEY RESULTSkey take awayS
26
Downtown Dayton iS on fire
occUpancieS improveD
rent increaSeS city wiDe
reSUltS SUrpaSSinG moSt SUBmarketS

04 investment market
HigHligHts
greater dayton apartment association | 2019 multiFamily marKet oVerView |

greater dayton apartment association | 2019 multiFamily marKet oVerView |
source: real capital analytics, cbre research, Q4 2018, 2018 estimate is For all types oF transactions
U.S. MULTIFAMILY ACQUISITIONS2018 hiGheSt volUme in rca
hiStory at roUGhly $175 Billion
28
• 2017’s $154 billion total investment volUme waS Down 3.2% from the prior year
• total volume was second highest in the paSt 17 yearS (anD likely all hiStory)
• 2018 total is estimate based on mid JanUary total of $165 Billion. eStimate iS $175 Billion which woUlD Be a 14% Gain over 2017
• 2019 investment - a modest decline of 8% to 12% eStimateD
JEANETTE I. RICECBRE
–
–
• 2017’s $154 billion total
•
•
•

greater dayton apartment association | 2019 multiFamily marKet oVerView |
source: cbre
ANNUAL HISTORICAL TRANSACTION vOLUME
2018 mUltifamily SaleSGREATER DAYTON MSA | MULTIFAMILY SALES $1M+ OR 100 UNITS+
29
yoy 2017-2018 percentaGe chanGe:
total conSiDeration: $141 million
no. tranSactionS: 19 | UnitS: 2,509
- 12.5%Consideration
+ 26% Transactions
- 9.7% Units

greater dayton apartment association | 2019 multiFamily marKet oVerView |
2018 MULTIFAMILY SALESGREATER DAYTON MSA | MULTIFAMILY SALES $1M+ OR 100 UNITS+
30
source: cbre
10-YEAR HISTORY | TRANSACTION SALE VOLUME
2009 2010 2012 2014 2016 20182011 2013 2015 2017$0
$20$40$60$80
$100$120$140$160$180
mill
ions

greater dayton apartment association | 2019 multiFamily marKet oVerView |
2018 MULTIFAMILY SALESGREATER DAYTON MSA | MULTIFAMILY SALES $1M+ OR 100 UNITS+
31
source: cbre
10-YEAR AVERAGE / SALE PRICE PER UNIT
2009 2010 2012 2014 2016 20182011 2013 2015 2017$0
$10
$20
$30
$40
$50
$60
$70
thou
sand
s
2018 avG.
$53,000per Unit

greater dayton apartment association | 2019 multiFamily marKet oVerView |
source: cbre research, cbre econometric adVisors, ncreiF, u.s. department oF the treasury, Q3 2018.
INTEREST RATES & CAP RATESintereSt rateS & cap rateS not
alwayS trenDinG toGether
32
other factorS to conSiDer for cap rate pricinG• mortgage rates
• spreads between interest rateS anD mortGaGe rateS
• overall investment volume
• cross-border buying activity
• availability of debt capital
• product availability
• economic performance
• market fundamentals
• actual/potential tax changes
Historical Treasury Rates and Multifamily Cap Rates
2.92
4.21
0
2
4
6
8
Q3 2002 Q3 2004 Q3 2006 Q3 2008 Q3 2010 Q3 2012 Q3 2014 Q3 2016 Q3 2018
10-Year Treasury Multifamily Cap Rate
Historical Spread Between Interest Rates and Cap Rates
356
129
-100
0
100
200
300
400
Q3 2002 Q3 2004 Q3 2006 Q3 2008 Q3 2010 Q3 2012 Q3 2014 Q3 2016 Q3 2018
Average (197) Spread (BPs)
greater dayton apartment association | 2019 multiFamily marKet oVerView |
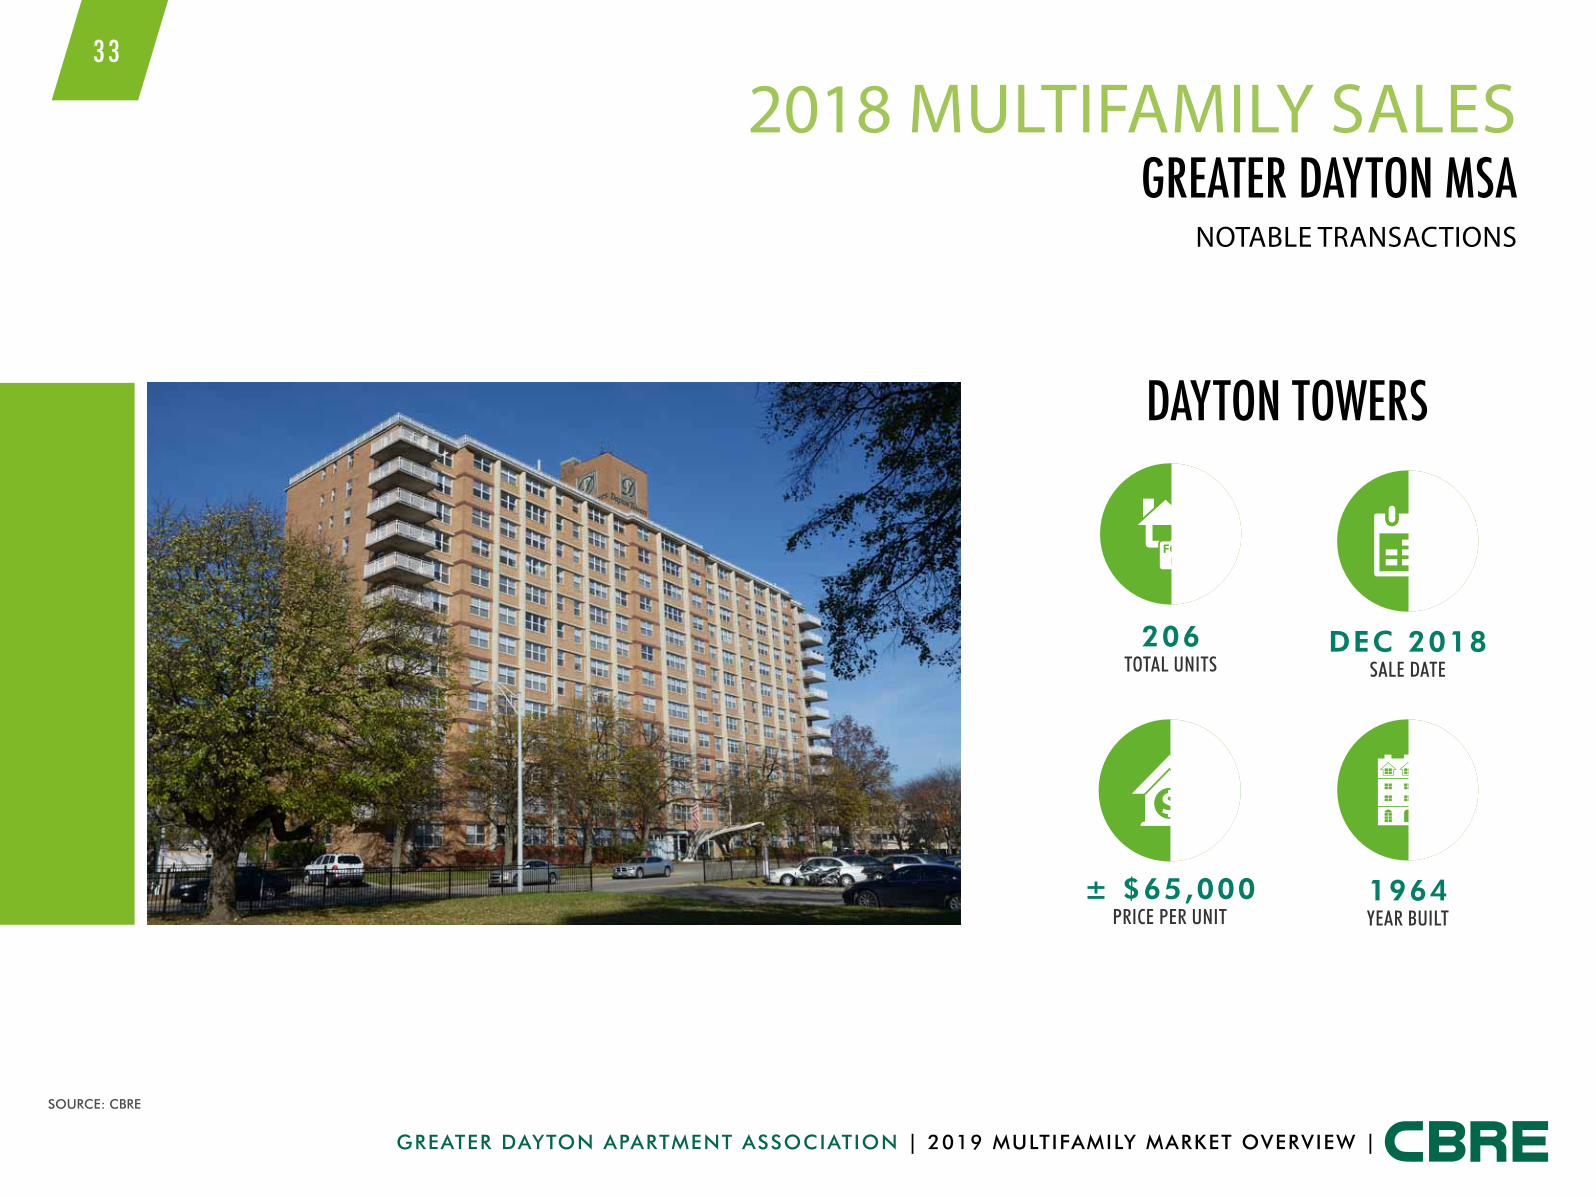
source: cbre
2018 MULTIFAMILY SALESGreater Dayton mSa
NOTABLE TRANSACTIONS
33
Dayton towerS
206TOTAL UNITS
DEC 2018SALE DATE
± $65,000PRICE PER UNIT
1964YEAR BUILT
05 multifamilydevelopment
greater dayton apartment association | 2019 multiFamily marKet oVerView |

greater dayton apartment association | 2019 multiFamily marKet oVerView |
source: united states census bureau > building permits surVey > permits by metropolitan area
DEvELOPMENT PIPELINEDayton mSa permitS iSSUeD
35
SINGLE-FAMILY PERMITS
Y T D O C T 2 0 1 8 P E R M I T S 1 , 0 8 3
2 0 1 7 - 2 0 1 8 Y O Y % C H A N G E + 1 8 . 1 %
2 0 0 9 - 2 0 1 8 T O TA L P E R M I T S 8 , 1 0 9
2 0 0 9 - 2 0 1 8 A N N U A L A V E R A G E P E R M I T S 8 1 1
greater dayton apartment association | 2019 multiFamily marKet oVerView |
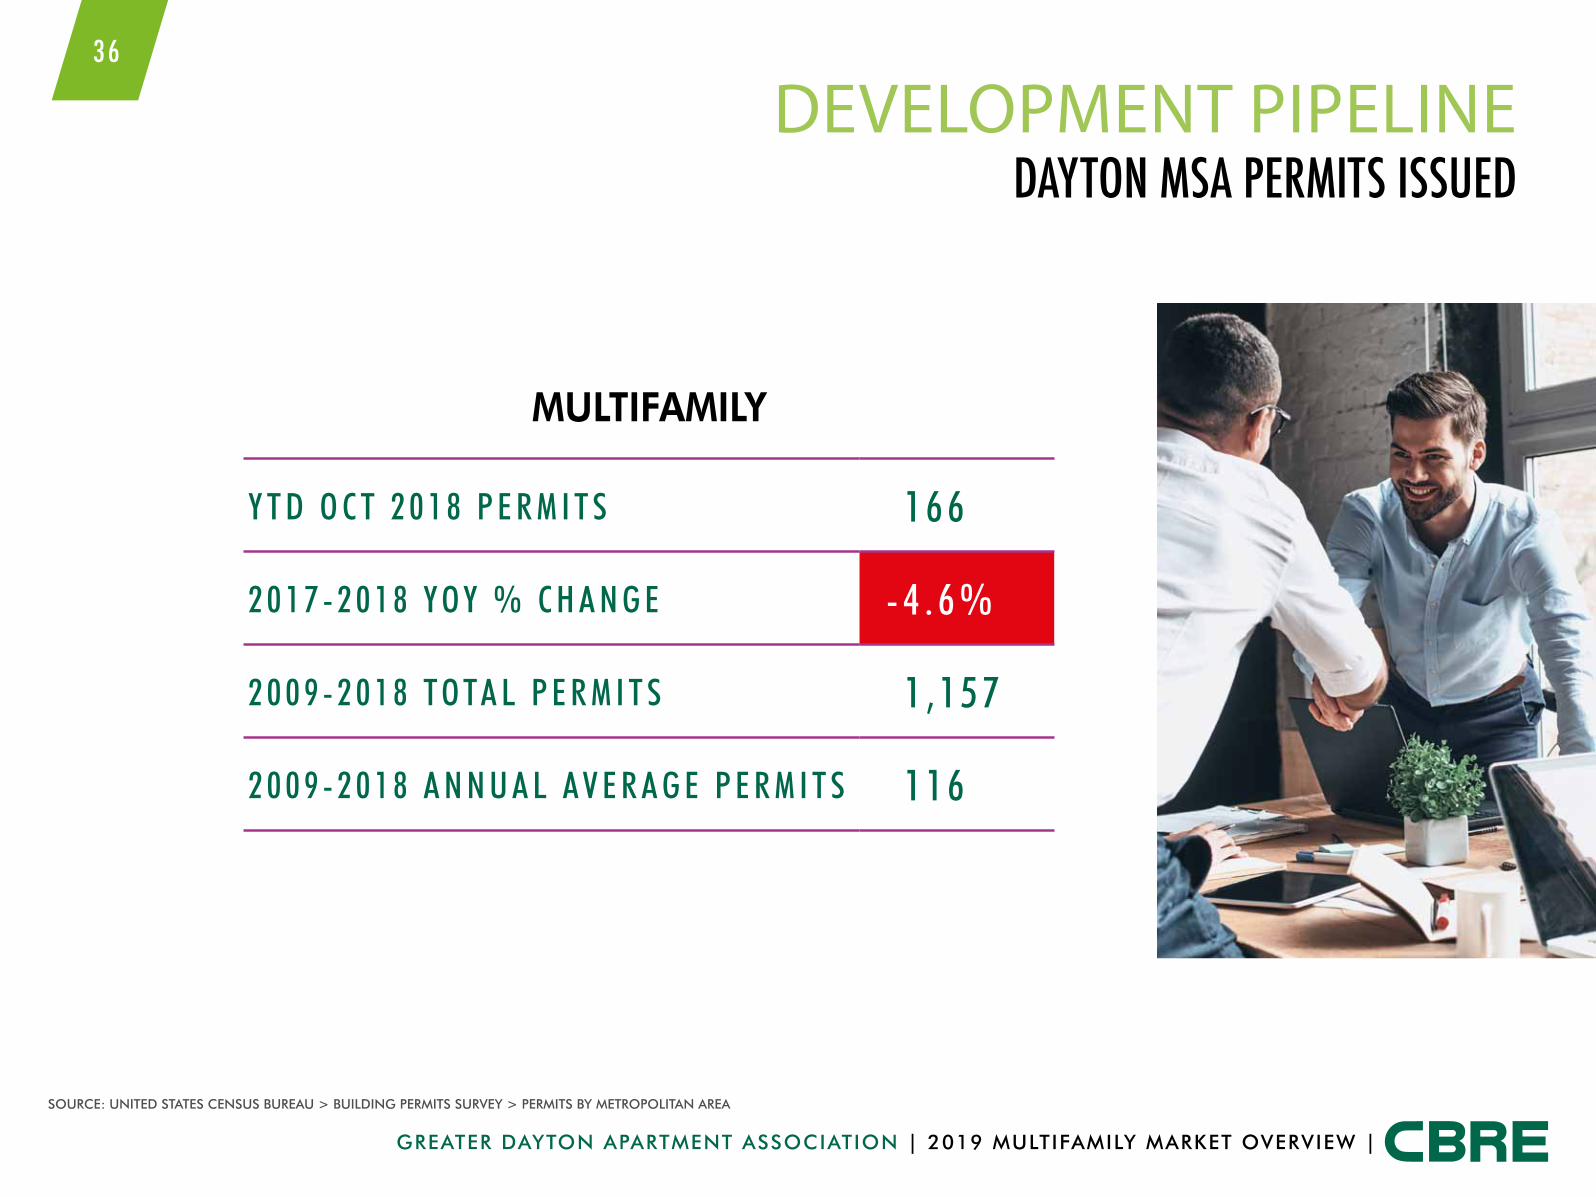
source: united states census bureau > building permits surVey > permits by metropolitan area
36
DEvELOPMENT PIPELINEDayton mSa permitS iSSUeD
MuLTIFAMILY
Y T D O C T 2 0 1 8 P E R M I T S 1 6 6
2 0 1 7 - 2 0 1 8 Y O Y % C H A N G E - 4 . 6 %
2 0 0 9 - 2 0 1 8 T O TA L P E R M I T S 1 , 1 5 7
2 0 0 9 - 2 0 1 8 A N N U A L A V E R A G E P E R M I T S 1 1 6

greater dayton apartment association | 2019 multiFamily marKet oVerView |
DEvELOPMENT PIPELINEDayton mSa cBre proJecteD mUltifamily DeliverieS
37
3-YEAR Mf UNIT DELIVERY PROJECTION
20190
200
400
600
800
1,000
1,200
2020 2021
1,013
494
source: cbre
322

greater dayton apartment association | 2019 multiFamily marKet oVerView |
DEvELOPMENT PIPELINE mUltifamily proJectS UnDer conStrUction
38
WATERfORD AT SUGAR CREEKSouth Submarket: Sugarcreek Township
MILLER VALENTINE GROUP & ACKERMANN GROUP
231 Units
MARCH 2018 - fIRST UNITS Final units being delivered Spring 2019

greater dayton apartment association | 2019 multiFamily marKet oVerView |
39
DEvELOPMENT PIPELINE mUltifamily proJectS UnDer conStrUction
ALLURESouth Submarket: Centerville
HILLS PROPERTIES312 Units
LEASINGStarted Leasing December 2018
Summer 2019 Stabilization

greater dayton apartment association | 2019 multiFamily marKet oVerView |
40
DEvELOPMENT PIPELINE mUltifamily proJectS UnDer conStrUction
ELEMENT OAKWOODSouth Submarket: Oakwood
HILLS PROPERTIES84 Units
LEASINGExpected to
start leasing in March 2019
greater dayton apartment association | 2019 multiFamily marKet oVerView |
41
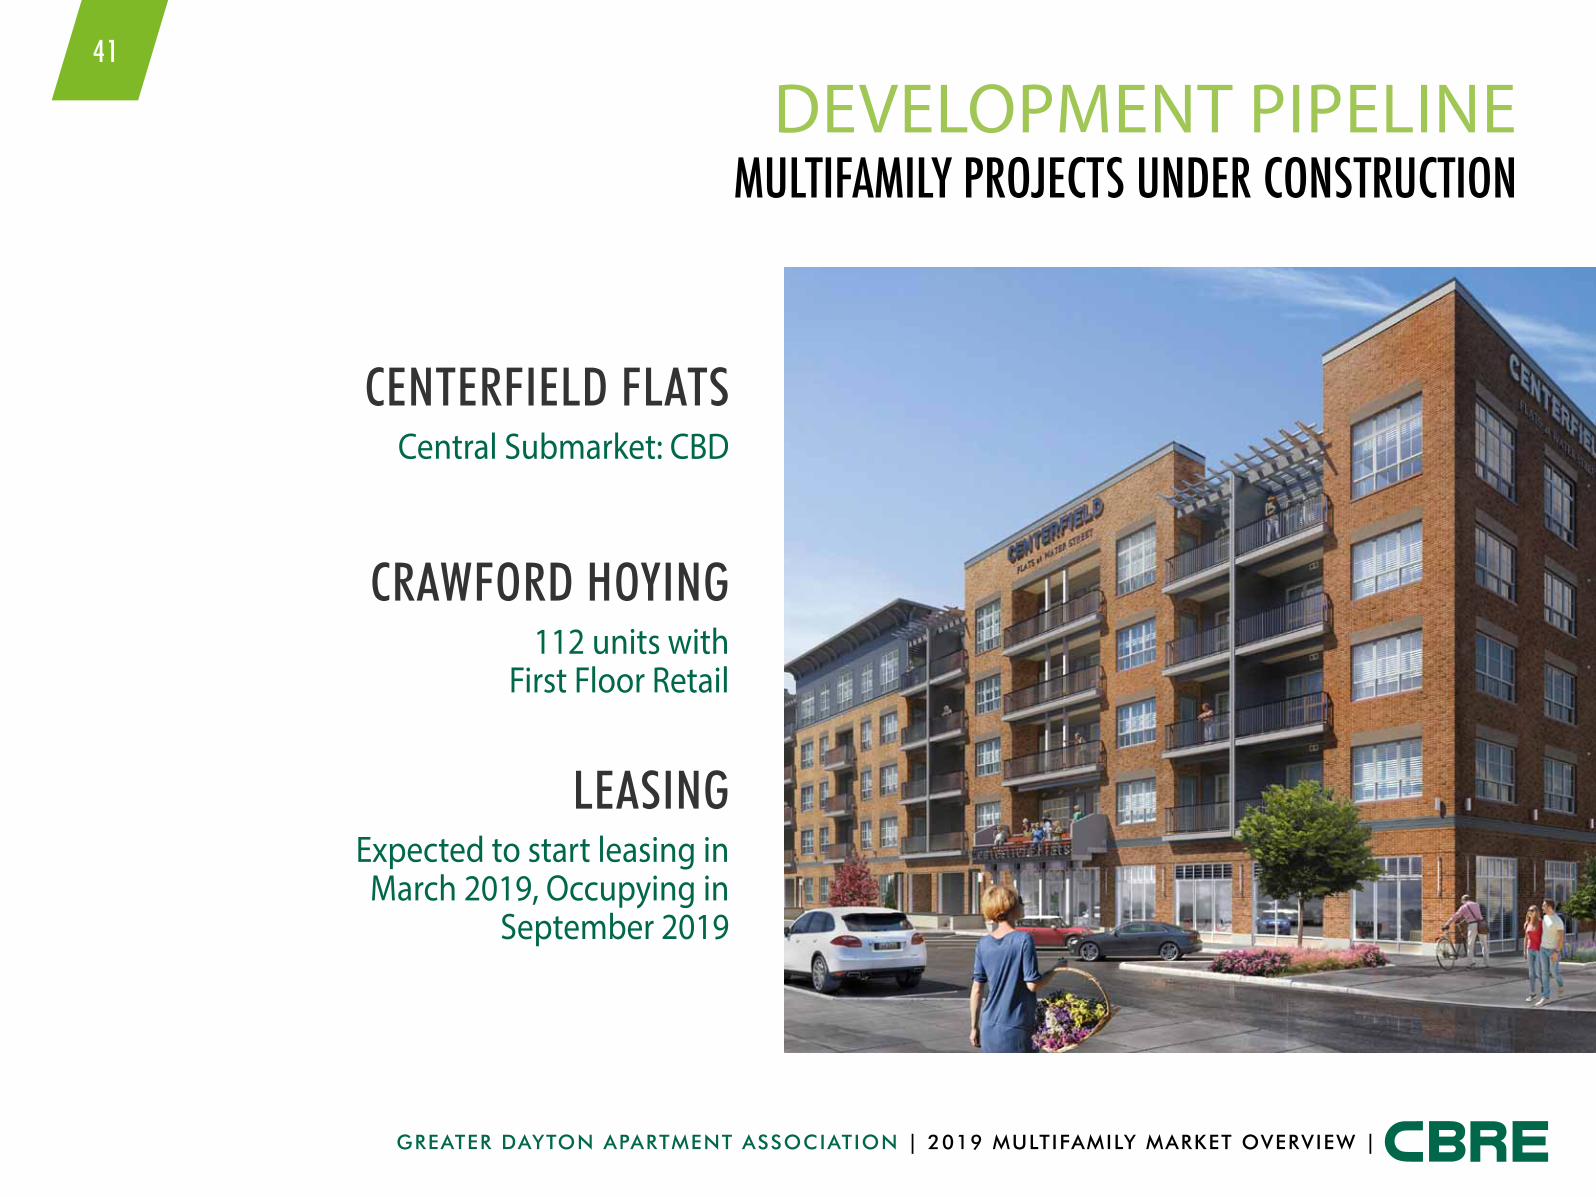
DEvELOPMENT PIPELINE mUltifamily proJectS UnDer conStrUction
CENTERfIELD fLATSCentral Submarket: CBD
CRAWfORD HOYING112 units with
First Floor Retail
LEASINGExpected to start leasing in
March 2019, Occupying in September 2019

06 2019 forecast
greater dayton apartment association | 2019 multiFamily marKet oVerView |

greater dayton apartment association | 2019 multiFamily marKet oVerView |
43
2019 APARTMENT MARKETkurt shoemaker’s forecast
•Rents up by 1.5%• Cap rates compress
even further•Development pipeline
will slow •fundamentals will
remain solid
•Overall rents will slow to 2%• CBD rents and occupancies will have
growing pains with new product•Development pipeline will be very thin•fundamentals will continue to
remain solid•Sales Volume will decrease •Opportunity Zone to replace Value Add
as most used brokerage term
2018 recap 2019 forecaSt

greater dayton apartment association | 2019 multiFamily marKet oVerView |
4 4
Dave lockarD, ccimSenior Vice President+1 513 369 [email protected]
emily cantleySr. Capital Mkts Ops Analyst+1 513 369 [email protected]
kUrt Shoemakerfirst Vice President+1 513 369 [email protected]
To download today’s presentation: www.cbre.com/invcmmultifamily
CBRE TEAMcentral miDweSt mUltifamily |
cincinnati team memBerS
katlyn GeiGerCapital Mkts Ops Analyst+1 513 369 [email protected]