multigenomic tests for tailoring local therapy: ready for
TRANSCRIPT

Multigenomic Tests for Tailoring Local Therapy: Ready for Prime Time?
Monica Morrow MDChief, Breast Surgery Service
Anne Burnett Windfohr Chair of Clinical OncologyMemorial Sloan Kettering Cancer Center
2nd Vienna Breast Surgery DayMedical University of Vienna
Vienna, Austria
17 March 2015

No conflicts of interest to disclose

ER+ HER2+ ER,PR,HER2-
Endocrine rx > 0.5 - 1.0 cm > 0.5 - 1.0 cm
High-risk features CTX + HER2 blockade CTXN+, High Oncotype Dx
CTX ER status
2015
Evolving Treatment Paradigms in Breast Cancer

Tumor Burden in Local TherapyDecision Making
1980s present
Larger
Tumor Burden
Smaller
BCSMastectomy
Tumor Burden Tumor Burden
PMRT None ConventionalWBRT
HypofracAPBI
Larger Smaller Larger Smaller

Potential Roles for Multigenomic Tests in Local Therapy
• Selection for BCT vs Mastectomy• Use of RT
After BCSPMRT

Genetic Signature for Local Recurrence
165 Patients
109 No LR 10yrs 56 LR
111 Gene Classifier
Kreike B, Clin Ca Res 2009;15:4181
Variation in grade, margins, boost, systemic therapy between groups

LR After BCT by Gene Classifier
Kreike B, Clin Ca Res 2009;15:4181
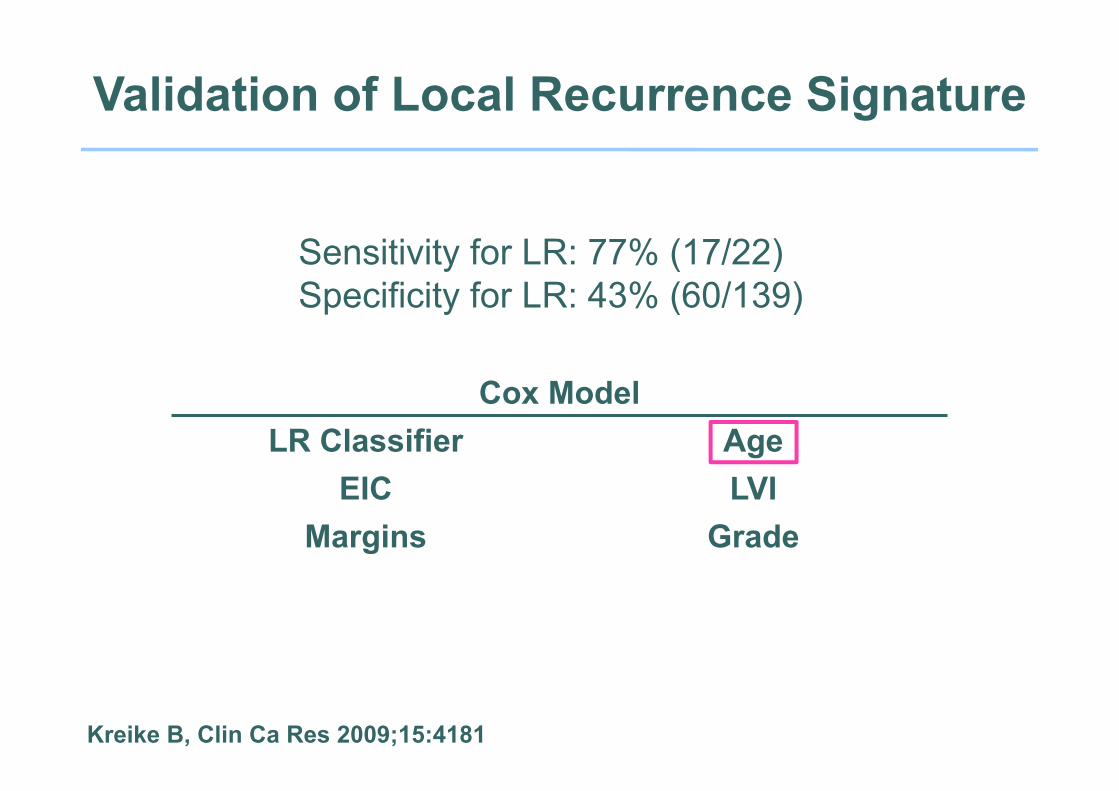
Validation of Local Recurrence Signature
Kreike B, Clin Ca Res 2009;15:4181
Sensitivity for LR: 77% (17/22)Specificity for LR: 43% (60/139)
Cox Model LR Classifier Age
EIC LVIMargins Grade

Signature Author Sensitivity Specificity70 gene Van’t Veer 2002 59% 64%76 gene Wang 2005 68% 53%Wound response Chang 2005 75% 41%Hypoxia Chi 2006 57% 28%Radioresistance Khodarev 2004 52% 54%Chromosomal instability Carter 2006 68% 57%Proliferation Whitfield 2006 59% 63%LR after BCT Nimeus-Malmstrom 2008 55% 42%
Predictive Value of Genomic Classifiers of LR
Kreike B, Clin Ca Res 2009;15:4181

Genomic Tests for Selection of BCT vs Mastectomy
• None sensitive or specific enough for clinical use to identify population at high risk of LR after BCT
• Uncertain if high risk signature for BCT is also high risk after mastectomy

Paik S, J Clin Oncol 2006;24:3726
NSABP B-20 Distant RFS by Recurrence Score
All pts, p=.02 Low risk, p=.61
Inter risk, p=.39High risk, p<.001
651
134
353
164

Mamounas EP, J Clin Oncol 2010;26:1677
LRR and Recurrence ScorePlacebo
n = 355

Impact of Tailored Systemic Rx on LRR
Mamounas EP, J Clin Oncol 2010;26:1677
0 2 4 6 8 10
010
2030
40
Time in Years
4.3
7.2
15.8P<0.0001
Rat
e of
LR
R%
RS < 18
RS >31RS 18-30
0 2 4 6 8 100
1020
3040
Time in Years
1.62.7
7.8
P=0.028
Rat
e of
LR
R%
RS < 18
RS >31RS 18-30Tamoxifen Tamoxifen
+ Chemo
NSABP B14 NSABP B20n = 895 n = 424

Mamounas EP, J Clin Oncol 2010;26:1677
MVA of Predictors of 10yr LRR in Tam Treated Women

Mamounas EP, J Clin Oncol 2010;26:1677
10 Year LRR by Age, Recurrence Score, and Surgery

Recurrence Score and LRRECOG 2197
Solin LJ, Breast Cancer Res Treat 2012;134:683
n = 219p = 0.12

Does Recurrence Score Predict LRR?
• ECOG 2197 underpowered compared to NSABP dataset
• In general, risk of LR parallels risk of distant disease, and multiple datasets show that Recurrence Score predicts risk of distant disease
• ECOG 2197 used AC or AT chemotherapy. NSABP B20 CMF or MF
Prognostic value of RS may be lost/diminished with modern systemic rx and lower rates of LR

How Does RS Aid in Local Therapy Decision Making?
• Not at all!• Identifies low and high risk populations for studies
of less or more therapy
Is there a role for genomic tests in selecting patients for RT?

Do We Need Another Expensive Test?
Benefit of RT after BCS• 15% of N- women• 21% of N+ women
• Multiple randomized trials have failed to identify a subset not benefitting from RT using standard clinical/pathologic predictors
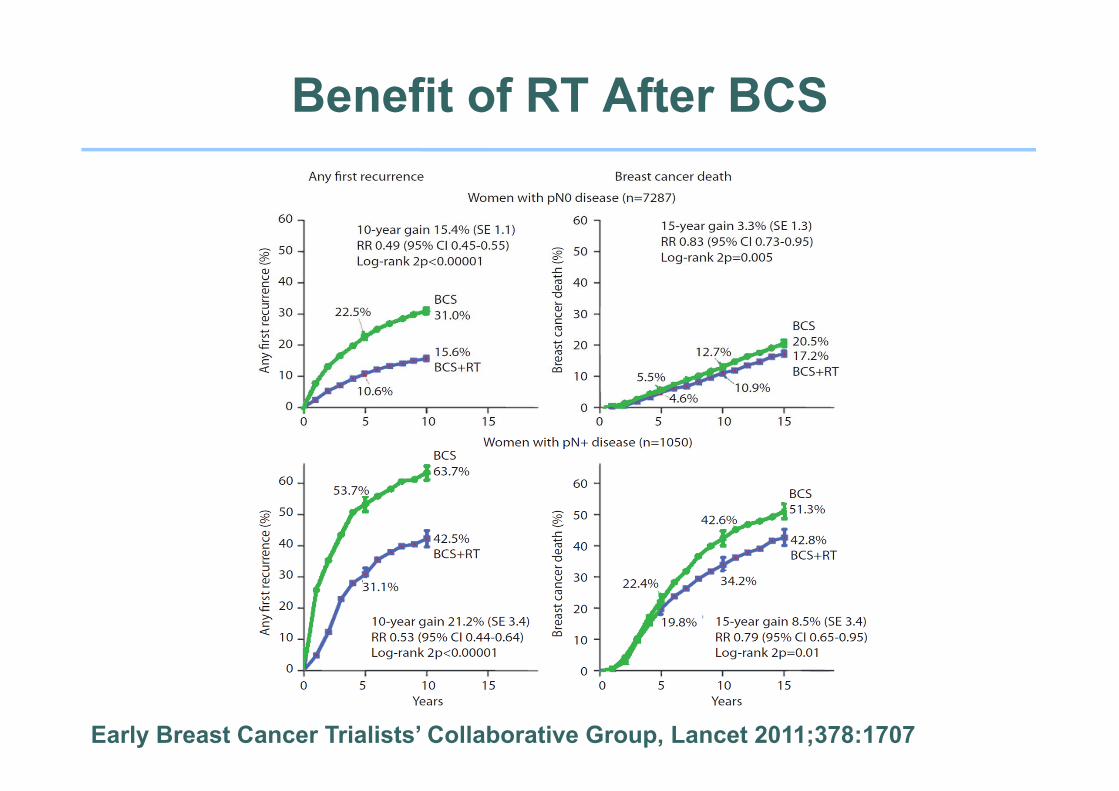
Benefit of RT After BCS
Early Breast Cancer Trialists’ Collaborative Group, Lancet 2011;378:1707

Does Comprehensive Nodal RTImprove Survival?
MA.20 EORTC 22922-10925# patients 1832 4004Interval 5yr 10yr∆ DFS 5.4% p = .002 3.0% p = .044∆ OS 1.6% p = .07 1.6% p = .056
Whelan T, Proc ASCO 2011 Poortmans P, ESMO 2013

Cheng SH, J Clin Oncol 2006;24:4594
Genomic Predictors of LRR After Mastectomy
• 94 patients 1990-2001• No PMRT• Free of LRR at 3 years n=67• Any LRR n=27• Split into training + validation sets
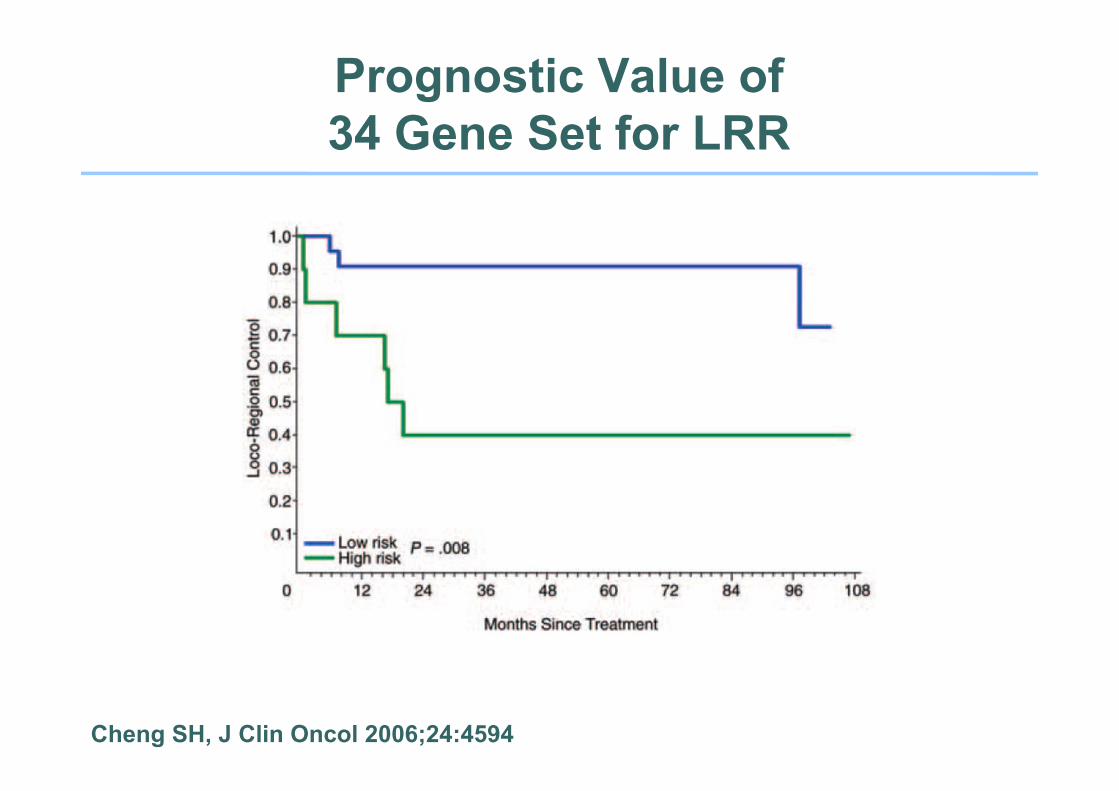
Prognostic Value of 34 Gene Set for LRR
Cheng SH, J Clin Oncol 2006;24:4594

Cheng SH, J Clin Oncol 2006;24:4594
Genomic Predictors of LRRCox Model

Cumulative Incidence of LRR byRS Risk Groups in N+ Patients
0 2 4 6 8 10
0.0
0.1
0.2
0.3
0.4
0.5
Time in Years
Cum
ulat
ive
Inci
denc
e R
ate
P-value < .001
RS LowRS IntermediateRS High
N LRR Events386 16364 25315 39
Mamounas E et al, SSO 2013
3.3%7.2%12.3%
NSABP B28 No PMRT

LRR in Patients with Mastectomy
P-value = 0.64
RS LowRS IntermediateRS High
0 2 4 6 8 10
0.0
0.1
0.2
0.3
0.4
0.5
Time in Years
Cum
ulat
ive
Inci
denc
e R
ate N LRR Events
137 5132 5117 7
RS LowRS IntermediateRS High
N LRR Events75 566 677 18
P-value = 0.006
0 2 4 6 8 10
0.0
0.1
0.2
0.3
0.4
0.5
Time in Years
23.6%
9.6%5.5%
1-3 Positive Nodes(N = 386)
≥ 4 Positive Nodes(N = 218)
Mamounas E et al, SSO 2013
4.1%2.4%
6.0%
No PMRT

Gene Profile for Benefit of PMRTDanish Breast Cancer Group 82bc
Gene Profile
Training Set n=191 LRR n=53Median age 55yrs
72% ER+25% HER2+51% 1-3+ nodes
100% > 7 nodes dissected
Tramm T, Clin Can Res 2014;20:5272

Tramm T, Clin Can Res 2014;20:5272
Prognostic Value LRR SignatureNo RT

Tramm T, Clin Can Res 2014;20:5272
Predictive ValueLRR Signature
High Risk
Low Risk

Tramm T, Clin Can Res 2014;20:5272
Predictive ValueLRR Signature: Validation Set
High Risk
Low Risk
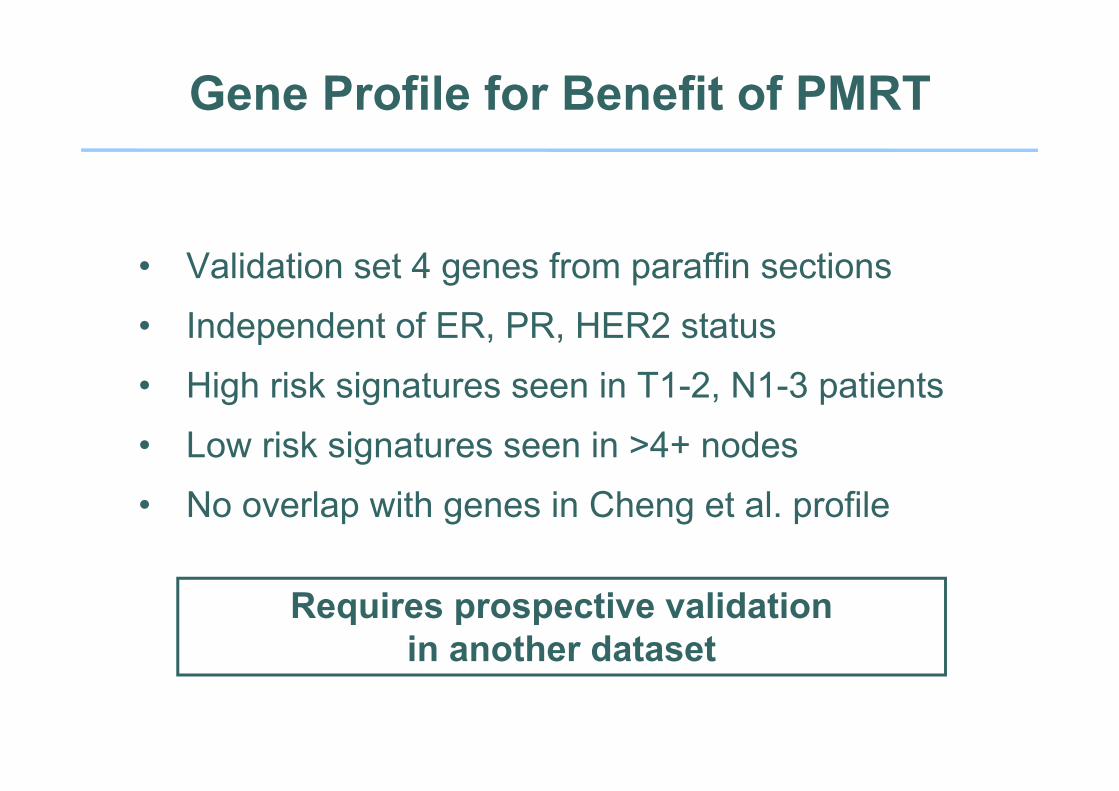
Gene Profile for Benefit of PMRT
• Validation set 4 genes from paraffin sections• Independent of ER, PR, HER2 status• High risk signatures seen in T1-2, N1-3 patients• Low risk signatures seen in >4+ nodes• No overlap with genes in Cheng et al. profile
Requires prospective validationin another dataset

Metaanalysis Trials of Excision ± RT in DCIS
No RT RT p-valueTotal 28.1% 12.9% < .001Invasive 15.4% 6.8% < .001DCIS 14.9% 6.5% < .001
n = 372910 yr IBTR
EBCTCG JNCI Monograph 2010;41:162

Metaanalysis Trials of Excision ± RT in DCIS
10yr Survival Outcomes
No RT RT p-valueAll deaths 8.2 8.4 > .1Death w/o recurrence 5.7 5.4 > .1Cardiac death 1.3 1.5 > .1
EBCTCG JNCI Monograph 2010;41:162

DCIS Score
Solin LJ, JNCI 2013;105:701

Patient CharacteristicsE5194
Premenopausal 24%T > 1cm 20.5%
Margin ≥ 5mm 65%High Grade 34%
ER+ 97%
n=327* No RT
*670 enrolled, 327 blocks available

Risk of Any Breast Event by DCIS Score
Solin LJ, JNCI 2013;105:701

Risk of Invasive Breast Event by DCIS Score
Solin LJ, JNCI 2013;105:701

Factors Associated With IBTR: Cox Model
Multivariable Analysis of Significant Clinical and Pathologic Factors, Including the DCIS Score
Menopausal statusPremenopausal 1.00 (referent)Postmenopausal 0.49 (0.27 to 0.90)
Tumor size 1.52 (1.11 to 2.01)DCIS Score 2.37 (1.14 to 4.76)
Solin LJ, JNCI 2013;105:701

Ontario Cohort: Patient and Sample Disposition for Primary Analysis
Tissue provided to GHIn=828
(with central pathology review)
Final evaluable populationn=571
(BCS alone and negative margins)
257 Histology and lab exclusionsNo tumor: 10Invasive carcinoma: 4Insufficient RNA: 68qPCR Sample Quality: 28Positive margins: 147
Histologically proven DCIS with BCSalone and clinically eligible
n=1,658
Rakovitch E, SABCS 2014

Age ≥ 50 years 459 (81%)Nuclear Grade
Low 55 (10%)Intermediate 332 (58%)High 184 (32%)
Comedo Necrosis 350 (61%)Solid Subtype 358 (63%)Tumor Size
≤ 10mm 150 (26%)> 10mm 140 (25%)Missing 281 (49%)
Multifocality* 114 (20%)ER+ by RT-PCR 541 (95%)
Patient CharacteristicsOntario Cohort (n=571)*Presence of at least 2 foci of DCIS in the same quadrant at least 5 mm apart
*Presence of at least 2 foci of DCIS in the same quadrant at least 5mm apart
Rakovitch E, SABCS 2014

Kaplan-Meier 10yr Risk of Local Recurrence by DCIS Score Risk Group
Loca
l Rec
urre
nce
Ris
k (%
)
Years
33.0%27.8%
12.7%
Rakovitch E, SABCS 2014
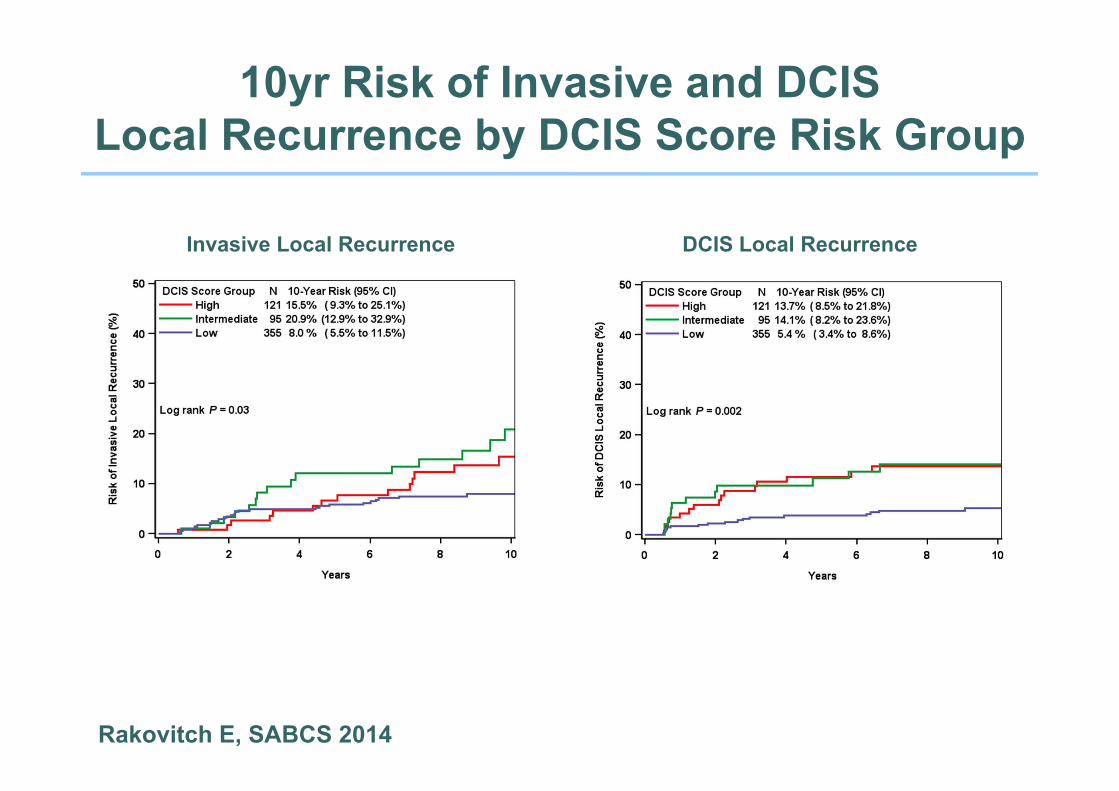
10yr Risk of Invasive and DCISLocal Recurrence by DCIS Score Risk Group
Invasive Local Recurrence DCIS Local Recurrence
Rakovitch E, SABCS 2014

Factors Associated With Local Recurrence: Multivariable Analysis
Characteristic N HR (95% CI) P-valueDCIS Score /50 571 1.68 (1.08, 2.62) 0.02Age at diagnosis (yr) 0.03
<50 110 1.75 (1.07, 2.76)≥50 459 1.0
Tumor size 0.01>10mm 140 2.07 (1.15, 3.83)≤10mm 150 1.0
Subtype 0.04Solid 358 1.63 (0.97, 2.88)Cribriform 175 1.0
Multifocality* 0.003Present 114 1.97 (1.27, 3.02)Absent 457 1.0
Rakovitch E, SABCS 2014
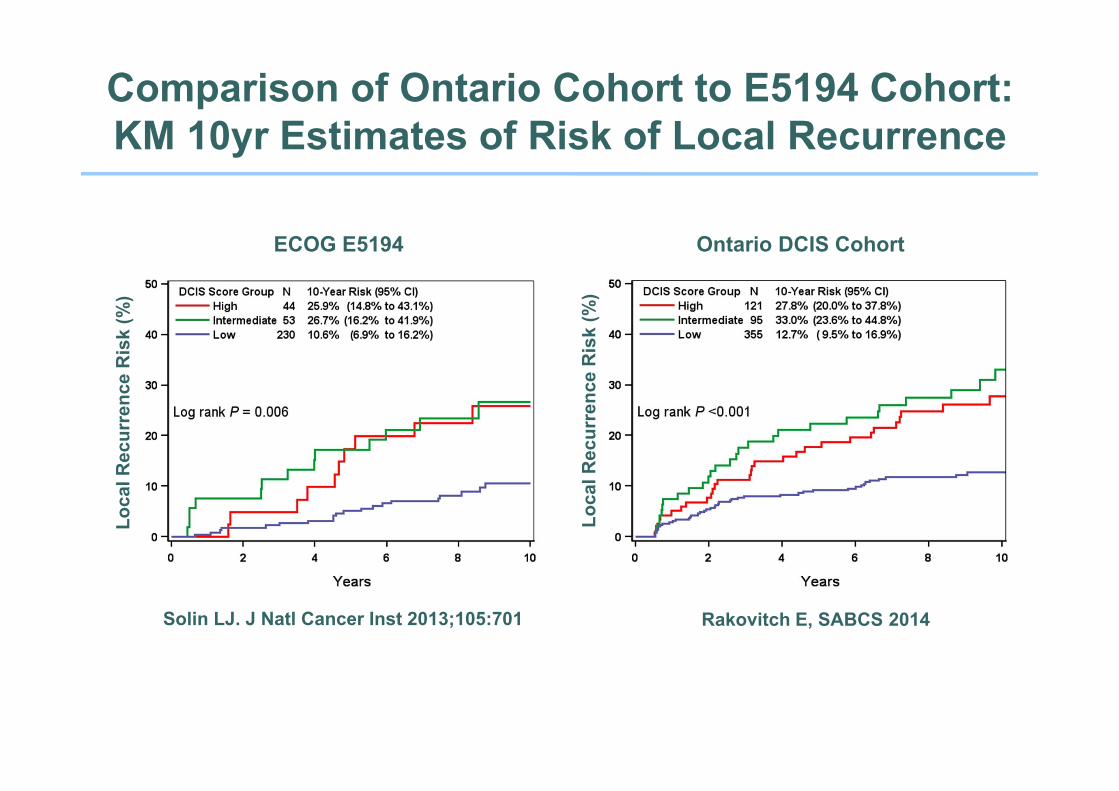
Comparison of Ontario Cohort to E5194 Cohort: KM 10yr Estimates of Risk of Local Recurrence
ECOG E5194 Ontario DCIS Cohort
Loca
l Rec
urre
nce
Ris
k (%
)
Loca
l Rec
urre
nce
Ris
k (%
)Solin LJ. J Natl Cancer Inst 2013;105:701 Rakovitch E, SABCS 2014

1Solin LJ. J Natl Cancer Inst 2013;105:701 2Rakovitch E, SABCS 2014
121 (21.2%)
355 (62.2%)95 (16.6%)
44 (13.5%)
53 (16.2%)230 (70.3%)
46
LR Risk 10.7%LR Risk 26.7%
LR Risk 25.9%
LR Risk 12.7%LR Risk 33%
LR Risk 27.8%
Is the DCIS Score Clinically Useful?

Is the DCIS Score Clinically Useful?
• We do not know if a high score predicts the benefit of RT
• Risk averse women with DCIS are increasingly choosing bilateral mastectomy
Will they be willing to forego RT based on DCIS score?

Conclusions
• Multigenomic assays offer the potential to tailor the extent of surgery and RT based on biology
• Initial data on risk of LRR after mastectomy, benefit of PMRT most promising
Requires validation in other datasets, clinical trials
• DCIS score provides information that when used in conjunction with traditional clinical and pathologic features may identify a subset with a low risk of LR in the absence of RT