multilevel and multiscale drought reanalysis over france
TRANSCRIPT

HAL Id: hal-00506547https://hal.archives-ouvertes.fr/hal-00506547
Submitted on 28 Jul 2010
HAL is a multi-disciplinary open accessarchive for the deposit and dissemination of sci-entific research documents, whether they are pub-lished or not. The documents may come fromteaching and research institutions in France orabroad, or from public or private research centers.
L’archive ouverte pluridisciplinaire HAL, estdestinée au dépôt et à la diffusion de documentsscientifiques de niveau recherche, publiés ou non,émanant des établissements d’enseignement et derecherche français ou étrangers, des laboratoirespublics ou privés.
Multilevel and multiscale drought reanalysis over Francewith the Safran-Isba-Modcou hydrometeorological suite
Jean-Philippe Vidal, E. Martin, L. Franchistéguy, Florence Habets,Jean-Michel Soubeyroux, M. Blanchard, M. Baillon
To cite this version:Jean-Philippe Vidal, E. Martin, L. Franchistéguy, Florence Habets, Jean-Michel Soubeyroux, et al..Multilevel and multiscale drought reanalysis over France with the Safran-Isba-Modcou hydrometeoro-logical suite. Hydrology and Earth System Sciences Discussions, European Geosciences Union, 2010,14 (3), pp.459-478. �10.5194/hess-14-459-2010�. �hal-00506547�

Hydrol. Earth Syst. Sci., 14, 459–478, 2010www.hydrol-earth-syst-sci.net/14/459/2010/© Author(s) 2010. This work is distributed underthe Creative Commons Attribution 3.0 License.
Hydrology andEarth System
Sciences
Multilevel and multiscale drought reanalysis over France with theSafran-Isba-Modcou hydrometeorological suite
J.-P. Vidal1,2, E. Martin 1, L. Franchisteguy3, F. Habets4, J.-M. Soubeyroux3, M. Blanchard3, and M. Baillon3
1CNRM/GAME, Meteo-France and CNRS, URA 1357, 42 avenue Coriolis, 31057 Toulouse Cedex 1, France2Cemagref, UR HHLY, 3 bis quai Chauveau – CP 220, 69336 Lyon, France3Meteo-France, Direction de la Climatologie, 42 avenue Coriolis, 31057 Toulouse Cedex 1, France4UMR-SISYPHE, Mines-ParisTech, Centre de Geosciences,equipe SHR, 35 rue St Honore, 77305 Fontainebleau, France
Received: 5 October 2009 – Published in Hydrol. Earth Syst. Sci. Discuss.: 22 October 2009Revised: 2 March 2010 – Accepted: 2 March 2010 – Published: 9 March 2010
Abstract. Physically-based droughts can be defined as a wa-ter deficit in at least one component of the land surface hy-drological cycle. The reliance of different activity domains(water supply, irrigation, hydropower, etc.) on specific com-ponents of this cycle requires drought monitoring to be basedon indices related to meteorological, agricultural, and hydro-logical droughts. This paper describes a high-resolution ret-rospective analysis of such droughts in France over the lastfifty years, based on the Safran-Isba-Modcou (SIM) hydrom-eteorological suite. The high-resolution 1958–2008 Safranatmospheric reanalysis was used to force the Isba land sur-face scheme and the hydrogeological model Modcou. Me-teorological droughts are characterized with the Standard-ized Precipitation Index (SPI) at time scales varying from 1to 24 months. Similar standardizing methods were appliedto soil moisture and streamflow for identifying multiscaleagricultural droughts – through the Standardized Soil Wet-ness Index (SSWI) – and multiscale hydrological droughts,through the Standardized Flow Index (SFI). Based on a com-mon threshold level for all indices, drought event statisticsover the 50-yr period – number of events, duration, sever-ity and magnitude – have been derived locally in order tohighlight regional differences at multiple time scales and atmultiple levels of the hydrological cycle (precipitation, soilmoisture, streamflow). Results show a substantial variety oftemporal drought patterns over the country that are highlydependent on both the variable and time scale considered.Independent spatio-temporal drought events have then beenidentified and described by combining local characteristicswith the evolution of area under drought. Summary statistics
Correspondence to: J.-P. Vidal([email protected])
have finally been used to compare past severe drought events,from multi-year precipitation deficits (1989–1990) to shorthot and dry periods (2003). Results show that the ranking ofdrought events depends highly on both the time scale and thevariable considered. This multilevel and multiscale droughtclimatology will serve as a basis for assessing the impacts ofclimate change on droughts in France.
1 Introduction
Severe drought events occurred in Europe over the last fewdecades and they had extensive socio-economic impacts (Eu-ropean Commission, 2007). In France, the cost of suchevents has been estimated at 500 million euros each year onaverage since 1989, and up to 2.5 billion euros for 2003 only(Buisson, 2007). Droughts can have economic impacts onwater supply, industry, energy, agriculture, navigation, butalso social and environmental impacts. Numerous sectorsare potentially affected through water deficits in differentcomponents of the land surface hydrological cycle: fillingof high-elevation reservoirs mainly depends on precipitation,agriculture is directly related to soil moisture, and drinkablewater supply relies on streamflows and aquifers. Differenttypes of physical droughts can therefore be defined depend-ing on the hydrological variable considered. Three typeshave for example been defined by Wilhite and Glantz (1985):meteorological drought, agricultural drought and hydrologi-cal drought. The propagation of a drought event through thehydrological cycle should thus be assessed through the eval-uation of water deficits at those three levels. Also, dependingon the socio-economic sector considered, water deficits willhave impacts over different time scales, so characterizing
Published by Copernicus Publications on behalf of the European Geosciences Union.

460 J.-P. Vidal et al.: Multilevel and multiscale drought reanalysis over France
a drought in a comprehensive way would require the analysisof multiple time scales as proposed by McKee et al. (1995).Finally, the area affected by a drought – the spatial dimen-sion – is essential for regional water management (see forexample Vicente-Serrano, 2006).
The aim of this paper is to characterize droughts in Franceover the last 50 yrs along the three dimensions noted above:(1) levels of the hydrological cycle (precipitation, soil mois-ture, streamflow), (2) time scale and (3) spatial scale. Manystudies have attempted to tackle separately the issues as-sociated with these three dimensions. The US NationalDrought Mitigation Center for example provides an estimateof drought severity based on a subjective multi-index clas-sification scheme, which includes indices of all three typesof droughts (Svoboda et al., 2002). Besides, some indiceslike the Standardized Precipitation Index (SPI, McKee et al.,1993) allow the consideration of different time scales forassessing meteorological droughts. The spatial consistencyoffered by some indices was furthermore used for spatialdrought assessment in Europe at the meteorological level(Lloyd-Hughes and Saunders, 2002), at the agricultural level(Dutra et al., 2008) and at the hydrological level (Stahl, 2001;Zaidman et al., 2002).
However, very few large-scale assessments of the spatio-temporal development of droughts have been made jointlyfor different components of the hydrological cycle. Withinthe ARIDE (Assessment of the Regional Impact of Droughtsin Europe) European project, Hisdal and Tallaksen (2003)carried out a regional assessment of meteorological and hy-drological droughts in Denmark. More recently, Lloyd-Hughes et al. (2009a) derived two drought catalogues over22 European regions (Stahl and Demuth, 1999; Prudhommeand Sauquet, 2007): one describes meteorological droughtsusing a regional version of the SPI, and the other describeshydrological droughts with the Regional Deficiency Index(RDI, Stahl, 2001) computed from observed streamflows. Atthe catchment scale, Tallaksen et al. (2009) studied droughtpropagation through the hydrological cycle by evaluating wa-ter deficits in precipitation, groundwater recharge, hydraulichead and discharge in a groundwater fed catchment locatedin England.
In addition, few studies considered different time scales,and most of them focused on meteorological droughts andwere based on the SPI (see for example Loukas and Vasil-iades, 2004; Vicente-Serrano and Lopez-Moreno, 2005).A notable exception is the study by Andreadis et al. (2005)which assessed historical US agricultural and hydrologicaldroughts at different time scales by using percentiles of soilmoisture and runoff computed with the VIC macroscale hy-drological model (Liang et al., 1994). Sheffield et al. (2009)extended this multiple time-scale assessment of soil moisturedroughts at the global scale.
This paper proposes an approach for jointly and consis-tently characterizing meteorological, agricultural and hydro-logical droughts at different time scales over France. This
research is part of the CLIM SEC project that aims at as-sessing the impact of climate change on droughts in France(Vidal and Moisselin, 2008; Vidal and Soubeyroux, 2008).Drought identification and characterization over the last 50 yris based on precipitation, soil moisture and streamflow out-puts from the Safran-Isba-Modcou (SIM) hydrometerolog-ical suite, and makes use of drought indices inspired fromSPI computation procedures.
Section 2 introduces the SIM hydrometeorological reanal-ysis and describes drought indices and procedures applied toidentify spatially and temporally independent drought events.Section 3 first provides an overview of dry periods experi-enced in France between 1958 and 2008, and Sect. 4 pro-vides examples of drought propagation through the hydro-logical cycle. Characteristics of severe drought events arethen explored at the local scale (Sect. 5) in order to answerfour fundamental questions about such events:
– How often do they occur?
– When do they start?
– How long do they last?
– How severe are they?
Spatio-temporal drought events are then identified and com-pared at the national scale in order to extract benchmarkevents over the last 50 yr (Sect. 6). Results are finally dis-cussed in Sect. 7.
2 Data and methods
This section first presents the Safran-Isba-Modcou (SIM) hy-drometeorological suite and then details the drought indicesdeveloped in this study and their use to identify droughtevents.
2.1 Safran-Isba-Modcou
The SIM suite and its validation over France are described indetail by Habets et al. (2008). Its components are thus brieflydescribed in the paragraphs below.
Safran is an atmospheric analysis system that computesvertical profiles of the atmosphere for climatically homo-geneous zones, by combining large-scale fields and groundobservations through Optimal Interpolation (Gandin, 1965).The algorithm, its validation and its application over Franceare detailed by Quintana-Seguı et al. (2008). Vidal et al.(2010) have applied Safran over the period 1958–2008 toconstitute a 50-yr high-resolution atmospheric reanalysisover France. Safran hourly outputs of liquid and solid precip-itation, air temperature, specific humidity, wind speed, visi-ble and infrared radiations are interpolated on a 8-km reg-ular grid to provide atmospheric forcings for land surfaceschemes. A detailed validation of this 50-yr atmospheric
Hydrol. Earth Syst. Sci., 14, 459–478, 2010 www.hydrol-earth-syst-sci.net/14/459/2010/

J.-P. Vidal et al.: Multilevel and multiscale drought reanalysis over France 461
reanalysis over France has been carried out by Vidal et al.(2010). Of particular interest to this study, they found thatthe reanalysis uncertainty on precipitation is both very lowand relatively constant over the 50-yr period when consider-ing both dependent and independent data. The 50-yr averagemonthly bias with respect to 83 high-quality validation sta-tions is slightly positive (+1 mm), with an interannual stan-dard deviation of 2.7 mm.
The land surface scheme Isba computes water and energybudgets at the soil-vegetation-atmosphere interface (Noilhanand Mahfouf, 1996). This scheme is used in Meteo-Francenumerical weather prediction and climate models. The con-figuration of this highly modular scheme is the same as theone used by Habets et al. (2008). Isba is based on a three-layer force-restore (i.e. forcing with short time scales at thesurface and restore towards deep soil values evolving moreslowly with time) model and explicit multilayer snow modeland it includes subgrid runoff and drainage schemes. Soiland vegetation parameters are derived from the Ecoclimapdatabase (Masson et al., 2003). Isba has here been run overFrance from 1 August 1958 to 31 July 2008 with forcingsfrom Safran atmospheric reanalysis. Snowpack, soil temper-ature and soil moisture values have been initialized using a 2-yr spin-up (first year repeated three times). One output rel-evant for the present study is the Soil Wetness Index (SWI)defined as:
SWI=wtot−wwilt
wfc −wwilt(1)
wherewtot is the volumetric water content of the simulatedsoil column,wfc the water content at field capacity andwwiltthe water content at wilting point. Soil moisture productsfrom Isba have been extensively validated against in situmeasurements (Habets et al., 1999; Paris Anguela et al.,2008) as well as various satellite products (Baghdadi et al.,2007; Albergel et al., 2008; Rudiger et al., 2009).
Modcou is a distributed hydrogeological model that com-putes the evolution of multi-layered aquifers and surfaceflows (Ledoux et al., 1989). Modcou uses drainage andrunoff values simulated by Isba to compute the daily evo-lution of the three-layer Seine aquifer and the single-layerRhone aquifer, as well as 3-hourly river flows for 907 hydro-metric stations in France plus 256 sea outlets. A steady stateof aquifers has been computed to provide the initial conditionfor the 50-yr run forced by Isba outputs. Hydrological out-puts of the SIM suite have been validated against observedriver flows and water table levels over a 10-yr period by Ha-bets et al. (2008). They found in particular that simulatedversus observed discharge ratios are very close to 1 for largebasins, with spatial scales corresponding to that of droughtevents.
Figure 1 shows some characteristics of Isba and Mod-cou models that are useful for interpreting spatial results ofdrought characteristics: soil properties (defined only by per-centage of clay and sand, see Noilhan and Lacarrere, 1995),
Percentage of clay
0
10
20
30
40
50
Percentage of sand
0
20
40
60
80
100
Simulated aquifers
River network
OligoceneEoceneChalkAlluvium
Rivers
Modelled discharge locations
Fig. 1. Characteristics of Isba and Modcou. From top to bottom:percentage of clay in Isba soil column, percentage of sand, extent ofaquifers explicitly simulated by Modcou and Modcou river networkand output cells.
www.hydrol-earth-syst-sci.net/14/459/2010/ Hydrol. Earth Syst. Sci., 14, 459–478, 2010

462 J.-P. Vidal et al.: Multilevel and multiscale drought reanalysis over France
Table 1. Correspondence between SIM variables and drought typesdefined by Wilhite and Glantz (1985).
Variable Drought type
Safran Precipitation MeteorologicalIsba Soil Wetness Index AgriculturalModcou Streamflow Hydrological
underground aquifers and surface network. Other character-istics, among them those related to vegetation, can be foundin Habets et al. (2008).
2.2 Drought indices
Three variables among all SIM outputs are considered here:total precipitation from Safran, SWI from Isba and stream-flow from Modcou. These variables, aggregated to themonthly scale, are used to evaluate the three types of physicaldroughts, as summarized in Table 1.
2.2.1 Review of standardized indices
The approach used here is inspired from the computationof the Standardized Precipitation Index. The procedure forcomputing SPI from a given precipitation time series requiresfitting the cumulative precipitation overn month(s) to a givenstatistical distribution. This fitting is done separately for eachending month in order to take account of seasonal differencesin distributions (McKee et al., 1993). Fitted cumulative dis-tributions are then equiprobably transformed into a standardnormal distribution. This correspondence is finally used totransform cumulative precipitation time series to SPI timeseries.
The SPI has been used to provide a spatial assessmentof historical meteorological droughts in various parts of Eu-rope: Catalonia region in Spain (Lana et al., 2001), IberianPeninsula (Vicente-Serrano, 2006), Basilicata region in Italy(Piccarreta et al., 2004), Thessaly region in Greece (Loukasand Vasiliades, 2004), the Czech Republic (Trnka et al.,2009), both Sicily and the Elbe basin in Germany (Bordiet al. , 2004), and the whole of Europe at relatively coarseresolution (Lloyd-Hughes and Saunders, 2002). No national-scale high-resolution assessment has been made on past me-teorological droughts in France, whether with SPI or otherdrought indices.
The SPI computation procedure has been recently appliedto runoff time series for a basin in California (Shukla andWood, 2008) and to streamflow time series for the Tagusriver in the Iberian Peninsula (Lopez-Moreno et al., 2009).Related normalization procedures have also been applied forderiving agricultural droughts based on monthly quantilesof modelled soil moisture. Based on a 50-yr retrospectivehydrological simulation of the land surface budget of the
Table 2. Summary of drought indices, corresponding computationdomain and time scales considered.
Index Domain Time scale(months)
SPI 8602 grid cells 1–24SSWI 8602 grid cells 1–24SFI 1163 locations 1–24
continental USA with the VIC model (Maurer et al., 2002),Sheffield et al. (2004) and Andreadis et al. (2005) used per-centiles of simulated soil moisture and runoff for identify-ing dry periods and characterize agricultural and hydrolog-ical drought events. A similar methodology was applied atthe global scale by Sheffield and Wood (2007) for assessingpast agricultural drought events.
This normalization approach provide indices relative to amean baseline (hydro-)climate. It is therefore different fromapproaches generating indices with absolute values (e.g.,streamflow deficits in m3), like the threshold level approachdescribed by Hisdal et al. (2004) for hydrological droughts.
2.2.2 Approach
In this paper, we applied a SPI-like computation procedureto total precipitation, soil moisture and streamflow simulatedby the SIM hydrometeorological suite to derive three types ofindices: the Standardized Precipitation Index (SPI) itself, theStandardized Soil Wetness Index (SSWI) and the Standard-ized Flow Index (SFI). Table 2 summarizes the computationdomain of each type of index and the time scales consideredfor computation. SSWI has thus for example been computedfor 8602 grid cells covering France, from time series of SWIaveraged over periods of 1 to 24 months.
A critical step in the procedure is the fitting to a given sta-tistical distribution of monthly variables. Based on a 0.5◦
gridded dataset, Lloyd-Hughes and Saunders (2002) foundgamma distributions suitable for the larger part of Europe.However, the Pearson Type III distribution recommended byGuttman (1999) has been found more appropriate over someparts of the Iberian Peninsula (Vicente-Serrano, 2006). Sta-tistical distributions chosen for modelling monthly soil mois-ture are even more varied in the literature: beta distributionsbased onL-moments (Sheffield et al., 2004; Sheffield andWood, 2007), empirical distributions (Andreadis et al., 2005;Wang et al., 2009), gaussian distributions for soil moistureanomalies (Mo, 2008), etc. As for monthly runoff, Shuklaand Wood (2008) recommended a great care when choos-ing among the potentially suitable distributions after havingtested different theoretical distributions (gamma, log-normal,etc.). As a matter of fact, choosing a poorly adapted distri-bution may lead to large discrepancies in estimating extremepercentiles and thus corresponding drought index values.
Hydrol. Earth Syst. Sci., 14, 459–478, 2010 www.hydrol-earth-syst-sci.net/14/459/2010/

J.-P. Vidal et al.: Multilevel and multiscale drought reanalysis over France 463
In this study, the dimensions of the problem (24 timescales×12 calendar months for each grid cell/station) pre-vented one to find the most appropriate type of theoreti-cal distribution for each time series. Moreover, the shapeof soil moisture distribution is highly variable dependingon climate and soil characteristics and can be bimodal,which expresses preferential states of seasonal soil moisture(Rodriguez-Iturbe et al., 1991; D’Odorico et al., 2000). Thismay yield to large uncertainties in fitting monthly distribu-tions to unimodal theoretical distributions. The choice wastherefore made here to apply a flexible nonparametric ap-proach. Empirical distributions were thus fitted with ker-nel density estimates with gaussian kernel (Wilks, 2006, p.35). This approach enables generating continuous distribu-tions close to the empirical ones, which are reasonably welldefined thanks to the 50-yr sample size. Moreover, featureslike bimodal and bounded distributions of SWI can be read-ily handled. For precipitation and streamflow, kernel densi-ties were estimated with a zero lower bound, and for the SWIthey were estimated within an interval defined with Eq. (1)by wtot = 0 andwtot = wsat, wherewsat is the soil water con-tent at saturation.
2.3 Drought event identification and description
The procedure described above helped generating space-timefields of drought index values, for each drought type and eachtime scale considered. An overview of these fields is pre-sented in Sects. 3 and 4. The next step in drought charac-terization consisted in identifying drought events. The para-graphs below describe the approach used for determining thecharacteristics of these events at both the local and the na-tional scales, the results of which are presented in Sects. 5and 6.
2.3.1 Local scale
At the local scale, i.e. for a drought index time series overa grid cell or location, the procedure adopted corresponds tothe one proposed initially by McKee et al. (1993): a droughtevent is defined as a period in which the index is continu-ously negative and it reaches a given threshold. In order toidentify only the most severe events while keeping a reason-able number of events, the threshold for identifying local-scale drought events is taken as≃−0.84, which correspondsto a probability of occurrence of 20% in the standard nor-mal distribution, which is by construction the distribution intime of any drought index (SPI, SSWI, SFI) for a given loca-tion. A similar threshold value has been chosen by Andreadiset al. (2005) in their analysis of US soil moisture and stream-flow droughts and by Wang et al. (2009) in the multimodelreconstruction of US soil moisture droughts, following mon-itoring practice of the US Climate Prediction Center. A moreextreme threshold (≃−1.64) corresponding a 5% probability
will also be used in Sect. 3 for emphasizing very dry periodsin a synthetic representation.
Figure 2 shows an example of local-scale characteristicsof drought events: theduration of an event is the number ofmonths where the index is continuously negative; itssever-ity is the absolute value of the minimum reached during theevent; and themagnitude of the event is the absolute value ofthe sum of index values during the event. Additional infor-mation on the timing of an event can also be extracted fromthe index time series, and we here focused on thestartingmonth of the drought.
Computing drought event characteristics for each outputlocation allows assessing the regional differences in droughtcharacteristics, as done by Soule (1992) in the USA withPalmer (1965) indices. The results of this regional assess-ment for SPI, SSWI and SFI at different time sales are givenin Sect. 5.
2.3.2 National scale
Droughts develop in both space and time, and SPI and SSWIfields computed here allow to take account of the areal di-mension of the event, and its evolution with time. A droughtevent is here considered as a sequence of spatially contigu-ous and temporally continuous areas where the index is un-der a given threshold value. A threshold corresponding toa local 20% probability (≃−0.84) has been chosen for iden-tifying spatio-temporal drought events following Andreadiset al. (2005) and Sheffield et al. (2009). An algorithm foridentifying independent drought events – understood here asnon-overlapping in both space and time – has been imple-mented and applied to continental France (without Corsica,in order to preserve a spatial consistency of events). Thisalgorithm, modified after Andreadis et al. (2005), first iden-tifies at each time step spatial clusters of drought areas (seeSantos et al., 2000, 2002, for a description of the clusteringprocess). Small isolated areas, with less than 10 contiguouscells, i.e. 640 km2, are removed from the subsequent calcu-lations. Clusters from successive time steps are then linkedwith each other in a recursive way in order to identify merg-ing or breaking up areas as parts of the same spatio-temporalevent. Two clusters are considered to belong to the sameevent if the overlapping area between the two time steps ishigher than 100 cells (6400 km2). The drought event identi-fication algorithm has been applied to SPI and SSWI spatio-temporal fields at all time scales.
Independent events can then be compared with each otherby adding the spatial dimension to local-scale characteris-tics described in Fig. 2. Adopted summary statistics foran event include its mean duration, its mean area and itstotal magnitude. Themean duration of a spatio-temporalevent is defined as the mean duration of all cells across thecountry affected by the drought at some time(s) during theevent. The duration for each cell is taken here as the num-ber of months when the index is lower than the threshold (in
www.hydrol-earth-syst-sci.net/14/459/2010/ Hydrol. Earth Syst. Sci., 14, 459–478, 2010

464 J.-P. Vidal et al.: Multilevel and multiscale drought reanalysis over France
−2.
0−
1.5
−1.
0−
0.5
0.0
0.5
1.0
1.5
SS
WI3
1998 1999 2000 2001 2002 2003 2004 2005 2006 2007
StartDurationMagnitudeSeverity
Fig. 2. Definition of local-scale characteristics of drought events: start, duration, magnitude and severity. Example of a 10-yr evolution ofSSWI3 for a grid cell located near Toulouse (South-West France). Three severe events reach here a 5% probability threshold shown witha dashed line.
possibly separate periods). Themean area is defined as themean drought-affected area during the event, and expressedas a percentage of the total area of France. Thetotal mag-nitude is computed here as the sum over space and time ofthe index values in cells affected by the event, expressed inmonth times percent of France area. Section 6.1 presents theinter-comparison of national-scale drought events throughthese summary statistics.
The final part of the study aimed at finding benchmarkdrought events, i.e. events that led to the maximum deficitsaveraged over a given area within the last 50 yr. We herefollowed the approach of Andreadis et al. (2005) who intro-duced Severity-Area-Duration (SAD) curves to characterizespatio-temporal soil moisture and runoff drought events inthe conterminous United States. SAD curves are an adap-tation of the depth-area-duration method for design stormanalysis (WMO, 1969), and they have been used to compareglobal-scale agricultural drought events by Sheffield et al.(2009). The output for each event and each duration con-sidered is a curve showing the minimum value of the index– usually its absolute value – as a function of the area. SADcurves as computed by Andreadis et al. (2005) suffer how-ever from an artificial reduction in severity with long dura-tions (time scales) and resulting from the time-averaging ofindex values coming from a single one-month-average indexfield. We here modified this approach by taking advantage ofthe fields computed at different time scales to draw Severity-Area-Time Scale (SAT) curves. In this way, the relationshipbetween the area and the mean severity can be directly com-pared across different time scales for each event. The use ofSAT curves for the definition of benchmark drought eventswill be presented in Sect. 6.2.
3 Overview of dry periods
France experienced a number of dry periods within the last50 yrs that have been listed and documented mainly at themeteorological level (see for example Besleaga, 1992) orthrough their impacts on human activities (Le Roy Ladurie,2009). Figure 3 provides an overview of such periods byplotting the area affected by meteorological, agricultural andhydrological drought in France when considering 3-monthand 12-month indices. A very low probability threshold(≃−1.64, i.e. 5% probability) is here considered in order toemphasize very dry periods.
This synthetic representation with a low threshold levelemphasizes periods with both severe and widespread deficitsacross the country like 1976 or the three consecutive years1988–1990. The different levels of the hydrological cycle ex-hibit correlated but different drought patterns at the 3-monthstime scale: soil moisture deficits are generally less extensiveor less severe (with reduced peaks) than corresponding pre-cipitation deficits, and periods with streamflow deficits ap-pear to combine characteristics from both precipitation andsoil moisture deficits. When looking at 12-month deficits,various differences can be spotted as a consequence of thelarger time scale integration: first, many peaks disappear atall levels, like in 1978 or 1985; dry periods last longer or areshifted in time with respect to corresponding periods iden-tified with 3-month indices; the 1998–1990 period exhibitsmuch larger deficits than with 3-month indices.
All these observations highlight the differences in dry pe-riod characteristics obtained when using indices based onvarious hydrological variables and with different time scales.It thus emphasizes the need to consider different variablesover different time scales in order to completely characterizea drought. The remainder of this article will therefore show
Hydrol. Earth Syst. Sci., 14, 459–478, 2010 www.hydrol-earth-syst-sci.net/14/459/2010/

J.-P. Vidal et al.: Multilevel and multiscale drought reanalysis over France 465
SP
I
020
4060
8010
0
SS
WI
020
4060
8010
00
2040
6080
100
SF
I
1959 1961 1963 1965 1967 1969 1971 1973 1975 1977 1979 1981 1983 1985 1987 1989 1991 1993 1995 1997 1999 2001 2003 2005 20071959 1961 1963 1965 1967 1969 1971 1973 1975 1977 1979 1981 1983 1985 1987 1989 1991 1993 1995 1997 1999 2001 2003 2005 2007
3−month12−month
Fig. 3. Area affected by drought as a percentage of France area (SPI and SSWI) or percentage of hydrometric stations (SFI) with 3-monthand 12-month indices under a threshold of 5%.
results for all three drought indices and at time scales of 3,6 and 12 months, except in the next section where only the3-month time scale will be considered.
4 Examples of drought propagation through thehydrological cycle
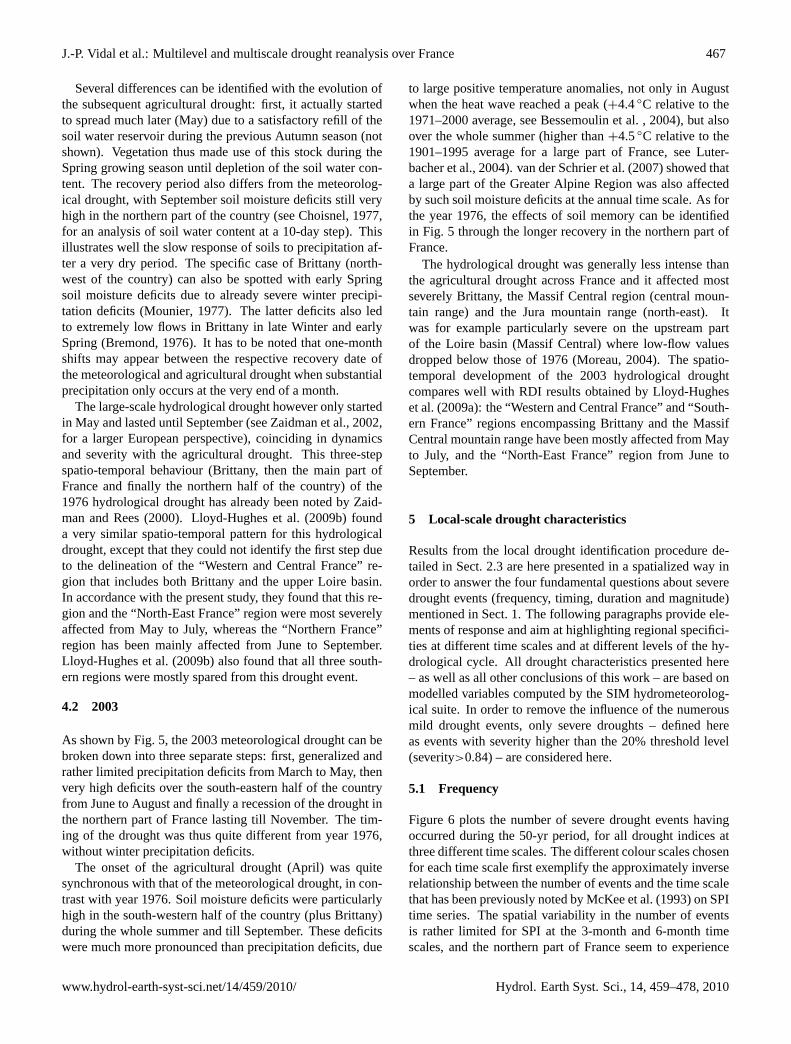
Figures 4 and 5 show two contrasted examples of droughtpropagation through the land surface hydrological cycle fortwo dry 12-month periods: November 1975 to October1976 and February 2003 to January 2004. Both figures usea colour scale associated with the original SPI classificationproposed by McKee et al. (1993) and recalled in Table 3.The time scale chosen for illustrating drought propagationfeatures is 3 months.
The spatio-temporal development of hydrologicaldroughts will be here qualitatively compared with resultsobtained by Lloyd-Hughes et al. (2009b) and Hannafordet al. (2009) with the Regional Deficiency Index (RDI) over6 homogenous regions defined by Prudhomme and Sauquet(2007): Northern France, North-East France, Western andCentral France, Pyrenees, Southern France, and FrenchSouthern Alps. The RDI, described in detail by Stahl (2001),is based on binary deficiency index time series (over orunder a given threshold that varies with the day of the year)computed from observed streamflow time series at eachstation within a region. The proportion of hydrometricstations experiencing a drought gives the RDI for this region.Such a comparison is specially relevant as it brings together
Table 3. Drought classification by index value (McKee et al., 1993).
Index value Drought category
0 to−0.99 Mild−1 to−1.49 Moderate−1.5 to−1.99 Severe−2 or less Extreme
drought assessments derived from observed streamflow(RDI) and from streamflow computed by Modcou (SFI).Moreover, assessing SFI results against an independenthydrological drought index enables to identify possiblediscrepancies resulting from the way drought propagationthrough the whole hydrological cycle is modelled with theSIM hydrometeorological suite.
4.1 1976
Figure 4 shows that the 1976 meteorological drought actuallystarted in December 1975, with relatively high precipitationdeficits until April 1976. It reached a peak in May-June-Julybefore a rather quick recovery in August (for the southernhalf of the country) and September (Brochet, 1976). It hasto be noted that the Mediterranean region has been spared bythese precipitation deficits throughout the whole period, andin particular in summer (see Briffa et al., 1994, for summer-averaged PDSI maps over the period 1891–1991).
www.hydrol-earth-syst-sci.net/14/459/2010/ Hydrol. Earth Syst. Sci., 14, 459–478, 2010

466 J.-P. Vidal et al.: Multilevel and multiscale drought reanalysis over France
Fig. 4. Evolution of 1976 drought with 3-month indices, fromNovember 1975 to October 1976. Colour key match classes definedin Table 3.
Fig. 5. As for Fig. 4 but for 2003 drought, from February 2003 toJanuary 2004.
Hydrol. Earth Syst. Sci., 14, 459–478, 2010 www.hydrol-earth-syst-sci.net/14/459/2010/
J.-P. Vidal et al.: Multilevel and multiscale drought reanalysis over France 467
Several differences can be identified with the evolution ofthe subsequent agricultural drought: first, it actually startedto spread much later (May) due to a satisfactory refill of thesoil water reservoir during the previous Autumn season (notshown). Vegetation thus made use of this stock during theSpring growing season until depletion of the soil water con-tent. The recovery period also differs from the meteorolog-ical drought, with September soil moisture deficits still veryhigh in the northern part of the country (see Choisnel, 1977,for an analysis of soil water content at a 10-day step). Thisillustrates well the slow response of soils to precipitation af-ter a very dry period. The specific case of Brittany (north-west of the country) can also be spotted with early Springsoil moisture deficits due to already severe winter precipi-tation deficits (Mounier, 1977). The latter deficits also ledto extremely low flows in Brittany in late Winter and earlySpring (Bremond, 1976). It has to be noted that one-monthshifts may appear between the respective recovery date ofthe meteorological and agricultural drought when substantialprecipitation only occurs at the very end of a month.
The large-scale hydrological drought however only startedin May and lasted until September (see Zaidman et al., 2002,for a larger European perspective), coinciding in dynamicsand severity with the agricultural drought. This three-stepspatio-temporal behaviour (Brittany, then the main part ofFrance and finally the northern half of the country) of the1976 hydrological drought has already been noted by Zaid-man and Rees (2000). Lloyd-Hughes et al. (2009b) founda very similar spatio-temporal pattern for this hydrologicaldrought, except that they could not identify the first step dueto the delineation of the “Western and Central France” re-gion that includes both Brittany and the upper Loire basin.In accordance with the present study, they found that this re-gion and the “North-East France” region were most severelyaffected from May to July, whereas the “Northern France”region has been mainly affected from June to September.Lloyd-Hughes et al. (2009b) also found that all three south-ern regions were mostly spared from this drought event.
4.2 2003
As shown by Fig. 5, the 2003 meteorological drought can bebroken down into three separate steps: first, generalized andrather limited precipitation deficits from March to May, thenvery high deficits over the south-eastern half of the countryfrom June to August and finally a recession of the drought inthe northern part of France lasting till November. The tim-ing of the drought was thus quite different from year 1976,without winter precipitation deficits.
The onset of the agricultural drought (April) was quitesynchronous with that of the meteorological drought, in con-trast with year 1976. Soil moisture deficits were particularlyhigh in the south-western half of the country (plus Brittany)during the whole summer and till September. These deficitswere much more pronounced than precipitation deficits, due
to large positive temperature anomalies, not only in Augustwhen the heat wave reached a peak (+4.4◦C relative to the1971–2000 average, see Bessemoulin et al. , 2004), but alsoover the whole summer (higher than+4.5◦C relative to the1901–1995 average for a large part of France, see Luter-bacher et al., 2004). van der Schrier et al. (2007) showed thata large part of the Greater Alpine Region was also affectedby such soil moisture deficits at the annual time scale. As forthe year 1976, the effects of soil memory can be identifiedin Fig. 5 through the longer recovery in the northern part ofFrance.
The hydrological drought was generally less intense thanthe agricultural drought across France and it affected mostseverely Brittany, the Massif Central region (central moun-tain range) and the Jura mountain range (north-east). Itwas for example particularly severe on the upstream partof the Loire basin (Massif Central) where low-flow valuesdropped below those of 1976 (Moreau, 2004). The spatio-temporal development of the 2003 hydrological droughtcompares well with RDI results obtained by Lloyd-Hugheset al. (2009a): the “Western and Central France” and “South-ern France” regions encompassing Brittany and the MassifCentral mountain range have been mostly affected from Mayto July, and the “North-East France” region from June toSeptember.
5 Local-scale drought characteristics
Results from the local drought identification procedure de-tailed in Sect. 2.3 are here presented in a spatialized way inorder to answer the four fundamental questions about severedrought events (frequency, timing, duration and magnitude)mentioned in Sect. 1. The following paragraphs provide ele-ments of response and aim at highlighting regional specifici-ties at different time scales and at different levels of the hy-drological cycle. All drought characteristics presented here– as well as all other conclusions of this work – are based onmodelled variables computed by the SIM hydrometeorolog-ical suite. In order to remove the influence of the numerousmild drought events, only severe droughts – defined hereas events with severity higher than the 20% threshold level(severity>0.84) – are considered here.
5.1 Frequency
Figure 6 plots the number of severe drought events havingoccurred during the 50-yr period, for all drought indices atthree different time scales. The different colour scales chosenfor each time scale first exemplify the approximately inverserelationship between the number of events and the time scalethat has been previously noted by McKee et al. (1993) on SPItime series. The spatial variability in the number of eventsis rather limited for SPI at the 3-month and 6-month timescales, and the northern part of France seem to experience
www.hydrol-earth-syst-sci.net/14/459/2010/ Hydrol. Earth Syst. Sci., 14, 459–478, 2010

468 J.-P. Vidal et al.: Multilevel and multiscale drought reanalysis over France
SPI3
0
10
20
30
40
50
SPI6
0
5
10
15
20
25
30
SPI12
0
2
4
6
8
10
12
14
16
18
SSWI3
0
10
20
30
40
50
SSWI6
0
5
10
15
20
25
30
SSWI12
0
2
4
6
8
10
12
14
16
18
SFI3
0
10
20
30
40
50
SFI6
0
5
10
15
20
25
30
SFI12
0
2
4
6
8
10
12
14
16
18
Fig. 6. Number of severe drought events, defined as events with severity above the 20% threshold. From left to right, time scales of 3, 6, and12 months. From top to bottom, different indices: SPI, SSWI and SFI. Note the different colour scales for each time scale. The light yellowcolour has been attributed to 30, 15 and 7.5 for time scales of 3, 6 and 12 months.
less events than the rest of the country at the 12-month timescale. Regional specificities clearly appear with SSWI andSFI as a result of the variability in soil properties and/or ge-ological characteristics shown in Fig. 1. The general patternthat can be identified on SSWI maps is a larger number ofevents in areas with sandy soils with a low percentage of clay.In such areas, drainage processes are very fast and soil mois-ture evolution thus follows that of precipitation with a re-duced buffering effect. There are clearly exceptions to thispattern, and differences resulting from different vegetationcover over similarly sandy soils can be spotted: Sologne area(center), with cultures and broadleaf forest and Landes area(south-west), with coniferous forest (see Habets et al., 2008,for a map of vegetation types over France). A more detailedanalysis would be needed to connect those soil moisture pat-terns with soil and vegetation characteristics. The long mem-ory of streamflow to meteorological conditions in catchmentswith a high permeability and large aquifers like the Seinebasin (north of France) is shown through a very low numberof hydrological drought events compared to other regions.This regional feature of drought event frequency matchesquite well with specific clusters in natural flow regime clas-sifications based on monthly runoff (Sauquet et al., 2008) ora range of hydrological indices (Snelder et al., 2009).
5.2 Timing
Figure 7 provides an indication of the timing of droughtevents by identifying the season when the highest numberof events start to develop. It also shows if this number issignificantly higher – at a 95% confidence level – than the1 in 4 probability, which represents a random occurrence ofthe starting time of the events throughout the year. The sta-tistical test uses the Wilson confidence interval for binomialproportion as recommended by Brown et al. (2001). Such anapproach thus hides situations when there is more than oneseason when the number is significantly higher than expectedby chance.
Meteorological drought events appear to occur randomlythroughout the year with 3-month and 6-month time scales,but at the 12-month scale, some areas show a statisticallyhigh number of events starting in winter in the north-west ofthe country, and in autumn in the south-east.
3-month soil moisture droughts tend to start in spring overthe major part of the country, and in winter in the north-eastern mountain ranges (Vosges and Jura). At the 6-monthtime scale, a significantly high proportion of events startsin autumn in the western part of the country and thus cor-responds to summer soil moisture deficits. An interesting
Hydrol. Earth Syst. Sci., 14, 459–478, 2010 www.hydrol-earth-syst-sci.net/14/459/2010/

J.-P. Vidal et al.: Multilevel and multiscale drought reanalysis over France 469
SPI3 SPI6 SPI12
DJF
MAM
JJA
SON
SSWI3 SSWI6 SSWI12
DJF
MAM
JJA
SON
SFI3 SFI6 SFI12
DJF
MAM
JJA
SON
Fig. 7. Most frequent starting season for severe drought events, defined as events with severity above the 20% threshold. From left to right,time scales of 3, 6, and 12 months. From top to bottom, different indices: SPI, SSWI and SFI. Vivid colors indicate cells/stations where theproportion of events starting in the season considered is significantly higher than the 1 in 4 probability. See text for details.
feature is the apparent lack of 6-month agricultural droughtsstarting in Winter or Summer, suggesting the existence oftwo seasonal modes for this type of droughts. The distri-bution of the most frequent starting season is much more di-vided among the four seasons at the 12-month time scale, butwith significant proportions only for autumn in regions likethe Landes area (south-west), the Rhone valley, the Cevennesarea and the Cotentin peninsula (north-west).
3-month streamflow droughts show a significantly highproportion in autumn in some parts of the Seine Basin,the coastal Mediterranean and Atlantic catchments and thedownstream Garonne river. The major part of the country –with the exception of the Alps and Pyrenees mountain rangeswhere snow melting processes are important – show a signif-icantly high proportion of drought events starting in autumnat the 6-month time scale, that is deficits starting over the ex-tended summer season. The picture is quite different at the12-month time scale: a large part of the country show a sig-nificantly high proportion of streamflow droughts starting inwinter. One interesting feature is the statistical significanceof the occurrence of summer-starting events in the northernAlps, which shows that the influence of snowmelt deficitsextends over a one-year time scale.
5.3 Mean duration
Figure 8 plots the mean duration of severe drought eventsover France and has to be related to the number of eventsshown in Fig. 6. Both characteristics are closely linked asthe underlying variable is highly auto-correlated and fol-lows a centered normal distribution, generating a negativerelationship between duration and frequency of peak-under-threshold periods.
The spatial variability of the duration of meteorologicaldroughts appears to be limited compared to that of agricul-tural and hydrological droughts, with the north of the countryshowing slightly longer events of precipitation deficit thanthe south. Local discrepancies that can be observed resultfrom the low number of events used for computing the meanduration (see Fig. 6).
At all time scales, the mean duration of soil moisturedroughts appears to be longer than that of precipitationdroughts, due to the buffering effect of the soil mentionedearlier. The north of the country shows durations longer thanthree times the time scale considered.
The main feature shown by hydrological droughts is thelarge values of mean duration within the Seine basin due to
www.hydrol-earth-syst-sci.net/14/459/2010/ Hydrol. Earth Syst. Sci., 14, 459–478, 2010

470 J.-P. Vidal et al.: Multilevel and multiscale drought reanalysis over France
SPI3
5
10
15
20
25
30
35
40
SPI6
10
20
30
40
50
60
SPI12
20
30
40
50
60
70
80
90
100
SSWI3
5
10
15
20
25
30
35
40
SSWI6
10
20
30
40
50
60
SSWI12
20
30
40
50
60
70
80
90
100
SFI3
5
10
15
20
25
30
35
40
SFI6
10
20
30
40
50
60
SFI12
20
30
40
50
60
70
80
90
100
Fig. 8. Mean duration (in months) of severe drought events, defined as events with severity above the 20% threshold. From left to right, timescales of 3, 6, and 12 months. From top to bottom, different indices: SPI, SSWI and SFI. Note the different colour scales for each time scale.The light yellow colour has been attributed to three times the time scale considered.
the presence of vast aquifers. The remainder of the coun-try tends to show shorter mean duration than for agriculturaldroughts.
5.4 Mean magnitude
Figure 9 plots the mean magnitude of severe drought events,with the same colour scale for all variable/time scale combi-nations. The magnitude integrates both the severity and theduration of the event considered and thus summarizes its po-tential impact. Figure 9 first shows an increase in mean mag-nitude with the time scale, as a consequence of the increasein mean duration shown in Fig. 8.
No clear regional pattern emerges for 3-month and 6-month meteorological droughts, but 12-month droughts ap-pear to be of higher magnitude in the northern half of thecountry, once again due to the longer mean duration shownin Fig. 8.
The magnitude pattern of both soil moisture and stream-flow droughts is also closely linked to that of their mean du-ration. This link results from the quasi-linear relationshipbetween duration and magnitude when severe events are con-sidered (see McKee et al., 1993).
6 National-scale drought characteristics
This section attempts to provide a national-scale view ofdroughts by identifying and comparing severe drought eventsthat occurred during the 1958–2008 period. Only griddeddrought indices (SPI and SSWI) that allow to take account ofthe areal dimension of the event are here considered. At thescales of 3, 6, and 12 months, a number of, respectively 77,65 and 55 meteorological events have been identified (77, 66and 51 agricultural events).
6.1 Inter-comparison of events
Spatio-temporal event summary statistics described inSect.2.3.2 are compared in Fig. 10 at different time scales. Itshows relationships between mean area, mean duration andtotal magnitude for all drought events identified during the50-yr period. Meteorological and agricultural drought eventsare examined at the time scales of 3, 6 and 12 months. Thegeneral feature in Fig. 10 is an increase (resp. decrease) indrought mean duration (resp. mean area) with increasingtime scale, due to the intrinsic properties of the standardizedindices. Agricultural droughts also tend to last longer thanmeteorological droughts, which has been already noted at thelocal scale (see Fig. 8).
Hydrol. Earth Syst. Sci., 14, 459–478, 2010 www.hydrol-earth-syst-sci.net/14/459/2010/

J.-P. Vidal et al.: Multilevel and multiscale drought reanalysis over France 471
SPI3
10
20
30
40
50
60
70
80
SPI6
10
20
30
40
50
60
70
80
SPI12
10
20
30
40
50
60
70
80
SSWI3
10
20
30
40
50
60
70
80
SSWI6
10
20
30
40
50
60
70
80
SSWI12
10
20
30
40
50
60
70
80
SFI3
10
20
30
40
50
60
70
80
SFI6
10
20
30
40
50
60
70
80
SFI12
10
20
30
40
50
60
70
80
Fig. 9. Mean magnitude (in months) of severe drought events, defined as events with severity above the 20% threshold. From left to right,time scales of 3, 6, and 12 months. From top to bottom, different indices: SPI, SSWI and SFI. The colour scale is the same throughout theplots, with the light yellow color attributed to a value of 24 months.
Figure 10 also highlights 6 major events for which sum-mary characteristics can be tracked across time scales anddrought types. The 1976 drought (in red) described in Sect. 4appears to be exceptional at short time scales in terms of pre-cipitation deficits, but less exceptional when considering soilmoisture deficits and/or long time scales. Similar observa-tions can be made for the Autumn 1978 drought, in purple(seeBellocq, 1979, for a meteorological account) and for theAutumn 1985 drought, in brown (Lariviere, 1985).
The 2003 drought (in orange) do not appear to be excep-tional in terms of precipitation deficits, but reaches the sec-ond or even first place in terms of magnitude of soil mois-ture deficits over the 50-yr period. This can be explained bythe remarkable duration of this sustained agricultural event,which includes three or four peaks from 2003 to 2006/2008,visible on Fig. 3 at the 12-month time scale. A similar featurecan be noted for the 1971–1972 winter drought event whichincorporates at long time scales the Winter/Spring deficits ofprevious and following years. Such observations highlightthe significance of two parameters in the spatio-temporaldrought identification algorithm: the drought threshold level,but also the minimum overlapping area between two timesteps.
Finally, the 1989–1990 drought appears to be the mostsevere event over the last 50 yrs in terms of soil moisturedeficits and in terms of long time-scale precipitation deficits.Its duration is particularly noteworthy compared to otherevents, with a dry phase between July 1989 to January 1990following an already very dry 1988–1989 Winter (Merillonand Chaperon, 1990) and preceding other deficit periods in1990 (see Fig. 3).
6.2 Identification of benchmark events
The Severity-Area-Time Scale analysis (see Sect. 2.3.2) ofthe events described above led to the building of curvesshowing the highest mean severity over a given area regis-tered during each event, and for time scales varying from1 month to 24 months. For each time scale, the envelopecurve of all single-event curves was drawn and the most se-vere events that composed this curve were identified. Fig-ure 11 shows the output of this process and identifies theevents during which the highest mean severity over a givenarea – within the 50-yr period – was reached, at all timescales.
The five events described in the previous section can berecognized in Fig. 11 with colours similar as in Fig. 10:the 1976 drought appears to be the prevalent benchmark
www.hydrol-earth-syst-sci.net/14/459/2010/ Hydrol. Earth Syst. Sci., 14, 459–478, 2010

472 J.-P. Vidal et al.: Multilevel and multiscale drought reanalysis over France
SPI3
510
1520
25
Mean area (%) Mean area (%)
Mea
n du
ratio
n (m
onth
s)M
ean
dura
tion
(mon
ths)
Mea
n du
ratio
n (m
onth
s)
Sep 1971 − Mar 1972Nov 1975 − Oct 1976Aug 1978 − Jan 1979Aug 1985 − Dec 1985Jun 1989 − Mar 1990Mar 2003 − Nov 2003
350020001000500200
SSWI3
Mean area (%) Mean area (%)
Mea
n du
ratio
n (m
onth
s)M
ean
dura
tion
(mon
ths)
Mea
n du
ratio
n (m
onth
s)
Sep 1971 − May 1972Jan 1976 − Oct 1976Oct 1978 − May 1979Sep 1985 − Mar 1986Oct 1988 − Dec 1990Mar 2003 − Oct 2004
SPI6
510
1520
25
Mean area (%) Mean area (%)
Mea
n du
ratio
n (m
onth
s)M
ean
dura
tion
(mon
ths)
Mea
n du
ratio
n (m
onth
s)
Jul 1970 − Nov 1973Dec 1975 − Dec 1976Sep 1978 − Feb 1979Sep 1985 − Mar 1986Oct 1988 − Dec 1990May 2003 − Dec 2003
SSWI6
Mean area (%) Mean area (%)
Mea
n du
ratio
n (m
onth
s)M
ean
dura
tion
(mon
ths)
Mea
n du
ratio
n (m
onth
s)
Feb 1971 − Aug 1972Apr 1976 − Dec 1976Nov 1978 − Aug 1979Oct 1985 − Apr 1986Nov 1988 − Feb 1991May 2003 − Jul 2008
SPI12
0 10 20 30 40 50 60 70
510
1520
25
Mean area (%) Mean area (%)
Mea
n du
ratio
n (m
onth
s)M
ean
dura
tion
(mon
ths)
Mea
n du
ratio
n (m
onth
s)
Feb 1971 − Oct 1974Mar 1975 − Apr 1977Oct 1978 − Sep 1979Sep 1985 − Mar 1986Jan 1989 − Dec 1992Jun 2003 − Jul 2004
SSWI12
0 10 20 30 40 50 60 70
Mean area (%) Mean area (%)
Mea
n du
ratio
n (m
onth
s)M
ean
dura
tion
(mon
ths)
Mea
n du
ratio
n (m
onth
s)
Mar 1971 − Oct 1974Jan 1976 − Apr 1977Nov 1978 − Dec 1979Nov 1985 − Nov 1986Jan 1989 − Mar 1993Oct 2001 − Dec 2006
Fig. 10. Relation between mean area, mean duration and total magnitude for all drought events identified with SPI (left column) and SSWI(right column), with time scales of 3, 6 and 12 months (from top to bottom) and a threshold of 20%. Disk area is proportional to totalmagnitude. The magnitude scale, in month by percent of France area, is given in top left plot. Six major drought events are identified withcolours consistent throughout the figure.
meteorological event for time scales from 3 to 15 months,while the 1989–1990 drought takes over for longer timescales as well as for time scales higher than 6 months at theagricultural level. This plot also points out the short and in-tense Autumn droughts of 1978 and 1985, as well as the 1972drought during which exceptional soil moisture deficits were
recorded in the Rhine valley (see Breda and Badeau, 2008,for an impact analysis on forests). The 2003 drought rarelyappears as a benchmark event.
Two additional events complete the panel of bench-mark events for small time scales: first, March 1961,when virtually no rainfall was observed on several French
Hydrol. Earth Syst. Sci., 14, 459–478, 2010 www.hydrol-earth-syst-sci.net/14/459/2010/

J.-P. Vidal et al.: Multilevel and multiscale drought reanalysis over France 473
0 20 40 60 80 100
SPIT
ime
scal
e (m
onth
s)1
612
1824
0 20 40 60 80 100
SSWI
Area (%)
Tim
e sc
ale
(mon
ths)
16
1218
24
1972
1976
1978
1985
1989
2003
1997
1961
Fig. 11. Identification of events with the highest mean severity over a given surface area, for time scales from 1 to 24 months. Top: meteoro-logical droughts; bottom: agricultural droughts. Events are here identified across time scales by the single year when the maximum 1-monthprecipitation deficit was reached.
regions (Direction de la Meteorologie Nationale, 1961), andthat thus constitutes the benchmark event at 1-month scalefor meteorological drought. Second, April 1997, when soilmoisture values were very low as a consequence of two verydry months during the period of recharge (Meteo-France,1997), and that is the benchmark event at 1-month scale foragricultural drought.
7 Discussion
7.1 Uncertainties
This section aims at assessing the different sources of uncer-tainties in the modelling suite that may impact the results ofthis drought reanalysis.
7.1.1 Off-line simulation
The drought reanalysis has been performed on the basis of anoff-line hydrological simulation, like the most recent high-resolution retrospective drought analyses (e.g.,Andreadiset al., 2005, for the US). Consequently, it does not take ac-count of soil-atmosphere feedbacks that can be significantduring dry periods, especially in the Mediterranean area (see,e.g., Vautard et al., 2007). Computed soil moisture values
during such periods of retroaction may thus be underesti-mated. However, the comparison made by Rudiger et al.(2009) between SWI values from Isba and in situ soil mois-ture observations at the SMOSREX experimental site (South-West France, de Rosnay et al., 2006) showed that this under-estimation remained limited even during the very hot summerof 2003.
7.1.2 Land use change
Another characteristic of this simulation – shared to the au-thors’ knowledge by all other drought reconstructing stud-ies using Land Surface Models (LSMs) – is that no land-usechange was considered during the modelled period. Overthe last 50 yrs, the effects of land-use change in France ondrought reconstruction should however be limited to small-scale zones like recently urbanized areas and should not havea significant impact on the national-scale spatio-temporalpatterns of droughts.
7.1.3 LSM configuration
A potentially significant source of uncertainty may be foundin the configuration of the LSM. Indeed, the land-surfacesimulation has been here performed with a single model
www.hydrol-earth-syst-sci.net/14/459/2010/ Hydrol. Earth Syst. Sci., 14, 459–478, 2010

474 J.-P. Vidal et al.: Multilevel and multiscale drought reanalysis over France
(Isba) and results are thus subject to the uncertainty in soilmoisture state, that has been shown to be a highly model-dependent quantity by Koster et al. (2009). The impact ofLSM configuration on soil moisture drought reconstructionhas been tested by Wang et al. (2009) over the continen-tal United States. They reconstructed historical droughtsby forcing 6 different LSMs by the same meteorologicaldataset and found substantial differences in model-derivedsoil moisture values, mainly due to different water-holdingcapacities among the different LSMs. However, they foundthat the standardization of results – in their case in termsof percentiles of model climatology – leads to compara-ble and plausible spatio-temporal patterns of soil moisturedroughts. The intercomparison made by Wang et al. (2009)as well as the good spatio-temporal agreement with hydro-logical droughts identified by Hannaford et al. (2009) fromobserved streamflow thus suggests a relatively low impact ofmodel configuration uncertainty on the present 50-yr droughtreanalysis over France.
7.1.4 Validation period
Although the Safran atmospheric reanalysis has been thor-oughly validated over the 50-yr period, the whole SIM suitehas only been compared to observed hydrological data overthe period 1995–2005 by Habets et al. (2008). Some un-certainties thus remain on how well the relevant hydrologicalvariables (soil moisture and streamflow) have been simulatedover the remaining of the period. A comprehensive valida-tion over the whole period would however prove very diffi-cult because of the lack of soil moisture data before the lasttwo decades or so, and because of the very small extent ofthe hydrometric network density before the 1970s.
7.1.5 Reservoirs
A number of large reservoirs are located in various areas ofFrance, mainly in the Alps and the Pyrenees. These reser-voirs have a significant impact on river flow regimes andare not explicitly modelled within the SIM suite. All re-lated operations, like reservoir filling during the snowmeltseason and low-flow sustaining schemes for irrigation andwater supply, may contribute to increase the discrepanciesbetween observed and modelled streamflow, as noted by Ha-bets et al. (2008). Moreover, the number of reservoirs andtheir management rules did vary over the 50-yr period, whichleads to non-stationary observed streamflow regimes. As aconsequence, SFI data may not completely represent the ac-tually observed streamflow drought conditions, but as notedabove, there is a nevertheless a good general agreement withindices derived from observed streamflow series at a ratherlarge spatial scale (Hannaford et al., 2009; Lloyd-Hugheset al., 2009b).
7.2 Drought detection parameters
This section gathers elements of discussion on the differentparameters (thresholds) of the drought detection algorithmdeveloped in this study (See Sect. 2.3).
The first parameter is the local-scale threshold on droughtindex values used to distinguish severe drought events. Thevalue adopted in this study corresponds to a commonly used20% probability, but it should really be based on thresholdsrelevant for operational water management and that wouldintegrate the vulnerability of the hydrosystem considered.
Two further area thresholds are used in the spatio-temporalidentification of drought events. The first one is the minimumcontiguous area affected by drought, and the second oneis the minimum overlapping area between two time steps.These thresholds have been given rather arbitrary values herein order to provide homogeneous results at the national scale.Consequently, they are too large for small-scale assessmentsrelevant for operational water resource management, and thefirst one at least should ideally be based on a percent areaof the catchment/water resource zone considered. Addition-ally, the independence of spatio-temporal events should ide-ally be based on considerations about the independence ofatmospheric causes, that would for example lead to identifyseveral distinct phases within a single event.
7.3 Drought seasonality
Section 5.2 provided preliminary considerations on agricul-tural and hydrological drought seasonality. Such considera-tions give insights on features worthwhile investigating fur-ther for drought preparedness purposes. The identificationof seasonality patterns in hydrological droughts would proveparticularly useful for water resources management. Thestriking correspondence between timing results on 6-monthshydrological droughts and the flow regime classification ofSnelder et al. (2009) suggests, for example, that relationshipswith flow regime descriptors (see, e.g., Olden and Poff, 2003)could be explored. These seasonality patterns are further-more linked to the local-scale threshold discussed above anda sensitivity analysis to this parameter would help to assessthe robustness of the conclusions.
8 Conclusions
This paper describes a 50-yr retrospective analysis ofdroughts in France by considering different levels of thehydrological cycle (precipitation, soil moisture and stream-flow) and different time scales (1 to 24 months). The moti-vation for this multilevel and multiscale approach originatesfrom the diversity of variables and time scales relevant inthe variety of socio-economic sectors potentially affected bya drought. This study applied standardized indices to precipi-tation, soil moisture and streamflow computed by the Safran-Isba-Modcou hydrometeorological suite. Such an approach
Hydrol. Earth Syst. Sci., 14, 459–478, 2010 www.hydrol-earth-syst-sci.net/14/459/2010/

J.-P. Vidal et al.: Multilevel and multiscale drought reanalysis over France 475
provides a consistent assessment of drought conditions bothspatially and throughout the land surface hydrological cycle.
This 50-yr drought reanalysis allowed the identificationof dry periods experienced in France and the description –through the examination of two specific events – of the waya drought propagates through the hydrological cycle. Mod-elling the complete surface water and energy budgets allowedfor example to describe agricultural drought events like 2003which were driven not only by precipitation deficits by alsoby positive temperature anomalies. A local-scale analysisof drought events identified regional specificities of droughtcharacteristics: frequency, duration, timing and magnitude.Frequency and duration results for example show that wa-ter managers should prepare to face diverse physical droughtpatterns across the country, and that these patterns are closelylinked with the climate, soil and vegetation of the catchmentconsidered. They are moreover highly dependent on boththe time scale and the variable considered. Characteristicsof individual spatio-temporal drought events were then com-pared at the national scale in order to identify benchmarkevents among those that occurred during the last 50 yrs. Theanalysis of benchmark events has been here performed at thenational scale, but it would be relevant to run it at the scaleof each catchment/water resource zone. This would providewater managers with the actual worst-case events of the last50-year over their specific zone of interest. The ranking ofdrought events, either from summary statistics or Severity-Area-Time scale curves, is also highly dependent on both thetime scale and the level of the hydrological cycle considered.
The drought characteristics identified during the 1958–2008 period will serve as a reference for the assessment ofthe impact of climate change on droughts in France. Furtherwork on the CLIM SEC project will make use of Isba-Modcouhydrological simulations forced by downscaled climate pro-jections for the 21st century in order to evaluate the poten-tial changes in drought characteristics through techniquesrecently applied to UK meteorological droughts (Vidal andWade, 2009). The land-surface modelling approach adoptedhere will allow the description of changes in drought charac-teristics driven by changes not only in precipitation but alsoin temperature.
The set of drought indices developed in this study consti-tutes a versatile tool that can be used in an operational contextfor drought monitoring. This set of indices naturally extendsthe widely used – and recently recommended by the WorldMeteorological Organization – SPI to other levels of the hy-drological cycle (soil moisture, streamflow). The use of theseindices by water managers would first require to find for theirwater resource systems the most appropriate combination be-tween the level of the hydrological cycle (precipitation, soilmoisture, streamflow) and the time scale, based on the com-parison of their expertise and experience of past events andretrospective results from the set of indices. Such an experi-mentation is currently under way with several water agenciesacross the country. In this context, it would be relevant to also
compute both SPI and SSWI at the catchment scale for a di-rect comparison with SFI. Near real-time computation of theselected index could thus help water managers to evaluate thepresent drought situation with respect to the 50-yr historicalperiod.
This set of drought indices will complete the ensembleof tools currently used by Meteo-France for water resourcesmonitoring (Soubeyroux et al., 2008; Blanchard et al. , 2007)or hydrological seasonal forecasting (Ceron et al., 2010). Italso opens some perspectives for multilevel and multiscaledrought monitoring at the broader European scale.
Acknowledgements. This work was carried out within theCLIM SEC project (Impact of climate change on drought and soilmoisture in France) funded by Fondation MAIF and Meteo-France.The authors would like to thank the four anonymous referees fortheir helpful comments and suggestions that greatly improved theoriginal manuscript.
Edited by: F. Pappenberger
The publication of this article is financed by CNRS-INSU.
References
Albergel, C., Rdiger, C., Pellarin, T., Calvet, J.-C., Fritz, N., Frois-sard, F., Suquia, D., Petitpa, A., Piguet, B., and Martin, E.: Fromnear-surface to root-zone soil moisture using an exponential fil-ter: an assessment of the method based on in-situ observationsand model simulations, Hydrol. Earth Syst. Sci., 12, 1323–1337,2008,http://www.hydrol-earth-syst-sci.net/12/1323/2008/.
Andreadis, K. M., Clark, E. A., Wood, A. W., Hamlet, A. F.,and Lettenmaier, D. P.: Twentieth-century drought in theconterminous United States, J. Hydrometeorol., 6, 985–1001,doi:10.1175/JHM450.1, 2005.
Baghdadi, N., Aubert, M., Cerdan, O., Franchisteguy, L., Viel, C.,Martin, E., Zribi, M., and Desprats, J.-F.: Operational map-ping of soil moisture using synthetic aperture radar data: ap-plication to the Touch basin (France), Sensors, 7, 2458–2483,doi:10.3390/s7102458, 2007.
Bellocq, A.: La secheresse de l’automne 1978 en France – As-pect pluviometrique (Translation: The Autumn 1978 drought inFrance – Precipitation features), La Meteorologie, 16, 229–256,1979 (in French).
Besleaga, N.: La secheresse en France: 1976–1990 (Translation:Drought in France: 1976–1990), no. 1 in Phenomenes remar-quables, Direction de la Meteorologie Nationale, Service CentralExploitation Meteorologique, 1992 (in French).
www.hydrol-earth-syst-sci.net/14/459/2010/ Hydrol. Earth Syst. Sci., 14, 459–478, 2010
476 J.-P. Vidal et al.: Multilevel and multiscale drought reanalysis over France
Bessemoulin, P., Bourdette, N., Courtier, P., and Manach, J.: Lacanicule d’aout 2003 en France et en Europe (Translation: TheAugust 2003 heat wave in France and Europe), La Meteorologie,46, 25–33, 2004 (in French).
Blanchard, M., Franchisteguy, L., Habets, F., Martin, E., and Noil-han, J.: Typology of droughts over France and tools for estima-tion of water resources used at Meteo-France, Rev. Fr. Geotech.,120–121, 11–20, 2007.
Bordi, I., Fraedrich, K., Gerstengarbe, F.-W., Werner, P. C., andSutera, A.: Potential predictability of dry and wet periods: Sicilyand Elbe-Basin (Germany), Theor. Appl. Climatol., 77, 125–138,doi:10.1007/s00704-003-0029-0, 2004.
Breda, N. and Badeau, V.: Forest tree responses to extremedrought and some biotic events: Towards a selection ac-cording to hazard tolerance?, C. R. Geosci., 340, 651–662,doi:10.1016/j.crte.2008.08.003, 2008.
Bremond, R.: L’incidence du deficit de pluie sur l’ecoulementdes rivieres (Translation: Effect of precipitation deficits on riverflows), Ponts Chauss. Mag., 12, 49–58, 1976 (in French).
Briffa, K. R., Jones, P. D., and Hulme, M.: Summer moisture vari-ability across Europe, 1892–1991 – An analysis based on thePalmer Drought Severity Index, Int. J. Climatol., 14, 475–506,doi:10.1002/joc.3370140502, 1994.
Brochet, P.: Aspects climatiques de la secheresse 1976 (Translation:Climatic aspects of the 1976 drought), La Meteorologie, 7, 81–103, 1976 (in French).
Brown, L. D., Cai, T. T., and DasGupta, A.: Interval esti-mation for a binomial proportion, Stat. Sci., 16, 101–133,doi:10.1214/ss/1009213286, 2001.
Buisson, G.: Evaluation des couts des secheresses au niveau na-tional (Translation: National-scale cost assessment of droughts),Lettre Evaluation du Ministere de l’Ecologie, de l’Energie, duDeveloppement Durable et de l’Amenagement du Territoire, 8,3–4, http://www.ecologie.gouv.fr/IMG/pdf/LE08-2007.pdf, lastaccess: 5 March 2010, 2007 (in French).
Choisnel, E.: Le bilan hydrique et le bilan d’energie du sol (Tran-lation: The soil water and energy budgets), La Meteorologie, 11,103–159, 1977 (in French).
Ceron, J.-P., Tanguy, G., Franchisteguy, L., Martin, E., Regimbeau,F., and Vidal, J.-P.: Hydrological seasonal forecast over France:feasibility and prospects, Atmos. Sci. Lett., doi:10.1002/asl.256,in press, 2010.
de Rosnay, P., Calvet, J.-C., Kerr, Y., Wigneron, J.-P., Lemaitre,F., Escorihuela, M. J., Sabater, J. M., Saleh, K., Barrie, J.,Bouhours, G., Coret, L., Cherel, G., Dedieu, G., Durbe, R., Fritz,N. E. D., Froissard, F., Hoedjes, J., Kruszewski, A., Lavenu, F.,Suquia, D., and Waldteufel, P.: SMOSREX: A long term fieldcampaign experiment for soil moisture and land surface pro-cesses remote sensing, Remote Sens. Environ., 102, 377–389,doi:10.1016/j.rse.2006.02.021, 2006.
Direction de la Meteorologie Nationale: Resume mensuel du tempsen France – Mars 1961 (Translation: Monthly weather sum-mary in France – March 1961), Tech. rep., Direction de laMeteorologie Nationale, 1961 (in French).
D’Odorico, P., Ridolfi, L., Porporato, A., and Rodriguez-Iturbe,I.: Preferential states of seasonal soil moisture: The im-pact of climate fluctuations, Water Res. Res., 36, 2209–2219,doi:10.1029/2000WR900103, 2000.
Dutra, E., Viterbo, P., and Miranda, P. M. A.: ERA-40 reanalysis hydrological applications in the characteriza-tion of regional drought, Geophys. Res. Lett., 35, L19402,doi:10.1029/2008GL035381, 2008.
European Commission: Water Scarcity and Droughts: In-Depth Assessment, Interim Report 2, European Commis-sion,http://ec.europa.eu/environment/water/quantity/pdf/commdroughts/2ndint report.pdf, last access: 5 March 2010, 2007.
Gandin, L. V.: Objective analysis of meteorological fields, IsraelProgram for Scientific Translations, Jerusalem, Israel, 242 pp.,1965.
Guttman, N. B.: Accepting the Standardized Precipitation Index: Acalculation algorithm, J. Am. Water Res. Assoc., 35, 311–322,doi:10.1111/j.1752-1688.1999.tb03592.x, 1999.
Habets, F., Noilhan, J., Golaz, C., Goutorbe, J.-P., Lacarrere, P.,Leblois, E., Ledoux, E., Martin, E., Ottle, C., and Vidal-Madjar,D.: The ISBA surface scheme in a macroscale hydrologicalmodel applied to the Hapex-Mobilhy area – Part II: Simulationof streamflows and annual water budget, J. Hydrol., 217, 97–118,doi:10.1016/S0022-1694(99)00020-7, 1999.
Habets, F., Boone, A., Champeaux, J.-L., Etchevers, P., Fran-chisteguy, L., Leblois, E., Ledoux, E., Le Moigne, P., Martin, E.,Morel, S., Noilhan, J., Quintana Seguı, P., Rousset-Regimbeau,F., and Viennot, P.: The SAFRAN-ISBA-MODCOU hydrome-teorological model applied over France, J. Geophys. Res., 113,D06113, doi:10.1029/2007JDOO8548, 2008.
Hannaford, J., Lloyd-Hughes, B. J., Keef, C., Parry, S., and Prud-homme, C. P.: Examining the large-scale spatial coherenceof European drought using regional indicators of rainfall andstreamflow deficit, Hydrol. Proces., submitted, 2009.
Hisdal, H. and Tallaksen, L. M.: Estimation of regional meteoro-logical and hydrological drought characteristics: a case studyfor Denmark, J. Hydrol., 281, 230–247, doi:10.1016/S0022-1694(03)00233-6, 2003.
Hisdal, H., Tallaksen, L. M., Clausen, B., Peters, E., and Gus-tard, A.: Hydrological drought characteristics, in: Hydrologicaldrought – Processes and estimation methods for streamflow andgroundwater, vol. 48 of Developments in Water Science, chapter5, Elsevier, Amsterdam, The Netherlands, 139–198, 2004.
Hosking, J. R. M.:L-moments: analysis and estimation of distribu-tions using linear combinations of order statistics, J. R. Stat. Soc.B, 52, 105–124, 1990.
Koster, R. D., Guo, Z., Dirmeyer, P. A., Yang, R., Mitchell, K.,and Puma, M. J.: On the nature of soil moisture in land surfacemodels, J. Clim., 22, 4322–4335, doi:10.1175/2009JCLI2832.1,2009.
Lana, X., Serra, C., and Burgueno, A.: Patterns of monthly rainfallshortage and excess in terms of the standardized precipitationindex for Catalonia (NE Spain), Int. J. Climatol., 21, 1669–1691,doi:10.1002/joc.697, 2001.
Lariviere, G.: La secheresse en France en septembre 1985(Translation: The drought in France in September 1985),La Meteorologie, 10, p. 54, 1985 (in French).
Le Roy Ladurie, E.: Histoire humaine et comparee du climat, vol.III Le r echauffement de 1960a nos jours, Fayard, Paris, 461 pp.,2009.
Ledoux, E., Girard, G., De Marsily, G., and Deschenes, J.: Spatiallydistributed modeling: conceptual approach, coupling surface wa-ter and ground-water, in: Unsaturated flow hydrologic modeling:
Hydrol. Earth Syst. Sci., 14, 459–478, 2010 www.hydrol-earth-syst-sci.net/14/459/2010/

J.-P. Vidal et al.: Multilevel and multiscale drought reanalysis over France 477
theory and practice, edited by: Morel-Saytoux, H. J., vol. 275 ofNATO ASI Series C, Kluwer, Norwell, Massachussets, 435–454,1989.
Liang, X., Lettenmaier, D. P., Wood, E. F., and J., B. S.: A sim-ple hydrologically based model of land-surface water and en-ergy fluxes for general-circulation models, J. Geophys. Res., 99,14415–14428, 1994.
Lloyd-Hughes, B. and Saunders, M. A.: A drought climatology forEurope, Int. J. Climatol., 22, 1571–1592, doi:10.1002/joc.846,2002.
Lloyd-Hughes, B., Hannaford, J., Parry, S., Keef, C., Prudhomme,C., and Rees, G.: The spatial coherence of European droughts –Stage 1: UK and European drought catalogues – Methodology,Science Report SC070079/SR1, Environment Agency, Bristol,UK, 2009a.
Lloyd-Hughes, B., Hannaford, J., Parry, S., Keef, C., Prudhomme,C., and Rees, H. G.: Drought catalogues for UK and Europe,Science Report SC070079/SR, Environment Agency, 2009b.
Loukas, A. and Vasiliades, L.: Probabilistic analysis of drought spa-tiotemporal characteristics in Thessaly region, Greece, Nat. Haz-ards Earth Syst. Sci., 4, 719–731, 2004,http://www.nat-hazards-earth-syst-sci.net/4/719/2004/.
Lopez-Moreno, J. I., Vicente-Serrano, S. M., Beguerıa, S., Garcıa-Ruiz, J. M., Portela, M. M., and Almeida, A. B.: Dam effects ondroughts magnitude and duration in a transboundary basin: TheLower River Tagus, Spain and Portugal, Wat. Resour. Res., 45,W02405, doi:10.1029/2008WR007198, 2009.
Luterbacher, J., Dietrich, D., Xoplaki, E., Grosjean, M., and Wan-ner, H.: European seasonal and annual temperature variabil-ity, trends, and extremes since 1500, Science, 303, 1499–1503,doi:10.1126/science.1093877, 2004.
Masson, V., Champeaux, J.-L., Chauvin, F., Meriguet, C.,and Lacaze, R.: A global database of land surface pa-rameters at 1-km resolution in meteorological and cli-mate models, J. Clim., 16, 1261–1282, doi:10.1175/1520-0442(2003)16<1261:AGDOLS>2.0.CO;2, 2003.
Maurer, E. P., Wood, A. W., Adam, J. C., and Letten-maier, D. P.: A long-term hydrologically based datasetof land surface fluxes and states for the conterminousUnited States, J. Clim., 15, 3237–3251, doi:10.1175/1520-0442(2002)015<3237:ALTHBD>2.0.CO;2, 2002.
McKee, T., Doesken, N., and Kleist, J.: The relationship of droughtfrequency and duration to time scales, in: Preprints of the 8thConference on Applied Climatology, Anaheim, California, 179–184, 1993.
McKee, T. B., Doesken, N. J., and Kleist, J.: Drought monitoringwith multiple time scales, in: Preprints of the 9th Conference onApplied Climatology, Anaheim, California, 233–236, 1995.
Mo, K. C.: Model-based drought indices over the United States,J. Hydrometeorol., 9, 1212–1230, doi:10.1175/2008JHM1002.1,2008.
Moreau, F.: Drought crisis management: Loire basin exam-ple, La Houille Blanche, 4, 70–76, doi:10.1051/lhb:200404010,2004.
Mounier, J.: Aspects et frequences de la secheresse en Bretagne :essai de definition de la secheresse en Europe oceanique (Trans-lation: Specificities and frequency of drought in Britanny: propo-sition for defining drought in the western coastal part of Europe),Rev. Geogr. Lyon, 52, 167–176, 1977 (in French).
Merillon, Y. and Chaperon, P.: La secheresse de 1989 (Translation:The 1989 drought), La Houille Blanche, 5, 325–339, 1990 (inFrench).
Meteo-France: Bulletin Climatique – Avril 1997 (Translation: Cli-mate bulletin, April 1997), Tech. rep., Meteo-France, 12 pp.,1997 (in French).
Noilhan, J. and Lacarrere, P.: GCM grids evaporation frommesoscale modeling, J. Clim., 8, 206–223, doi:10.1175/1520-0442(1995)008<0206:GGSEFM>2.0.CO;2, 1995.
Noilhan, J. and Mahfouf, J.-F.: The ISBA land surface pa-rameterisation scheme, Global Planet. Change, 13, 145–159,doi:10.1016/0921-8181(95)00043-7, 1996.
Olden, J. D. and Poff, N. L.: Redundancy and the choice of hydro-logic indices for characterizing streamflow regimes, River Res.Appl., 19, 101–121, doi:10.1002/rra.700, 2003.
Palmer, W. C.: Meteorological Drought, Research paper 45, USDepartment of Commerce, US Weather Bureau, Office of Cli-matology, Washington, DC, http://lwf.ncdc.noaa.gov/oa/climate/research/drought/palmer.pdf, last access: 5 March 2010, 1965.
Paris Anguela, T., Zribi, M., Hasenauer, S., Habets, F., and Lou-magne, C.: Analysis of surface and root-zone soil moisturedynamics with ERS scatterometer and the hydrometeorologicalmodel SAFRAN-ISBA-MODCOU at Grand Morin watershed(France), Hydrol. Earth Syst. Sci., 12, 1415–1424, 2008,http://www.hydrol-earth-syst-sci.net/12/1415/2008/.
Piccarreta, M., Capolongo, D., and Boenzi, F.: Trend analysisof precipitation and drought in Basilicata from 1923 to 2000within a southern Italy context, Int. J. Climatol., 24, 907–922,doi:10.1002/joc.1038, 2004.
Prudhomme, C. and Sauquet, E.: Modelling a RegionalDrought Index in France, Euraqua report, CEH and Cema-gref, Wallingford, UK and Lyon, France, http://nora.nerc.ac.uk/1366/1/EuraquaDroughtForecastingFinalReport.pdf, last access:5 March 2010, 2007.
Quintana-Seguı, P., Le Moigne, P., Durand, Y., Martin, E., Habets,F., Baillon, M., Canellas, C., Franchisteguy, L., and Morel, S.:Analysis of near-surface atmospheric variables: Validation of theSAFRAN analysis over France, J. Appl. Meteor. Climatol., 47,92–107, doi:10.1175/2007JAMC1636.1, 2008.
Rudiger, C., Calvet, J.-C., Gruhier, C., Holmes, T. R. H.,De Jeu, R. A. M., and Wagner, W.: An intercomparisonof ERS-Scat and AMSR-E soil moisture observations withmodel simulations over France, J. Hydrometeorol., 10, 431–447,doi:10.1175/2008JHM997.1, 2009.
Rodriguez-Iturbe, I., Entekhabi, D., and Bras, R. L.: Nonlinear dy-namics of soil moisture at climate scales 1. Stochastic analysis,Water Resour. Res., 27, 1899–1906, 1991.
Santos, M. J., Verıssimo, R., Fernandes, S., Orlando, M.,and Rodrigues, R.: Overview of regional meteorologi-cal drought analysis on Western Europe, Technical Reportto the ARIDE project no. 10, Instituto deAgua (INAG),Lisbon, Portugal, http://www.hydrology.uni-freiburg.de/forsch/aride/navigation/publications/pdfs/aride-techrep10.pdf, last ac-cess: 5 March 2010, 2000.
Santos, M. J., Verıssimo, R., Fernandes, S., Orlando, M., and Ro-drigues, R.: Meteorological droughts focused on a pan-Europeancontext, in: FRIEND 2002 – REgional Hydrology: Bridgingthe Gap between Research and Practice, edited by: van Lanen,H. A. J. and Demuth, S., no. 274 in IAHS Red Books, IAHS,
www.hydrol-earth-syst-sci.net/14/459/2010/ Hydrol. Earth Syst. Sci., 14, 459–478, 2010

478 J.-P. Vidal et al.: Multilevel and multiscale drought reanalysis over France
Wallingford, UK, 273–280, 2002.Sauquet, E., Gottschalk, L., and Krasovskaia, I.: Estimating mean
monthly runoff at ungauged locations: an application to France,Hydrol. Res., 39, 403–423, doi:10.2166/nh.2008.331, 2008.
Sheffield, J. and Wood, E. F.: Characteristics of global and regionaldrought, 1950–2000: Analysis of soil moisture data from off-linesimulation of the terrestrial hydrologic cycle, J. Geophys. Res.,112, D17115, doi:10.1029/2006JD008288, 2007.
Sheffield, J., Goteti, G., Wen, F., and Wood, E. F.: A simulated soilmoisture based drought analysis for the United States, J. Geo-phys. Res., 109, D24108, doi:10.1029/2004JD005182, 2004.
Sheffield, J., Goteti, G., and Wood, E. F.: Development of a 50-year high-resolution global dataset of meteorological forcings forland, J. Clim., 19, 3088–3111, doi:10.1175/JCLI3790.1, 2006.
Sheffield, J., Andreadis, K. M., Wood, E. F., and Lettenmaier,D. P.: Global and continental drought in the second half ofthe 20th century: severity-area-duration analysis and tempo-ral variability of large-scale events, J. Clim., 22, 1962–1981,doi:10.1175/2008JCLI2722.1, 2009.
Shukla, S. and Wood, A. W.: Use of a standardized runoff indexfor characterizing hydrologic drought, Geophys. Res. Lett., 35,L02405, doi:10.1029/2007GL032487, 2008.
Snelder, T. H., Lamouroux, N., Leathwick, J. R., Pella, H.,Sauquet, E., and Shankar, U.: Predictive mapping of thenatural flow regimes of France, J. Hydrol., 373, 57–67,doi:10.1016/j.jhydrol.2009.04.011, 2009.
Soubeyroux, J.-M., Martin, E., Franchisteguy, L., Habets, F., Noil-han, J., Baillon, M., Regimbeau, F., Vidal, J.-P., Le Moigne,P., and Morel, S.: Safran-Isba-Modcou (SIM) – Un outilpour le suivi hydrometeorologique operationnel et lesetudes(Translation: A hydrometeorological tool for operational mon-itoring and research: the Safran-Isba-Modcou application),La Meteorologie, 63, 40–45, 2008 (in French).
Soule, P. T.: Spatial patterns of drought frequency and duration inthe contiguous USA based on multiple drought event definitions,Int. J. Climatol., 12, 11–24, doi:10.1002/joc.3370120103, 1992.
Stahl, K.: Hydrological drought – A study across Europe, PhD The-sis, Albert-Ludwigs-Universitat Freiburg, http://www.freidok.uni-freiburg.de/volltexte/202/pdf/stahl-diss.pdf, last access: 5March 2010, 2001.
Stahl, K. and Demuth, S.: Method for regional classifica-tion of streamflow drought series: Cluster analysis, Tech-nical Report to the ARIDE Project no. 1, Institute ofHydrology, University of Freiburg, Freiburg, Germany,http://www.hydrology.uni-freiburg.de/forsch/aride/navigation/publications/pdfs/aride-techrep1.pdf, last access: 5 March 2010,1999.
Svoboda, M., LeComte, D., Hayes, M., Heim, R., Gleason,K., Angel, J., Rippey, B., Tinker, R., Palecki, M., Stooks-bury, D., Miskus, D., and Stephens, S.: The drought moni-tor, Bull. Am. Meteor. Soc., 83, 1181–1190, doi:10.1175/1520-0477(2002)083<1181:TDM>2.3.CO;2, 2002.
Tallaksen, L. M., Hisdal, H., and van Lanen, A. J. H.: Space-timemodelling of catchment scale drought characteristics, J. Hydrol.,375, 363–372, doi:10.1016/j.jhydrol.2009.06.032, 2009.
Trnka, M., Dubrovsky, M., Svoboda, M., Semeradova, D., Hayes,M., Zalud, Z., and Wilhite, D.: Developing a regional droughtclimatology for the Czech Republic, Int. J. Climatol., 29, 863–883, doi:10.1002/joc.1745, 2009.
van der Schrier, G., Efthymiadis, D., Briffa, K. R., and Jones, P. D.:European Alpine moisture variability for 1800–2003, Interna-tional J. Climatol., 27, 415–427, doi:10.1002/joc.1411, 2007.
Vautard, R., Yiou, P., D’Andrea, F., de Noblet, N., Viovy, N.,Cassou, C., Polcher, J., Ciais, P., Kageyama, M., and Fan, Y.:Summertime European heat and drought waves induced by win-tertime Mediterranean rainfall deficit, Geophys. Res. Lett., 34,L07711, doi:10.1029/2006GL028001, 2007.
Vicente-Serrano, S. M.: Differences in spatial patterns of droughton different time scales: An analysis of the Iberian Peninsula,Water Res. Manage., 20, 37–60, doi:10.1007/s11269-006-2974-8, 2006.
Vicente-Serrano, S. M. and Lopez-Moreno, J. I.: Hydrological re-sponse to different time scales of climatological drought: an eval-uation of the Standardized Precipitation Index in a mountainousMediterranean basin, Hydrol. Earth Syst. Sci., 9, 523–533, 2005,http://www.hydrol-earth-syst-sci.net/9/523/2005/.
Vidal, J.-P. and Moisselin, J.-M.: Impact du changement climatiquesur les secheresses en France (Translation: Impact of climatechange on droughts in France), in: Actes du XXIe colloque del’Association Internationale de Climatologie: Climat et risquesclimatiques en Mediterranee, edited by: Vinet, F., AIC, Mont-pellier, France, 655–660 (in French), 2008.
Vidal, J.-P. and Soubeyroux, J.-M.: Impact du changement clima-tique en France sur la secheresse et l’eau du sol (Translation: Im-pact of climate change on drought and soil moisture in France),in: SEC 2008 – International Symposium – Drought and con-structions, vol. 1, edited by: Magnan, J.-P., Cojean, R., Cui, Y.-J., and Mestat, P., Laboratoire Central des Ponts et Chaussees,Marne-la-Vallee, France, 25–31, 2008 (in French).
Vidal, J.-P. and Wade, S. D.: A multimodel assessment of futureclimatological droughts in the United Kingdom, Int. J. Climatol.,29, 2056–2071, doi:10.1002/joc.1843,2009.
Vidal, J.-P., Martin, E., Baillon, M., Franchisteguy, L., and Soubey-roux, J.-M.: A 50-year high-resolution atmospheric reanalysisover France with the Safran system, Int. J. Climatol., in press,doi:10.1002/joc.2003, 2010.
Wang, A., Bohn, T. J., Mahanama, S. P., Koster, R. D., and Let-tenmaier, D. P.: Multimodel ensemble reconstruction of droughtover the continental United States, J. Clim., 22, 2694–2712,doi:10.1175/2008JCLI2586.1, 2009.
Wilhite, D. A. and Glantz, M. H.: Understanding the drought phe-nomenon: The role of definitions., Water Int., 10, 111–120, 1985.
Wilks, D. S.: Statistical methods in the atmospheric sciences,vol. 91 of International Geophysics Series, Academic Press, NewYork, 2nd Edn., 2006.
WMO: Manual for depth-area-duration analysis of storm precipi-tation, Tech. Rep. 237.TP.129, World Meteorological Organiza-tion, Geneva, Switzerland, 1969.
Zaidman, M. D. and Rees, H. G.: Spatial patterns of stream-flow drought in Western Europe 1960–1995, Technical Reportto the ARIDE project no. 8, Centre for Ecology and Hydrology,Wallingford, UK, http://www.hydrology.uni-freiburg.de/forsch/aride/navigation/publications/pdfs/aride-techrep8.pdf, last ac-cess: 5 March 2010, 2000.
Zaidman, M. D., Rees, H. G., and Young, A. R.: Spatio-temporaldevelopment of streamflow droughts in north-west Europe, Hy-drol. Earth Syst. Sci., 6, 733–751, 2002,http://www.hydrol-earth-syst-sci.net/6/733/2002/.
Hydrol. Earth Syst. Sci., 14, 459–478, 2010 www.hydrol-earth-syst-sci.net/14/459/2010/