multimedia dbs. paa and apca another approach: segment the time series into equal parts, store the...
Post on 19-Dec-2015
213 views
TRANSCRIPT

Multimedia DBs

PAA and APCA
• Another approach: segment the time series into equal parts, store the average value for each part.
• Use an index to store the averages and the segment end points

0
1
2
3 4
5
6
7
Haar 0
Haar 1
Haar 2
Haar 3
Haar 4
Haar 5
Haar 6
Haar 7
0 20 40 60 80 100 120 140
X
X'DFT
Agrawal, Faloutsos, Swami 1993
Chan & Fu 1999
eigenwave 0
eigenwave 1
eigenwave 2
eigenwave 3
eigenwave 4
eigenwave 5
eigenwave 6
eigenwave 7
Korn, Jagadish, Faloutsos 1997
Feature Spaces
X
X'DWT
0 20 40 60 80 100 120 140
X
X'SVD
0 20 40 60 80 100 120 140

Piecewise Aggregate Approximation (PAA)
valueaxis
time axis
Original time series(n-dimensional vector)S={s1, s2, …, sn}
n’-segment PAA representation (n’-d vector)
S = {sv1 , sv2, …, svn’ }sv1
sv2 sv3sv4
sv5
sv6
sv7
sv8
PAA representation satisfies the lower bounding lemma(Keogh, Chakrabarti, Mehrotra and Pazzani, 2000; Yi and Faloutsos 2000)

Can we improve upon PAA?
n’-segment PAA representation
(n’-d vector)
S = {sv1 , sv2, …, svN }
sv1
sv2 sv3sv4
sv5
sv6
sv7
sv8
sv1
sv2
sv3
sv4
sr1 sr2 sr3 sr4
n’/2-segment APCA representation
(n’-d vector)
S= { sv1, sr1, sv2, sr2, …, svM , srM }
(M is the number of segments = n’/2)
Adaptive Piecewise Constant Approximation (APCA)

1.69
3.02
1.21
1.75
3.77
1.03
Reconstruction error PAA Reconstruction error APCA
APCA approximates original signal better than PAA
Improvement factor =

APCA Representation can be computed efficiently
• Near-optimal representation can be computed in O(nlog(n)) time
• Optimal representation can be computed in O(n2M) (Koudas et al.)
Q
M
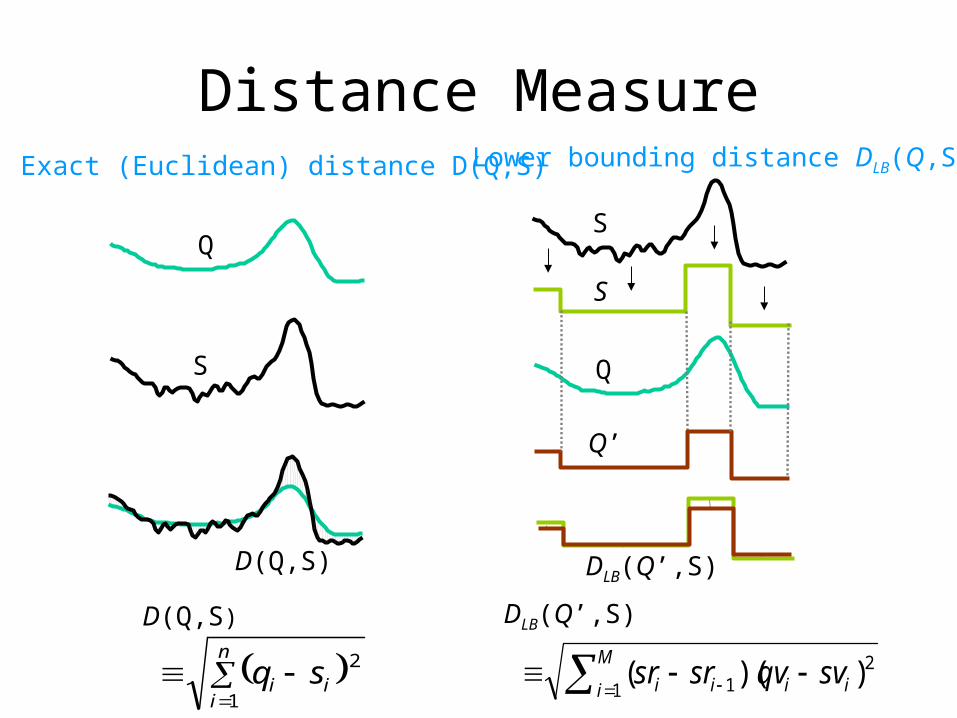
i iiii svqvsrsr1
21 ))((
DLB(Q’,S)
DLB(Q’,S)
Distance Measure
S
Q
D(Q,S)
n
iii sq
1
2
D(Q,S)
Exact (Euclidean) distance D(Q,S) Lower bounding distance DLB(Q,S)
S
S
Q’

Index on 2M-dimensional APCA space
Any feature-based index structure can used (e.g., R-tree, X-tree, Hybrid Tree)
R1
R3
R2R4
2M-dimensional APCA space
S6
S5
S1
S2 S3
S4
S8
S7
S9
R2 R3 R4
R3 R4
R1
S3 S4 S5 S6 S7 S8 S9S2S1
R2

k-nearest neighbor AlgorithmR1
S7
R3
R2
R4
S1
S2S3
S5
S4
S6
S8
S9
MINDIST(Q,R2)
MINDIST(Q,R4)
MINDIST(Q,R3)
Q
For any node U of the index structure with MBR R, MINDIST(Q,R) D(Q,S) for any data item S under U

Index Modification for MINDIST Computation
APCA point S= { sv1, sr1, sv2, sr2, …, svM, srM }
S1
S2S3
S5
S4 S6
S8S9
R1
R3
R2R4
APCA rectangle S= (L,H) where
L= { smin1, sr1, smin2, sr2, …, sminM, srM } and
H = { smax1, sr1, smax2, sr2, …, smaxM, srM }
sv1
sv2
sv3
sv4
sr1 sr2 sr3 sr4
smax3
smin3
smax1
smin1
smax2
smin2
smax4
smin4
S7

REGION 3
REGION 2
REGION 1
MBR Representation in time-value space
valueaxis
time axis L= { l1, l2, l3, l4 , l5, l6 }
We can view the MBR R=(L,H) of any node U as two APCA representations
L= { l1, l2, …, l(N-1), lN } and H= { h1, h2, …, h(N-1), hN }
l1
l2
l3
l4 l6
l5
H= { h1, h2, h3, h4 , h5, h6 }
h1
h2
h3
h4
h5
h6

Regions
M regions associated with each MBR; boundaries of ith region:
REGION i
l(2i-1)
h(2i-1)
h2il(2i-2)+1
h3
h1
h5
h2 h4 h6
valueaxis
time axis
l3
l1
l2 l4
l6
l5
REGION 1
REGION 3
REGION 2

Regions
h3
h1
h5
h2 h4 h6
valueaxis
time axis
l3
l1
l2 l4
l6
l5
REGION 2 t1 t2
REGION 3
REGION 1
• ith region is active at time instant t if it spans across t
• The value st of any time series S under node U at time instant t must
lie in one of the regions active at t (Lemma 2)

MINDIST Computation
For time instant t, MINDIST(Q, R, t) =
minregion G active at t MINDIST(Q,G,t)
h3
h1
h5
h2 h4 h6
l3
l1
l2 l4
l6
l5
t1
REGION 3
REGION 2
REGION 1
MINDIST(Q,R,t1)=min(MINDIST(Q, Region1, t1), MINDIST(Q, Region2, t1))=min((qt1 - h1)2 , (qt1 - h3)2 )=(qt1 - h1)2
MINDIST(Q,R) =
n
ttRQMINDIST
1),,(
Lemma3: MINDIST(Q,R) D(Q,C) for any time series C under node U

Approximate Search
• A simpler definition of the distance in the feature space is the following:
• But there is one problem… what?
M
i crki
crcr
k i
ii qcv1
2
1)(
1
1DLB(Q’,S)

Multimedia dbs
• A multimedia database stores also images
• Again similarity queries (content based retrieval)
• Extract features, index in feature space, answer similarity queries using GEMINI
• Again, average values help!

Images - color
what is an image?A: 2-d array

Images - color
Color histograms,and distance function

Images - color
Mathematically, the distance function is:

Images - color
Problem: ‘cross-talk’:
• Features are not orthogonal ->
• SAMs will not work properly
• Q: what to do?
• A: feature-extraction question

Images - color
possible answers: • avg red, avg green, avg blue
it turns out that this lower-bounds the histogram distance ->
• no cross-talk• SAMs are applicable

Images - color
performance:
time
selectivity
w/ avg RGB
seq scan

Images - shapes
• distance function: Euclidean, on the area, perimeter, and 20 ‘moments’
• (Q: how to normalize them?

Images - shapes
• distance function: Euclidean, on the area, perimeter, and 20 ‘moments’
• (Q: how to normalize them?
• A: divide by standard deviation)

Images - shapes
• distance function: Euclidean, on the area, perimeter, and 20 ‘moments’
• (Q: other ‘features’ / distance functions?

Images - shapes
• distance function: Euclidean, on the area, perimeter, and 20 ‘moments’
• (Q: other ‘features’ / distance functions?
• A1: turning angle
• A2: dilations/erosions
• A3: ... )

Images - shapes
• distance function: Euclidean, on the area, perimeter, and 20 ‘moments’
• Q: how to do dim. reduction?

Images - shapes
• distance function: Euclidean, on the area, perimeter, and 20 ‘moments’
• Q: how to do dim. reduction?
• A: Karhunen-Loeve (= centered PCA/SVD)
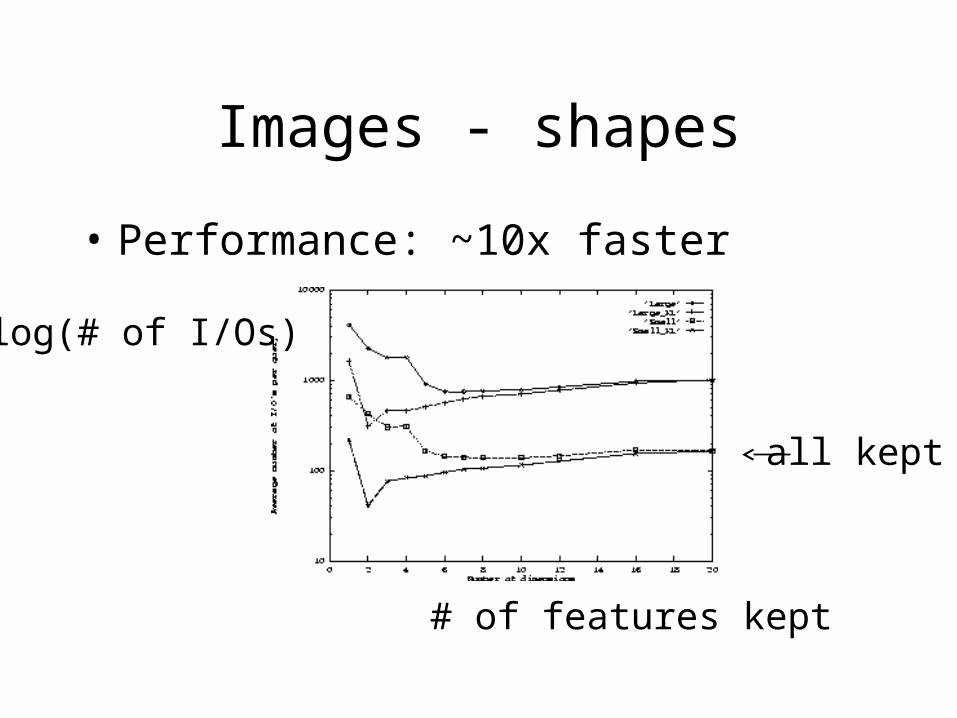
Images - shapes
• Performance: ~10x faster
# of features kept
log(# of I/Os)
all kept