multimodal sensor fusion for personnel detection
TRANSCRIPT

Multimodal Sensor Fusion for Personnel DetectionXin Jin Shalabh Gupta Asok Ray
Department of Mechanical EngineeringThe Pennsylvania State UniversityUniversity Park, PA 16802, USA
Email: [email protected], [email protected], [email protected]
Thyagaraju DamarlaNetworked Sensing and Fusion Branch
U.S. Army Research LaboratoryAdelphi, MD 20783, USA
Email: [email protected]
Abstract—Unattended ground sensors (UGS) are widely usedto monitor human activities, such as pedestrian motion anddetection of intruders in a secure region. Efficacy of UGS systemsis often limited by high false alarm rates, possibly due to inade-quacies of the underlying algorithms and limitations of onboardcomputation. This paper presents a symbolic method of featureextraction and sensor fusion, which is built upon the principles ofwavelet transform and probabilistic finite state automata (PFSA).The relational dependencies among heterogeneous sensors aremodeled by cross-PFSA, from which low-dimensional featurevectors are generated for pattern classification in real time. Theproposed method has been validated on data sets of seismicand passive infrared (PIR) sensors for target detection andclassification. The proposed method has the advantages of fastexecution time and low memory requirements and is potentiallywell-suited for real-time implementation with onboard UGSsystems.
Index Terms—Personnel detection, multimodal sensor fusion,feature extraction, seismic sensor, PIR sensor
I. INTRODUCTION
Unattended ground sensors (UGS) are widely used inindustrial monitoring and military operations. Such UGSare usually lightweight devices that automatically monitorthe local activities in-situ, and transfer target detection andclassification reports to some higher level processing center.Commercially available UGS systems make use of multiplesensing modalities (e.g., acoustic, seismic, passive infrared,magnetic, electrostatic, and video). Efficacy of UGS systemsis often limited by high false alarm rates because the onboarddata processing algorithms may not be able to correctlydiscriminate different types of targets (e.g., humans fromanimals) [1]. Power consumption is a critical consideration inUGS systems. Therefore, power-efficient sensing modalities,low-power signal processing algorithms, and efficient meth-ods for exchanging information between the UGS nodes areneeded [2].
In a personnel detection problem, the targets usually includehuman, vehicles, and animals. Discriminating human footstepsignals from other targets and noise sources is a challengingproblem, because the signal to noise ratio (SNR) of footstepsdecreases rapidly with the distance between the sensor andthe pedestrian. Furthermore, the footstep signals may varysignificantly for different persons and environments.
Seismic sensors are widely used for personnel detection,because they are relatively less sensitive to Doppler effectsenvironment variations as compared to acoustic sensors [3].
Current personnel detection methods using seismic signals canbe classified into three categories, namely, time domain meth-ods [4], frequency domain methods [5], and time-frequencydomain methods [3], [6]. Recent research has relied on time-frequency domain methods, such as wavelet transform-basedmethods. Passive Infrared (PIR) sensors are widely used formotion detection, and are well-suited for UGS systems dueto low power consumption. PIR sensors have been reportedfor moving targets detection and localization [7]; however,similar effort for target classification has not been reportedin open literature, although PIR sensor signals also containdiscriminative information in the time-frequency domain.
Collaborative target detection and classification using mul-timodal sensor fusion would increase the overall performancebecause the heterogeneous sensors can complement each other.Sensor fusion can be implemented at different levels: data-level fusion, feature-level fusion, and decision-level fusion.Kalman filter is widely used for data-level fusion; Dempster-Shafer evidence theory and Bayesian network are widelyused for decision-level fusion [8] [9]. Data-level fusion hasthe least information loss, but it may be computationallyexpensive and vulnerable to sensor degradation. Some ofthese concerns can be alleviated by decision-level fusion, inwhich detection/classification is performed at the data-leveland then the decisions are combined from individual sensors.In principle, decision-level fusion is suboptimal since if atarget is not detected by all sensors, it will not experiencethe full benefits of fusion [10].
This paper introduces a feature-level fusion method toaddress these issues. Symbolic Dynamic Filtering (SDF) is adata-driven feature extraction tool built upon the concepts ofSymbolic Dynamics and Probabilistic Finite State Automata(PFSA) [11] [12]. In SDF, the sensor data are first partitionedinto symbol sequences, and then PFSA are constructed asthe representation of the underlying dynamics in the data.A feature-level fusion approach built under the frameworkof SDF has been proposed in [13] for fault diagnosis inaircraft engine. The time series data from different sensorsare partitioned into symbol sequences from which the cross-PFSA, called cross D-Markov machine [13] (denoted as ‘xD-Markov machine’ in the sequel), is constructed. However, theperformance of this method may degrade significantly if theSNR decreases. For analysis of noisy sensor data, this paperextends the concept of xD-Markov machines by introducing
14th International Conference on Information FusionChicago, Illinois, USA, July 5-8, 2011
978-0-9824438-3-5 ©2011 ISIF 437

Start ReturnStartPoint
Sensor Site 1 Sensor Site 2Sensor Site 3
Point
150 meters
Figure 1. An illustration of the test scenario with three sensor sites
wavelet surface partitioning [14] as an alternative to timeseries partitioning in the original concept in [13]. In theproposed method, images of wavelet-transformed time seriesare partitioned for conversion into symbol sequences. Subse-quently, xD-Markov machines are constructed from symbolsequences of heterogeneous sensors to compress the pertinentinformation into low-dimensional statistical patterns. The pro-posed feature extraction algorithm mitigates the detrimentaleffects of spurious noise by using wavelet analysis, capturesthe essential signatures from the time-frequency domain ofthe signals, and generates low-dimensional feature vectors forpattern classification.
The proposed method is validated on the data collected fromseismic sensors and PIR sensors for the purpose of personneldetection in border area. Performance of information fusionfrom seismic and PIR sensors is compared with the resultsobtained from single-modal sensors.
II. PROBLEM DESCRIPTION AND FORMULATION
The problem at hand is to detect and classify differenttargets (e.g., humans and animals), where seismic and PIRsensors are used to capture the respective characteristic signa-tures. For example, in the movement of a human or an animalacross the ground, oscillatory motions of the body appendagesprovide the respective characteristic signatures.
The seismic and PIR sensor data, used in this analysis,were collected on multiple days from test fields on a wash(i.e., the dry bed of an intermittent creek) and at a chokepoint (i.e., a place where the targets are forced to go dueto terrain difficulties). During multiple field tests, sensor datawere collected for several scenarios that consisted of targetswalking along an approximately 150 meters long trail, andreturning along the same trail to the starting point. Figure 1illustrates a typical data collection scenario.
The targets consisted of people (e.g., male and femalehumans) and animals (e.g., donkeys, mules, and horses).The humans walked alone and in groups with and withoutbackpacks; the animals were led by their human handlersand they made runs with and without payloads. There werethree sensor sites, each equipped with acoustic and seismicsensors. The seismic sensors were buried approximately 15 cmdeep underneath the soil surface, and the PIR sensors werecollocated with the respective seismic sensors. All targetspassed by the sensor sites at a distance of approximately5 m. Signals from both sensors were acquired at a samplingfrequency of 10 kHz.
SensorSignals
FeatureExtractionSignals Extraction
TargetPresent
TargetAbsentDetection
AnimalHumanClassification
Figure 2. Tree structure formulation of the detection & classification problem
The tree structure in Fig. 2 shows how the detection andclassification problem is formulated. In the detection stage,the pattern classifier detects the presence of a moving targetagainst the null hypothesis of no target present; in the classi-fication stage, the pattern classifier discriminates among dif-ferent targets. While the detection system should be robust tosatisfy the specifications of false alarm rates, the classificationsystem must be sufficiently sensitive to discriminate betweendifferent classes of targets with high fidelity. In this context,feature extraction plays an important role in target detectionand classification, because the performance of the classifierlargely depends on the quality of the extracted features.
III. SEMANTIC FRAMEWORK OF SENSOR FUSION
A (three-layered) hierarchical semantic framework is pre-sented in this paper for the purpose of multi-sensor data in-terpretation and fusion. In this framework, patterns discoveredfrom individual sensors are called atomic patterns (AP), whilepatterns discovered from the relational dependency betweentwo sensors are called relational patterns (RP) [13].
Let L = {L1,L2, . . . ,LN} be the universal set of atomicpatterns. The atomic pattern library L is set of modal footprintsidentified from individual sensing modalities for targets ofdifferent classes. Given the atomic pattern library, a popularframework for addressing information fusion is what is calledthe set-theoretic approach. In this framework, higher levelpatterns or contexts are modeled as subsets of L. Thus acomposite pattern, resulting from fusion of atomic patterns,is a collection of atomic patterns from L and the resultinglibrary of composite patterns is a subset of the power set of theatomic pattern library, i.e., L∗ ⊆ 2L. However, a disadvantageof this approach is that it considers only modal footprints forconstructing composite patterns as a bag of atomic patterns;relational dependencies between patterns are disregarded.
Since the relational dependencies cannot be ignored inmany practical problems, a hierarchical semantic frameworkfor multi-sensor data interpretation and fusion is proposed inthis paper, which involves a common approach to informationfusion at different layers of the hierarchy and to includerelational dependencies for composite pattern representation.Thus, the middle layer deals with the relational dependenciesamong atomic patterns, where relationships are modeled asthe cross-dependencies among sensor data streams from dif-ferent sensors. These cross-dependencies are discovered viarelational PFSA that essentially capture the dynamics of state
438

Figure 3. Comparison of the set-theoretic fusion (left) and the proposed semantic fusion of multimodal sensors (right)
transition in one symbol sequence (e.g., obtained from onesensor) corresponding to a symbol appearance in the secondsymbol sequence (e.g., obtained from another sensor). Loosetime-synchronization between sensor observations should beadequate for this purpose. Symbol-level cross-dependenciesamong modalities are exploited to mitigate information loss.
Finally, the top layer consists of higher level compositepatterns that is represented as digraphs where the atomicpatterns (AP) are modeled as nodes and dependencies betweennodes are modeled as relational patterns (RP). An illustrativeexample in Fig. 3 compares the set-theoretic fusion (left)with the proposed co-dependence aware fusion (right). Thedefinition of the composite pattern is as follows.
Definition 3.1 (Composite pattern representation): LetL = {L1,L2, . . . ,LN} be the atomic pattern library and letL∗ ⊆ 2L be the set of allowable primitives for a class. Then,a composite pattern library Gr = {Gr
1 ,Gr2 , . . . ,Gr
M} wherethe ith composite pattern Gr
i is a digraph Gri = (LVi , EVi);
LVi ⊆ L with the index set Vi ⊆ {1, 2, . . . , N} andEi = {Rjk, ...} is a set of relational PFSAs.
The relational PFSAs are discovered by cross D-Markovmachine [13] construction to determine the respective cross-dependence; the algorithm is described in Section III-C. Ab-sence of a directed edge in composite pattern digraph wouldbe represented by a single state machine for relational PFSA,which implies the lack of prediction capability of a target stateby the parent state.
A. Sensor Signal Conditioning and Transformation
This section presents the procedure for generation ofwavelet coefficient, i.e., an image in the scale-shift domain,
denoted as ‘wavelet image’ in the sequel, from observed sensortime series for construction of symbolic representations of theunderlying dynamics. In this SDF-based procedure, a crucialstep is partitioning of the phase space for symbol sequencegeneration. Various partitioning techniques have been reportedin literature, and a brief review is given in [14].
In wavelet-based partitioning, time series are first trans-formed to wavelet domain, where wavelet coefficients aregenerated at different time shifts and scales. The choice ofthe wavelet basis function and wavelet scales depends on thetime-frequency characteristics of individual signals.
For every wavelet, there exists a certain frequency calledthe center frequency Fc that has the maximum modulus in theFourier transform of the wavelet. The pseudo-frequency fp ofthe wavelet at a particular scale α is given by the followingformula:
fp =Fc
α Δt, (1)
where Δt is the sampling interval. Then the scales can becalculated as follows:
αi =Fc
f ip Δt
(2)
where i = 1, 2, ..., and f ip are the frequencies that can be
obtained by choosing the locally dominant frequencies in theFourier transform.
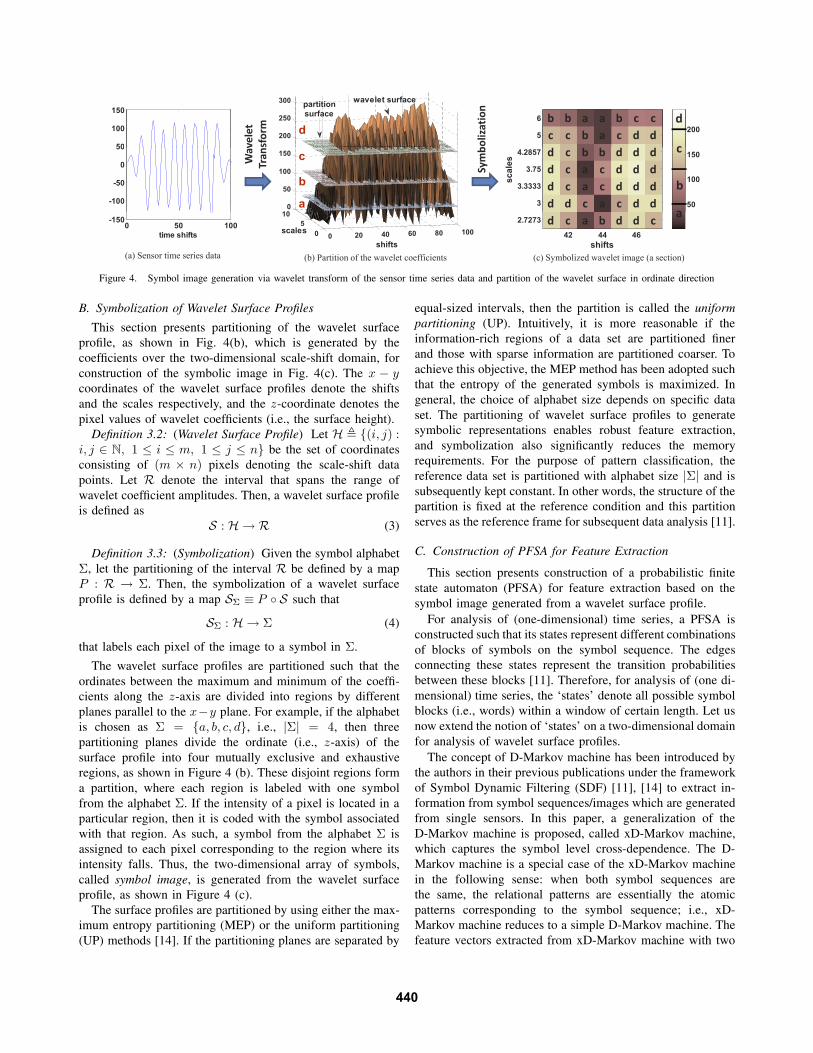
Figure 4 shows an illustrative example of transformation ofthe time series in Fig. 4(a) to the two-dimensional wavelet im-age in Fig. 4(b); the amplitudes of the wavelet coefficients overthe scale-shift domain are plotted as a surface. Subsequently,symbolization of this wavelet surface leads to the formationof a symbolic image as shown in Fig. 4(c).
439
bolization
velet
sform
50
100
150 6
5200
b b a a b c cc c b a c d d
c200
250
300
d
partitionsurface
wavelet surface
d
Symb
Wav
Tran
-100
-50
0
50
scal
es
4.2857
3.75
3.3333
3 50
100
150d c b b d d dd c a c d d dd c a c d d dd d c a c d d
c
b
a100
50
100
150
b
c
a
(a) Sensor time series data (b) Partition of the wavelet coefficients (c) Symbolized wavelet image (a section)
0 50 100-150
time shiftsshifts
42 44 46
2.7273 d c a b d d ca
0 20 40 60 80 10005
10
shiftsscales
Figure 4. Symbol image generation via wavelet transform of the sensor time series data and partition of the wavelet surface in ordinate direction
B. Symbolization of Wavelet Surface Profiles
This section presents partitioning of the wavelet surfaceprofile, as shown in Fig. 4(b), which is generated by thecoefficients over the two-dimensional scale-shift domain, forconstruction of the symbolic image in Fig. 4(c). The x − ycoordinates of the wavelet surface profiles denote the shiftsand the scales respectively, and the z-coordinate denotes thepixel values of wavelet coefficients (i.e., the surface height).
Definition 3.2: (Wavelet Surface Profile) Let H � {(i, j) :i, j ∈ N, 1 ≤ i ≤ m, 1 ≤ j ≤ n} be the set of coordinatesconsisting of (m × n) pixels denoting the scale-shift datapoints. Let R denote the interval that spans the range ofwavelet coefficient amplitudes. Then, a wavelet surface profileis defined as
S : H → R (3)
Definition 3.3: (Symbolization) Given the symbol alphabetΣ, let the partitioning of the interval R be defined by a mapP : R → Σ. Then, the symbolization of a wavelet surfaceprofile is defined by a map SΣ ≡ P ◦ S such that
SΣ : H → Σ (4)
that labels each pixel of the image to a symbol in Σ.
The wavelet surface profiles are partitioned such that theordinates between the maximum and minimum of the coeffi-cients along the z-axis are divided into regions by differentplanes parallel to the x−y plane. For example, if the alphabetis chosen as Σ = {a, b, c, d}, i.e., |Σ| = 4, then threepartitioning planes divide the ordinate (i.e., z-axis) of thesurface profile into four mutually exclusive and exhaustiveregions, as shown in Figure 4 (b). These disjoint regions forma partition, where each region is labeled with one symbolfrom the alphabet Σ. If the intensity of a pixel is located in aparticular region, then it is coded with the symbol associatedwith that region. As such, a symbol from the alphabet Σ isassigned to each pixel corresponding to the region where itsintensity falls. Thus, the two-dimensional array of symbols,called symbol image, is generated from the wavelet surfaceprofile, as shown in Figure 4 (c).
The surface profiles are partitioned by using either the max-imum entropy partitioning (MEP) or the uniform partitioning(UP) methods [14]. If the partitioning planes are separated by
equal-sized intervals, then the partition is called the uniformpartitioning (UP). Intuitively, it is more reasonable if theinformation-rich regions of a data set are partitioned finerand those with sparse information are partitioned coarser. Toachieve this objective, the MEP method has been adopted suchthat the entropy of the generated symbols is maximized. Ingeneral, the choice of alphabet size depends on specific dataset. The partitioning of wavelet surface profiles to generatesymbolic representations enables robust feature extraction,and symbolization also significantly reduces the memoryrequirements. For the purpose of pattern classification, thereference data set is partitioned with alphabet size |Σ| and issubsequently kept constant. In other words, the structure of thepartition is fixed at the reference condition and this partitionserves as the reference frame for subsequent data analysis [11].
C. Construction of PFSA for Feature Extraction
This section presents construction of a probabilistic finitestate automaton (PFSA) for feature extraction based on thesymbol image generated from a wavelet surface profile.
For analysis of (one-dimensional) time series, a PFSA isconstructed such that its states represent different combinationsof blocks of symbols on the symbol sequence. The edgesconnecting these states represent the transition probabilitiesbetween these blocks [11]. Therefore, for analysis of (one di-mensional) time series, the ‘states’ denote all possible symbolblocks (i.e., words) within a window of certain length. Let usnow extend the notion of ‘states’ on a two-dimensional domainfor analysis of wavelet surface profiles.
The concept of D-Markov machine has been introduced bythe authors in their previous publications under the frameworkof Symbol Dynamic Filtering (SDF) [11], [14] to extract in-formation from symbol sequences/images which are generatedfrom single sensors. In this paper, a generalization of theD-Markov machine is proposed, called xD-Markov machine,which captures the symbol level cross-dependence. The D-Markov machine is a special case of the xD-Markov machinein the following sense: when both symbol sequences arethe same, the relational patterns are essentially the atomicpatterns corresponding to the symbol sequence; i.e., xD-Markov machine reduces to a simple D-Markov machine. Thefeature vectors extracted from xD-Markov machine with two
440

a a b c c c b b a a a …..0 0 0 1 2 2 1 1 1 0 2 …..
RP12
AP1 AP2RP21
RP23
AP3
RP23
RP32
RP13RP31
AP3
Figure 5. Composite Pattern Digraph
same symbol sequences (i.e., from D-Markov machine) arecalled Atomic Pattern (AP), and those extracted from xD-Markov machine with two different symbol sequences arecalled Relational Pattern (RP). The digraph representation ofAP and RP is illustrated in Fig. 5.
The xD-Markov machines are constructed based on twosymbol sequences {s1} and {s2} obtained from two differentsensors (possibly heterogeneous) to capture the symbol levelcross-dependence. Conversion of the two-dimensional symbolimage to one-dimensional symbol sequence while retainingthe pertinent information is a difficult problem. One simpleway for the conversion is to stack each row in the symbolimage one after another. However, this method only worksif the two symbol sequences {s1} and {s2} have the samenumber of scales in wavelet transform; otherwise their lengthof the generated symbol sequences will not be equal. Moreimportantly, this method may suffer information loss in thefrequency domain by only looking for relational dependencyat the similar frequency bands in {s1} and {s2}. It is highlypossible that the low frequency component in H1 has strongercorrelation with the high frequency component in H2.
To avoid these issues, a new method for converting symbolimages from two sensors to symbol sequences for discoveryof relational dependency is proposed. The key idea is toexhaustively find all possible combination of rows betweenthe two symbol images. A formal definition is as follows:
Definition 3.4 (Conversion): Let H1 and H2 be the waveletcoefficients (images) of sensor 1 and sensor 2, consisting ofm1 ×n and m2 ×n pixels, respectively. Let Wj
i ⊆ Hi be thewindow that covers the jth scale in Hi. Then the two symbolsequences {s1} and {s2} are defined as
{s1} = [SΣ(W11 ) . . .SΣ(W1
1 )︸ ︷︷ ︸
m2
, · · · , SΣ(Wm11 ) . . .SΣ(Wm1
1 )︸ ︷︷ ︸
m2
]
{s2} = [SΣ(W12 ) . . .SΣ(Wm2
2 ), · · · , SΣ(W12 ) . . .SΣ(Wm2
2 )︸ ︷︷ ︸
m1
]
By implementing the conversion procedure as definedabove, the wavelet images H1 of (m1 × n) pixels and H2 of(m2 ×n) are converted to one-dimensional symbol sequences
Symbol Image 1 Symbol Image 2
d c a b d3 2 1 1 32 12 0 2
Symbol Image 1 Symbol Image 2
11 2
1
22
Shifts
Scale
Scales
Shifts
d c a b d d c a b d{s } d c a b d d c a b d
2 12 0 2 3 2 1 1 3
{s1}{s2}
Figure 6. An illustration of converting symbol images to symbol sequences
of the same length (m1 ×m2 ×n). An illustration is given inFig. 6, where m1 = 1, m2 = 2, n = 5 and |Σ1| = |Σ2| = 4.A formal definition of the xD-Markov machine is as follows:
Definition 3.5 (xD-Markov): Let M1 and M2 be the PF-SAs corresponding to symbol sequences {s1} and {s2} re-spectively. Then a xD-Markov machine is defined as a 4-tupleM1→2 � (Q1, Σ2, δ12, Π̃12) such that:
• Σ2 = {σ0, ..., σ|Σ2|−1} is the alphabet set of symbolsequence {s2}
• Q1 = {q1, q2, . . . , q|Σ|D11
} is the state set correspondingto symbol sequence {s1}, where D1 is the depth for {s1}
• δ12 : Q1 × Σ2 → Q1 is the state transition mapping thatmaps the transition in symbol sequence {s1} from onestate to another upon arrival of a symbol in {s2}
• Π̃12 is the symbol generation matrix of size |Q1| × |Σ2|;the ij element of Π̃12 denotes the probability of findingjth symbol in {s2} while making a transition from ith
state in the symbol sequence {s1}In practice, Π̃12 is reshaped into a vector p12 of length
|Q1| × |Σ2| and is treated as the extracted feature vector thatis a representation of the relational dependence between {s1}and {s2}. This feature vector is called a Relational Pattern(RP). The xD-Markov machine M2→1 and the correspondingfeature vector p21 are defined similarly. Fig. 5 schematicallydescribes the basic concept of the xD-Markov machine. Note,a RP between two symbol sequences is not symmetric; there-fore, RPs need to be identified for both directions. If {s1}and {s2} are the same, then the xD-Markov machines M1→1
and M2→2 reduce to the simple D-Markov machine, and thefeature vector obtained from Π̃11 or Π̃22 is called an AtomicPattern (AP).
The set-theoretic approach falls at one end of the spectrumof information fusion; here all relationships are excludedand any fusion is solely done in the decision-theoretic sensewhere the presence (or absence) of one or more footprintscan be used to estimate the probability of the fault classunder consideration. The other end of the spectrum is tofuse data at the lowest level and construct machines (PFSAs)working in the product space of all sensors. This approachwould be able extract modal dependencies before they are lostwhen constructing separate machines for individual sensor ormodalities. But working in the product space has the danger ofstate space explosion especially when the sensors and sensing
441
modalities can be numerous [13]. The proposed approachis a trade-off between the two ends of the spectrum andattempts to include relational dependencies between sensingmodalities, while keeping it tractable for practical application.A hierarchical approach ensures that composite patterns areidentified only when its constituting units at the lower levelhave been observed. In the current framework we have con-sidered relations taken only two at a time, but we propose toexplore relations between higher order cliques as future work.
D. Feature Selection and Pattern Classification
Once the feature vectors are extracted from the observedsensor time series, the next step is to classify these patternsinto different categories based on the particular application.However, the feature vector pij obtained from Π̃ij has thedimension of |Qi| × |Σj | which is still high if |Qi| and|Σj | are large. More importantly, many features in pij maybe zero since some transitions never occur. Therefore, it isnecessary to perform feature selection in order to find themost representative and discriminative features and speed upthe pattern classification process. Many standard methods canbe found in feature selection literature [15]; a simple methodthat selects the features with large inter-class separation andsmall intra-class variance is adopted in this paper. Advancedmethods such as forward/backward selection [15] and mRMRfeature selection [16] may further improve the classificationresult by selecting the most representative and discriminativefeatures; however, it is a topic of future research and not thefocus of this paper.
Pattern classification for personnel detection is posed as atwo-stage problem, i.e., the training stage and the testing stage.The sensor time series data sets are divided into three groups:i) partition data, ii) training data, and iii) testing data. Thepartition data set is used to generate partition planes that areused in the training and the testing stages. The training dataset is used to generate the training patterns of different classesfor the pattern classifier. Multiple sets of training data areobtained from independent experiments for each class in orderto provide a good statistical spread of patterns. Subsequently,the class labels of the testing patterns are generated fromtesting data in the testing stage. The partition data sets maybe part of the training data sets, whereas the training data setsand the testing data sets must be mutually exclusive.
The partition data is wavelet-transformed with appropriatescales to convert the one-dimensional numeric time series datainto the wavelet image. The corresponding wavelet surfaceis analyzed using the maximum entropy principle [14] togenerate the partition planes that remain invariant for both thetraining and the testing stage. The scales used in the wavelettransform of the partitioning data also remain invariant duringthe wavelet transform of the training and the testing data.In the training stage, the wavelet surfaces are generated bytransformation of the training data sets corresponding to differ-ent classes. These surfaces are symbolized using the partitionplanes to generate the symbol images. Subsequently, PFSAs(either D-Markov or xD-Markov machines) are constructed
based on the corresponding symbol images, and the trainingpatterns are extracted from these PFSAs. Similar to the trainingstage, the PFSA and the associated pattern is generated fordifferent data sets in the testing stage.
Finally a classifier is trained using features of differentclasses extracted from training data and can be used to classifythe features from test data set. There are plenty of choicesavailable for design of both parametric and non-parametricclassifiers in literature [17]. Among the parametric type ofclassifiers, one of the most common techniques is to considerup to two orders of statistics in the feature space. In otherwords, the mean feature is calculated for every class alongwith the variance of the feature space distribution in thetraining set. Then, a test feature vector is classified by usingthe Mahalanobis distance or the Bhattacharya distance ofthe test vector from the mean feature vector of each class.However, these methods lack in efficiency if the feature spacedistribution cannot be described by second order statistics(i.e., non-Gaussian in nature). In the present context, Gaussianfeature space distribution cannot be ensured due to the non-linear nature of the partitioning feature extraction technique.Therefore, a non-parametric classifier, such as the k-NearestNeighbors (k-NN) classifier may a better candidate for thisstudy [17]; however, in general, any other suitable classifier,such as the Support Vector Machines (SVM) or the GaussianMixture Models (GMM) may also be used.
IV. RESULTS OF FIELD DATA ANALYSIS
Field data were collected in the scenario illustrated in Fig. 1.Multiple data runs were made to collect data sets of all threeclasses, i.e., no target, human, and animal. The data werecollected over three days at different sites. A brief summaryis given in Table I showing the number of runs of each class.
Each data set, sampled at a sampling frequency of Fs = 10kHz, has 1×10⁵ data points that correspond to 10 seconds ofthe experimentation time. In order to test the capability of theproposed algorithm in target detection, another group of datawere collected with no target present. The problem of targetdetection is then formulated as a binary pattern classification,where the no target present data are considered as one class,and the others with target present (i.e., human or animal) areconsidered to belong to the other class. The data sets, collectedby the channel of seismic sensors that are orthogonal to theground surface and the PIR sensors that are collocated with theseismic sensors, are used for target detection and classification.For computational efficiency, the original seismic and PIR datawere downsampled by a factor of 10.
Table ITHE NUMBER OF FEATURE VECTORS FOR EACH TARGET CLASS IN THE
DATA SETS USED FOR THREE-WAY CROSS VALIDATION (SET 3)
Day 1 Day 2 Day 3 Total
No target 50 28 32 110
Human 30 22 14 66
Animal 20 6 18 44
442
Sensor Signals
Remove DC Component
Normalize to unit variance
SignalPreprocessing
Time series
SymbolizationFeatureExtractionusing SDF
xD Markov Machine
Symbol sequences
Pattern Classifier # 1
Patterns
NoTarget
Detection
xD Markov Machine
Pattern Classifier # 2
Target present
g
A i lH
Classification
AnimalHuman
Figure 7. Flow chart of the problem of target detection and classification
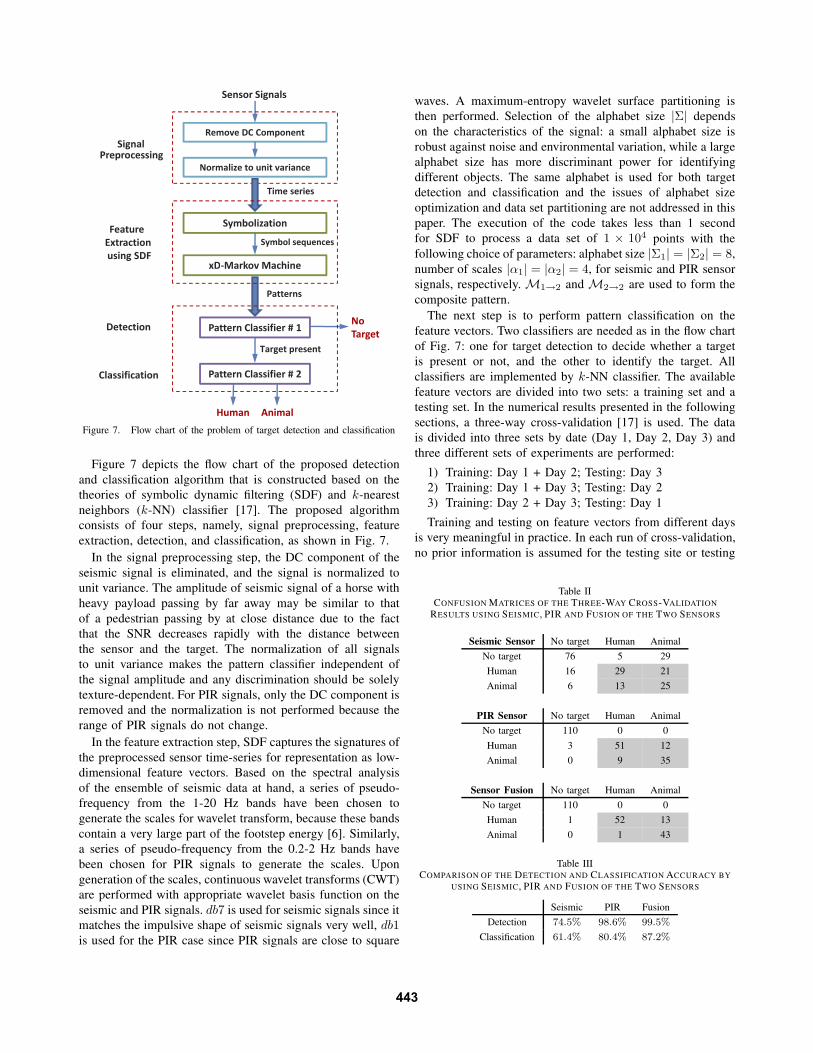
Figure 7 depicts the flow chart of the proposed detectionand classification algorithm that is constructed based on thetheories of symbolic dynamic filtering (SDF) and k-nearestneighbors (k-NN) classifier [17]. The proposed algorithmconsists of four steps, namely, signal preprocessing, featureextraction, detection, and classification, as shown in Fig. 7.
In the signal preprocessing step, the DC component of theseismic signal is eliminated, and the signal is normalized tounit variance. The amplitude of seismic signal of a horse withheavy payload passing by far away may be similar to thatof a pedestrian passing by at close distance due to the factthat the SNR decreases rapidly with the distance betweenthe sensor and the target. The normalization of all signalsto unit variance makes the pattern classifier independent ofthe signal amplitude and any discrimination should be solelytexture-dependent. For PIR signals, only the DC component isremoved and the normalization is not performed because therange of PIR signals do not change.
In the feature extraction step, SDF captures the signatures ofthe preprocessed sensor time-series for representation as low-dimensional feature vectors. Based on the spectral analysisof the ensemble of seismic data at hand, a series of pseudo-frequency from the 1-20 Hz bands have been chosen togenerate the scales for wavelet transform, because these bandscontain a very large part of the footstep energy [6]. Similarly,a series of pseudo-frequency from the 0.2-2 Hz bands havebeen chosen for PIR signals to generate the scales. Upongeneration of the scales, continuous wavelet transforms (CWT)are performed with appropriate wavelet basis function on theseismic and PIR signals. db7 is used for seismic signals since itmatches the impulsive shape of seismic signals very well, db1is used for the PIR case since PIR signals are close to square
waves. A maximum-entropy wavelet surface partitioning isthen performed. Selection of the alphabet size |Σ| dependson the characteristics of the signal: a small alphabet size isrobust against noise and environmental variation, while a largealphabet size has more discriminant power for identifyingdifferent objects. The same alphabet is used for both targetdetection and classification and the issues of alphabet sizeoptimization and data set partitioning are not addressed in thispaper. The execution of the code takes less than 1 secondfor SDF to process a data set of 1 × 10⁴ points with thefollowing choice of parameters: alphabet size |Σ1| = |Σ2| = 8,number of scales |α1| = |α2| = 4, for seismic and PIR sensorsignals, respectively. M1→2 and M2→2 are used to form thecomposite pattern.
The next step is to perform pattern classification on thefeature vectors. Two classifiers are needed as in the flow chartof Fig. 7: one for target detection to decide whether a targetis present or not, and the other to identify the target. Allclassifiers are implemented by k-NN classifier. The availablefeature vectors are divided into two sets: a training set and atesting set. In the numerical results presented in the followingsections, a three-way cross-validation [17] is used. The datais divided into three sets by date (Day 1, Day 2, Day 3) andthree different sets of experiments are performed:
1) Training: Day 1 + Day 2; Testing: Day 32) Training: Day 1 + Day 3; Testing: Day 23) Training: Day 2 + Day 3; Testing: Day 1
Training and testing on feature vectors from different daysis very meaningful in practice. In each run of cross-validation,no prior information is assumed for the testing site or testing
Table IICONFUSION MATRICES OF THE THREE-WAY CROSS-VALIDATION
RESULTS USING SEISMIC, PIR AND FUSION OF THE TWO SENSORS
Seismic Sensor No target Human Animal
No target 76 5 29
Human 16 29 21
Animal 6 13 25
PIR Sensor No target Human Animal
No target 110 0 0
Human 3 51 12
Animal 0 9 35
Sensor Fusion No target Human Animal
No target 110 0 0
Human 1 52 13
Animal 0 1 43
Table IIICOMPARISON OF THE DETECTION AND CLASSIFICATION ACCURACY BY
USING SEISMIC, PIR AND FUSION OF THE TWO SENSORS
Seismic PIR Fusion
Detection 74.5% 98.6% 99.5%
Classification 61.4% 80.4% 87.2%
443

data. The classifiers’ capability to generalize to an independentdata set is thoroughly tested in the three-way cross-validation.
Following Fig. 7, the following cases are tested:1) Detection of target presence against target absence;2) Classification of target type, i.e., Human vs. Animal.Table II shows the confusion matrices of the three-way
cross-validation using seismic sensor, PIR sensor and fusion ofthe two sensors. The shaded area in Table II represents the con-fusion matrices of target classification. Table III summaries thedetection and classification accuracy in Table II. It is observedthat the seismic sensor does not perform well for training andtesting in different test sites. This is because seismic sensoris not site independent; variation in ground impedance andtexture may affect the performance in target detection andclassification. PIR sensors are almost site independent andachieve much higher accuracy than seismic sensors in bothdetection and classification. By using the composite patterngenerated by fusing the signals from seismic and PIR sensors,the detection and classification results are further improved.
V. SUMMARY, CONCLUSIONS AND FUTURE WORK
This paper presents a feature-level fusion method for per-sonnel detection using multimodal sensors. These features areextracted as statistical patterns by constructing xD-Markovmachines from time series data collected from multimodalsensors. An appropriate selection of the basis function andthe scale range allows the wavelet-transformed signal to bede-noised relative to the original noise-contaminated signalbefore partitioning of the resulting wavelet image for symbolgeneration. The xD-Markov machine identifies the cross-dependencies among different sensors and mitigates loss ofsignificant information as compared to set-theoretic informa-tion fusion method. A distinct advantage of the proposedmethod is that the low-dimensional feature vectors, extractedfrom the xD-Markov machine, can be computed in situ andcommunicated in real time over a limited-bandwidth wirelesssensor network with limited-memory nodes.
The proposed method has been validated on a set of fielddata collected from different locations on different days. Acomparative evaluation is performed on the feature vectorsextracted from single seismic and single PIR sensors as wellas the composite pattern generated by fusion of the seismicand PIR sensors using xD-Markov machine. Results show that,while PIR sensors alone perform better than seismic sensorsalone, the co-dependence-aware fusion further improves thedetection and classification performance.
While there are many research issues that need to beresolved before exploring commercial applications of the pro-posed method, the following topics are under active research:
• Exploration of alternative ways for construction of rela-tional PFSAs from wavelet images with mutiple scales;
• Improvement of the feature selection procedure by adopt-ing more advanced methods [15], [16];
• Development of algorithms to extract relational depen-dencies among three or more symbol sequences;
• Comparative evaluation of the proposed sensor fusionmethod with Dempster-Shafer and Bayesian network ap-proaches [17] at the decision fusion level.
ACKNOWLEDGEMENT
This work has been supported in part by the U.S. ArmyResearch Laboratory and the U.S. Army Research Office underGrant No. W911NF-07-1-0376. Any opinions, findings andconclusions or recommendations expressed in this publicationare those of the authors and do not necessarily reflect the viewsof the sponsoring agencies.
The authors would like to thank Dr. Abhishek Srivastavand Mr. Soumik Sarkar for their assistance in developing andimplementing the xD-Markov machine.
REFERENCES
[1] G. L. Goodman, “Detection and classification for unattended groundsensors.” in Proceedings of Information Decision and Control 99, 1999,pp. 419–424.
[2] D. Li, K. Wong, Y. H. Hu, and A. Sayeed, “Detection, classification, andtracking of targets,” IEEE Signal Processing Magazine, vol. 19, no. 2,pp. 17 –29, March 2002.
[3] Y. Tian and H. Qi, “Target detection and classification using seismicsignal processing in unattended ground sensor systems,” in InternationalConference on Acoustics Speech and Signal Processing, 2002.
[4] G. P. Succi, D. Clapp, R. Gampert, and G. Prado, “Footstep detection andtracking,” in Unattended Ground Sensor Technologies and ApplicationsIII, vol. 4393, no. 1. SPIE, 2001, pp. 22–29.
[5] J. Lacombe et al., “Seismic detection algorithm and sensor deploymentrecommendations for perimeter security,” in Unattended Ground, Sea,Air Sensor Technologies & Applications VIII, vol. 6231. SPIE, 2006.
[6] K. M. Houston and D. P. McGaffigan, “Spectrum analysis techniquesfor personnel detection using seismic sensors,” in Unattended GroundSensor Technologies & Applications V, vol. 5090. SPIE, pp. 162–173.
[7] Z. Zhang, X. Gao, J. Biswas, and K. K. Wu, “Moving targets detectionand localization in passive infrared sensor networks,” in Proceedings of10th International Conference on Information Fusion, July 2007.
[8] T. Damarla and D. Ufford, “Personnel detection using ground sensors,”in Unattended Ground, Sea, and Air Sensor Technologies and Applica-tions IX, vol. 6562, no. 1. Orlando, FL, USA: SPIE, 2007, p. 656205.
[9] H. Xing, F. Li, H. Xiao, Y. Wang, and Y. Liu, “Ground target detection,classification, and sensor fusion in distributed fiber seismic sensornetwork,” in Advanced Sensor Systems and Applications III, vol. 6830.SPIE, 2008, p. 683015.
[10] A. Gunatilaka and B. Baertlein, “Feature-level and decision-level fusionof noncoincidently sampled sensors for land mine detection,” IEEETransactions on Pattern Analysis and Machine Intelligence, vol. 23,no. 6, pp. 577–589, 2001.
[11] A. Ray, “Symbolic dynamic analysis of complex systems for anomalydetection,” Signal Processing, vol. 84, no. 7, pp. 1115–1130, 2004.
[12] S. Gupta and A. Ray, “Symbolic dynamic filtering for data-driven patternrecognition,” in Pattern Recognition: Theory and Application. NovaScience Publishers, Hauppage, NY, 2007, ch. 2, pp. 17–71.
[13] S. Sarkar, D. S. Singh, A. Srivastav, and A. Ray, “Semantic sensor fusionfor fault diagnosis in aircraft gas turbine engines,” in Proceedings of2011 American Control Conference, San Francisco, CA, 2011.
[14] X. Jin, K. Mukherjee, S. Gupta, and A. Ray, “Wavelet-based featureextraction using probabilistic finite state automata for pattern classifica-tion,” Pattern Recognition, in press, 2010.
[15] I. Guyon and A. Elisseeff, “An introduction to variable and featureselection,” J. Mach. Learn. Res., vol. 3, pp. 1157–1182, March 2003.
[16] H. Peng, F. Long, and C. Ding, “Feature selection based on mu-tual information criteria of max-dependency, max-relevance, and min-redundancy,” IEEE Transactions on Pattern Analysis and MachineIntelligence, vol. 27, no. 8, pp. 1226 –1238, August 2005.
[17] C. M. Bishop, Pattern Recognition and Machine Learning. Springer,2006.
444