multimodality imaging in cardiovascular disease · multimodality imaging in cardiovascular disease...
TRANSCRIPT

MULTIMODALITY IMAGING IN
CARDIOVASCULAR DISEASE
KAREN S. L. TEO
M.B.,B.S., F.R.A.C.P.
Discipline of Pharmacology
University of Adelaide
Adelaide, SA, 5005
AUSTRALIA
Submitted in the total fulfillment of the requirements
for the degree of Doctor of Philosophy
University of Adelaide
AUSTRALIA
November 2007

DECLARATION
I performed the research presented in this thesis within the Department of
Pharmacology, University of Adelaide, Adelaide, Australia. This work contains
no material which has been accepted for the award of any other degree or
diploma in any university or other tertiary institution and, to the best of my
knowledge and belief, contains no material previously published or written by
another person, except where due reference has been made in the text. I give
consent to this copy of my thesis, when deposited in the University Library,
being made available for loan and photocopying, subject to the provisions of the
Copyright Act 1968.
Dr. Karen S.L. Teo
University of Adelaide
Adelaide
South Australia 5000
AUSTRALIA

TABLE OF CONTENTS
Acknowledgements IV
Publications V
Abstracts VI
Awards IX
List of Abbreviations X
Synopsis XII
CHAPTER 1 INTRODUCTION
1
CHAPTER 2 METHODS
52
CHAPTER 3 CARDIAC MRI ASSESSMENT OF LEFT AND
RIGHT VENTRICULAR PARAMETERS IN
HEALTHY AUSTRALIAN NORMAL VOLUNTEERS
66
CHAPTER 4 ASSESSMENT OF ATRIAL SEPTAL DEFECTS: A
COMPARATIVE STUDY IN ADULT PATIENTS
WITH CARDIAC MAGNETIC RESONANCE AND
TRANSOESPHAGEAL ECHOCARDIOGRAPHY
79
CHAPTER 5 PERCUTANEOUS CLOSURE OF ATRIAL SEPTAL
DEFECTS LEADS TO NORMALISATION OF RIGHT
ATRIAL, RIGHT AND LEFT VENTRICULAR
VOLUMES: VENTRICULAR INTERDEPENDENCE
AND CARDIAC MAGNETIC RESONANCE
IMAGING
94
CHAPTER 6 COMBINATION HIGH-DENSITY LIPOPROTEIN
INFUSION AND ATORVASTATIN
SIGNIFICANTLY REDUCES EXPERIMENTAL
ATHEROSCLEROSIS COMPARED TO EITHER
THERAPY ALONE: SERIAL ANALYSIS WITH
HIGH-RESOLUTION MRI
115
CHAPTER 7 MULTI-DETECTOR CT IMAGING FAILS TO
ACCURATELY QUANTIFY VESSEL WALL
CALCIFICATION: ANALYSIS OF MULTIPLE
ALGORITHMS AND COMPARISON WITH MICRO-
CT
129
CHAPTER 8 DISCUSSION AND SUMMARY
147
REFERENCES 152

IV
ACKNOWLEDGEMENTS
I would like to thank both my supervisors, Professors Stephen Worthley and
Derek Frewin. I am indebted to Professor Worthley for his mentorship and
guidance throughout this thesis. Professor Worthley’s intellect, vision and
infectious enthusiasm have inspired me greatly and have taught me much in all
aspects of research. I also acknowledge his expertise in cardiac imaging, in
particular cardiovascular magnetic resonance that has provided a firm foundation
for me. I would also like to thank Professor Frewin for his guidance, wisdom and
support from the time that we first embarked on the project as well as throughout
this thesis.
I acknowledge my fellow co-workers of the Cardiovascular Research Centre at
the Royal Adelaide Hospital for their help with work related to the projects and to
Adelaide Cardiac Imaging for the use of both CMR and CT for our research
projects.
I also acknowledge scholarships and financial support from the Royal Adelaide
Hospital (Dawes scholarship), the Cardiac Society of Australia and New Zealand
(CSANZ research scholarship), Pfizer Cardiovascular Research Scholarship and
the CVL Research grant (Pfizer Australia).
Thanks also to my family and friends for their support during this thesis. I
especially want to thank my parents, Jenny and Pek Kim Teo for their love,
guidance and encouragement throughout my life. Finally, I give thanks to God.
V
THESIS RELATED PUBLICATIONS
ORIGINAL RESEARCH
Teo KSL, Carbone A, Piantadosi C, Chew DP, Hammett CJ, Brown MA,
Worthley SG. Cardiac MRI assessment of left and right ventricular
parameters in healthy Australian normal volunteers. Heart Lung and
Circulation 2008 (in press).
RELATED WORK
Duncan RF, Teo KSL, Worthley SG. Heart Lung and Circulation 2007.
Cardiac magnetic resonance documentation of a double atrial septal defect
before and after percutaneous closure with an Amplatzer septal occluder. Int J
Cardiol. 2007 (in press).
O’Hanlon R, Teo KSL, Buchiarelli-Ducci C, Pennell DJ. Perfusion CMR and
SPECT in hypertrophic cardiomyopathy. Int J Cardiol. 2007 (in press).
Teo KSL, Roberts-Thomson KC, Worthley SG. Utility of intravascular
ultrasound in the diagnosis of ambiguous calcific left main stenoses. J
Invasive Cardiol. 2004 Jul; 16(7): 385.
Roberts-Thomson KC, Teo KSL, Stuklis R, Worthley SG. Left atrial
myxoma: magnet or echo? Intern Med J. 2004 Apr; 34(4): 210-1.
PRESENTATIONS
Cardiovascular MR Advances and Read with the Experts: 10th Annual
Course, National Heart and Lung Institute, London. November 2006. Read
with the experts session (Cases in Heart Failure: Co-presenter).

VI
THESIS RELATED ABSTRACTS
Teo KSL, Korlaet M, Lott C, Brown MA, Worthley SG. Comparison of four
and sixteen detector MDCT for noninvasive coronary angiographic imaging.
51st Scientific Sessions of the Cardiac Society of Australia and New Zealand,
Adelaide, August 2003.
Teo KSL, Ellis C, Lennon-George J, Fowler SM, Keenan RJ, Worthley SG.
Cardiac MRI determines reproducibly left ventricular parameters in normal
volunteers. 51st Scientific Sessions of the Cardiac Society of Australia and
New Zealand, Adelaide, August 2003.
Teo KSL, Ellis C, Lennon-George J, Keenan RJ, Worthley SG. Cardiac MRI
determines reproducibly left ventricular parameters in normal volunteers.
Royal Australian and New Zealand College of Radiologists 54th Annual
Scientific Meeting, Brisbane, September 2003.
Teo KSL, Parkin G, Keenan RJ, Brown MA, Worthley SG. Tricuspid valve
position using Cardiac MRI: Establishment of a surface anatomical algorithm
for central venous pressure zero point. Royal Australian and New Zealand
College of Radiologists 54th
Annual Scientific Meeting, Brisbane, September
2003.
Lott C, Teo KSL, Korlaet M, Brown MA, Worthley. Comparison of Four and
Sixteen Multi-detector CT for non-invasive coronary angiographic imaging.
Royal Australian and New Zealand College of Radiologists 54th Annual
Scientific Meeting, Brisbane, September 2003.
Teo KSL, Ellis CA, Lennon-George J, Worthley SG Assessment of Atrial
Septal Defects: A comparative study in adult patients with cardiac magnetic
resonance and transoesophageal echocardiography. 52st Scientific Sessions of
the Cardiac Society of Australia and New Zealand, Brisbane, August 2004.
Heart Lung Circulation 2004; 13(Supp) 2:S57.
Teo KSL, Campbell P, Zaman AG, Worthley SG. Coronary Artery Bypass
Graft Assessment with multi-detector CT in asymptomatic patients. 52st
Scientific Sessions of the Cardiac Society of Australia and New Zealand,
Brisbane, August 2004. Heart Lung Circulation 2004;13(Supp)2:S58
Teo KSL, Ellis CA, Lennon-George J, Worthley SG. Assessment of Atrial
Septal Defects: A comparative study in adult patients with cardiac magnetic
resonance and transoesophageal echocardiography. European Society of
Cardiology Congress, Munich, Germany, August 2004.
Brown G, Pontre B, Teo KSL, Taylor J, St.Pierre T, Chua-anusorn W,
Worthley SG T2* Relaxometry in Secondary Haemochromatosis: Impact of
Techinical Variations. 13th Scientific Meeting & Exhibition of the
International Society for Magnetic Resonance in Medicine, Miami, Florida,
May 2005
Teo KSL, Grieve SM, Hammett, CJK, Piantadosi C, Chew DP, Korlaet M,
Worthley SG. Common Carotid artery wall assessment with MRI: variations

VII
between patients with severe versus absent internal carotid disease. 53rd
Scientific Sessions of the Cardiac Society of Australia and New Zealand,
Perth, August 2005
Teo KSL, Piantadosi C, Hammett CJK, Ellis CA, Lennon-George J,
Worthley SG. Utility of cardiovascular magnetic resonance in assessing
cardiac volumes pre- and post- percutaneous ASD closure: A serial study.
53rd
Scientific Sessions of the Cardiac Society of Australia and New Zealand,
Perth, August 2005. Heart Lung Circulation 2005;14S-S39.
Hammett CJK, Teo KSL, Piantadosi C, Grieve SM, Chew DP, Lennon-
George J, Ellis CA, Worthley SG. Assessment of common and internal
carotid artery vessel wall area: a feasibility study using high resolution MRI.
53rd
Scientific Sessions of the Cardiac Society of Australia and New Zealand,
Perth, August 2005. Heart Lung Circulation 2005; 14(Supp) 1:S40.
Grieve SM, Teo KSL, Piantadosi C, Hammett CJK, Worthley SG. Algorithm
for co-registration and analysis of mulit-contrast MRI sequence: utility in
carotid atherosclerosis. 53rd
Scientific Sessions of the Cardiac Society of
Australia and New Zealand, Perth, August 2005. Heart Lung Circulation
2005; 14(Supp) 1-S41.
Pontre B, Brown G, Teo KSL, Chua-anusorn W, St.Pierre T, Worthley SG.
Iron Deposition patterns in the liver and heart of patients with beta-
Thalassaemia: an MRI analysis. 53rd
Scientific Sessions of the Cardiac
Society of Australia and New Zealand, Perth, August 2005. Heart Lung
Circulation 2005;14S:S39.
Farquharson AL, Magarey J, Teo KSL, Roberts-Thomson K, Hutchinson
MR. Comparison of manual anterolateral cardioversion with remote
anteroposterior cardioversion of atrial fibrillation using current biphasic
defibrillation. 53rd
Scientific Sessions of the Cardiac Society of Australia and
New Zealand, Perth, August 2005.
Hammett CJK, Teo KSL, Piantadosi C, Grieve SM, Chew DP, Lennon-
George J, Ellis CA, Worthley SG. Assessment of common and internal
carotid artery vessel wall area: a feasibility study using high resolution MRI.
European Society of Cardiology Congress, Stockholm, Sweden September
2005.
Teo KSL, Piantadosi C, Brown MA, Worthley MI, Disney PJ, Hammett CJK,
Waddy PJ, Sanders P, Worthley SG. Percutaneous closure of atrial septal
defects leads to a reduction in right ventricular volumes and corresponding
normalisation of left ventricular volumes: ventricular interdependence and
cardiac MRI. 54th
Scientific Sessions of the Cardiac Society of Australia and
New Zealand, Canberra, August 2006. Heart, Lung and Circulation 2006;15S-
83.
Teo KSL, Grieve SM, Worthley MI, Korlaet MB, Brown MA, Fitridge R,
Thomas A, Carbone A, Worthley SG. Multi-detector CT imaging fails to
accurately quantify vessel wall calcification: analysis of multiple algorithms
and comparison with micro CT. 54th
Scientific Sessions of the Cardiac Society
VIII
of Australia and New Zealand, Canberra, August 2006. Heart, Lung and
Circulation 2006;15S-85.
Teo KSL, Nicholls SJ, Kee P, Rye KA, Barter PJ, Worthley SG.
Combination high-density lipoprotein infusion and atorvastatin significantly
reduces experimental atherosclerosis compared to either therapy alone: serial
analysis with high-resolution MRI. 54th
Scientific Sessions of the Cardiac
Society of Australia and New Zealand, Canberra, August 2006. Heart, Lung
and Circulation 2006;15S-86.
Greenwell TH, Teo KSL, Chew DP, Hammett CJK, Piantadosi C, Carbone
A, Worthley MI, Worthley SG. Early Atherosclerotic Disease in the Carotid
and Coronary Territories in At-Risk Individuals. 54th
Scientific Sessions of the
Cardiac Society of Australia and New Zealand, Canberra, August 2006.
Heart, Lung and Circulation 2006; 15S-111. Heart Lung Circulation 2006; 15
(Supp) 1:S47.
Teo KSL, Nicholls SJ, Kee P, Rye KA, Barter PJ, Worthley SG.
Combination high-density lipoprotein infusion and atorvastatin significantly
reduces experimental atherosclerosis compared to either therapy alone: serial
analysis with high-resolution MRI. European Society of Cardiology
Congress, Barcelona, Spain September 2006. European Heart Journal
2006,27(1): 827, P 5517.
Piantadosi C, Worthley MI, Teo KSL, Nalivaiko E, McAinch A, Wittert GA,
Worthley SG. Effects of obesity and diet induced weight loss on
Cardiovascular risk factors, vascular and ventricular structure and function in
obsess men. International Atherosclerosis Society Scientific Sessions, Rome,
Italy June 2006.
Leung MCH, Brown GC, Young AA, Cowan BR, Pontré B, Teo KSL, St.
Pierre T, S.G. Worthley SG. 3D MRI Myocardial Strain in Patients with
Transfusion-Induced Haemochromatosis. 55th Scientific Sessions of the
Cardiac Society of Australia and New Zealand, Christchurch, August 2007.
Heart, Lung and Circulation 2007; 16 (Supp 2), S45.
Liew G, Hammett C, Dundon B, Teo KSL, M. Worthley MI, Nicholls SJ,
Zaman A, Worthley SG Multi-Detector Computed Tomography (MDCT) and
Magnetic Resonance Imaging (MRI) Non-Invasively Quantifies Saphenous
Vein Graft Atherosclerotic Plaque: A Comparison with Intravascular
Ultrasound (IVUS). 55th Scientific Sessions of the Cardiac Society of
Australia and New Zealand, Christchurch, August 2007. Heart, Lung and
Circulation 2007; 16 (Supp 2), S45.
Liew G, Hammett C, Dundon B, Teo KSL, Worthley MI, Nicholls SJ,
Zaman A, Worthley SG. Predictors of Atheroembolic Complications During
Saphenous Vein Graft Percutaneous Coronary Intervention. 55th Scientific
Sessions of the Cardiac Society of Australia and New Zealand, Christchurch,
August 2007. Heart, Lung and Circulation 2007; 16 (Supp 2), S105.

IX
THESIS RELATED AWARD
Oral Presentation Winner: Diagnostic Imaging Paper (Mayne Health Scientific
Paper Prize). Annual Scientific Sessions of the Royal Australian and New
Zealand College of Radiology 2003, Brisbane, Australia
Abstract: Cardiac MRI determines reproducibly left ventricular parameters in
normal volunteers.
Authors: Teo KSL, Ellis C, Lennon-George J, Fowler SM, Keenan RJ, Worthley
SG.

X
LIST OF ABBREVIATIONS
ASD Atrial septal defect
CAC Coronary Artery Calcium
CNR Contrast-to-Noise
CT Computerised Tomography
CMR Cardiovascular Magnetic Resonance
EBCT Electron Beam Computerised Tomography
ECG Electrocardiograph
ESP Echo Spacing
ETL Echo Train Length
FOV Field Of View
FSE Fast Spin Echo
Gd-DTPA Gadolinium-DiethyleneTriamine PentaAcetate
HDL High Density Lipoprotein
HU Hounsfield Units
IVUS Intravascular Ultrasound
LAD Left Anterior Descending
LCx Left Circumflex
LDL Low Density Lipoprotein
LV Left ventricle
MHz Megahertz
MRI / MR Magnetic Resonance Imaging / Magnetic Resonance
MWT Mean Wall Thickness
NMR Nuclear Magnetic Resonance
PDW Proton Density Weighted
PET Positron Emission Tomography
RCA Right Coronary Artery
RF Radiofrequency
RV Right ventricle
SD Standard Deviation
SEM Standard Error of the Mean
SSFP Steady-state free precession
T Tesla
TE Echo Time

XI
TGF- Transforming Growth Factor-
TI Inversion Time
TOF Time Of Flight
tPA tissue-type Plasminogen Activator
TR Recovery Time
T1W T1 Weighted
T2W T2 Weighted
VCAM-1 Vascular Cellular Adhesion Molecule-1
VEC Velocity Encoded Contrast
VWA Vessel Wall Area

XII
SYNOPSIS
The non-invasive cardiovascular imaging modalities, cardiovascular magnetic
resonance (CMR) and multi-detector computer tomography (MDCT) are playing
an increasing role in both clinical and research settings.
CMR is a unique imaging modality due to unsurpassed contrast between soft
tissue structures that is non-invasive, does not use ionising radiation and is able to
provide high-resolution information about cardiac anatomy, function, flow,
perfusion, viability and metabolism. It has provided the gold standard in imaging
in congenital heart disease. Recent advances in this technology have led to
images of high spatial and temporal resolution that has made the characterisation
of atheroma possible. While currently spatial resolution still limits its ability to
characterise atheroma in native human coronary arteries in living patients, CMR
imaging of the coronary arteries has future potential with further technological
and sequence advances.
MDCT has been used in clinical settings to measure of the amount of
calcification in the coronary arteries with “coronary artery calcium scoring” of
the coronary tree a surrogate marker of atherosclerosis. MDCT has also become
the gold standard for angiographic imaging in most arterial beds such as the
carotid and peripheral vascular systems. In the coronary arteries in particular,
there have been major advances in the accuracy of coronary MDCT angiography,
particularly with regards to its negative predictive value, although excessive
calcification and blooming artefacts still limit the diagnostic accuracy of the
technique for assessing stenotic severity.

XIII
In this thesis, our aims were to address some specific novel areas advancing the
utility of these imaging modalities in two major areas of interest, namely
congenital heart disease and atheroma imaging.
Our first step was to validate the accuracy and reproducibility of CMR, the main
imaging modality we utilised. To achieve this, we assessed MR imaging of
cardiac volumes and function in a normal adult Australian population with a
specific focus on the reproducibility of the technique. In confirming that this
technique in our hands is both accurate and reproducible, we would then be in a
position to be able to confidently use this technique in our future chapters.
However, more than this, we sought to establish some normal ranges for left and
right atrial and ventricular parameters in our local population. This would be
crucial background information for us to be able to make comparisons with future
studies in patients with congenital heart disease.
Having established our technique and reference ranges, we would then explore
the two specific issues in the ensuing two chapters using CMR in one area of
congenital heart disease, atrial septal defect. Atrial septal defect is the most
common congenital heart defect first diagnosed in adults. The traditional method
of assessment of these patients and for suitability for ASD closure involves semi-
invasive investigation with transoesophageal echocardiography (TOE) for
measurement of the defect size and atrial septal margins. MRI assessment of
patients prior to percutaneous device closure compared to TOE assessment would
provide information on the accuracy of TOE assessment and provide information
of the utility of cardiac MRI as an alternative to TOE for the work-up of these
patients prior to ASD closure.

XIV
In our third original research chapter, we utilised CMR to understand the effects
of percutaneous ASD closure on cardiac chamber volumes. We achieved this by
assessing with cardiac MRI pre-closure and post-closure atrial and ventricular
cardiac volumes. Longstanding right heart dilatation in the setting of an ASD may
lead to complications including right heart failure, pulmonary hypertension and
arrhythmia. Closure of the ASD should reduce right heart volumes by removing
left-to-right shunting and lead to normalisation of ventricular volumes. The
assessment of atrial volume changes with ASD closure may be important in
furthering our understanding in its contribution to arrhythmia.
Having assessed the ability of CMR to assess both the ASD dimensions, and
therefore suitability for percutaneous closure, as well as the effects of ASD
closure on cardiac chamber size, we look in the final two original research
chapters to move to another area of research development with these high-
resolution imaging technologies, atherosclerosis imaging. Two particular areas
we wished to focus on included the potential of high-resolution MR imaging to
monitor effects of HDL infusion on atherosclerosis, and secondly to explore
mechanisms behind limitations in MDCT imaging of atherosclerosis, specifically
calcification and blooming artifacts.
For assessing the effects of HDL infusion on atherosclerosis, we utilised a
cholesterol-fed rabbit model of atherosclerosis. The abdominal aorta of the rabbit
is comparable in size to the human coronary artery. Previous work with the rabbit
model of atherosclerosis and magnetic resonance imaging of the aortic wall has

XV
shown that it can provide information about atherosclerotic composition as well
as provide serial data of the arterial wall. While high intensity lipid-lowering with
statins remains the first line management of at risk individuals, modest
manipulations of serum HDL levels are associated with a significant impact on
cardiovascular risk. Thus, we assessed the effect of HDL infusion and
atorvastatin in a rabbit model of using MRI aortic atherosclerosis as the end-
point.
In our fifth and final original research chapter, we assessed the accuracy of
quantification of atherosclerotic calcification with MDCT in the carotid arteries
of patients undergoing carotid endarterectomy, and sought to identify algorithms
or techniques that may improve quantification of calcification. This would
potentially lead to an improvement in the ability of MDCT techniques to quantify
stenotic severity in coronary arteries that were calcified. To achieve these we
utilised MDCT in vivo and in comparison with carotid endarterectomy specimen
micro-CT. Importantly, as part of this study, we undertook a thorough assessment
of reproducibility of these techniques.
Thus, in summary, we have been able to confirm the accuracy and reproducibility
of CMR and MDCT in the areas of a specific congenital defect (ASD) and
atherosclerosis imaging, and utilised these techniques to advance our
understanding of these disease states. This thesis identifies strengths and
weaknesses of these techniques that will allow us to more appropriately use them
for future purposes in cardiovascular disease. Future work directly stemming
from this thesis has already begun, and now looks to address issues of whether
CMR and MDCT may provide complimentary information about atherosclerotic

XVI
lesions that may benefit outcomes in certain conditions. Specifically the work in
this thesis has led to studies commencing in carotid atherosclerosis and saphenous
vein graft atherosclerosis and using these imaging techniques to potentially
predict adverse future outcomes.

1
Chapter 1
INTRODUCTION

2
TABLE OF CONTENTS
Chapter 1................................................................................................................ 1
Introduction ........................................................................................................... 1
1. 1. Background .................................................................................................... 4
1. 2. Cardiovascular Magnetic Resonance ............................................................ 5
1. 2. 1. Magnetic Resonance Basics.......................................................................................6
1. 2. 2. MR pulse sequences....................................................................................................7
1. 2. 2. 1. Spin Echo Imaging..............................................................................................................8
1. 2. 2. 2. Gradient Echo Imaging.................................................................................................... 10
1. 2. 2. 3. Steady-state free precession cine MRI ........................................................................... 11
1. 2. 3. CMR of Ventricular Function ................................................................................11
1. 2. 3. 1. Accuracy of CMR............................................................................................................ 12
1. 2. 3. 2. Reproducibility of CMR.................................................................................................. 12
1. 2. 3. 3. Image acquisition ............................................................................................................. 13
1. 2. 3. 4. CMR pulse sequences...................................................................................................... 14
1. 2. 3. 5. Assessment of the right ventricle.................................................................................... 15
1. 2. 3. 6. Limitations of CMR in ventricular assessment.............................................................. 15
1. 2. 4. Myocardial tagging...................................................................................................16
1. 2. 5. CMR of Myocardial Viability .................................................................................17
1. 2. 5. 1. Myocardial viability......................................................................................................... 17
1. 2. 5. 2. CMR sequences in viability assessment......................................................................... 18
1. 2. 5. 3. Clinical Application......................................................................................................... 19
1. 2. 6. CMR in Congenital Heart Disease .........................................................................21
1. 2. 6. 1. Defining anatomy in Congenital Heart Disease............................................................. 21
1. 2. 6. 2. Defining function and physiology in Congenital Heart Disease .................................. 22
1. 2. 6. 3. CMR pulse sequences in Congenital Heart Disease...................................................... 23
1. 2. 6. 4. Clinical applications for CMR in Congenital Heart Disease ........................................ 25

3
1. 2. 7. CMR assessment of atherosclerosis .......................................................................25
1. 2. 7. 1. Atherosclerotic plaque components with MR imaging................................................. 27
1. 2. 7. 2. MR imaging of coronary arteries .................................................................................... 30
1. 2. 7. 3. MRI studies of carotid artery atherosclerosis................................................................. 32
1. 3. Cardiac Computed Tomography................................................................. 34
1. 3. 1. Background................................................................................................................34
1. 3. 2. MDCT Basics.............................................................................................................34
1. 3. 3. Coronary artery calcification..................................................................................36
1. 3. 3. 1. Pathophysiology............................................................................................................... 36
1. 3. 3. 2. Coronary artery calcium estimation with CT................................................................. 38
1. 3. 3. 3. Clinical Implications of Coronary Artery Calcification................................................ 39
1. 3. 4. Computed Tomography Coronary Angiography................................................41
1. 3. 5. Atherosclerotic Plaque Imaging with CT .............................................................43
1. 4. Micro computed tomography ...................................................................... 46
1. 4. 1. Background................................................................................................................46
1. 4. 2. Micro CT Basics........................................................................................................46
1. 4. 3. Micro CT application ...............................................................................................47
1. 5. Aims of the thesis.......................................................................................... 48

4
1. 1. BACKGROUND
Cardiovascular disease due to the complications of atherosclerosis remains the
leading cause of premature death and disability in Western Society. It causes 38% of
all deaths in Australia (Australian Institute of Health and Welfare. et al. 2004) and
the total burden of cardiovascular disease is expected to increase due to an
increasingly elderly population. The prevention, identification and management of
coronary heart disease remain a significant challenge. Non-invasive cardiovascular
imaging modalities including the newer technologies of cardiovascular magnetic
resonance and multi-detector computer tomography are playing an increasing role in
both clinical and research settings. In particular, these modalities have the potential
to increase our recognition and understanding of cardiovascular disease in both
symptomatic and asymptomatic individuals.
Cardiovascular magnetic resonance (CMR) is a unique imaging modality due to
unsurpassed contrast between soft tissue structures. It is non-invasive, does not use
ionising radiation and is able to provide high-resolution information about cardiac
anatomy, function, flow, perfusion, viability and metabolism. CMR has become the
gold standard imaging in certain areas of congenital heart disease and there are
increasing roles for CMR in the assessment of paediatric and adult patients with
congenital heart disease (Wood 2006). Recent advances in CMR technology have led
to images of high spatial and temporal resolution that has made the characterisation
of atheroma possible (Cai et al. 2005; Helft et al. 2001; Worthley et al. 2000). While
spatial resolution still limits its ability to characterise atheroma in native human
coronary arteries in living patients, CMR imaging of the coronary arteries has future
potential with further technological and sequence advances.

5
Multidetector computer tomography (MDCT) has been used in clinical settings to
measure the amount of calcification in the coronary arteries with coronary artery
calcium scoring of the coronary tree as a surrogate marker of atherosclerosis. MDCT
has also become the gold standard for angiographic imaging in most arterial beds
such as the carotid and peripheral vascular systems. In the coronary arteries, there
have been major advances in the accuracy of coronary MDCT angiography,
particularly with regards to its negative predictive value, although excessive
calcification and blooming artefacts still limit the diagnostic accuracy of the
technique for assessing stenotic severity.
1. 2. CARDIOVASCULAR MAGNETIC RESONANCE
Cardiovascular magnetic resonance (CMR) has in recent years emerged as a non-
invasive cardiovascular imaging modality with increasing application in both clinical
and research settings. CMR is able to provide information about cardiac anatomy,
function, flow, perfusion and metabolism. It is completely non-invasive and does not
use ionising radiation. It allows the free choice of tomographic planes. Of all the
imaging modalities currently available, it provides the greatest intrinsic contrast
between soft tissue structures producing images of high spatial and temporal
resolution. Its limitations are the relatively long imaging time, relative isolation of
the patient from medical care during image acquisition and contraindications in
patients with certain metallic implants such as permanent pacemakers and
intracerebral metallic clips. There are also a small, but significant number of patients
who are unable to undergo CMR imaging because of claustrophobia.

6
1. 2. 1. Magnetic Resonance Basics
Magnetic resonance (MR) imaging is based on the detection of hydrogen ions
(protons), largely water and fat within the body. These protons have an intrinsic
angular momentum or spin and the frequency of the spin is related to the magnitude
of the magnetic field and its intrinsic gyromagnetic ratio. The proton spins in a
magnet are randomly distributed around the axis of a magnet and as a result, there is
no net signal to detect. When placed within a strong magnetic field, a person
becomes partially magnetised due to the effect associated with hydrogen ions
(protons) within the body. To detect a MR signal, a magnetic field is applied
perpendicular to the main magnetic field, which causes the protons in the body to be
aligned. By subjecting the person to different and subsequent magnetic fields
perpendicular to the first magnetic field, the vector of magnetisation within the
person changes. These changing magnetic fields emit radiofrequency waves and the
collection of this information is detected with receiver coils that can be translated
into the final MR image.
The characteristics of these radiofrequency waves and subsequent signals detected
are determined by many factors. This includes the parameters of MR techniques,
such as relaxation times, proton density, motion and flow, molecular diffusion,
magnetization transfer and changes in susceptibility. The signals detected are also
affected by the tissues themselves which allows for the accurate differentiation
between the soft tissue components of the body.
Following a radiofrequency (RF) excitation pulse, each voxel will contain a certain
amount of precessing net magnetization, which will then induce an oscillating
current or signal in the RF receiver coil. In time, the signal from each voxel will

7
decay under the influence of the various relaxation processes T1, T2 and T2*. T1
determines the loss of transverse magnetization as it relaxes back to the longitudinal
axis. T2 and T2* characterise the phase coherence of the remaining net
magnetization in the transverse plane.
Tissues with different relaxation properties will lead to a signal difference or
contrast, which can be used to distinguish different voxels from each other and thus
distinguish different tissue types. A T1 weighted image has a contrast that shows
high signal intensity for those voxels containing tissues with short T1 values and low
signal for voxels with tissues having long T1 values. A T2 weighted image has high
signal for voxels containing tissues with long T2 values and low signal for voxels
containing tissues with short T2 values. A proton-density weighted image, a
measurement of the net magnetization before any of the relaxation processes have
had a significant effect, has a high signal from voxels with a high equilibrium net
magnetization (Lardo 2003).
A great strength of MRI is the ability to create many different image contrasts by
manipulating the image timing parameters, thus enabling the differentiation of
various tissues.
1. 2. 2. MR pulse sequences
There are three main imaging sequences that are currently being used: gradient echo
imaging, spin echo imaging and steady-state free precession imaging.
To sample data for all of k-space, pulses (RF pulse, frequency encoding, phase
encoding gradients) must be repeated a number of times to reconstruct a 2D image.

8
In successive repetitions, the amplitude of the phase-encoding gradient is changed to
sample different lines of k-space. The time to repeat the pulses is called the repetition
time (TR). The time from the centre of the RF pulse to the echo peak is called the
echo time (TE).
1. 2. 2. 1. Spin Echo Imaging
Spin echo imaging is able to provide excellent discrimination between various
components of the heart. This imaging sequence has traditionally been used for the
imaging of static phenomena such as myocardial wall thickness, cardiac chamber
volumes and intracardiac thrombus.
In a spin echo sequence, spins are first excited by a 90 degree RF pulse in the
presence of a slice-selection gradient. However, in contrast to gradient echo imaging,
a spin echo pulse sequence then uses a refocusing RF pulse (180 degree pulse) to
eliminate signal loss due to static magnetic field inhomogeneity. This refocusing
pulse is placed at the time t=TE/2 and flips the transverse magnetization during the
subsequent period of duration TE/2 that phase accumulation due to static magnetic
field inhomogeneity cancels the phase accumulation of the initial period TE/2. The
echo that refocuses at the time TE is referred to as a spin echo and this is
significantly less sensitive than a gradient echo due to signal loss from static field
inhomogeneity. In spin echo imaging, blood flowing rapidly through the image plane
appears dark (“black blood” images) as any spins that are excited by the initial 90
degree radiofrequency pulse dephase and are rephased by the subsequent 180 degree
radiofrequency pulse. Spin echo sequences have a generally increased tissue contrast
and relatively reduced sensitivity to small magnetic field inhomogeneities caused by
metallic implants (Manning and Pennell 2002).

9
Conventional spin echo imaging acquires a single line of k-space data per slice and
this is susceptible to respiratory artefacts. To overcome this, techniques that utilise
shorter imaging times are used. The fast or turbo spin echo sequence encodes for
multiple k-space lines after a single 90 degree radiofrequency excitation pulse via a
train of refocusing 180 degree radiofrequency pulses. This produces shorter imaging
time and reduced respiratory motion artefacts. In addition, to ensure that a signal
from blood is adequately suppressed, a double inversion recovery magnetization
preparation pulse is used (Simonetti et al. 1996). A slice-selective inversion pulse
then restores the magnetization within the imaged slice.
In T1-weighted images, the repetition time (TR) is short relative to T1 and TE is
short relative to T2. In T2-weighted images, TR is long (usually equal to 2 or more
R-R intervals) and TE is long. In proton density weighted images, TR is long and TE
is short. To generate an image of a specific spatial resolution and image field of view
(FOV), data for a minimal set of spatial frequencies or k-space lines must be
sampled. In each R-R interval, data at different spatial locations are acquired with the
same k-space encoding value and therefore images at different spatial locations are at
a different temporal phase of the cardiac cycle. Only one k-space is acquired per
cardiac trigger and thus a scan with 128 k-spaces in the phase encoding direction will
take 128 heartbeats to complete for a T1-weighted image or 256 beats for a T2-
weighted image where TR is equal to 2 R-R. Spin-echo images are usually acquired
with 2 signal averages. T2 weighted images are lower quality compared to T1-
weighted images because of the lower signal-to noise ratio due to the longer TE and
longer acquisition time.

10
1. 2. 2. 2. Gradient Echo Imaging
A gradient echo sequence uses a single slice-selective RF pulse of flip-angle
generally 90 degrees. There is no slice-selective refocusing pulse and subsequent
slice-selective excitation results in partial saturation of the spins remaining. As blood
flowing into the slice during the interpulse interval has been affected by the earlier
pulses, it contributes to a greater signal than stationary tissue (Manning and Pennell
2002). Thus, in gradient echo imaging, flowing blood appears white (“bright blood”
imaging). The gradient echo-sequence can be repeated rapidly using a reduced flip
angle so that saturation does not occur and allows for cardiac cine imaging of the
heart for the assessment of myocardial function and vascular lumen angiography
(Mohiaddin 2002). Real-time imaging is possible with the advent of extremely rapid
image acquisition (10 to 15 images per second).
However, gradient echo imaging provides less tissue contrast compared with spin
echo imaging. The gradient echo images are mainly T1-weighted and are
characterised by short sequence repetition times, flip angles of less than 90 degrees
and greater signal intensity of the ventricular blood pool compared to that of
myocardium.
Gradient echo cine imaging can be sensitive to signal loss due to inhomogeneity of
the static magnetic field from the interaction of the applied magnetic field with
multiple tissues such as the heart, lung and liver that have different magnetic
susceptibilities. The amount of spin dephasing increases linearly with TE, thus to
minimise these artefacts, short TE is important in gradient echo imaging.

11
1. 2. 2. 3. Steady-state free precession cine MRI
Conventional gradient echo imaging uses RF excitation pulses to create transverse
magnetization from longitudinal magnetization, then samples the signal generated by
precessing transverse magnetization while a gradient echo is formed. A gradient
pulse is then applied to cause phase incoherence of the transverse magnetization
(also called “spoiling” of the transverse magnetization) before the sequence is
repeated.
Improvement of gradient hardware capable of fast slew rates and high gradient
strengths has resulted in a newer technique called steady-state free precession (SSFP)
imaging. These sequences rephase, rather than discard or “spoil” the transverse
magnetization as in conventional gradient echo imaging and thus, the transverse
magnetization can be used to achieve higher signal to noise ratio and improved
blood-myocardium contrast (Moon et al. 2002), while also allowing allows faster
imaging times.
Blood appears very bright in SSFP images because T2/T1 is large while myocardium
appears relatively dark on SSFP because T2/T1 is small. SSFP imaging is now used
in the assessment of cardiac function as well as in other applications such as
myocardial perfusion and myocardial viability assessment.
1. 2. 3. CMR of Ventricular Function
CMR is an accurate and reproducible tool for the assessment of both left and right
ventricular function assessment (Longmore et al. 1985; Semelka et al. 1990). The
information that can be obtained in a single examination includes cardiac anatomy,
ventricular volumes, ventricular mass and ejection fraction which provide both

12
diagnostic and prognostic information (Haider et al. 1998; Rehr et al. 1985; Semelka
et al. 1990). As it is non-invasive and does not utilise ionising radiation, it is ideal for
serial assessments such as the assessment of response to therapeutic interventions in
both clinical and research settings that will help to further our understanding of the
effects of such therapies.
1. 2. 3. 1. Accuracy of CMR
The accuracy of ventricular volume measurements has been shown in ex vivo studies
that have compared CMR assessment of left ventricles with water displacement
volumes of human cadaveric casts of the left ventricle (Longmore et al. 1985; Rehr
et al. 1985) and right ventricle (Jauhiainen et al. 1998). Measurement of LV mass by
CMR has been validated in human autopsy hearts and in animals (Katz et al. 1988)
while right ventricular mass measurements have been validated against ex vivo
animal hearts (Katz et al. 1993).
1. 2. 3. 2. Reproducibility of CMR
Echocardiography is a widely available, non-invasive technique that is used for
assessment of the left ventricle. However, image acquisition depends on the operator
and acoustic window. It also relies on geometric assumptions, in particular in M-
mode echocardiography, where a single basal slice is used to calculate ejection
fraction and left ventricular mass. The left ventricle is assumed to have a uniform
geometric shape with no regional variation in wall thickness or thickening. Two-
dimensional echocardiography is more accurate and reproducible than with M-mode
echocardiography as it takes into account the length of the cavity as well as
thickness. This is based on Simpson’s biplane method of discs and relies on

13
planimetry of the endocardial border in end-diastolic and end-systolic frames.
However, this still assumes an ellipsoid shape, a uniform wall thickness and good
visualisation of the endocardial border which is not seen in up to one-third of patients
(Bellenger et al. 2000; Teichholz et al. 1976).
CMR has the advantages of being independent of geometric assumptions (Doherty et
al. 1992) and has been shown to be both accurate (Longmore et al. 1985) and
reproducible (Alfakih et al. 2003; Grothues et al. 2004; Semelka et al. 1990). CMR
has improved inter-study reproducibility in the assessment of left and right
ventricular volumes, function and mass. When directly compared to 2D
echocardiography, the interstudy reproducibility coefficient of variability was
superior for CMR for all parameters (LV ESV 4.4 to 9.2 % versus 13.7% to 20.3%,
LV EF 2.4 to 7.3% versus 8.6 to 19.4%, LV mass 2.8% to 4.8% versus 11.6% to
15.7%, p < 0.001) {Grothues, 2002 #391}. The improved reproducibility for CMR
has also been shown to result in significant reductions in sample sizes required in
studies using CMR (reductions of 55 to 93%) compared to echocardiography
(Bellenger et al. 2000; Grothues et al. 2004). Thus, CMR allows reproducible serial
assessments of ventricular parameters and monitoring of remodelling with therapy.
1. 2. 3. 3. Image acquisition
The ventricular assessment with CMR is performed in a standardised way, with the
acquisition of long-axis cine images as well as a stack of 10 to 12 long axis images.
A cine image is acquired in a breath-hold of about 10 seconds and a ventricular stack
acquired in about 5 minutes. All images are acquired over several cardiac cycles
during a breath-hold. The final image is averaged from the data acquired across these
cardiac cycles. Images are electrocardiograph (ECG)- gated either prospectively or

14
retrospectively. Retrospective ECG gating by the scanner ensures that the end of
diastole is not missed, which may occur with the earlier prospective triggering
approaches (Gatehouse and Firmin 2000).
1. 2. 3. 4. CMR pulse sequences
There are two main pulse sequences used for the assessment of ventricular volumes
and function. The first is with conventional gradient-echo sequences that have been
shown to be accurate and reproducible (Pattynama et al. 1993; Semelka et al. 1990;
Shapiro et al. 1989). The second, more recent technique is with steady-state free
precession (SSFP) imaging. Steady-state free precession sequences have been
designated as fast imaging with steady-state precession (FISP), balanced fast-field
echo imaging; or fast imaging employing steady-state acquisition (FIESTA)
depending on the manufacturer.
SSFP sequences rephase the transverse magnetization that undergoes dephasing
during phase encoding and readout between radiofrequency pulses, and imaging
occurs when all transverse and longitudinal magnetisation components are at steady
state. This improves the signal to noise ratio, thus improving blood-myocardium
contrast and also allows faster imaging times. SSFP imaging is less dependent on
blood flow (Moon et al. 2002). However, there remains the potential for artefact
from field inhomogeneities, susceptibility effects and artefacts related to eddy
current induction (Moon et al. 2002). Due to these characteristics, cardiac volume,
mass and function analysis may differ between SSFP and conventional gradient-echo
sequences. Gradient echo and SSFP techniques have been compared, with
measurements for LV and RV end-diastolic volumes larger (p<0.0001) while those
for LV and RV EF were smaller (p=0.0001 and 0.0005) with SSFP techniques. LV

15
mass was also smaller with the SSFP technique. The significant difference for all the
parameters remained even with indexation to height and body surface area (Alfakih
et al. 2003). SSFP has a typical in-plane resolution of 1.4 x 1.8 mm, a slice thickness
of 6 to 8 mm and a typical temporal resolution of 50ms.
1. 2. 3. 5. Assessment of the right ventricle
CMR can be used for the assessment of the human right ventricle despite its complex
triangular cavity shape and distinct inflow and outflow tracts. Right ventricular
function is an important determinant in the prognosis of myocardial infarction
(Mehta et al. 2001) and chronic heart failure (Oakley 1988), in addition to its major
role in congenital heart disease (Davlouros et al. 2006). Lower interstudy
reproducibility of the right ventricle compared to LV may be due to factors such as
difficulty defining the most basal RV slice due to the large area of the basal slice
which includes the RV outflow tract and the inflow region with the tricuspid valve.
Endocardial boundary delineation can also be more difficult for the RV with its thin
free wall, increased trabeculation compared to the LV and variable structure of the
moderator band.
1. 2. 3. 6. Limitations of CMR in ventricular assessment
Partial volume effect is a known problem in volumetric measurements by CMR (Luft
et al. 1996). When section thickness is 7 to 10 mm, one voxel can encompass
different structures causing blurring of the anatomic boundaries and small errors in
anatomic analysis with volumetric error increasing with slice thickness (Jauhiainen et
al. 1998; Luft et al. 1996). Cardiac motion during in vivo imaging with ventricles

16
contracting, rotating and shortening in addition to the heart moving with the
diaphragm during the respiratory cycle can also cause errors in volume analysis.
Poor breath hold during image acquisition may be a problem with patients who have
left ventricular dysfunction. Ways to reduce breath hold time include reducing the
temporal resolution of the image and more recently with newer imaging techniques
such as parallel-imaging techniques. These reduce imaging time by acquiring
multiple lines of data simultaneously, thus providing the full spatial information
needed to form an image of a given spatial resolution and field of view (Niendorf
and Sodickson 2006). If breath holding is not possible, real-time imaging where the
image is acquired in one cardiac cycle rather than several cycles, although the
limitation of this is reduced image resolution (Yang et al. 1998).
1. 2. 4. Myocardial tagging
Myocardial tagging is a CMR technique used for the determination of the thickening
and torsion of specific myocardial segments. The underlying principle is to apply
selective saturation pre-pulses in late diastole to superimpose grid lines across the
field of view and thus create non-invasive markers within the heart. These grid lines
are deformed by myocardial contraction, torsion and strain (Gotte et al. 2006).
Myocardial thickening and rotational torsion can then be quantified.
Information about myocardial strain is currently obtained by echocardiography with
tissue Doppler imaging based on longitudinal and radial motion data. Myocardial
tagging with CMR allows the measurement of myocardial strain and has the potential
of quantifying myocardial deformation in not just longitudinal and radial directions,
but also in the circumferential direction. Thus myocardial tagging allows for the

17
evaluation of regional and diastolic myocardial function in three dimensions. This
has important clinical utility in the evaluation of patients with cardiac failure.
Furthermore quantification of myocardial strain and torsion and diastolic strain rate
with MR myocardial tagging has the potential of early detection of cardiac disease in
patients prone to the development of cardiomyopathy.
Quantitative assessment of myocardial deformation with semi-automatic analysis
methods is now possible using specialised software to detect and track gridlines
(Axel et al. 1992) as well as almost fully automated analysis with harmonic phase
(HARP) analysis which can track points through the cardiac cycle or to calculate the
deformation directly (Osman et al. 1999).
1. 2. 5. CMR of Myocardial Viability
1. 2. 5. 1. Myocardial viability
Myocardial viability assessment is important in predicting which patients with
coronary disease and left ventricular impairment will have improved ventricular
function and survival with revascularisation (Braunwald and Rutherford 1986;
Pagley et al. 1997). Traditional methods for assessing myocardial viability include
positron-emission tomography (PET), single photon emission computed tomography
(SPECT) and dobutamine echocardiography. Dobutamine echocardiography and
PET imaging have high positive predictive value (82%) compared to SPECT (69%).
However, SPECT has a higher negative predictive value (90%) compared to both
PET (83%) and dobutamine echocardiography (81%) (Bonow 1996). These
techniques assess different indirect markers of cellular viability and there are
limitations with each test. SPECT is susceptible to attenuation artefacts, PET

18
imaging is limited by high costs and dobutamine stress echocardiography is
suboptimal or non-diagnostic in up to 15% of patients (Nagel et al. 1999).
CMR with a gadolinium-based contrast agent not only identifies acute myocardial
infarction, but is also able to accurately identify the transmural extent of infarction
and distinguish between reversible and irreversible myocardial injury (Kim et al.
1999). In addition, the transmural extent of myocardial delayed hyperenhancement
with gadolinium has been shown to be significantly related to the likelihood of
improvement in contractility after revascularisation (Kim et al. 2000). The likelihood
of functional improvement in regions with no hyperenhancement was 100%, while
90% of regions with hyperenhancement of 50 to 75% of tissue before
revascularisation did not improve post-revascularisation (Kim et al. 2000).
Normal myocardial tissue volume is predominantly intracellular. Gadolinium is a
biologically inert tracer that freely distributes in extracellular water, but is unable to
cross the intact cell membrane. Expansion of extracellular space in the myocardium
can be caused by fibrosis, protein infiltration and myocardial disarray, which result
in a combination of increased volume of distribution and slower washout kinetics.
Thus, there is a relative accumulation of gadolinium in comparison with the normal
myocardium which can be detected in the late phase (Kim et al. 1996; Moon et al.
2004). Gadolinium shortens the longitudinal relaxation time (T1) and T1 is shortened
more in infarcted regions than in normal myocardium.
1. 2. 5. 2. CMR sequences in viability assessment
Contrast-enhanced images are acquired with inversion-recovery segmented gradient
echo sequences after the administration of a gadolinium-based contrast (0.1 to 0.2

19
mmol/kg). Images are acquired 10 minutes after the administration of contrast. The
inversion time (TI) is the time in milliseconds between the application of the 180-
degree prepulse and acquisition of signal at the centre of the k-space. The optimal
inversion time is the time at which myocardial tissue signal magnetisation signal is
equal to zero or “nulled” and the blood signal in the cardiac chambers in
hyperintense. TI ranges from 140 ms to 300 ms. Areas of myocardial infarction
appear hyperintense or “bright” due to the higher concentration of gadolinium in the
infarcted region, which causes rapid T1 relaxation. A short-axis image stack and
long-axis views are acquired to cover the left ventricle from base to apex.
1. 2. 5. 3. Clinical Application
The differentiation of an underlying cause for LV dysfunction has important
management and prognostic implications (Bart et al. 1997). Patients with an
ischaemic cause may benefit from revascularisation. In the non-ischaemic group,
secondary causes including alcohol, infective and inherited abnormalities need to be
excluded. Some patients with non-ischaemic cardiomyopathy may benefit from
implantable cardiovertor-defibrillators and biventricular pacemakers and identifying
those who may benefit would be important.
CMR is potentially able to distinguish LV dysfunction that is related to coronary
artery disease or idiopathic dilated cardiomyopathy. In one study of patients with
unobstructed coronary arteries on coronary angiogram and dilated hearts, 60% of
patients had no gadolinium enhancement, but the remainder had gadolinium
enhancement in 2 distinct patterns of subendocardial enhancement similar to
ischaemic aetiology and mid-wall striae or patchy enhancement (McCrohon et al.
2003). The possibilities for the pattern of subendocardial enhancement include prior

20
infarction but with recanalisation after an occlusive event or embolization from
minimally stenotic but unstable plaque.
Preliminary data also show that contrast-enhanced CMR has prognostic significance
in patients without known myocardial infarction (Kwong et al. 2006). In this study,
late gadolinium enhancement involving even a small amount of myocardium was the
most important independent predictor of major cardiac adverse events over other
clinical predictors in a group of 195 patients with suspected coronary artery disease
referred for a clinical CMR examination. In addition, late gadolinium enhancement
provided complementary and incremental prognostic value beyond clinical predictors
alone or combined with angiographic or LV function predictors (Kwong et al. 2006).
Thus contrast-enhanced CMR may improve the current risk assessment of patients
who present with possible coronary artery disease.
Late gadolinium enhancement of the myocardium has been shown to be not only due
to myocardial infarction, but has been shown to be a marker of myocardial fibrosis of
any aetiology. In acute myocarditis, late gadolinium enhancement has been noted in
the basal lateral wall in the mid-wall and epicardium (Mahrholdt et al. 2004;
Mahrholdt et al. 2006). In hypertrophic cardiomyopathy, late gadolinium
enhancement is particularly noted at the right ventricular insertion site, which is a
common site of interstitial fibrosis. Infiltrative cardiomyopathies such as amyloidosis
and sarcoidosis also show distinct patterns of late gadolinium enhancement (Maceira
et al. 2005; Smedema et al. 2005).

21
1. 2. 6. CMR in Congenital Heart Disease
The value of CMR in the assessment of congenital heart disease (CHD) was first
recognised over 20 years ago (Didier et al. 1986; Higgins et al. 1984). The ability of
CMR to image in arbitrary planes complemented by three-dimensional angiography
allows it to obtain superior anatomic and functional data. CMR has become the gold
standard for imaging in certain areas of congenital heart disease, replacing cardiac
catherisation as the modality of choice for anatomic and functional characterisation
of congenital heart disease when echocardiographic imaging is inadequate (Wood
2006).
1. 2. 6. 1. Defining anatomy in Congenital Heart Disease
The anatomy in congenital heart disease can range from simple to complex and may
be pre- or post-operative. In complex congenital heart disease, defining morphology
of the atria and ventricles is crucial and requires a systematic examination of the
atria, atrioventricular connections, ventricles, ventriculoarterial connections as well
as conduits and baffles. Although echocardiography may provide this information, in
the adult population in particular, poor acoustic windows because of body habitus or
interposition of scar or lung tissue may limit adequate images (Hirsch et al. 1994;
Hoppe et al. 1996). CMR can acquire images in multiple and complex planes and is
not affected by artefacts from calcification or surgical patch materials in the post-
operative patient.
A CMR study in a patient with CHD includes contiguous axial images (in horizontal,
coronal and sagittal views) that provide initial information about morphology and
allows further detailed images in regions of interest to be acquired. In addition, serial
cine images are acquired to provide comprehensive information about congenital

22
anatomy. The use of diagnostic catheterisation use may potentially be reduced if
information can be obtained with non-invasive imaging such as MRI, which provides
information about function and physiology in addition to anatomy.
Currently, CMR already has clinical applications in the assessment of great artery
anatomy (aorta and pulmonary arteries), venous connections (systemic and
pulmonary veins), extracardiac conduits and baffles, intracardiac shunts (e.g. atrial
and ventricular septal defects) and in the assessment of complex congenital heart
disease
1. 2. 6. 2. Defining function and physiology in Congenital Heart Disease
CMR can provide information on the ventricle such as ventricular volumes,
ventricular mass, stoke volume and ejection fraction and is now established as the
gold standard technique for the assessment of RV volume, mass and function (Katz
et al. 1993; Longmore et al. 1985). Other imaging modalities such as
echocardiography and angiography are able to provide this information, however as
CMR does not rely on geometric assumptions, even abnormally shaped ventricles
can be assessed for volume and function. In particular, the assessment of the right
ventricle is important in congenital heart disease, where it may be a subpulmonary
RV and support the pulmonary circulation or may be a systemic RV and support the
systemic circulation. While the left ventricle has a conical shape with its wall
thickness three to four times greater than the RV free wall and with fine
trabeculations, the right ventricle is of a complex shape, has coarse trabeculations
and a muscular RV outflow tract (Davlouros et al. 2006).

23
1. 2. 6. 3. CMR pulse sequences in Congenital Heart Disease
Black Blood Imaging
In “black blood” imaging with fast spin-echo sequences, blood appears black while
myocardium and blood vessel walls are signal-rich and appear bright. Black blood
images have high signal-to-noise ratio, resolution and contrast. These sequences are
useful for defining anatomy, characterising abdominal situs and characterising soft
tissue detail (Geva et al. 1994). Images can be obtained with both T1- and T2-
weighted spin-echo sequences, as well as using Half Fourier Acquired Turbo Spin
Echo (HASTE) sequences. HASTE sequences are useful for obtaining axial, coronal
and sagittal images from the level of the aortic arch to the diaphragm to provide
initial assessment of anatomy.
White Blood Imaging
Gradient echo or “white blood” sequences are useful for the assessment of cardiac
function. The older sequences using spoilt gradient echo techniques have the
advantages of flow sensitivity. Flowing blood carries non-saturated spins and
appears bright, while blood accelerated to the point of turbulence, such as with
obstruction, causes signal voids. These sequences are useful for characterising the
severity of valvular and vascular stenoses, but is limited by its relative poor image
contrast and low signal-to-noise ratio (Wood 2006)
Steady state free precessing (SSFP) imaging, a newer gradient echo sequence relies
on contrast between the blood pool and the myocardium for delineation of anatomy.
Blood is signal rich, while the myocardium and blood vessel walls have less signal.
Cine SSFP imaging provides information about cardiac morphology and function. It

24
is also useful to image specific areas of interest in congenital heart disease such as
shunts, valves, pulmonary vessels and the aorta.
Velocity-encoded cine-MR imaging
This is a flow-sensitive cine-MRI technique that is based on the principle that the
phase of flowing spins relative to stationary spins along a magnetic gradient changes
in direct proportion to the velocity of flow (Didier et al. 1999). This allows the
quantification of blood flow velocity and volume flow in cardiac chambers and great
vessels. Two sets of images are usually acquired simultaneously (one with and one
without velocity encoding) and the subtraction of the two images allows the
calculation of a phase shift which is proportional of flow. Images are then
reconstructed in magnitude, providing anatomical information and in phase,
providing velocity information (Didier et al. 1999). Velocity can be encoded in
planes perpendicular (“through-plane” velocity measurement) or parallel (“in-plane”
velocity measurement) to the direction of flow. This technique has been validated for
the measurement of aortic and pulmonary flow representing left and right ventricular
stroke volumes (Kondo et al. 1991), thus allowing quantification of left-to-right
shunts (Hundley et al. 1995), quantitative assessment of valvular regurgitation and
the peak flow velocity in valvular stenosis (Kilner et al. 1991; Kilner et al. 1993).
Gadolinium-enhanced MR Angiography
The accurate diagnosis of vascular anomalies in congenital heart disease is important
for both prognosis and management (Herlong et al. 2000). Contrast-enhanced MR
angiography is non-invasive and provides information about vascular anatomy of the
aorta, pulmonary vessels and collateral vessels including major aortopulmonary
collaterals (Ferrari et al. 2001; Prasad et al. 2004). Multiple cross-sectional images

25
can be obtained with a single breath-hold and the images can be reconstructed off-
line to obtain images similar to conventional angiography, which can be viewed in
multiple planes.
1. 2. 6. 4. Clinical applications for CMR in Congenital Heart Disease
In summary, using a combination of the above techniques and sequences available,
anatomical, functional and physiological assessment is currently possible and
provides a comprehensive examination of the patient with congenital heart disease.
Current major indications for CMR in congenital heart disease include segmental
description of cardiac morphology, thoracic aortic assessment, detection and
quantification of shunts, stenoses and regurgitation, detection of complex anomalies,
pulmonary and systemic venous anomalies in addition to post-operative assessment
in adult patients.
1. 2. 7. CMR assessment of atherosclerosis
Cardiovascular disease due to the complications of atherosclerosis is the leading
cause of mortality and morbidity in the Western world. This is related to the acute
coronary syndromes such as acute myocardial infarction, unstable angina pectoris
and sudden cardiac death. It is a diffuse condition and affects not only the coronary
arteries, but also the carotid arteries, aorta and peripheral arteries.
The pathogenesis of the acute coronary syndrome is atherosclerotic plaque disruption
and subsequent thrombosis (Falk et al. 1995). This is determined by the
atherosclerotic plaque composition rather than the degree of arterial stenosis with the
majority of acute coronary events occurring with a non-critically stenosed

26
atherosclerotic lesion (Falk et al. 1995). Pathological features of plaque vulnerability
are a large lipid-rich necrotic core and a thin overlying fibrous cap as well as
inflammation (Burke et al. 2001; Virmani et al. 2000). Despite much progress in
diagnostic investigations to assess atherosclerotic disease, we are still extremely
limited in our ability to accurately identify patients at risk for an acute cardiovascular
event. Improved prediction of such high-risk asymptomatic individuals is important
as these patients would potentially benefit from treatments such as anti-platelet,
lipid-lowering or anti-hypertensive therapies in addition to aggressive lifestyle
modification.
The current assessment of a patient’s cardiovascular risks include assessment of risk
factors such as diabetes, smoking, family history of cardiovascular disease,
hypercholesterolaemia and hypertension. However, these risk factors by themselves
are variable in their ability to predict acute cardiovascular and cerebrovascular events
and death (Brindle et al. 2006; Law et al. 2004). Absolute risk assessment is based on
equations that have been derived from several cohort studies and randomised trials
(Anderson et al. 1991; Assmann et al. 2002; Conroy et al. 2003; Wilson et al. 1998)
especially those derived from prospective follow-up of individuals from the
Framingham Heart Study (Anderson et al. 1991).
In addition to risk factors, investigations with imaging of coronary artery disease and
assessment of serological markers are potentially important in patient cardiovascular
risk assessment. Coronary angiography, currently the gold standard investigation for
the detection of coronary atherosclerotic disease, provides information on lumen
stenotic severity but little information on atherosclerotic plaque composition. Non-
invasive imaging modalities such as carotid intima media thickness (IMT) measured

27
by ultrasound techniques have been used as a surrogate marker of atherosclerosis
(Bots et al. 1997; Chambless et al. 1997; Salonen and Salonen 1993). While carotid
IMT may predict future cardiovascular and cerebrovascular events, it has limitations
including heterogeneity of ultrasound protocols and low specificity of IMT location
for a clinical event (Lorenz et al. 2007). An imaging modality that is able to visualise
and quantify atherosclerotic plaque would enable us to identify the vulnerable
atherosclerotic lesion. High-resolution magnetic resonance imaging (MRI) has been
shown to both quantify and characterise non-invasively atherosclerotic components
in both human and animals. In addition, there is the potential to monitor the
regression of atherosclerotic plaque with therapy such as with lipid-lowering
treatments (Worthley et al. 2000).
1. 2. 7. 1. Atherosclerotic plaque components with MR imaging
Atherosclerotic plaque disruption is the most frequent underlying cause of the onset
of acute thromboembolic cardiovascular and cerebrovascular events such as
myocardial infarction, unstable angina, cerebrovascular accidents and transient
ischaemic attacks (Falk et al. 1995). Clinical risk factors for atherosclerosis help to
predict risk of these events and angiography provides information about the degree
of obstruction to flow in coronary and carotid vessels, but does not provide
information to identify patients with atherosclerotic plaques that are vulnerable to
disruption.
The majority of acute coronary events involve non-critically stenosed atherosclerotic
lesions that are undetected by conventional stress testing and imaging techniques.
Atherosclerotic plaque composition rather than stenotic severity predicts the risk of
plaque rupture and its thrombogenicity (Fernandez-Ortiz et al. 1994; Fuster et al.

28
1992; Fuster et al. 1992; Ross 1999). A vulnerable atherosclerotic plaque that is at
high risk of rupture has a thin fibrous cap and a large lipid-rich necrotic core. Plaques
containing large atheromatous cores are more prone to disruption and are responsible
for the atherothrombotic complications leading to acute coronary syndromes (Falk et
al. 1995).
Imaging modalities that can characterise atherosclerotic plaque and its components
may allow risk stratification in both asymptomatic and symptomatic patients with
coronary artery disease and potentially enable appropriate selection of therapies to
reduce this risk (Worthley et al. 2000). The ideal imaging modality would be one that
is safe, non-invasive, accurate and reproducible allowing longitudinal studies in the
same patient (Celermajer 1998). High-resolution MRI has emerged as the potential
leading non-invasive modality to differentiate plaque components. Of the imaging
modalities, it has the greatest soft tissue contrast that is able to accurately identify
plaque tissue components with sub-millimetre resolution (Shinnar et al. 1999;
Toussaint et al. 1996; Worthley et al. 2000; Yuan et al. 1998). Furthermore, MRI
does not use ionising radiation and allows the free choice of tomographic planes.
Recent technical developments in MRI technology such as dedicated surface coils,
the introduction of high-field systems and developments in the field of molecular
imaging such as contrast agents targeted to specific plaques constituents will
potentially lead to further improvements in signal to noise ratio, spatial resolution
and imaging speed. Its limitations include relatively long imaging time, isolation of
the patient from medical care during image acquisition and contraindication in
patients with some metallic implants.

29
Plaque components are differentiated with MRI based on biophysical and
biochemical parameters of chemical composition, water content, physical state,
molecular motion or diffusion (Fuster et al. 2005). In vivo and ex vivo MRI has been
shown to be able to differentiate lipid core, fibrous cap, calcifications, intraplaque
haemorrhage, normal intima and adventitia in vivo in human atherosclerotic plaques
(Coombs et al. 2001; Serfaty et al. 2001; Shinnar et al. 1999; Yuan et al. 2001). MRI
is thus a potential tool not only for assessing atherosclerotic lesions, but also for the
serial assessment of lesion progression or regression following lipid-lowering
therapy (Corti et al. 2002). In addition, MRI has the potential to provide information
about cardiac anatomy, function, perfusion and metabolism.
The proton density of water determines signal intensity in MRI images and MR
images can be weighted to T1, T2 or proton density values through manipulation of
the MR parameters. In a T1-weighted image, tissues with low T1 values will be
displayed with high signal intensity, while high T1 values will be displayed with low
signal intensity. In T2-weighted images, tissues with high T2 values will be of high
signal intensity while those of low T2 values will be of low signal intensity. In a
proton density-weighted image, the differences in contrast are proportional to the
density of water and fat protons within the tissue (Worthley and Badimon 2005).
In atherosclerotic plaque, fibrous tissues consist mainly of extracellular matrix
elaborated by smooth muscle and are associated with a short T1. Plaque lipids
consist mainly of unesterified cholesterol and cholesteryl esters and are associated
with a short T2 (Toussaint et al. 1995) Perivascular fat is composed mainly of
triglycerides and appears different from atherosclerotic plaque lipids on MRI
(Toussaint et al. 1996; Toussaint et al. 1995).

30
Calcified tissue has low signal intensity on both T2 and T1-weighted sequences due
to low water proton content. Fibrocellular tissue and thrombus may also be dark on
proton density weighted images. In T2-weighted sequences, atheromatous core has
low signal intensity relative to the fibrous cap and outer layers of the vessel wall.
Intraplaque haemorrhage is bright on T1-weighted images due to the presence of
methaemoglobin, a breakdown product of haemoglobin. Methaemoglobin causes a
shortening of T1 and hence an increase in signal intensity on T1-weighted images
(Toussaint et al. 1996).
MRI Signal Intensity
Imaging Sequence Dense
fibrocellular
Lipid Rich Haematoma Calcification
PDW High Intermediate Intermediate Nil
T1W High Intermediate High Nil
T2W High Low Low Nil
Used with permission Atherosclerosis 2000 Table 1 (Worthley et al. 2000)
1. 2. 7. 2. MR imaging of coronary arteries
MRI of the coronary arteries is technically more challenging compared to carotid and
aortic artery imaging due to cardiac and respiratory motion artefacts, the smaller size
of the coronary arteries and its curvilinear course (van der Wall et al. 1995). Bright
blood non contrast-enhanced MR coronary angiography is unable to provide
information about the coronary wall structure of atherosclerotic plaque
characteristics. In black blood MRI, the signal from static tissue is maximised and
the transverse magnetization of flowing blood is made incoherent resulting in blood
signal void (Fayad et al. 2000).

31
High resolution in vivo coronary MRI was first validated using a clinical 1.5T system
in a porcine model where coronary lesions were induced by balloon angioplasty and
black blood in vivo images of the coronary artery wall and lesions were obtained
with a double-inversion-recovery fast-spin-echo sequence (Worthley et al. 2000).
In an ex vivo setting in porcine coronary arteries and aortas, complex atherosclerotic
lesions including calcified, lipid-rich, fibrocellular and haemorrhagic regions can be
accurately characterised (Worthley et al. 2000). Dense fibrocellular areas had high
signal intensity on all 3 imaging sequences (T1, T2 and PDW), lipid-rich areas were
of intermediate signal intensity on PDW and T1W sequences but low signal intensity
on T2W sequences, while calcification produced signal loss on all 3 sequences due to
the low mobile proton density within the calcified area (Worthley et al. 2000).
Plaque haematoma was less accurately identified. Mean vessel wall thickness
measurements were approximately 10-20% larger with MR imaging than by
histopathology. This was attributed to specimen shrinkage during paraffin
embedding for histopathology analysis and volume averaging due to MR images
being significantly thicker than the histopathology sections.
In humans, high resolution black blood MRI of both normal and atherosclerotic
coronary arteries has been performed for direct assessment of coronary wall
thickness and visualisation of atherosclerotic plaque in the wall (Fayad et al. 2000).

32
1. 2. 7. 3. MRI studies of carotid artery atherosclerosis
The superficial location and relative absence of motion of the carotid arteries allow
imaging and characterisation of its walls, fibrous cap (Toussaint et al. 1996; Yuan et
al. 2001) and quantification of atherosclerotic plaque size (Corti et al. 2001).
MRI can characterise the composition of human carotid atherosclerotic plaque
including fibrous tissue, lipid and necrotic core, calcium, haemorrhage, thrombus and
the fibrous cap in vivo and ex vivo (Cai et al. 2002; Hatsukami et al. 2000; Shinnar et
al. 1999; Toussaint et al. 1996; Yuan et al. 2001).
The characterisation of carotid plaque composition ex vivo with high-field MRI has
been shown to have a high level of sensitivity and specificity (Shinnar et al. 1999).
Identification of calcium, fibrocellular, lipid and fibrous cap components had
sensitivity of 100% while the lowest sensitivity was with thrombus identification
(Shinnar et al. 1999). Using diffusion-weighted MRI, thrombus appears as a bright
area in diffusion-weighted images, however if thrombus was adjacent to areas of
calcification, the signal obtained has been shown to be so low that it may not appear
bright and thus difficult to identify (Shinnar et al. 1999). In addition, acute thrombus
may not have the characteristic bright appearance on diffusion-weighted images
(Toussaint et al. 1996). Fibrocellular tissue and thrombus may appear dark on proton
density images, and T2-weighted images and these components may appear darker
than their T2 would suggest (Shinnar et al. 1999).
The fibrous cap is an important structure for the stability of the atherosclerotic
plaque. An intact thick fibrous cap can be distinguished from an intact, thin and
ruptured cap using high resolution MRI with a 3D time-of flight protocol.

33
(Hatsukami et al. 2000; Yuan et al. 2001). A thin fibrous cap or ruptured fibrous cap
in human carotid atherosclerotic plaque on MRI has been shown to be highly
associated with a recent history of transient ischaemic attack or stroke (Yuan et al.
2002). Compared with patients with thick fibrous caps, patients with thin fibrous
caps were 10 times more likely to have had a recent TIA or stroke (Yuan et al. 2002).
In vivo multicontrast MRI is able to further classify human carotid atherosclerotic
lesions as early, intermediate or advanced lesions according to the AHA
classification (Cai et al. 2002) and with a high degree of reproducibility (Chu et al.
2004).
Multicontrast MRI has been shown to accurately detect the presence and age of the
carotid intraplaque haemorrhage (Chu et al. 2004). Acute intraplaque haemorrhage
appears as a hyperintense signal on T1 weighted and TOF images and as an
isointense signal on PD/T2W images while subacute haemorrhage appears as a
hyperintense signal on all four contrast weightings. Intraplaque haemorrhage has
been found to be associated with greater progression in both lipid-rich necrotic core
and plaque volume in a serial high-resolution MRI study on asymptomatic patients
with carotid stenosis (Takaya et al. 2005).
The use of gadolinium based, contrast-enhanced MRI have shown that post-contrast
T1-weighted MR images help to discriminate the fibrous cap from the necrotic core
(Cai et al. 2005; Wasserman et al. 2002; Yuan et al. 2002). The contrast agents are
known to distribute into the extracellular fluid space and cause a greater degree of
enhancement in the vessel wall and fibrous cap which may be due to increased
permeability, increased extracellular volume or decreased washout (Wasserman et al.
2002).

34
1. 3. CARDIAC COMPUTED TOMOGRAPHY
1. 3. 1. Background
Multidetector computed tomography (MDCT) has been used in clinical settings to
measure of the amount of calcification in the coronary arteries with coronary artery
calcium scoring of the coronary tree, a surrogate marker of atherosclerosis. MDCT
has also become the gold standard for angiographic imaging in most arterial beds
such as the carotid and peripheral vascular systems. In the coronary arteries, there
have been major advances in the accuracy of coronary MDCT angiography,
particularly with regards to its negative predictive value, although excessive
calcification and blooming artefacts still limit the diagnostic accuracy of the
technique for assessing stenotic severity.
1. 3. 2. MDCT Basics
Improvements in CT systems in recent years have resulted in faster rotation speed of
the gantry and thin slice collimation. This has led to substantial improvements in
spatial and temporal resolution, with shortened acquisition time achieved in one
breath hold. Electron-beam computed tomography (EBCT) uses a rotating electron
beam and non-mechanical movement of the X-ray source to acquire triggered
tomographic X-ray images over 100 milliseconds at 3 mm intervals with a 30 second
breath-hold. Multidetector computed tomography (MDCT) uses a rotating gantry
with motion of the X-ray source and table, combined with multiple detectors (from 4
to 64) to acquire the data in spiral or helical fashion.

35
Multidetector spiral CT systems with simultaneous acquisition by 4 detector rows
and a minimum rotation of 500 msec were introduced in 1998. Increasing the number
of sections that are simultaneously acquired have led to further improvement with
fast high-resolution volume coverage that has resulted in the introduction of eight,
10, 16, 32, 40 and 64-detector row CT scanners with further reduced gantry rotation
times and minimum beam collimation widths of less than 1 mm (Schoepf et al.
2004).
Motion artefacts caused by cardiac pulsation is minimised by acquiring or
reconstructing data at a time point with the least cardiac motion, usually in the
diastolic phase of the heart cycle (Schoepf et al. 2004). Prospective triggering has
been used in electron beam CT and single-detector row spiral CT where a trigger
signal is derived from the patient’s ECG on the basis of the prospective estimation of
the present R-R interval. The scan is started at a defined time point after a detected R
wave, usually during diastole (Schoepf et al. 2004). With retrospective ECG gating,
scan data is acquired and available for the entire phase of the cardiac cycle, although
the scan data used for image reconstruction is selected during the diastolic phase. A
stack of images is reconstructed at every heartbeat, which enables faster coverage
than prospectively ECG-triggered multi-detector row CT scanning. Reconstruction
of image stacks at exactly the same phase of the heart cycle enables continuous and
phase-consistent coverage of the entire heart and adjacent anatomy in the selected
scanning range (Becker et al. 2000; Schoepf et al. 2004).
The effective radiation dose of 1mSv has been reported for routine scanner settings
and prospectively ECG-triggered acquisitions (e.g. in calcium scoring) with EBCT
(3 mm beam collimation) and four-detector row CT (2.5 mm beam collimation).

36
With retrospectively ECG-gated imaging of the heart, there is relatively high
radiation exposure due to continuous X-ray exposure and overlapping data
acquisition (Morin et al. 2003). For high spatial resolution (1.00-1.25 mm beam
collimation), a retrospectively ECG-gated acquisition (e.g. in contrast CT of the
heart) with four-detector row CT, there is an exposure limit of approximately 10 mSv
applied which is comparable to a routine diagnostic conventional coronary
angiographic examination (Schoepf et al. 2004). This dose can be reduced to
approximately 5 to 7 mSv with ECG-gated dose modulation where the nominal tube
output is applied only during the diastolic phase of the cardiac cycle, where most
images are likely to be reconstructed and for the rest of the cardiac cycle, the tube
output is reduced.
1. 3. 3. Coronary artery calcification
1. 3. 3. 1. Pathophysiology
Atherosclerotic calcification begins as early as the second decade of life, just after
fatty streak formation (Stary 2001; Stary et al. 1995). Calcific deposits are found
more frequently and in greater amounts in elderly individuals and in more advanced
lesions. In one autopsy study of patients over 60 years of age, 94% of coronary
arteries had some degree of calcification (McCarthy and Palmer 1974). It has been
suggested that coronary calcium is seen exclusively in atherosclerotic arteries, but is
absent in normal vessel wall (Fitzpatrick et al. 1994; Stary et al. 1995).
The mechanisms for the formation of atherosclerotic calcification are poorly
understood, however, pathologic calcification of atherosclerotic vessels shares
features with normal bone such as cellular proliferation, matrix deposition and

37
calcification. The principal collagen found in atherosclerotic plaques is Type I
collagen which is associated with bone formation (Burleigh et al. 1992). There is
evidence that mineral deposits in arterial plaques consist of calcium hydroxyapatite
which is the major inorganic component of bone (Bostrom et al. 1993). This
formation of calcium hydroxyapatite is an active process regulated by calcifying
vascular cells or associated with smooth muscle cell or macrophage production of
ectopic bone matrix proteins (Bostrom et al. 1993)
The relation of arterial calcification to the probability of plaque rupture is unknown
(Falk et al. 1995). Vulnerable plaque is frequently present in the absence of
calcification (Davies et al. 1993) and although coronary artery calcium may provide
a measure of total plaque burden, calcium does not concentrate only at sites with
severe coronary artery stenosis (Wexler et al. 1996). There are histopathologic
reports of small numbers of patients which have suggested that ruptured plaques are
less likely to be calcified (Cheng et al. 1993; Gertz and Roberts 1990; Wexler et al.
1996). In vivo evidence of the relative stability of calcified lesions has been obtained
with intravascular ultrasound in larger studies (Mintz et al. 1997; Mintz et al. 1995).
The presence and magnitude of target lesion calcium paralleled the atherosclerotic
plaque burden as assessed by IVUS, but the presence and magnitude of target lesion
calcium did not parallel the extent of lumen compromise as assessed by coronary
angiography (Mintz et al. 1997). In the same study, intermediate lesions had as much
target lesion calcium as did severe lesions and the only clinical risk factors for
coronary calcification were patient age and non-insulin dependent diabetes. However
when controlled for patient age, non-insulin dependent diabetes was not an
independent predictor (Mintz et al. 1997). Insulin-dependent diabetic patients were

38
less likely to have coronary calcification than either non-diabetic or non insulin-
dependent diabetic patients (Mintz et al. 1997; Tuzcu et al. 1996).
1. 3. 3. 2. Coronary artery calcium estimation with CT
Coronary artery calcification is potentially detectable by plain film roentgenography,
coronary arteriography, fluoroscopy, computed tomography (electron beam and
multidetector CT) and intravascular ultrasound. Although fluoroscopy can detect
moderate to large calcifications, its ability to identify small calcific deposits is low
compared to CT and it is not able to quantify calcification (Wexler et al. 1996).
As calcium attenuates the X-ray beam, computed tomography is highly sensitive in
detecting vascular calcification and CT distinguishes mural calcium because of its
high CT density relative to blood. Earlier published studies utilised EBCT for
quantification of coronary artery calcium which demonstrated high correlation
coronary artery calcium on EBCT with histopathology (Rumberger et al. 1995) and
intravascular ultrasound (Baumgart et al. 1997; Schmermund et al. 1997). Average
whole coronary system calcium area as measured by EBCT defines on average only
approximately 20% of the total atherosclerotic plaque present at histological
examination (Rumberger et al. 1995). There were also arteries that had demonstrable
atherosclerotic plaque but little or no associated coronary calcium. For plaque areas
< 1mm2, the EBCT coronary calcium areas were nearly zero, for plaque areas 1 to 5
mm2, the mean calcium area was 0.46 mm
2 and only when coronary plaque areas
were consistently in the range of 5 to 10 mm2 per segment were the corresponding
coronary calcium areas > 1mm2 (Rumberger et al. 1995). This minimal calcium area
of 1 mm2 may be too small for consistently reproducible results as with a standard
512 by 512 matrix, pixel areas are 0.34 mm2 and with the criterion of two contiguous

39
pixels with CT density of > 130 HU, pixel areas are 0.68 mm2 (Rumberger et al.
1995). This has important implications as only calcifications associated with larger
atherosclerotic plaques (>5mm2) are detected while smaller segmental areas are not
reliably detected.
Although EBCT has a faster temporal resolution than MDCT, both modalities have a
good agreement for estimation of coronary artery calcium scoring (Becker et al.
2001; Knez et al. 2002). Coronary calcification has traditionally been assessed by
means of a score introduced by Agatston, measured in Hounsfield units (Agatston et
al. 1990; Janowitz et al. 1993; Rumberger et al. 1995). The Agatston score calculates
the calcium burden by multiplying the area of the calcified lesion by a weighting
factor dependent on the peak signal of the lesion (Agatston et al. 1990). An area of
threshold of 1mm2 and a density threshold of > 130 Hounsfield units are used to
identify a calcified lesion. Histological studies support the association of tissue
densities of 130 Hounsfield units with calcified plaques (Wexler et al. 1996).
Individual scores are separately accumulated for the left main, left anterior
descending, left circumflex and right coronary artery with a total score obtained from
the sum of these scores. However, the Agatston score is limited by the low (17%
interscan variability) reproducibility (Wang et al. 1996) and newer methods which
measure calcium volume (Callister et al. 1998; Hong et al. 2002) have shown
improved reproducibility (13% interscan variability).
1. 3. 3. 3. Clinical Implications of Coronary Artery Calcification
Coronary artery calcification is almost invariably present only if atherosclerotic
disease is present in the coronary circulation (Burke et al. 2003; Rumberger et al.
1995). It is closely related to ageing, a major factor increasing the risk of

40
atherosclerosis. Coronary calcification has been shown to be a good predictor for the
burden of atherosclerotic disease, however there is some contention about the role of
calcification in its relation to instability of atherosclerotic plaque rupture and
subsequent thrombosis. Coronary calcification does not necessarily indicate
significant obstructive disease (Stary 2001) and there is only a weak, nonlinear
correlation between the amount of coronary calcium and the angiographic severity of
obstructive coronary artery disease (O'Rourke et al. 2000). Pathological (Beckman et
al. 2001; Burke et al. 2000; Huang et al. 2001) and imaging (Nikolaou et al. 2004)
data have shown that the actual sites of coronary artery calcification do not co-locate
with culprit coronary lesions associated with myocardial infarction. However,
coronary artery calcification remains a strong predictor for revascularisation
(coronary artery bypass grafting and angioplasty) rather than “hard” cardiovascular
events of death and non-fatal myocardial infarction (Kondos et al. 2003).
In asymptomatic individuals, there are large and consistent observational studies that
have shown that coronary artery calcium scoring with EBCT is a predictor for
cardiovascular events (Arad et al. 2000; Budoff et al. 2007; Greenland et al. 2004;
Kondos et al. 2003; Shaw et al. 2003; Wong et al. 2002) and provided incremental
information over that provided by conventional risk factor analysis (Shaw et al.
2003). In study of over 1000 asymptomatic subjects who were predominantly
moderate to high risk, coronary artery calcium scores of >300 significantly added
prognostic information to Framingham risk analysis in the 10 to 20% 10-year
Framingham risk category (Greenland et al. 2004). In addition, in a recent
observational study of the largest follow-up of >25000 middle-aged asymptomatic
subjects, coronary artery calcium score was shown to predict all-cause mortality
(Budoff et al. 2007) and these are consistent with the findings of a previous study

41
(Shaw et al. 2003). Given its independent risk prediction, the role of coronary artery
calcium screening would most likely benefit individuals who are at intermediate risk
for coronary events i.e. those with 0.5 to 2.0% annual event rate based on traditional
risk factor analysis.
The role of coronary artery calcium to monitor atherosclerotic disease has not been
demonstrated. Randomised double-blind trials with lipid-lowering therapy have not
showed slowing of coronary artery calcium progression with atorvastatin 20 mg
(Arad et al. 2005) and atorvastatin 80 mg versus pravastatin 40 mg (Raggi et al.
2005) in asymptomatic patients.
1. 3. 4. Computed Tomography Coronary Angiography
While invasive coronary angiography is the gold standard in coronary artery
imaging, it carries a small, but defined risk of both major and minor complications.
The major risk of complication reported by the largest described series from the
Society of Cardiac Angiography and Intervention is 1.7% including vascular,
haemodynamic, arrhythmic and renal complications (Noto et al. 1991). Coronary
arteries because of their small dimensions and motion have been difficult to image
by computed tomography (CT). Typically, the luminal diameter of coronary vessels
tapers down from 5 mm in the left main coronary artery to 1 mm in the distal left
anterior descending coronary artery (Funabashi et al. 2003). Image acquisition of the
coronary arteries requires a high temporal resolution, which with CT (50 to 300
msec) is lower than that of conventional angiography (<10 msec) (Schoenhagen et al.
2004) and a high spatial resolution. Electron beam CT (EBCT) uses a rapidly
rotating electron beam, which is reflected onto and a stationary tungsten target.
EBCT can achieve temporal resolutions of 50 to 100 msec per slice and was used

42
initially to detect and quantify coronary artery calcification (Agatston et al. 1990).
Images with EBCT are usually obtained with 3 mm thickness during one breath hold.
Improvement in multi-detector CT (MDCT) technology from the combination of
faster rotation time and multi-detector row acquisition with sub-millimetre spatial
resolution have increased the ability to visualise the coronary lumen. While 16 slice
MDCT acquires 16 parallel projections within a single rotation (420 msec per
rotation with 210 msec temporal resolution) and thinner image sections (0.75
mm)(Schoenhagen et al. 2004), new MDCT scanners with 64 slices have further
improved spatial resolution (Wintersperger and Nikolaou 2005). Image sections can
now be obtained in the range of 0.5 to 0.625 mm at a maximum gantry rotation speed
of 330ms/360° for the 64-slice scanners which allows for a higher temporal
resolution further improving both functional assessment of the heart and image
quality at various heart rates (Wintersperger and Nikolaou 2005).
MDCT angiography has been shown in expert centres and selected patients to have a
consistently very high negative predictive value (98%) and positive predictive value
(80%) for the detection of coronary stenoses (Kuettner et al. 2004; Leschka et al.
2005; Mollet et al. 2005; Morgan-Hughes et al. 2005; Nieman et al. 2002; Ropers et
al. 2003). In these studies, however, patient with renal failure and arrhythmias were
excluded and analysis was limited to coronary segment diameter of greater than 1.5
to 2.0 mm. Coronary venous bypass grafts are larger than native coronary arteries
and MDCT has been shown to accurately document coronary artery bypass graft
patency (Nieman et al. 2003; Pache et al. 2006; Schlosser et al. 2004).
A regular and low heart rate significantly improves the image quality, arteries
accessibility and accuracy for stenosis detection (Giesler et al. 2002; Hoffmann et al.

43
2005; Schroeder et al. 2002) for imaging of the coronary arteries with CT. Patients in
atrial fibrillation or with other arrhythmias cannot be studied adequately. Motion can
lead to artefacts with the right coronary artery most frequently affected. Severe
calcifications of the coronary artery cause partial volume artefacts and the apparent
volume of areas of calcification is larger on CT. This may obscure the lumen and
thus limit accurate quantification of stenosis severity. Quantitative measurement of
coronary artery stenosis severity is currently also limited by spatial resolution.
Unlike coronary calcification assessment with CT which does not require contrast
administration, to visualise non-calcified plaques, contrast agent administration is
required. This makes the investigation not suitable for patients with renal
insufficiency and contrast allergy. The patient’s heart rate at the time of MDCT has
to be slow to reduce motion artefacts and achieve diagnostic image quality, ideally
<65 beats per minute and this may require the administration of beta blocker
medications (Nieman et al. 2001; Schroeder et al. 2002). Multislice CT
investigations are associated with a considerable radiation exposure (between 5 to 9
mSv).
1. 3. 5. Atherosclerotic Plaque Imaging with CT
Atherosclerotic plaque composition is an important predictor of plaque stability with
most plaque ruptures occurring in plaques containing a soft lipid-rich core with an
overlying thin fibrous cap (Virmani et al. 2000). The detection of calcified and non-
calcified plaques in the coronary arteries of patients with suspected coronary arteries
has been shown to be feasible with contrast-enhanced multi-detector CT angiography
(Becker et al. 2000). Plaques have been divided into calcified (density >130 HU)

44
while non-calcified lesions are identified on the basis of their lower density (density
<130 HU) compared with the contrast-enhanced lumen (Schroeder et al. 2001).
The AHA criteria defines type I and II lesions as early atherosclerotic lesions, type
III and IV as intermediate lesions with extracellular lipid pools, type V lesions as
fibroatheromas and type VI lesions as complicated lesions with surface defects,
haematoma, haemorrhage or thrombus (Stary et al. 1995). An ex vivo MDCT study
to characterise atherosclerotic plaque found the CT attenuation in predominantly
lipid-rich plaques (type IV and Va) was significantly lower than in predominantly
fibrous-rich plaques (Becker et al. 2003). The CT Hounsfield values of lipid and
fibrous-rich plaques were 47+/-9 HU for lipid and 104+/-28 HU for fibrous plaques.
Compared to the AHA criteria, type III to type VI plaques could be visualised by CT
while early stages (type I and II lesions) were not detectable (Becker et al. 2003).
In a coronary artery study of atherosclerotic plaque with MDCT (Schroeder et al.
2001), patients with chronic stable angina and >70% stenosis in proximal segments
of the LAD or RCA were scheduled for intra-coronary ultrasound-guided PTCA
(Schroeder et al. 2001). Soft plaques showed a mean density of <50 HU,
intermediate plaques of 50 to 119 and calcified plaques >120 HU. There was a strong
correlation of tissue density measurements within the plaque and the qualitative
ultrasound classification of “soft, intermediate and calcified” (Schroeder et al. 2001).
A more precise assessment of plaque composition using MDCT by visualizing lipid
cores, fibrous caps or calcified is restricted due to limited spatial resolution.
Coronary calcium studies with EBCT have suggested that coronary calcium
increases with total atherosclerotic burden. However, it is unclear what stage of

45
atherosclerosis coronary calcification is a feature of, and whether the presence and
amount of calcium can also predict unstable coronary artery disease. There have
been a few CT studies looking at the plaque burden in stable versus unstable group
of patients with coronary artery disease and have shown a greater plaque burden with
calcified plaques in patients with stable angina pectoris compared to patients with
acute myocardial infarction (Leber et al. 2003). Furthermore, a third of patients with
acute myocardial infarction had moderate calcium scores of <100. In these patients,
calcified plaques reflected only 52% of the plaque burden (Leber et al. 2003). In a
small group of 5 patients with a clinical presentation of acute myocardial infarction
who had near normal coronary angiograms, large coronary soft plaque lesions were
found on four-detector MDCT and IVUS and attributed as the cause for the acute
myocardial infarction (Caussin et al. 2003). These findings suggest that the severity
of coronary atherosclerosis may be underestimated significantly if only calcified
plaques are considered surrogate markers for total plaque burden.
Non-calcified coronary plaques can be detected with a sensitivity of 78% with
sixteen-detector MDCT when compared to intravascular ultrasound (Leber et al.
2004). However, due to limitations in temporal resolution, the ability to identify
non-calcified plaques was found to be restricted to larger advanced lesions with a
plaque diameter of at least 1.5 mm located in the proximal and middle coronary
segments. Intraplaque haemorrhage may be a marker of plaque instability which is a
contributing factor to a more rapid progression of atherosclerosis (Beach et al. 1993).
In MDCT images, intraplaque haemorrhage may be visualised as an area of reduced
contrast material passage, however, MDCT currently does not reliably detect
intraplaque haemorrhage (Saba et al. 2007).
46
The fibrous cap and its potential rupture has been better visualised using MRI and in
particular, the percentage of lipid-rich necrotic core can be quantified (Coombs et al.
2001; Hatsukami et al. 2000; Shinnar et al. 1999; Toussaint et al. 1996). MRI can
more easily detect intraplaque haemorrhage and also has the potential to distinguish
between acute and non-acute haemorrhage, which may have clinical implications as
acute haemorrhages were significantly more likely to be found in patients with
symptomatic plaques than in patients with asymptomatic plaques (Saam et al. 2006;
Takaya et al. 2006).
1. 4. MICRO COMPUTED TOMOGRAPHY
1. 4. 1. Background
Traditionally, histopathologic analysis of human autopsy specimens and explanted
tissue has been the established standard for analysis of human arteries. However,
histopathologic analysis is limited as it does not provide three dimensional
information, causes loss of the intact volume of the specimen resulting in difficulty
of further examination with other methods and in addition, serial sectioning of
multiple thin slices from tissue specimen is time-consuming and expensive
(Langheinrich et al. 2004).
1. 4. 2. Micro CT Basics
Micro computed tomography (micro CT) is a technique that enables micro CT
systems to generate thin-section images of small specimens. The first micro-
tomography (micro-CT) scanners were first developed in the 1980s using bench-top
X-ray sources (Ritman 2004). A micro-focused x-ray source illuminates the object of

47
interest, which is positioned on a precision manipulator and a sensitive camera
acquires the x-ray images. During image acquisition, the sample is rotated step at a
time through 180 degrees with images recorded at each rotation. Using complex
software, 2 dimensional images based on x-ray density can be recalculated from the
x-ray images and data can be calculated from the morphology of the samples. Rapid
acquisition of approximately 10 cross sections per minute can be achieved and with
spatial resolution of 5 to 8 µm (Langheinrich et al. 2004).
1. 4. 3. Micro CT application
Earlier studies with micro CT have been of small animal models for bone structural
analysis and intact rodent organ vasculature (Feldkamp et al. 1989; Jorgensen et al.
1998; Kuhn et al. 1990; Paigen et al. 1987). Micro CT has been also shown to be a
sensitive method to detect vascular calcification in animal models in vivo (Persy et
al. 2006). There have been a limited number of human studies to analyse vascular
structure and calcification (Clarke et al. 2003; Langheinrich et al. 2004). As calcium
is removed during histological processing, micro-CT has been used as the gold
standard for identifying calcium deposits within the human carotid ex vivo
atherosclerotic plaque (Clarke et al. 2003). In an autopsy small study of ten
epicardial human coronary arteries, micro CT provided quantitative information
about plaque morphology equivalent with histopathological analysis. This was
assessed using micro CT grey-scale value differences to classify lesions as fibrous,
calcified or lipid-rich plaques (Langheinrich et al. 2004). However, a limitation in
this study was that only structures delineated with sufficient contrast material could
be visualised and quantified exactly.

48
Micro CT analysis can be performed prior to histologic processing and thus has the
advantages of avoiding artefacts from fixation, dehydration, decalcification and
embedding. As it is a non-destructive approach, micro CT potentially allows the
analysis of atherosclerotic plaque characteristics such as plaque area, lumen area,
calcified areas and lipid core as a continuous and complete dataset of the vessel over
its entire length. Micro CT is thus a useful additional tool for the ex vivo assessment
of atherosclerosis. There is ongoing work on more detailed classification of plaque
types according to grey-scale attenuation (Langheinrich et al. 2007).
1. 5. AIMS OF THE THESIS
In this thesis, our aims were to address some specific novel areas advancing the
utility of these imaging modalities in two major areas of interest, namely congenital
heart disease and atheroma imaging.
Our first step was to validate the accuracy and reproducibility of CMR, the main
imaging modality we utilised. To achieve this, we assessed MR imaging of cardiac
volumes and function in a normal adult Australian population with a specific focus
on the reproducibility of the technique. In confirming that this technique in our hands
is both accurate and reproducible, we would then be in a position to be able to
confidently use this technique in our future chapters. However, more than this, we
sought to establish some normal ranges for left and right atrial and ventricular
parameters in our local population. This would be crucial background information
for us to be able to make comparisons with future studies in patients with congenital
heart disease.

49
Having established our technique and reference ranges, we would then explore the
two specific issues in the ensuing two chapters using CMR in one area of congenital
heart disease, atrial septal defect. Atrial septal defect is the most common congenital
heart defect first diagnosed in adults. The traditional method of assessment of these
patients and for suitability for ASD closure involves semi-invasive investigation with
transoesophageal echocardiography (TOE) for measurement of the defect size and
atrial septal margins. MRI assessment of patients prior to percutaneous device
closure compared to TOE assessment would provide information on the accuracy of
TOE assessment and provide information of the utility of cardiac MRI as an
alternative to TOE for the work-up of these patients prior to ASD closure.
In our third original research chapter, we utilised CMR to understand the effects of
percutaneous ASD closure on cardiac chamber volumes. We achieved this by
assessing with cardiac MRI pre-closure and post-closure atrial and ventricular
cardiac volumes. Longstanding right heart dilatation in the setting of an ASD may
lead to complications including right heart failure, pulmonary hypertension and
arrhythmia. Closure of the ASD should reduce right heart volumes by removing left-
to-right shunting and lead to normalisation of ventricular volumes. The assessment of
atrial volume changes with ASD closure may be important in furthering our
understanding in its contribution to arrhythmia.
Having assessed the ability of CMR to assess both the ASD dimensions, and
therefore suitability for percutaneous closure, as well as the effects of ASD closure
on cardiac chamber size, we look in the final two original research chapters to move
to another area of research development with these high-resolution imaging
technologies, atherosclerosis imaging. Two particular areas we wished to focus on

50
included the potential of high-resolution MR imaging to monitor effects of HDL
infusion on atherosclerosis, and secondly to explore mechanisms behind limitations
in MDCT imaging of atherosclerosis, specifically calcification and blooming
artifacts.
For assessing the effects of HDL infusion on atherosclerosis, we utilised a
cholesterol-fed rabbit model of atherosclerosis. The abdominal aorta of the rabbit is
comparable in size to the human coronary artery. Previous work with the rabbit
model of atherosclerosis and magnetic resonance imaging of the aortic wall has
shown that it can provide information about atherosclerotic composition as well as
provide serial data of the arterial wall. While high intensity lipid lowering with
statins remains the first line management of at risk individuals, modest manipulations
of serum HDL levels are associated with a significant impact on cardiovascular risk.
Thus, we assessed the effect of HDL infusion and atorvastatin in a rabbit model of
using MRI of aortic atherosclerosis as the end-point.
In our fifth and final original research chapter, we assessed the accuracy of
quantification of atherosclerotic calcification with MDCT in the carotid arteries of
patients undergoing carotid endarterectomy, and sought to identify algorithms or
techniques that may improve quantification of calcification. This would potentially
lead to an improvement in the ability of MDCT techniques to quantify stenotic
severity in coronary arteries that were calcified. To achieve these we utilised MDCT
in vivo and in comparison with carotid endarterectomy specimen micro CT.
Importantly, as part of this study, we undertook a thorough assessment of
reproducibility of these techniques.

51
Thus, in summary, we have been able to confirm the accuracy and reproducibility of
CMR and MDCT in the areas of a specific congenital defect (ASD) and
atherosclerosis imaging, and utilised these techniques to advance our understanding
of these disease states. This thesis identifies strengths and weaknesses of these
techniques that will allow us to more appropriately use them for future purposes in
cardiovascular disease. Future work directly stemming from this thesis has already
begun, and now looks to address issues of whether CMR and MDCT may provide
complimentary information about atherosclerotic lesions that may benefit outcomes
in certain conditions. Specifically the work in this thesis has led to studies
commencing in carotid atherosclerosis and saphenous vein graft atherosclerosis and
using these imaging techniques to potentially predict adverse future outcomes.

52
Chapter 2
METHODS

53
TABLE OF CONTENTS
2. 1. Study Populations......................................................................................... 54
2. 1. 1. Normal healthy volunteers ......................................................................................54
2. 1. 2. Patients with Atrial Septal Defects.........................................................................54
2. 2. Animal Model of Atherosclerosis................................................................. 54
2. 2. 1. Rabbit Aortic Atherosclerosis.................................................................................54
2. 3. CMR System and Imaging Sequences ......................................................... 55
2. 3. 1. Ventricular volume and function sequences.........................................................55
2. 3. 1. 1. Steady state in free precession sequence (SSFP) ........................................................... 55
2. 3. 1. 2. Image Acquisition............................................................................................................ 56
2. 3. 1. 3. Image Analysis................................................................................................................. 56
2. 3. 2. Congenital Anatomy and Volume Sequences.......................................................57
2. 3. 2. 1. Measurement of the atrial septal margins and defect size............................................ 58
2. 3. 2. 2. Image Analysis................................................................................................................ 58
2. 3. 3. Rabbit Black Blood CMR Imaging........................................................................60
2. 3. 3. 1. Imaging Sequences .......................................................................................................... 60
2. 3. 3. 2. Imaging analysis .............................................................................................................. 60
2. 4. TOE imaging ................................................................................................ 61
2. 4. 1. Image Acquisition .....................................................................................................61
2. 4. 2. Image Analysis ..........................................................................................................61
2. 5. MDCT Imaging System and Sequences ...................................................... 62
2. 5. 1. Image Acquisition .....................................................................................................62
2. 5. 2. Image Analysis ..........................................................................................................62
2. 6. Micro-CT Imaging System and Sequences.................................................. 62
2. 6. 1. Image Acquisition .....................................................................................................62
2. 6. 2. Image analysis ...........................................................................................................63
2. 7. Statistical Analysis ....................................................................................... 64

54
2. 1. STUDY POPULATIONS
2. 1. 1. Normal healthy volunteers
Healthy volunteers with no history of cardiovascular or respiratory disease and a
normal resting blood pressure and a normal resting electrocardiogram were studied.
All volunteers gave their informed consent for the study. Ethics approval was
obtained from the institutional Research Ethics Committee (Royal Adelaide
Hospital). Exclusion criteria were contraindications to MRI scanning and
arrhythmia.
2. 1. 2. Patients with Atrial Septal Defects
Consecutive patients with secundum atrial septal defects diagnosed on transthoracic
echocardiography (TTE) and with significant left to right shunt (>1.5:1) were invited
to undergo both transoesophageal echocardiography (TOE) and cardiac magnetic
resonance imaging (MRI). Only patients in sinus rhythm pre-ASD closure were
included in the study.
2. 2. ANIMAL MODEL OF ATHEROSCLEROSIS
2. 2. 1. Rabbit Aortic Atherosclerosis
Cholesterol fed New Zealand White rabbits (Institute of Medical and Veterinary
Science, Gilles Plains, Australia) aged 12 weeks were used. Complex atherosclerotic
aortic lesions were induced in New Zealand white rabbits (3.0 to 3.5 kg) by a

55
combination of atherogenic diet (0.2% cholesterol enriched chow, Glen Forest Stock
Feed, Western Australia) for 17 weeks and balloon denudation, one week after
initiation of the atherogenic diet. Aortic denudation of the aorta from the aortic arch
to the iliac bifurcation was performed by four withdrawals, with moderate resistance,
of a 4 French Fogarty embolectomy catheter introduced through the iliac artery. All
procedures were performed under general anaesthesia by intramuscular injection of
ketamine (Fort Dodge Animal Health, Fort Dodge, IA) (20mg/kg) and xylazine
(Bayer Corporation, Shawnee Mission, KA) (10mg/kg).
2. 3. CMR SYSTEM AND IMAGING SEQUENCES
The Siemens Sonata system (Siemens Medical Solutions, Erlangen, Germany) is a
high resolution, whole body imaging system operated at 1.5 Tesla. All magnetic
resonance imaging for the purposes of this thesis was performed with this system.
2. 3. 1. Ventricular volume and function sequences
2. 3. 1. 1. Steady state in free precession sequence (SSFP)
All cine images were acquired with retrospectively ECG-gated True FISP (Fast
Imaging with Steady-State Precision), a steady state in fee precession (SSFP)
sequence. The short axis section thickness was 6 mm with intersection gaps of 4 mm.
Image matrix 256 X 150, field of view 380 mm, repetition time 52.05 ms, echo time
1.74 ms and flip angle 70°. Twelve to 17 heart phases were acquired per repetition
time interval. This has an in-plane resolution of 1.4 x 1. 8 mm and a temporal
resolution of 50 ms. Retrospective ECG-gating ensures that end-diastole is included,
which can be missed with prospective ECG triggering (Gatehouse and Firmin 2000).

56
2. 3. 1. 2. Image Acquisition
All Cardiac MR imaging studies were performed with subjects in the supine position
with a phased array surface coil. Long-axis reference views were used for
positioning the 8 to 12 perpendicular LV short-axis slices from the level of the mitral
valve to the left ventricular apex. Images were obtained during breath-hold (8 to 10
seconds) with retrospectively ECG-gated True FISP sequences.
2. 3. 1. 3. Image Analysis
Ventricular analysis was performed off-line with a proprietary software program
(Argus software, Siemens, Germany). For the left ventricular (LV) data set, short-
axis endocardial contours were manually traced in end-diastole (start of R-wave) and
in end-systole (smallest cavity area). Papillary muscles and trabeculations were
excluded from the ventricular volume and were included if contiguous with the
myocardial mass (Lorenz et al. 1999). The basal slice was selected if the blood
volume was surrounded by >50% of ventricular myocardium. In the right ventricular
(RV) data sets, endocardial contours were manually traced in LV end-diastole and in
end-systole (Lorenz et al. 1999). For the right ventricular (RV) data set, one observer
manually traced the endocardial contours at end-diastole and at end-systole.
Both LV and RV end-diastolic and end-systolic cavity surface areas were summed
up and volumes: end-diastolic (EDV) and end-systolic (ESV) estimated by
multiplying with interslice intervals as per Simpson’s rule. Ejection fraction (EF)
was calculated as EF = (EDV-ESV)/EDV X 100 (%). LV mass = 1.05 X (epicardial
volume – endocardial volume). RV mass was not measured.

57
2. 3. 2. Congenital Anatomy and Volume Sequences
Cardiac MRI studies were performed with subjects in the supine position using a 1.5
Tesla MRI scanner (Siemens Sonata, Germany) and a phased array surface coil.
Images were obtained during breath-hold (8 to 10 seconds) with retrospectively
cardiac-gated True FISP (Fast Imaging with Steady-state free precession) sequences.
Both short (modified bi-atrial) and long axis images (4 chamber views) were
obtained through the ASD, with section thickness of 6 mm and no intersection gap.
Thus, consecutive slices were obtained to cover the whole of the interatrial septum in
both short and long axis views. Assessment of atrial septal margins, maximal and
minimal defect dimensions in both short and long axis views was performed.
For the ventricular image set, long-axis reference views were used for positioning 8
to 12 perpendicular ventricular short-axis slices from the level of the mitral valve to
the left ventricular apex. Images were obtained during end-expiratory breath-hold (8
to 10 seconds) with retrospectively ECG-gated True-FISP (Fast Imaging with
Steady-State Precision) sequences (Image matrix 256 X 150, field of view 380 mm,
repetition time 52.05 ms, echo time 1.74 ms and flip angle 70°). Ventricular short
axis slice thickness was 6 mm with intersection gaps of 4 mm, based on previous
published studies (Alfakih et al. 2003; Lorenz et al. 1999).
For the atrial image set, multiple contiguous slices in both short (bi-atrial) and
horizontal long axis views (four chamber) were obtained through the ASD, with slice
thickness of 6 mm and no intersection gap.

58
2. 3. 2. 1. Measurement of the atrial septal margins and defect size
TOE and CMR studies were reviewed retrospectively and 2 independent observers
performed the measurements. Images were reviewed for (a) assessibility of defect
size and septal margins by TOE, and (b) assessibility of defect size and septal
margins by CMR, (c) Agreement of the measurements between TOE and CMR. The
maximal diameters of the atrial septal defects were measured on both TOE and
CMR. Atrial septal margins were measured as previously published (Durongpisitkul
et al. 2004; Masani 2001). The anterior inferior (AI) rim was measured from the
defect to the mitral valve, the anterior superior (AS) rim from the defect to the aortic
root, posterior inferior (PI) rim from the defect to the inferior vena cava and posterior
superior (PS) rim from the defect to the superior vena cava (see Figure 1, Chapter 4).
The TOE views for measurement of the rims were: the mid-oesophageal four-
chamber view for AI rim, basal short axis view for AS rim and biatrial views for PI
and PS rims. Corresponding CMR views were the four-chamber view for AI rim,
short axis view through the aorta for the AS rim and modified biatrial short axis
views for PS and PI measurements. The size of the device occluder device used was
also compared to the maximal defect size on CMR and TOE in patients who
subsequently underwent ASD closure.
2. 3. 2. 2. Image Analysis
Ventricular and atrial analyses were performed off-line with a proprietary software
program (Argus software, Siemens Medical Solutions, Germany). For the left
ventricular (LV) data set, short-axis endocardial and epicardial contours were

59
manually traced in end-diastole (at start of R-wave) and in end-systole (smallest
cavity area). Papillary muscles and trabeculations were excluded from the ventricular
volume and were included if contiguous with the myocardial mass. The basal slice
was selected as the slice where the blood volume was surrounded by >50% of
ventricular myocardium (Alfakih et al. 2003; Lorenz et al. 1999). For the right
ventricular (RV) data set, one observer manually traced the endocardial contours at
end-diastole and at end-systole. The selection of the RV basal slice was based on
published methods where, if the pulmonary valve was seen, only the portion of the
volume below the level of the pulmonary valve was included (Alfakih et al. 2003).
Both LV and RV end-diastolic and end-systolic cavity surface areas were summed
up and volumes: end-diastolic (EDV) and end-systolic (ESV) estimated by
multiplying with interslice intervals as per Simpson’s rule. Ejection fraction (EF)
was calculated as EF = (EDV-ESV)/EDV X 100 (%). LV mass = 1.05 X (epicardial
volume – endocardial volume).
A true three-dimensional atrial volume assessment technique in which the
endocardial borders were manually traced for both left and right atria in the
horizontal long axis (four chamber) views in ventricular end-systole when atrial
volume is maximal (Hauser et al. 2004). Borders of left atrium were defined as the
plane of the mitral valve and the visually apparent juncture of left atrium with
pulmonary veins. Borders of right atrium were defined as the plane of the tricuspid
valve and the juncture with the vena cavae. The atrial appendage was included if
present on the images. Atrial volumes were calculated as a sum of atrial cavity areas
with interslice intervals using a modification of Simpson’s rule.

60
2. 3. 3. Rabbit Black Blood CMR Imaging
2. 3. 3. 1. Imaging Sequences
The black blood MR imaging techniques used in this thesis was Fast spin echo
(FSE). Standard FSE MR techniques were used to provide high-resolution images of
rabbit aortic atherosclerotic. The animals were fully anaesthetised with ketamine and
xylazine as described above and placed supine in the 1.5 Tesla MRI system (Sonata,
Siemens Medical Solutions), using a conventional phased-array volume coil. Fast
gradient-echo coronal images were used to localise the abdominal aorta. Sequential
axial images (3-mm thickness, 56 slices) of the abdominal aorta from the renal
arteries to the iliac bifurcation were obtained using a fast spin-echo sequence with an
in plane resolution of 350 x 350 µm (PDW: TR/TE: 2000/11 msec, field of view
(FOV)=9 x 9 cm, matrix 256 x 256, echo train length=9, flip angle=180°, signal
averages=4). Inferior and superior radio frequency flow saturation pulses were used
to null signal from flowing blood in the inferior vena cava and aorta. Fat suppression
was used to null the signal from the peri-adventitial fat, in order to minimise
chemical shift artefacts.
2. 3. 3. 2. Imaging analysis
All images were analysed by an investigator who was blinded to the treatment status
of the animals. The MR images from the same animals were matched by use of
distance from the renal arteries and the iliac bifurcation for registration as previously
validated (Helft et al. 2001; Worthley et al. 2000). Cross sectional areas of the lumen
and the outer boundary of each aortic section were determined by manual tracing
with Image Pro Plus (Media Cybernetics) by an observer who was blinded to the
treatment status of the animals. From these measurements, lumen area, outer vessel
area and vessel wall area (outer vessel area minus lumen area) were calculated. The

61
outer wall was defined as the vessel wall-epicardial fat interface. The vessel wall
areas of 8 contiguous abdominal aortic slices per animal were consecutively
averaged.
2. 4. TOE IMAGING
2. 4. 1. Image Acquisition
TOE imaging was performed with a Sonos 5500 (Phillips) TOE system with a
multiplanar 7.0mHz phased-array transducer. Cross-sectional studies of the atrial
septum were performed utilising multi-plane views as previously described: mid-
oesophageal 4-chamber views, short axis view and biatrial long axis views (Cooke et
al. 2001).
2. 4. 2. Image Analysis
The maximal diameters of the atrial septal defects were measured on both TOE and
CMR. Atrial septal margins were measured as previously published (Durongpisitkul
et al. 2004; Masani 2001). The anterior inferior (AI) rim was measured from the
defect to the mitral valve, the anterior superior (AS) rim from the defect to the aortic
root, posterior inferior (PI) rim from the defect to the inferior vena cava and posterior
superior (PS) rim from the defect to the superior vena cava.
The TOE views for measurement of the rims were: the mid-oesophageal four-
chamber view for AI rim, basal short axis view for AS rim and biatrial views for PI
and PS rims. Corresponding CMR views were the four-chamber view for AI rim,
short axis view through the aorta for the AS rim and modified biatrial short axis
views for PS and PI measurements. The size of the device occluder device used was

62
also compared to the maximal defect size on CMR and TOE in patients who
subsequently underwent ASD closure.
2. 5. MDCT IMAGING SYSTEM AND SEQUENCES
2. 5. 1. Image Acquisition
A sixteen detector MDCT scanner (Siemens Sensation 16, Germany) was used (12 X
0.75 mm collimation, gantry rotation time 420 ms, table feed 2.8 mm per rotation,
tube voltage 0f 120 kV). A non-contrast localization scan was first performed to
obtain an anteroposterior view of the head and neck. This was used to position the
imaging volume for carotid imaging. Automated bolus tracking software allows the
full bolus to be accurately followed without a timing bolus first.
2. 5. 2. Image Analysis
Cross sectional images were reconstructed with a slice thickness of 1.0 mm in 1.0
mm intervals. These images were then transferred to a computer workstation for
analysis using Image-Pro Plus (Media Cybernatics) where the cross-sectional areas
of the lumen and outer boundary of the carotid lesion were determined for the CT
images by manual tracing.
2. 6. MICRO-CT IMAGING SYSTEM AND SEQUENCES
2. 6. 1. Image Acquisition

63
Micro-CT scanning was performed on a desktop micro-CT (Skyscan 1072;
Aartselaar, Belgium). Carotid endarterectomy specimens, fixed in formalin were
place in sealed polypropylene tubes. The carotid specimens were held in place in the
tubes with polystyrene, which has X-ray absorption equivalent to air. Samples were
then imaged using an unfiltered tungsten x-ray source, which was run at 80kV and
120µA. Images were collected at 0.675-degree steps through a total angle of
approximately 180 degrees. Total imaging time per sample was 1 hour. Although the
maximum resolution for the Skyscan 1072 is approximately 4 µm, however due to
the size of carotid endarterectomy specimens, the resolution ranged from 10 to 18
µm.
2. 6. 2. Image analysis
Projection images were converted to tomogram using proprietary software (Skyscan
ConeRec). Three-dimensional rendering of the images and data analysis was
performed using CT-Analyser software (Skyscan). Non-calcified areas could not be
distinguished from surrounding tissues because of comparable X-ray absorption,
while calcified areas were able to be easily distinguished. Density histograms were
generated which provided quantitative results. The lower limit for threshold was
selected to exclude non-calcified tissue, while the upper limit corresponded to the
densest calcified part. The 3-D models rendered from the reconstructed cross-
sections were analysed to determine calcium volume.

64
2. 7. STATISTICAL ANALYSIS
Interobserver variability was assessed using the Bland and Altman method (Bland
and Altman 1986) as well as intraclass correlation coefficients. The correlation
calculation is a statistical method to quantify the relationship between two variables
measured independently and where r=1 is taken as a perfect correlation. Unpaired
sample t-tests were performed for the difference in measurements between males and
females with the level of significance taken as p<0.05.
Data is presented as mean ± standard deviation. Analyses between TOE and MRI
were made using simple linear regression analysis (SPSS 11.0 software) and Bland
Altmann analysis. Statistical significance was taken at a p value of 0.05.
Comparison of cardiac volumes pre- and 6 months post-ASD closure was performed
with paired t-testing between groups. Statistical significance was taken as p<0.05.
Intra and Interobserver variability was assessed using the Bland and Altman method
(Bland and Altman 1986) as well as intraclass correlation coefficients.
Paired Student’s t tests were used to compare MR image-derived parameters from
the same sites in the rabbit abdominal aorta at the 2 time points. All probabilities are
2-sided and statistical significance taken as a value of p<0.05. All values are assessed
as mean ± SEM (mm2).
For the MDCT calcification project, all data was assessed for normality using the
Kolmogorov-Smirnov statistic (SPSS 11.0 software). Data is presented as mean
calcium volume (mm3±SD) and simple linear regression performed for normally
distributed data. Bland-Altman analyses were performed between the different

65
methods, as the most appropriate comparison of different techniques assessing the
same entity (i.e. amount of vascular calcification).

66
Chapter 3:
CARDIAC MRI ASSESSMENT OF LEFT AND RIGHT
VENTRICULAR PARAMETERS IN HEALTHY
AUSTRALIAN NORMAL VOLUNTEERS

67
TABLE OF CONTENTS
3. 1. Introduction.................................................................................................. 68
3. 2. Methods ........................................................................................................ 69
3. 2. 1. Study Population.......................................................................................................69
3. 2. 2. Image Acquisition .....................................................................................................69
3. 2. 3. Image Analysis ..........................................................................................................70
3. 2. 4. Reproducibility..........................................................................................................70
3. 2. 5. Statistical Analysis ....................................................................................................71
3. 3. Results........................................................................................................... 71
3. 4. Discussion ..................................................................................................... 76
3. 6. Conclusion .................................................................................................... 78

68
3. 1. INTRODUCTION
Cardiovascular Magnetic Resonance (CMR) imaging has been shown to be an
accurate and reproducible tool for the assessment of left and right ventricular
measurements (Alfakih et al. 2003; Grothues et al. 2004; Grothues et al. 2002;
Hudsmith et al. 2005; Lorenz et al. 1999). The information that can be obtained in a
single examination includes ventricular volumes, mass and ejection fraction which
provide both diagnostic and prognostic information. Like echocardiography, CMR is
a non-invasive investigation and does not utilise ionising radiation. However, the
additional advantage is the higher inter-observer reproducibility compared to
echocardiography, as CMR does not rely on geometric assumptions (Grothues et al.
2002). This allows the serial assessment of ventricular parameters particularly the
monitoring of ventricular remodelling with therapy.
Earlier CMR studies for ventricular function and volumes utilised a technique with a
pulse sequence using segmented k-space turbo gradient echo (Alfakih et al. 2003).
This has remained in current use, but a more recent technique is the steady-state free
precession (SSFP) technique. This technique has been validated in animal studies
(Fieno et al. 2002). Compared to the gradient echo technique, SSFP allows improved
definition of the endocardial borders and faster acquisition time (Alfakih et al. 2003;
Moon et al. 2002).
In this study, we sought to establish normal ranges for left ventricular (LV) volumes,
mass and ejection fraction (EF) as well as right ventricular volumes in normal
healthy non-Aboriginal Australian volunteers. We also sought to establish that the
assessment of these parameters using CMR with SSFP is reproducible.

69
3. 2. METHODS
3. 2. 1. Study Population
Sixty (41 males, 19 females, mean age 51±13 years) consecutive normal healthy
volunteers with no history of cardiovascular or respiratory disease and a normal
resting blood pressure and a normal resting electrocardiogram were studied. All
volunteers gave their informed consent for the study. Ethics approval was obtained
from the institutional Research Ethics Committee (Royal Adelaide Hospital, South
Australia). Exclusion criteria were contraindications to CMR scanning and
arrhythmia.
3. 2. 2. Image Acquisition
All CMR imaging studies were performed with subjects in the supine position using
a 1.5 Tesla MRI scanner (Siemens Sonata, Germany) and a phased array surface coil.
Long-axis reference views were used for positioning the 8 to 12 perpendicular LV
short-axis slices from the level of the mitral valve to the left ventricular apex. Images
were obtained during breath-hold (8 to 10 seconds) with prospectively ECG-gated
True FISP (Fast Imaging with Steady-State Precision) sequences. The short axis
section thickness were 6 mm with intersection gaps of 4 mm, based on previous
published studies (Alfakih et al. 2003; Hudsmith et al. 2005; Lorenz et al. 1999).
Acquisition time was 90% of the RR-interval, image matrix 256 X 150, field of view
380 mm, repetition time 52.05 ms, echo time 1.74 ms and flip angle 70°. Twelve to
17 heart phases were acquired per repetition time interval.

70
3. 2. 3. Image Analysis
Ventricular analysis was performed off-line with a proprietary software program
(Argus software, Siemens Medical Solutions, Germany). For the left ventricular
(LV) data set, short-axis endocardial and epicardial contours were manually traced in
end-diastole (start of R-wave) and in end-systole (smallest cavity area). Papillary
muscles and trabeculations were excluded from the ventricular volume and were
included if contiguous with the myocardial mass. The basal slice was selected as the
slice where the blood volume was surrounded by >50% of ventricular myocardium
(Alfakih et al. 2003; Lorenz et al. 1999). For the right ventricular (RV) data set, one
observer manually traced the endocardial contours at end-diastole and at end-systole.
The selection of the RV basal slice was based on published methods where, if the
pulmonary valve was seen, only the portion of the volume below the level of the
pulmonary valve was included (Alfakih et al. 2003).
Both LV and RV end-diastolic and end-systolic cavity surface areas were summed
up and volumes: end-diastolic (EDV) and end-systolic (ESV) estimated by
multiplying with interslice intervals as per Simpson’s rule. Ejection fraction (EF)
was calculated as EF = (EDV-ESV)/EDV X 100 (%). LV mass = 1.05 X (epicardial
volume – endocardial volume). RV mass was not measured.
3. 2. 4. Reproducibility
To assess the interobserver variability, a second independent observer re-measured
the data sets for both left and right ventricular parameters.

71
3. 2. 5. Statistical Analysis
Data was collected for assessment of left ventricular EF, mass, EDV and ESV, and
presented as mean ± standard deviation (SD). The normal range was calculated as 2
standard deviations above the mean. Interobserver variability was assessed using the
Bland and Altman method (Bland and Altman 1986) as well as intraclass correlation
coefficients. The correlation calculation is a statistical method to quantify the
relationship between two variables measured independently and where r=1 is taken
as a perfect correlation. Unpaired sample t-tests were performed for the difference in
measurements between males and females with the level of significance taken as
p<0.05%. Statistical analyses were performed using SPSS software.
3. 3. RESULTS
Total imaging time was approximately 15 minutes. All patients were able to
complete the full protocol and diagnostic imaging was obtained in all subjects. The
left ventricular parameters were: EF 58.5 ± 8.0 %, LV mass 114.2 ± 40.6 g, EDV
117.3 ± 33.4 mls and ESV 50.0 ± 22.2 mls.
The right ventricular parameters were: EF 45.6 ± 11.6 %, EDV 163.5 ± 52.2 mls and
ESV 89.5 ± 34.3 mls.
Figure 1 shows a mid-ventricular short axis SSFP image in end-diastole and end-
systole with left ventricular endocardial and epicardial contours traced and right
ventricular endocardial contour traced.

72
Figure 1: CMR image of a mid-ventricular short axis slice in end-diastole (ED) and
end-systole (ES) with traced left ventricular endocardial (red) and epicardial contours
(green) and right ventricular endocardial contour (red).
Tables 1 and 2 show the means ± standard deviation for all LV and RV volumes for
both males and females.
Table 1. Mean Values ± SD of left ventricular (LV) dimensions with SSFP
Combined Males Females
EDV (mls) 117.26 ± 33.40 124.22 ± 32.95 104.58 ± 31.24
ESV (mls) 50.03 ± 20.20 52.92 ± 20.54 44.77 ± 19.04
EF (%) 58.52 ± 7.97 58.62 ± 8.24 58.35 ± 7.68
Mass (g) 114.16 ± 40.61 131.20 ± 39.85 83.07 ± 16.66
LV EDV/BSA (ml/m2) 59.92 ± 17.31 60.21 ± 16.69 61.82 ± 21.26
LV mass/BSA (g/m2) 58.65 ± 10.55 71.98 ± 12.8 52.10 ± 10.37
LV EDV/HT (ml/m) 66.44 ± 21.46 69.97 ± 18.54 64.13 ± 22.01
LV Mass/ HT (g/m2) 65.59 ± 17.46 71.98 ± 12.80 54.09 ± 11.28

73
Table 2. Mean Values ± SD of right ventricular (RV) dimensions with SSFP
Combined Males Females
EDV (ml) 163.63 ± 52.21 186.23 ± 40.60 116.87 ± 42.69
ESV (ml) 89.48 ± 34.26 92.74 ± 26.93 57.11 ± 23.33
EF (%) 45.59 ± 11.58 45.89 ± 9.56 44.75± 16.38
RV EDV/BSA (ml/m2) 81.43 ± 23.14 86.95 ± 28.97 67.03 ± 24.25
RV EDV/HT (g/m2) 92.96 ± 28.62 101.64 ± 33.85 70.34 ± 8.11
Intraclass correlation coefficients between 2 independent observers for LV
parameters were: EF 0.82, LV mass 0.94, EDV 0.95 and ESV 0.91. Results from the
Bland and Altman analyses for interobserver and intraobserver variability for LV and
RV are presented as mean, the difference between the means ± 2 SD. Interobserver
mean of LVEF was 56.6% with difference between the means of 0.7 ± 8.6%.
Interobserver mean of RVEF was 51.1%, difference between the means -1.7 ±
22.7%. This is presented graphically for ejection fraction in Figures 2A and 2B for
LV inter- and intraobserver data and in Figures 3A and 3B for RV inter- and
intraobserver data. Interobserver LVEDV mean 124, difference 10.8 ± 33 mls,
LVESV mean 54.1, difference 3.3 ± 18.0 mls and LV mass mean 107, difference
5.24 ± 37 g. Interobserver RVEDV mean 151.8, difference 31.5 ± 48.4 mls and
RVESV mean 76.0, difference 18.21 ± 49 mls.

74
Figure 2: Bland and Altman analyses of LV ejection fraction for interobserver
(Figure 2A) and intraobserver (Figure 2B) variability. Solid line indicates the mean
difference and dashed lines ± 2 standard deviations (SD).

75
Figure 3: Bland and Altman analyses of RV ejection fraction for interobserver
(Figure 3A) and intraobserver (Figure 3B) variability. Solid line indicates the mean
difference and dashed lines ± 2 standard deviations (SD)
There was a statistically significant difference in volumes and mass between males
and females. This difference was present for LVEDV (p=0.01), RVEDV (p<0.001),
RVESV (p<0.01) as well as LV mass (p<0.0001). The difference between male and

76
female LV mass measurements remained significant after indexation to body surface
area (p=0.008) but not the difference between the measurements for LVEDV and
RVEDV. There was no significant difference in LVEF between males and females.
3. 4. DISCUSSION
Cardiovascular magnetic resonance imaging is a non-invasive and accurate method
for assessing ventricular volumes, mass and function. This study has established the
normal ranges for left and right ventricular parameters in a group of normal healthy
Australian volunteers using CMR. We have used the more recent technique with
steady-state free precession (SSFP) imaging, which allows for improved endocardial
and epicardial border definition. The slice thickness and inter-slice gaps used (left
ventricular slice thickness of 6 mm with a 4 mm inter-slice gap) were chosen on the
basis of published studies of CMR assessment of LV function, volume and mass
(Alfakih et al. 2003; Hudsmith et al. 2005). Although thinner slices without slice
gaps may increase the accuracy of the ventricular imaging, problems with cross-
excitation between slices and signal-to-noise become significant. Papillary muscles
not contiguous with the myocardial mass were excluded in keeping with published
studies, due to the variability created in attempting to include this (Lorenz et al.
1999). However, new software options may allow inclusion of the papillary muscles
in the future.
The excellent reproducibility between observers using this technique for assessment
of left ventricular parameters allows it to be a reliable tool for both baseline
ventricular assessments as well as for serial measurements. This will be particularly

77
useful for assessing ventricular remodelling with therapy in both clinical and
research settings.
In this study, we found that there was greater interobserver and intraobserver
variability in the right ventricular parameters. This could be due to factors related to
the shape of the RV, selection of the basal slice as well as the irregular surface of the
RV endocardial surface due to trabeculations, which results in some difficulty in
tracing the surfaces. These factors may be improved with further software
development to automate boundary detection and also assist in the selection of the
basal slice during analyses.
Our results were comparable to the results obtained with SSFP sequences in normal
populations except for slightly smaller left ventricular end-diastolic volumes in our
group. This could be due to the known difficulty in selecting the basal slice for
inclusion in ventricular volume analysis. Previous CMR studies on normal
ventricular parameters have predominantly used the older gradient echo pulse
sequence, although there are studies comparing it to the newer SSFP sequences
(Alfakih et al. 2003; Moon et al. 2002). The differences are small, but consistent
between the techniques, and may relate to variations in imaging characteristics of the
blood-myocardial interface with different sequences. In one study, the LV EDV and
LV ESV were larger and LV mass was smaller with SSFP imaging than with the
older sequences (Moon et al. 2002). However, this does highlight the need for robust
population based “normal” values for the different techniques, and furthermore
highlights that echocardiography based indices should not be used for CMR normal
indices.
Our results demonstrate a statistically significant difference between male and
female LV and RV volumes as well as in the LV mass, but no difference in the LV

78
EF. This has also been previously described. When indexed to body surface area, the
gender difference in LV mass persisted, but not the ventricular volumes.
3. 6. CONCLUSION
Cardiac magnetic resonance imaging provides high quality information about cardiac
structure and function, with a high level of reproducibility. Normal values for the
non-Aboriginal Australian population are provided. Further work to define such
values in Aboriginal Australians is required.

79
Chapter 4:
ASSESSMENT OF ATRIAL SEPTAL DEFECTS: A
COMPARATIVE STUDY IN ADULT PATIENTS WITH
CARDIAC MAGNETIC RESONANCE AND
TRANSOESPHAGEAL ECHOCARDIOGRAPHY

80
TABLE OF CONTENTS
4. 1. Introduction.................................................................................................. 81
4. 2. Methods ........................................................................................................ 83
4. 2. 1. Subjects................................................................................................. 83
4. 2. 2. Transoesophageal echocardiographic imaging ................................... 83
4. 2. 3. Cardiac Magnetic Resonance............................................................... 83
4. 2. 4. Measurement of the atrial septal margins and defect size .................. 84
4. 2. 5. ASD device implantation...................................................................... 85
4. 2. 6. Statistical Analysis................................................................................ 86
4. 3. Results........................................................................................................... 86
4. 3. 1. Assessibility of defect and margins with TOE..................................... 86
4. 3. 2. Assessibility of defect and margins with CMR.................................... 87
4. 3. 3. Agreement between TOE and CMR................................................... 87
4. 4. Discussion ..................................................................................................... 91
Conclusion............................................................................................................ 93

81
4. 1. INTRODUCTION
Atrial septal defects are the most common congenital cardiac malformation first
diagnosed in adults and account for approximately 10% of all congenital heart
lesions (Hoffman et al. 2004). Patients with a significant shunt (Qp/Qs >1.5/1.0)
experience symptoms over time with effort dyspnoea seen in about 30% of patients
by the third decade and in over 75% of patients by the 5th decade. Complications
may include the development of pulmonary hypertension, supraventricular
arrhythmias (atrial fibrillation and atrial flutter) and right-sided heart failure from
right ventricular volume overload.
Surgical closure of atrial septal defects (ASDs) has previously been shown to have
excellent results in both medium and long term studies (Roos-Hesselink et al. 2003),
but is associated with significant morbidity and mortality (Galal et al. 1994). Many
adults with secundum ASDs are now able to have these defects closed
percutaneously using septal occluder devices such as the Amplatzer Septal Occluder
(ASO), a self-expanding circular double disc with a conjoint waist containing
polytetrafluoroethylene (PTFE) and a nitinol mesh. This device has now become an
accepted alternative to surgical repair with studies comparing ASO device closure to
surgical closure showing decreased complication rates, shorter hospital stays and
greater cost-effectiveness (Du et al. 2002).
The echocardiographic morphology of the ASD and accurate assessment of the
stretched diameter has been important for patient selection. Initially, it was felt that
atrial septal defects up to 26 mm stretched diameter could be closed with the ASO
(Chan et al. 1999). More recently, there is registry data of larger ASDs closed
successfully using the 40 mm ASO (Lopez et al. 2005) and this has been standard

82
clinical practice (Harper et al. 2002). Inclusion criteria for percutaneous ASD closure
have included: 1) the presence of a secundum ASD <40mm by echocardiography, 2)
a left-to-right shunt with a Qp/Qs ratio of >1.5:1 or the presence of right ventricular
volume overload 3) patients with minimal shunt in the presence of symptoms and 4)
the presence of a distance of >5 mm from the margins of the ASD to the coronary
sinus, atrioventricular valves and right upper pulmonary vein as measured by
echocardiography (Cooke et al. 2001; Du et al. 2002; Harper et al. 2002).
Traditionally, these assessments of ASD size, geometry and atrial septal margins
have been obtained by transoesophageal echocardiography (TOE) prior to the
percutaneous closure (Cao et al. 2000; Cooke et al. 2001). This is a semi-invasive
technique and all of the information could potentially be obtained by non-invasive
cardiac magnetic resonance (CMR) imaging. Furthermore, TOE is imperfect at
assessing all atrial septal margins. A large atrial septal defect that is located
inferoposteriorly is difficult to both assess and close (Cooke et al. 2001) and relates
to the limited assessment of the posterior inferior margin by TOE (Durongpisitkul et
al. 2004).
The aim of this study was to compare the assessment of atrial septal defects in
consecutive adult patients being considered for percutaneous ASD closure using
CMR and TOE.

83
4. 2. METHODS
4. 2. 1. Subjects
Consecutive patients with secundum atrial septal defects diagnosed on transthoracic
echocardiography (TTE) were invited to undergo both transoesophageal
echocardiography (TOE) and cardiac magnetic resonance (CMR).
4. 2. 2. Transoesophageal echocardiographic imaging
TOE imaging was performed with a Sonos 5500 (Phillips) TOE system with a
multiplanar 7.0mHz phased-array transducer. Cross-sectional studies of the atrial
septum were performed utilising multi-plane views as previously described: mid-
oesophageal 4-chamber views, short axis view and biatrial long axis views (Cooke et
al. 2001).
4. 2. 3. Cardiac Magnetic Resonance
CMR studies were performed with subjects in the supine position using a 1.5 Tesla
MRI scanner (Siemens Sonata, Germany) and a phased array surface coil. Images
were obtained during end-expiratory breath-hold (8 to 10 seconds) with
retrospectively cardiac-gated True FISP (Fast imaging with steady-state free
precession) sequences. Both short (modified bi-atrial) and long axis images (4
chamber views) were obtained through the ASD, with section thickness of 6 mm and
no intersection gap. Thus, consecutive slices were obtained to cover the whole of the
interatrial septum in both short and long axis views. Assessment of atrial septal

84
margins, maximal and minimal defect dimensions in both short and long axis views
was performed.
4. 2. 4. Measurement of the atrial septal margins and defect
size
TOE and CMR studies were reviewed retrospectively and 2 independent observers
performed the measurements. Images were reviewed for (a) assessibility of defect
size and septal margins by TOE, and (b) assessibility of defect size and septal
margins by CMR, (c) Agreement of the measurements between TOE and CMR. The
maximal diameters of the atrial septal defects were measured on both TOE and
CMR. Atrial septal margins were measured as previously published (Durongpisitkul
et al. 2004; Masani 2001). The anterior inferior (AI) rim was measured from the
defect to the mitral valve, the anterior superior (AS) rim from the defect to the aortic
root, posterior inferior (PI) rim from the defect to the inferior vena cava and posterior
superior (PS) rim from the defect to the superior vena cava (see Figure 1).
The TOE views for measurement of the rims were: the mid-oesophageal four-
chamber view for AI rim, basal short axis view for AS rim and biatrial views for PI
and PS rims. Corresponding CMR views were the four-chamber view for AI rim,
short axis view through the aorta for the AS rim and modified biatrial short axis
views for PS and PI measurements. The size of the device occluder device used was
also compared to the maximal defect size on CMR and TOE in patients who
subsequently underwent ASD closure.

85
Figure 1 Atrial septal defect (ASD) and margins imaged with cardiac MRI (panel A
– 4 chamber view, panel B – modified biatrial short axis view) and transoesophageal
echocardiography (panel C – 4 chamber view, panel D – biatrial short axis view).
Margins are denoted with AS anterior superior rim, AI anterior inferior, PI posterior
inferior.
4. 2. 5. ASD device implantation
All implantation of the ASD devices with the Amplatzer Septal occluder were
performed with TOE guidance and fluoroscopy. A sizing balloon was used to
determine the stretched diameter of the ASD before selection and deployment of
ASO device, as previously described (Harper et al. 2002). In brief, a Meditech
balloon (Boston Scientific, Watertown, MA) sized 20 or 27 mm was used in this
series. This balloon was inflated within the left atrium and firm continuous pressure
applied to pull it into the atrial septum, using TOE guidance. The diameter at which

86
the balloon just gets through the atrial septal defect was the stretched balloon
diameter (SBD).
4. 2. 6. Statistical Analysis
Data is presented as mean ± standard deviation. Analyses between TOE and CMR
were made using simple linear regression analysis (SPSS 11.0 software) and Bland
Altman analysis (Bland and Altman 1986). Statistical significance was taken at a p
value of 0.05 or less.
4. 3. RESULTS
A total of 20 patients (M: F = 5: 15, mean age 42.8 years ± 15.7) were included in
the analyses. All but 1 patient had both TOE and CMR to evaluate their suitability
for percutaneous ASD closure. TOE was not performed in 1 patient due to history of
an oesophageal stricture. CMR was well tolerated in all patients. Total CMR
examination time was 20 to 30 minutes in all cases. Three patients were found not to
be suitable for percutaneous ASD closure due to excessive ASD diameter of >30 mm
on both TOE and CMR (CMR diameters 32, 38 and 33 mm) and all 3 patients went
on to surgical closure.
4. 3. 1. Assessibility of defect and margins with TOE
The maximal defect size could be assessed in all patients (n=20) with TOE. The
anterior inferior (AI) margin, which was measured from the defect to the mitral valve
in the mid-oesophageal 4-chamber view could be assessed in all patients. The

87
anterior superior margin was assessable in 80%, the posterior inferior margin in 60%
and the posterior superior margin in 70% of patients (See Table 1).
Table 1. Assessment of atrial septal defect size and margins (CMR vs. TOE)
Able to be assessed by
CMR (%)
Able to be assessed by
TOE (%)
Maximal defect size (20/20) 100% (20/20) 100%
Anterior superior margin (20/20) 100% (16/20) 80%
Anterior inferior margin (20/20) 100% (17/20) 85%
Posterior superior margin (19/20) 95% (14/20) 70%
Posterior inferior margin (20/20) 100% (12/20) 60%
4. 3. 2. Assessibility of defect and margins with CMR
The maximal defect size could be assessed in all patients (n=20) with CMR. The
anterior inferior, anterior superior and posterior inferior margins could be assessed in
all patients. The posterior superior margin could not be assessed in only one patient.
4. 3. 3. Agreement between TOE and CMR
There was a good agreement between CMR and TOE for estimation of maximum
defect size (R=0.87) and minimum defect size (0.92). There was similar agreement
between CMR and TOE versus size of the ASO device (Maximum defect size by
CMR vs. ASO size, R=0.53 and maximum defect size by TOE vs. ASO size
R=0.57).
Bland and Altman analyses comparing CMR and TOE measurements of defect size
and atrial septal margins are shown in Figures 2A to E and presented as mean of the

88
2 measurements obtained by MRI and TOE ± difference between the 2
measurements.
Figure 2 (A to E): Bland Altman comparative analyses of the mean ASD
dimensions and difference in dimensions between CMR and TOE for A. Maximum
defect size, B. Anterior inferior (AI) margins, C. Anterior superior (AS) margins, D.
Posterior inferior (PI) margins and E. Posterior superior (PS) margins.
Figure 2 A

89
Figure 2 B
Figure 2 C

90
Figure 2 D
Figure 2 E

91
4. 4. DISCUSSION
Many adults with secundum atrial septal defects are now able to have these defects
closed percutaneously. The size, location and margins of an atrial septal defect are
major determining factors for transcatheter closure. Conventional assessment pre-
closure has been with transoesophageal echocardiography (TOE) for measurement of
ASD dimensions and margins (Cao et al. 2000; Cooke et al. 2001). Inclusion criteria
for closure have included ASD maximum diameter of 40 mm and rims of at least 5
mm towards the IVC, SVC, right upper pulmonary vein and mitral valve (Du et al.
2002; Harper et al. 2002). However, more recently, deficiency of the margins has
still allowed closure. For example, in patients with a deficient anterior superior (AS)
margin, a correctly sized Amplatzer septal occluder can successfully be used with the
device moulding itself around the aortic wall with minimal risk of perforation (Du et
al. 2002; Harper et al. 2002). There have also been small numbers of patients with
small inferior and posterior defect margins (<5mm) who have been successfully
closed (Du et al. 2002).
While TOE has been the traditional method for the evaluation and screening for
patients who are candidates for transcatheter closure, it is semi-invasive and cannot
easily be performed in young children and some adults. Measurements of the ASD
can only be obtained from the 4-chamber, short axis and bicaval views on TOE due
to the plane on TOE that generally projects the ASD in a relatively fixed direction
(Durongpisitkul et al. 2004). In addition, TOE may underestimate the size of the
stretched balloon diameter of the ASD, although this has been described to factors
associated with choice of plane for maximal diameter in defects that are oval rather
than circular in shape, displacement of the interatrial septum from enlarged right

92
atrium and changes of the shape of the defect during the cardiac cycle (Cooke et al.
2001; Fischer et al. 1999). Three-dimensional echocardiography obtained from TOE
images may provide superior anatomic detail (Cao et al. 2000; Zhu et al. 2000), but
the accuracy of the reconstructed images is dependent on technical experience of the
operator (Harper et al. 2002).
Cardiac magnetic resonance (CMR) imaging has been shown to visualise secundum
ASDs (Durongpisitkul et al. 2004; Holmvang et al. 1995). Studies comparing MRI
with TOE to assess ASD and suitability for percutaneous closure have mainly been
done in paediatric populations (Durongpisitkul et al. 2004), although there are a
limited number of small studies with adult patients (Piaw et al. 2006).
In this study, we were able to assess maximal atrial defect size in all patients with
both TOE and CMR. In the assessment of atrial septal margins, CMR could assess
the posterior inferior margins in all patients compared to approximately 60% that
could be assessed with TOE. One recent study in a paediatric population comparing
TOE and MRI assessment showed that patients who had successful closure had a
significantly smaller major axis of ASD and larger posterior inferior rim compared to
those who were excluded from closure procedure. An adequate posterior inferior rim
was also best visualised in that study with CMR and showed a better correlation of
ASD diameter measurement to balloon sizing compared to TOE (Durongpisitkul et
al. 2004). However, a limitation in our study of the measurement of margins using
TOE relates to this study being a retrospective study and with the images that were
strictly required for measurement of the margins (such as the PI margin) not being
available in some patients. Hence the 60% assessibility for the PI margin is not a true
reflection of the ability of TOE to define this margin.

93
Although velocity encoded contrast cine imaging was not performed in this study,
this is another CMR technique that can provide further information in the assessment
of atrial septal defects. It enables an accurate assessment of shunt magnitude from
measuring flow in the systemic and pulmonary circulations (Brenner et al. 1992;
Hundley et al. 1995) and provides information about the size and shape of the atrial
septal defect (Holmvang et al. 1995). However, this technique has not been used for
the assessment of margins due to its limited spatial resolution.
CONCLUSION
CMR agrees closely with TOE assessment of atrial septal defects for percutaneous
closure. In addition, it is able to assess the septal margins such as the posterior
inferior margin, which is known to be difficult to assess with TOE. Potentially,
CMR could be used instead of TOE for the assessment for percutaneous closure.

94
Chapter 5:
PERCUTANEOUS CLOSURE OF ATRIAL SEPTAL
DEFECTS LEADS TO NORMALISATION OF RIGHT
ATRIAL, RIGHT AND LEFT VENTRICULAR
VOLUMES: VENTRICULAR INTERDEPENDENCE
AND CARDIAC MAGNETIC RESONANCE IMAGING

95
TABLE OF CONTENTS
5. 1. Introduction.................................................................................................. 96
5. 2. Methods ........................................................................................................ 98
5. 2. 1. Subjects.......................................................................................................................98
5. 2. 2. CMR Imaging............................................................................................................98
5. 2. 3. CMR Image Analysis ...............................................................................................99
5. 2. 4. ASD device implantation .......................................................................................100
5. 2. 5. Follow-up MRI ........................................................................................................100
5. 2. 6. Reproducibility........................................................................................................100
5. 2. 7. Statistical Analysis ..................................................................................................101
5. 3. Results..........................................................................................................101
5. 3. 1. Atrial changes..........................................................................................................102
5. 3. 2. Ventricular changes................................................................................................102
5. 3. 3. Reproducibility........................................................................................................105
5. 3. 3. 1. Interobserver variability ................................................................................................ 105
Figure 4 ............................................................................................Error! Bookmark not defined.
5. 3. 3. 2. Intraobserver variability ................................................................................................ 108
5. 4. Discussion ....................................................................................................108
ASD Closure ................................................................................................................................... 110
Percutaneous ASD Closure............................................................................................................ 111
Interventricular dependence........................................................................................................... 112
5. 5. Conclusions..................................................................................................114

96
5. 1. INTRODUCTION
Atrial septal defects (ASDs) are the most common congenital cardiac malformation
first diagnosed in adults and account for approximately 10% of all congenital heart
lesions (Hoffman and Kaplan 2002; Hoffman et al. 2004). Patients with a significant
shunt experience symptoms over time with effort dyspnoea seen in about 30% of
patients by the third decade and in over 75% of patients by the fifth decade
(Campbell 1970). The natural course of untreated atrial septal defects often leads to a
shortened life expectancy compared to healthy subjects (Campbell 1970).
Longstanding right heart, pulmonary arterial and venous volume overload and
dilatation in the setting of an ASD may lead to the development of right heart failure,
arrhythmia, thromboembolic events, pulmonary vascular obstructive disease
(Campbell 1970; Jones et al. 1983; Steele et al. 1987). In adults with an ASD and
chronic right atrial volume overload, there may be long-term arrhythmias which do
not seem to be affected by closure of the defect (Murphy et al. 1990). In patients
aged greater than 40 years with atrial septal defects closed surgically, 60% of these
patients develop atrial arrhythmias late after surgery (Berger et al. 1999). This may
be contributed by chronic right atrial stretch which causes electrophysiological
alterations that persist beyond ASD closure (Morton et al. 2003).
Surgical repair of atrial septal defects has previously been shown to have excellent
results in both medium and long term studies (Roos-Hesselink et al. 2003). In one
retrospective study of patients over 40 years of age with isolated atrial septal defects,
surgical repair increased long term survival, with adjusted 10 year survival rate of
95% compared to 84% in the medically treated group (Konstantinides et al. 1995).
In addition, surgical treatment prevented functional deterioration due to heart failure.

97
However, surgical repair is associated with significant morbidity from peri-operative
complications such as pleural effusions, sepsis and pericardial tamponade (Galal et
al. 1994), although the long-term outcome after surgical ASD closure at a young age
is much better than surgical closure at adult age (Roos-Hesselink et al. 2003).
Many adults with secundum ASDs are now able to have these defects closed
percutaneously using septal occluder devices such as with the Amplatzer Septal
Occluder (ASO), a self-expanding circular double disc that has a conjoint waist
containing polytetrafluoroethylene (PTFE) and a nitinol mesh. This device has
become an accepted alternative to surgical repair with studies comparing ASO
device closure to surgical closure showing decreased complication rates, shorter
hospital stays and greater cost-effectiveness (Du et al. 2002). Percutaneous closure
of atrial septal defects should reduce right heart volumes by removing left-to-right
shunting and thus, lead to symptomatic improvement and increased exercise capacity
(Brochu et al. 2002; Du et al. 2002; Giardini et al. 2007). However, the effects on left
ventricular volumes and function are less well described. Ventricular
interdependence is a described phenomenon and suggests that a left ventricular effect
may well be expected post-ASD closure. Furthermore, atrial changes post-ASD
closure have been poorly understood and it is unclear whether there is a significant
decrease in atrial arrhythmia post-ASD closure. Thus, atrial changes post-closure
may be important for understanding the risk of atrial arrhythmia post-ASD closure.
Cardiac magnetic resonance (CMR) imaging is an accurate and reproducible imaging
modality for the assessment of cardiac function and volumes. Thus, we sought to use
CMR to assess ventricular and atrial volumes directly to document structural changes
post-ASD closure.

98
5. 2. METHODS
5. 2. 1. Subjects
Consecutive patients with secundum atrial septal defects diagnosed on transthoracic
and transoesophageal echocardiography with significant left to right shunt (>1.5:1)
underwent CMR pre-ASD closure and 6 months post- ASD closure with the
Amplatzer Septal Occluder. Only patients in sinus rhythm pre-ASD closure were
included.
5. 2. 2. CMR Imaging
All CMR imaging studies were performed with subjects in the supine position using
a 1.5 Tesla MRI scanner (Siemens Sonata, Germany) and a phased array surface coil.
For the ventricular image set, long-axis reference views were used for positioning 8
to 12 perpendicular ventricular short-axis slices from the level of the mitral valve to
the left ventricular apex. Images were obtained during end-expiratory breath-hold (8
to 10 seconds) with retrospectively ECG-gated True-FISP (Fast Imaging with
Steady-State Precision) sequences (Image matrix 256 X 150, field of view 380 mm,
repetition time 52.05 ms, echo time 1.74 ms and flip angle 70°). Ventricular short
axis slice thickness was 6 mm with intersection gaps of 4 mm, based on previous
published studies (Alfakih et al. 2003; Lorenz et al. 1999). For the atrial image set,
multiple contiguous slices in both short (bi-atrial) and horizontal long axis views
(four chamber) were obtained through the ASD, with slice thickness of 6 mm and no
intersection gap

99
5. 2. 3. CMR Image Analysis
Ventricular and atrial analyses were performed off-line with a proprietary software
program (Argus software, Siemens Medical Solutions, Germany). For the left
ventricular (LV) data set, short-axis endocardial and epicardial contours were
manually traced in end-diastole (at start of R-wave) and in end-systole (smallest
cavity area). Papillary muscles and trabeculations were excluded from the ventricular
volume and were included if contiguous with the myocardial mass. The basal slice
was selected as the slice where the blood volume was surrounded by >50% of
ventricular myocardium (Alfakih et al. 2003; Lorenz et al. 1999). For the right
ventricular (RV) data set, one observer manually traced the endocardial contours at
end-diastole and at end-systole. The selection of the RV basal slice was based on
published methods where, if the pulmonary valve was seen, only the portion of the
volume below the level of the pulmonary valve was included (Alfakih et al. 2003).
Both LV and RV end-diastolic and end-systolic cavity surface areas were summed
up and volumes: end-diastolic (EDV) and end-systolic (ESV) estimated by
multiplying with interslice intervals as per Simpson’s rule. Ejection fraction (EF)
was calculated as EF = (EDV-ESV)/EDV X 100 (%). LV mass = 1.05 X (epicardial
volume – endocardial volume).
A true three-dimensional atrial volume assessment technique in which the
endocardial borders were manually traced for both left and right atria in the
horizontal long axis (four chamber) views in ventricular end-systole when atrial
volume is maximal (Hauser et al. 2004). Borders of left atrium were defined as the
plane of the mitral valve and the visually apparent juncture of left atrium with
pulmonary veins. Borders of right atrium were defined as the plane of the tricuspid

100
valve and the juncture with the vena cavae. The atrial appendage was included if
present on the images. Atrial volumes were calculated as a sum of atrial cavity areas
with interslice intervals using a modification of Simpson’s rule.
5. 2. 4. ASD device implantation
All ASDs were closed with the Amplatzer Septal occluder (AGA medical
corporation). Procedures were performed under general anaesthesia with
transoesophageal echocardiographic guidance and fluoroscopy. A sizing balloon was
used to determine the stretched diameter of the ASD before selection and
deployment of ASO device, as previously described (Harper et al. 2002). In brief, a
Meditech balloon (Boston Scientific, Watertown, MA) sized 20 or 27 mm in this
series is used. This balloon is inflated within the left atrium and firm continuous
pressure applied to pull it into the atrial septum, using TOE guidance. The diameter
at which the balloon just gets through the atrial septal defect is the stretched balloon
diameter (SBD).
5. 2. 5. Follow-up MRI
Cardiac MRI was repeated at 6 months from the time of the ASD closure, with the
full dataset obtained to re-assess cardiac volumes and function (see Figure 1).
5. 2. 6. Reproducibility
Intra- and inter- observer variability was assessed for the left and right atrial and
ventricular parameters.

101
5. 2. 7. Statistical Analysis
Data is presented as mean ± standard deviation. Comparison of cardiac volumes pre-
and 6 months post-ASD closure was performed with paired t testing between groups.
Statistical significance was taken as p<0.05. Inter and intraobserver variability was
assessed using the Bland and Altman method (Bland and Altman 1986) as well as
intraclass correlation coefficients. The correlation calculation is a statistical method
to quantify the relationship between two variables measured independently and
where r=1 is taken as a perfect correlation.
5. 3. RESULTS
A total of 23 patients were included in the study with pre-ASD closure MRI studies
performed (mean age 51.2 ± years, 20 females and 3 males). Two patients went on to
surgical closure of their ASDs due to size of the defect and were excluded from the
analysis. Follow up cardiac MRI studies were obtained in 20 patients (see Figures 1
and 2).

102
Figure 1. Four chamber CMR views showing the ASD pre- (panel A) and post-
closure with the Amplatzer Septal Occluder (ASO) device (panel B). RA=right
atrium, LA=left atrium, RV=right ventricle and LV=left ventricle.
Figure 2. Bi-atrial short axis views showing the ASD (same patient as Figure 1) pre-
(panel A) and post-closure with the ASO (panel B). RA=right atrium, LA=left
atrium, Ao=aorta and IVC = inferior vena cava)
5. 3. 1. Atrial changes
There was a significant reduction in right atrial volumes at 6 months post-ASD
closure (pre-closure 110.5 ± 55.7 vs. post-closure 90.7 ± 69.3 mls, p=0.019). There
was no significant difference in left atrial volumes post-ASD closure.
5. 3. 2. Ventricular changes
There was a significant reduction in right ventricular volumes at 6 months post-ASD
closure (RVEDV: 208.7 ± 76.7 vs. 140.6 ± 60.4 mls, p< 0.0001) and RVEF was
significantly increased (RVEF 35.5 ± 15.5 vs. 42.0 ± 15.2 %, p= 0.025). Left
ventricular volumes were significantly increased (LVEDV 84.8 ± 32.3 vs. 106.3 ±

103
38.1 mls, p= 0.003 and LVESV 37.4 ± 20.9 vs. 46.8 ± 18.5 mls, p=0.016). There was
no significant difference in LVEF and LV mass post-ASD closure. See Table 1.
Table 1. CMR data pre and post- percutaneous ASD closure.
Pre-closure Post-Closure Change (%) P-value
RV EDV (mls) 208.7 ± 76.7 140.6 ± 60.4 32.6 < 0.0001
RV ESV (mls) 134.0 ± 63.7 81.6 ± 41.5 39.1 < 0.0001
RV EF (%) 35.5 ± 15.5 42.0 ± 15.2 18.3 0.025
LV EDV (mls) 84.9 ± 32.3 106.3 ± 38.1 25.2 0.003
LV ESV (mls) 37.3 ± 20.9 46.8 ± 18.5 25.4 0.016
LV EF (%) 61.7 ± 12.8 58.2 ± 9.0 5.7 NS
LV mass (g) 91.2 ± 29.5 103.0 ± 48.0 12.9 NS
RA vol. (mls) 110.5 ± 55.7 90.7 ± 69.3 17.9 0.019
LA vol. (mls) 84.5 ± 34.8 81.8 ± 44.2 3.2 NS
RV= right ventricle, LV = left ventricle, RA= right atrial, LA = left atrial, EDV =
end-diastolic volume, ESV = end-systolic volume, EF = ejection fraction,
vol.=volume, NS = non-significance.
Figure 3. shows an illustration of a reduction in RV volumes post-ASD closure
associated with normalisation of LV volumes.

104
Figure 3. Short axis views of the left (LV) and right (RV) ventricles pre- (panel A)
and post-ASD closure (panel B). There was a significant reduction in RV volumes
post-ASD closure associated with normalisation of LV volumes.
Indexed right ventricular volumes (to body surface area) pre-ASD closure were
greater than aged-matched controls at baseline (RV EDV/BSA 130.1±23.8 vs. 65.9
±15.9, p<0.0001 and RV ESV/ BSA 77.7±31.1 vs. 33.9±24.1, p<0.0001), but were
not significantly different to aged-matched controls post-ASD closure (RV
EDV/BSA 84.6±36.3 vs. 65.9±15.9, p=0.06 and RV ESV/BSA 47.6±24.1 vs. 33.9±
16.5, p=0.07). Indexed left ventricular volumes and mass were not significantly
different to aged-matched controls pre- or post- ASD closure. See Table 2.
Table 2. Comparison of indexed RV and LV volumes to aged-matched controls
Pre-closure
(ml/m2)
Post-closure
(ml/m2)
Aged-match
(ml/m2)
Unpaired t-
test (vs. post-
closure)
RV EDV/ BSA 130 ± 32.8 84.6 ± 36.3 65.9 ± 15.9 0.07
RV ESV/ BSA 77.7 ± 31.1 47.6 ± 24.1 33.9 ± 16.5 0.07
LV EDV/ BSA 51.8 ± 12.6 64.8 ± 16.1 59.6 ± 14.3 NS
LV ESV/ BSA 21.0 ± 10.8 26.4 ± 10.2 25.9 ± 8.1 NS

105
LV mass/ BSA 50.6 ± 13.4 58.6 ± 29.5 49.8 ± 9.1 NS
5. 3. 3. Reproducibility
5. 3. 3. 1. Interobserver variability
Intraclass correlation coefficients between 2 independent observers for RV and LV
parameters were: RV EDV 0.93, RV ESV 0.89, LV EDV 0.96, LV ESV 0.89, LV
mass 0.84, RA vol 0.92, LA vol 0.87, RV EF 0.70, LVEF 0.94. Results from the
Bland and Altman analyses for interobserver variability for LV and RV are presented
as mean, the difference between the means ± 2 SD (Figures 4A to F).
Figure 4 A. Bland Altman Analysis for interobserver LVEDV.

106
Figure 4 B. Bland Altman Analysis for interobserver LVEF.
Figure 4 C. Bland Altman Analysis for interobserver RVEDV.

107
Figure 4 D. Bland Altman Analysis for interobserver RVEF.
Figure 4 E. Bland Altman Analysis for interobserver LA volume.

108
Figure 4 F. Bland Altman Analysis for interobserver RA volume.
5. 3. 3. 2. Intraobserver variability
Intraclass correlation coefficients for intraobserver variability for RV and LV
parameters were RV EDV 0.89, RV ESV 0.85, LV EDV 0.95, LV ESV 0.98, RA vol
0.98, LA vol 0.84, RV EF 0.77, LV EF 0.91.
5. 4. DISCUSSION
We have shown that percutaneous ASD closure leads to a reduction in RV volumes,
in association with an increase in LV volumes by CMR imaging. This was associated
with an improvement in RVEF, but no change in LVEF. Furthermore, for the first
time, we have seen a significant decrease in right atrial volumes post-ASD closure by
CMR, but a non-significant change in left atrial volumes.

109
In our study, we have used cardiac magnetic resonance (CMR) imaging to obtain a
full volume data set for both ventricles and atria. CMR has been shown to be safe
post-cardiovascular implants (Prasad and Pennell 2004) and has become the gold
standard in the assessment of left and right ventricular volumes, function and mass
with excellent accuracy and reproducibility (Alfakih et al. 2003; Grothues et al.
2004; Grothues et al. 2002; Lorenz et al. 1999). Furthermore, compared to
echocardiography, CMR has the advantage in the assessment of right ventricular
volumes, given the non-geometric shape of the right ventricle, which makes
quantification of right ventricular volume difficult by echocardiography. Previous
studies on the effect of ASD closure on chamber volumes have mainly been
performed using echocardiography although more recently, there have been a couple
of studies that have looked at atrial and ventricular changes using CMR (Burgstahler
et al. 2007; Schoen et al. 2006).
Atrial assessments of atrial dimensions using a one or two-dimensional parameter or
estimation of atrial volume based on two-dimensional image algorithms have
limitations. Echocardiography M-mode atrial dimension as a measure of atrial size
assumes that a direct relationship between this one-dimensional measurement and
atrial volume. Biplane two-dimensional echocardiography assumes an elliptical
geometry of the atria (Kircher et al. 1991). These clearly are not exact, due to the
variable and non-uniform geometry of the atria with significant differences
demonstrated in the measurement of atrial volumes using biplane area length and
biplane modified Simpson methods (Jiamsripong et al. 2007). Atrial enlargement
may also be asymmetrical. CMR volume assessment of the atrium with cine imaging
requires no assumptions about the geometry of the atria and has become an accepted
standard for the determination of atrial volumes (Jarvinen et al. 1994; Jarvinen et al.

110
1996; Sievers et al. 2004). We therefore obtained a true three-dimensional atrial
volume assessment technique in which the atrial borders were traced for both left and
right atria in the horizontal long axis (four chamber) views in ventricular end-systole
when atrial volume is maximal (Hauser et al. 2004).
ASD Closure
Echocardiography studies in adult and paediatric patients with closure of atrial septal
defects have shown a reduction in right atrial areas and ventricular volumes after
ASD closure both surgically (Shaheen et al. 2000) and percutaneously (Du et al.
2001; Kort et al. 2001; Schoen et al. 2006; Schussler et al. 2005; Thilen and Persson
2006; Veldtman et al. 2001). However, there is a subgroup of patients where right
atrial and right ventricular sizes do not normalize. This has been reported in adult
patients of 28% for RA (Thilen and Persson 2006) and 29% for RV 1 year after
percutaneous closure (Veldtman et al. 2001). Persistent right atrial and ventricular
enlargement is associated with higher age at closure (Du et al. 2001; Kort et al. 2001;
Thilen and Persson 2006; Veldtman et al. 2001). However, even in the group of
patients who had ASD closure during childhood, there was a group (>20%) with
persistent RV dilatation and RA enlargement (Roos-Hesselink et al. 2003).
RV ejection fraction has been shown to decrease after surgical ASD repair. The
possible causes of this were thought to include a true reduction in RV ejection
fraction post-operatively, less volume overload of the right ventricle, less paradoxical
septal motion or an inaccuracy in echocardiography methods for evaluating RV
ejection fraction (Shaheen et al. 2000). RV systolic and diastolic function may be
supra normal due to the increased pulmonary blood flow, while those of the left
ventricle may be within normal range (Dhillon et al. 2002). No changes were found

111
in left ventricular (LV) volumes and ejection fraction in this study (Shaheen et al.
2000). Global LV function has been shown to improve after percutaneous ASD
closure. In a recent study, myocardial performance index (MPI), a measure of
combined systolic and diastolic function (Eidem et al. 1998) was significantly
improved for both RV and LV (Salehian et al. 2005) in patients who underwent
percutaneous ASD closure. The same index measured post-surgical ASD closure has
been shown to be not significantly different (Eidem et al. 1998) and previous
investigators have indicated that this may be contributed to by cardiopulmonary
bypass (Dhillon et al. 2002; Shaheen et al. 2000), which is avoided by percutaneous
closure.
Percutaneous ASD Closure
Cardiac remodelling post-ASD closure has been shown to be an early event, with
reduction in right ventricular and atrial sizes occurring in the first week post-closure
and that after 4 months no changes were observed (Thilen et al. 2000). Significant
changes also occurred in the left ventricle, with increase in LV dimensions post-
closure, but without changes in LA dimensions.
Because of its shape, quantitative echocardiographic methods to evaluate RV
volumes have been difficult and thus limited to 2-D measurements. Right-sided
cardiac parameters measured have included RV and RA diameters, RVOT diameters
and the assessment of paradoxical septal motion (Brochu et al. 2002; Du et al. 2001;
Salehian et al. 2005; Veldtman et al. 2001). Even at one month post-ASD closure,
mean RV size and mean RVOT diameter was significantly reduced to within normal
limits while mean right atrial length showed a trend toward shortening at one month
and reached significance at 6 months (Veldtman et al. 2001). At one year, a third of

112
patients demonstrated persistent RV enlargement (Veldtman et al. 2001). Our data
with more accurate assessment of right atrial dimensions clearly shows a volume
reduction in all patients.
Closure of secundum ASD results in decreased indexed RV volume (as measured by
transthoracic echocardiography) comparable to that in control subjects at 24 months
following closure. However indexed RA area remained greater than in the control
group. Decrease in indexed RA area over the first 12 months of follow-up was
related to young age at time of closure (Kort et al. 2001).
Global LV function has been shown to improve after percutaneous ASD closure. In a
recent study, myocardial performance index (MPI), a measure of combined systolic
and diastolic function (Eidem et al. 1998) was significantly improved for both RV
and LV (Salehian et al. 2005) in patients who underwent percutaneous ASD closure.
The same index measured post-surgical ASD closure has been shown to be not
significantly different (Eidem et al. 2000) and previous investigators have indicated
that this may be contributed to by cardiopulmonary bypass (Dhillon et al. 2002;
Shaheen et al. 2000), which is avoided by percutaneous closure. In our data set
however, there was no significant change in LVEF although both LVEDV and
LVESV increased.
Interventricular dependence
Ventricular interdependence has been well described in echocardiography studies
and highlights the important role of the inter-ventricular septum in RV and LV
function. In RV volume overload, the septum bulges into and encroaches on the LV
cavity and leads to impairment of LV filling. The right ventricle is also more

113
compliant than the left ventricle so the left ventricle is relatively under filled. The
mechanisms for decreased LV performance associated with RV volume overload
include the mechanical disadvantage of a non-circular short axis configuration and
changes in chamber and myocardial preload (Walker et al. 2004).
Reduced LV systolic function associated with RV volume overload has been
described (Davies et al. 1970; Popio et al. 1975; Weyman et al. 1976). One
echocardiographic study has reported the occurrence of adverse ventricular
interdependence associated with RV volume overload in patients with ASDs (Walker
et al. 2004) in which the septum bulges into and encroaches on the LV cavity and
leads to impairment of LV filling. Since the right ventricle is also more compliant
than the left ventricle, the left ventricle is relatively under filled. However, the
reversibility of this ventricular dysfunction after elimination of the RV volume
overload with surgical closure has not been consistently demonstrated (Davies et al.
1970). This may reflect surgical confounding factors that affect LV function,
including pericardectomy, cardiopulmonary bypass and postoperative alterations in
preload, afterload and heart rate (Walker et al. 2004).
Percutaneous device closure of the ASD avoids the confounding factors caused by
surgery. In a study of 34 patients, LV ejection fraction obtained by echocardiography
improved significantly from 54.9 to 62.1% (P < 0.001) (Walker et al. 2004).
In our study, left ventricular volumes were reduced as compared to normal values,
but increased 6 months post-closure of the ASD. This is similar to a recent study
which looked at left ventricular dimensions with CMR post-ASD closure (Weber et
al. 2006). In addition, they found NT-proBNP concentrations were within the normal

114
range pre-ASD closure, but increased early after interventional closure and was
associated with the increase in left ventricular dimensions as assessed by MRI
(Weber et al. 2006).
5. 5. CONCLUSIONS
Percutaneous ASD closure leads to normalisation of both RV and LV volumes using
CMR. With a true volumetric CMR technique, we note that RA volume reduces
significantly although the small LA volume reduction was not significant. This may
have important implications for future risk of atrial arrhythmogenicity.

115
Chapter 6
COMBINATION HIGH-DENSITY LIPOPROTEIN
INFUSION AND ATORVASTATIN SIGNIFICANTLY
REDUCES EXPERIMENTAL ATHEROSCLEROSIS
COMPARED TO EITHER THERAPY ALONE: SERIAL
ANALYSIS WITH HIGH-RESOLUTION MRI
116
TABLE OF CONTENTS
6. 1. Introduction.................................................................................................117
6. 2. Methods .......................................................................................................119
6. 2. 1. Animal Model ..........................................................................................................119
6. 2. 2. Isolation of HDL......................................................................................................120
6. 2. 3. Establishment of Experimental Atherosclerosis ................................................120
6. 2. 4. Experimental Protocol ...........................................................................................120
6. 2. 5. MR imaging of the abdominal aorta....................................................................121
6. 2. 6. MR imaging analysis ..............................................................................................121
6. 2. 7. Statistical Analysis ..................................................................................................122
6. 3. Results..........................................................................................................122
6. 3. 1. Changes in vessel wall area (VWA) .....................................................................123
6. 3. 2. Changes in Maximal wall thickness .....................................................................125
6. 4. Discussion ....................................................................................................125
6. 5. Conclusion ...................................................................................................128

117
6. 1. INTRODUCTION
Atherosclerotic diseases and its thrombotic cardiovascular complications continue to
be a leading cause of mortality (Worthley et al. 2000). Lipid lowering therapy with
statins has significant benefit on cardiovascular diseases and mortality in both
primary and secondary prevention clinical trials (Group 1998; Group 1994; Sacks et
al. 1996). Statins reduce both cardiovascular events and the progression of
atherosclerosis through a reduction in low density lipoprotein (LDL) cholesterol
(2002; LaRosa et al. 2005; Nissen et al. 2004). In addition to its LDL cholesterol
lowering properties, statins have been postulated to have pleiotropic effects such as
reduction of the inflammatory burden (Libby 2001; Nissen et al. 2005; Sukhova et al.
2002), improved endothelial function (Hernandez-Perera et al. 1998; Jarvisalo et al.
1999) and reduced thrombogenecity (Dangas et al. 1999; Rauch et al. 2000). In
human studies, statin therapy also results in the regression and stabilization of lipid-
rich plaques (Callister et al. 1998; Corti et al. 2001; Crisby et al. 2001). The
ASTEROID trial, a multicenter, intravascular ultrasound (IVUS) study assessed
coronary atheroma at baseline and after 2 years of very high-intensity statin therapy
with rosuvastatin achieved a mean reduction of 53% of LDL-cholesterol from
baseline and increased HDL-C by 15% and resulted in significant regression of
atherosclerosis (Nissen et al. 2006).
There is evidence that increasing HDL cholesterol levels is beneficial with an inverse
relationship seen between levels of HDL cholesterol (HDL-C) and the risk of
cardiovascular events (Gordon et al. 1989; Manninen et al. 1988; Rubins et al. 1999).
Animal studies of increasing plasma HDL-C have shown a beneficial effect
(Badimon et al. 1990; Corti et al. 2004). Even a short-term infusion of HDL with
apolipoprotein A-I reduced atherosclerotic lesion size (Nicholls et al. 2005) and

118
infusion of recombinant ApoA-I Milano produced rapid regression of atherosclerosis
(Shah et al. 2001) (Soma et al. 1995). Recombinant ApoA-I Milano is a variant of
apolipoprotein A-I and mimics the properties of nascent HDL (Nissen et al. 2003). In
humans after an acute coronary syndrome, short-term recombinant ApoA-1 Milano
infusion resulted in significant regression of atheroma burden as assessed by
intravascular ultrasound (Nissen et al. 2003).
Fibric acid derivatives are proliferator-activated receptor alpha (PPAR- ) agonists
that decrease triglyceride concentrations and raise HDL-cholesterol. Pre-clinical data
in a rabbit model of atherosclerosis using high resolution MRI showed fenofibrate
regressed atherosclerosis when compared to placebo (Corti et al. 2007). The Helsinki
Heart Study, a primary prevention trial with gemfibrozil provided the first evidence
of benefit of fibrate therapy and showed a 34 percent reduction in the incidence of
coronary heart disease in the gemfibrozil treated group (Frick et al. 1987). This has
been confirmed in VA-HIT (the Veterans Affairs Cooperative Studies Program
High-Density Lipoprotein Cholesterol Intervention Trial), where gemfibrozil
decreased the risk of coronary heart disease in patients with normal LDL-cholesterol
and low HDL-cholesterol (Rubins et al. 1999).
Cholesteryl ester transfer protein (CETP) is a glycoprotein that promotes the transfer
of cholesteryl esters from antiatherogenic HDLs to proatherogenic apolipoprotein B
(apo B)–containing lipoproteins such as VLDLs, VLDL remnants, IDLs and LDLs.
CETP inhibition may provide a powerful therapeutic approach to raising HDL levels,
lowering LDL levels and reducing the development of atherosclerosis. Animal
studies in rabbits, a species with naturally high levels of CETP have demonstrated
that inhibiting CETP results in a marked reduction of atherosclerosis (Sugano et al.

119
1998). However, expression of CETP in transgenic mice, a species that is naturally
deficient in this protein has shown both an increased susceptibility and protection
against atherosclerosis in different models (Berard et al. 1997; Foger et al. 1999). In
humans, a previous single-blind placebo-controlled study found that in subjects with
low-HDL levels, CETP inhibition with torcetrapib markedly increased HDL-C levels
by 61% in those also treated with atorvastatin and 46% in the non-atorvastatin group
(Brousseau et al. 2004).
High-resolution magnetic resonance imaging is a safe, non-invasive technique that
can be used to serially monitor the vessel wall and document atherosclerotic burden.
It has been validated in animal models including rabbit models for the measurement
of atherosclerotic burden and composition (Helft et al. 2001; Worthley et al. 2000;
Worthley et al. 2000; Worthley et al. 2000).
The aim of this study was to analyse the effect of a statin (atorvastatin) alone and in
combination with HDL infusion and compared with controls in a rabbit model of
atherosclerosis using MRI of the aortic atherosclerosis as the end-point.
6. 2. METHODS
6. 2. 1. Animal Model
Aortic atherosclerosis was established in male New Zealand white rabbits (Institute
of Medical and Veterinary Science, Gilles Plains, Australia) aged 12 weeks (n=12)
over 17 weeks by balloon denudation (from the renal arteries to the iliac bifurcation)
and cholesterol feeding with 0.2% cholesterol enriched chow (Glen-Forest Stock
Feed, Western Australia). Balloon denudation was performed 1 week after

120
commencing the cholesterol-enriched diet. All animals consumed the high
cholesterol diet for a further 16 weeks to establish extensive atheroma. The Institute
of Medical and Veterinary Science Animal Ethics Committee approved the study
protocol.
6. 2. 2. Isolation of HDL
HDL were isolated from pooled samples of rabbit plasma (Quality Farms of
Australia, Lara, VIC, Australia) and from samples of pooled human plasma (Gribbles
Pathology, Adelaide, SA, Australia) by sequential ultracentrifugation in the 1.06 to
1.21 g/ml density range as previously described (Nicholls et al. 2005). HDL was
dialyzed against endotoxin free phosphate buffered saline before use.
6. 2. 3. Establishment of Experimental Atherosclerosis
Atheroma was induced in 12 rabbits by a combination of a diet containing 0.2%
cholesterol-enriched chow and balloon denudation of the abdominal aorta. Balloon
denudation was performed 1 week after commencing the cholesterol-enriched diet.
All animals consumed the high-cholesterol diet for a further 16 weeks to establish
extensive atheroma.
6. 2. 4. Experimental Protocol
At the end of the 16 weeks of cholesterol feeding, the animals entered a 12-week
treatment (3 in each group) of:
1. No treatment;
2. Oral atorvastatin (Pfizer, Groton, Conn) 5 mg/kg/day mixed in the cholesterol
enriched chow with 3% peanut oil; or
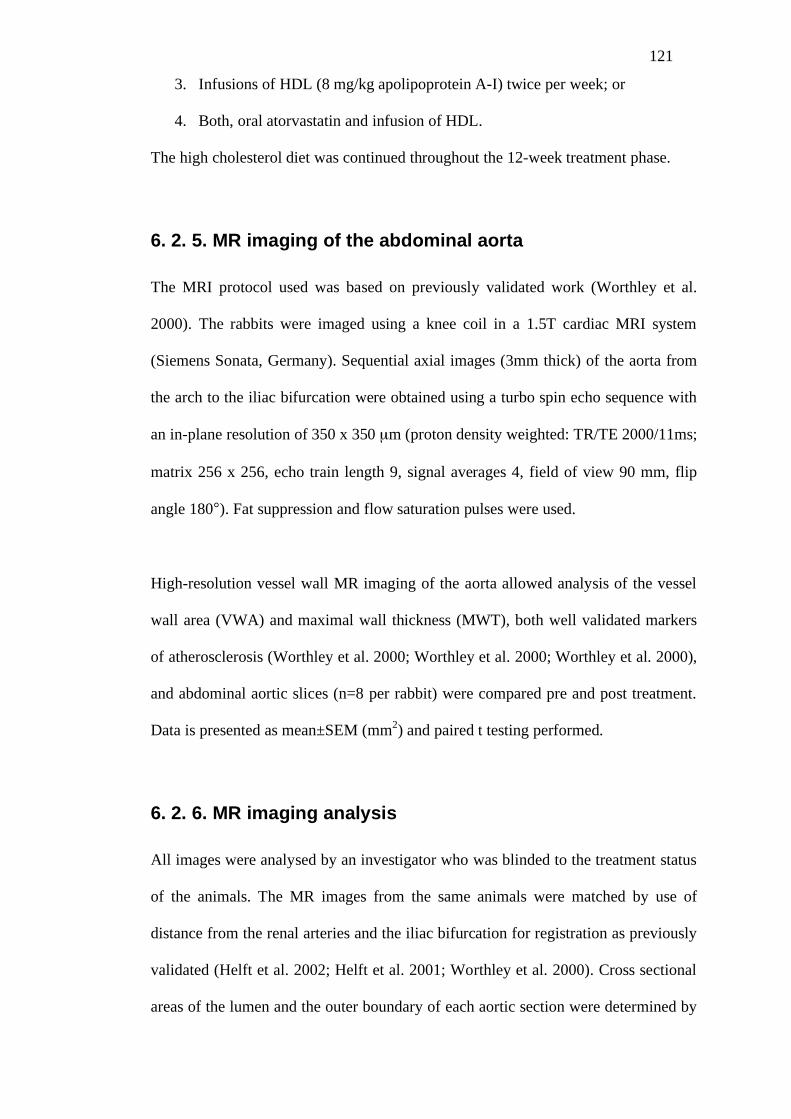
121
3. Infusions of HDL (8 mg/kg apolipoprotein A-I) twice per week; or
4. Both, oral atorvastatin and infusion of HDL.
The high cholesterol diet was continued throughout the 12-week treatment phase.
6. 2. 5. MR imaging of the abdominal aorta
The MRI protocol used was based on previously validated work (Worthley et al.
2000). The rabbits were imaged using a knee coil in a 1.5T cardiac MRI system
(Siemens Sonata, Germany). Sequential axial images (3mm thick) of the aorta from
the arch to the iliac bifurcation were obtained using a turbo spin echo sequence with
an in-plane resolution of 350 x 350 µm (proton density weighted: TR/TE 2000/11ms;
matrix 256 x 256, echo train length 9, signal averages 4, field of view 90 mm, flip
angle 180°). Fat suppression and flow saturation pulses were used.
High-resolution vessel wall MR imaging of the aorta allowed analysis of the vessel
wall area (VWA) and maximal wall thickness (MWT), both well validated markers
of atherosclerosis (Worthley et al. 2000; Worthley et al. 2000; Worthley et al. 2000),
and abdominal aortic slices (n=8 per rabbit) were compared pre and post treatment.
Data is presented as mean±SEM (mm2) and paired t testing performed.
6. 2. 6. MR imaging analysis
All images were analysed by an investigator who was blinded to the treatment status
of the animals. The MR images from the same animals were matched by use of
distance from the renal arteries and the iliac bifurcation for registration as previously
validated (Helft et al. 2002; Helft et al. 2001; Worthley et al. 2000). Cross sectional
areas of the lumen and the outer boundary of each aortic section were determined by

122
manual tracing with Image-Pro Plus (Media Cybernetics) by an observer who was
blinded to the treatment status of the animals. From these measurements, lumen area,
outer vessel area and vessel wall area (outer vessel area minus lumen area) were
calculated. The outer wall was defined as the vessel wall-epicardial fat interface. The
vessel wall areas of 8 contiguous abdominal aortic slices per animal were
consecutively averaged.
6. 2. 7. Statistical Analysis
Paired Student’s t tests were used to compare MR image-derived parameters from
the same sites in the abdominal aorta at the 2 time points. To account for multiple
samplings at different sites from the same rabbit, the svy;regress procedure was used
(STATA 9.1, College Station TX) for each of the 2 time-points modelling
atorvastatin and atorvastatin + HDL infusion. All probabilities are 2-sided and
statistical significance taken as a value of p<0.05. All values are assessed as mean ±
SEM (mm2).
6. 3. RESULTS
Matched MR images of the abdominal aorta (8 slices per rabbit) in the same rabbits
at the 2 time points were compared to assess changes in the lumen and outer vessel
wall areas over time (Figure 1). Thus atherosclerotic burden using VWA and MWT
were assessed.

123
Figure 1. MRI of atherosclerotic rabbit aortas pre- (panel A) and post-treatment
(panel B) with combination HDL infusion and oral atorvastatin (for 12 weeks). The
post-treatment aorta is less thickened than the pre-treatment aorta (arrowed in panels
B and A respectively).
6. 3. 1. Changes in vessel wall area (VWA)
There was a small, non-significant increase in VWA over the 12 weeks in the control
group (6.10 ± 0.16 vs. 6.36 ± 0.72, p=NS). There were non-significant decreases in
VWA in both the atorvastatin only (4.69 ± 0.14 vs. 4.45 ± 0.14, p=NS) and HDL
only (5.54 ± 0.19 vs. 5.22±0.28, p=NS) groups. However, there was a significant
decrease in VWA in the combination group (5.09±0.14 vs. 4.60 ± 0.15, p=0.03). See
Figure 2.

124
Figure 2. Graphical representation of changes in vessel wall area in the 3 treatment
groups (Group 2: Atorvastatin only, Group 3 HDL infusion alone and Group 4:
Combination HDL infusion plus atorvastatin). There is a non-significant decease in
VWA in the atorvastatin only and HDL only groups, but there was a significant
decrease in the combination group.

125
6. 3. 2. Changes in Maximal wall thickness
There was a significant increase in maximal wall thickness in the control group (0.86
mm ± 0.02 vs. 1.02 ± 0.04, p=0.01). There were no significant changes in maximal
wall thickness in the atorvastatin only and HDL only groups. There was a significant
decrease in maximal wall thickness in the groups treated with a combination of
atorvastatin and HDL (0.74 ± 0.02 vs. 0.67 ± 0.02, p=0.03).
6. 4. DISCUSSION
In this study, we have compared the effects of statin therapy alone, HDL infusion
alone and a combination of statin and HDL infusion on an experimental model of
atherosclerosis using MRI assessment of aortic atherosclerosis. We have shown that
the combination of HDL infusion and a statin (atorvastatin) is able to prevent
progression and induce regression of established atherosclerotic lesions as assessed
by serial MR imaging in this animal model. As expected, the control group showed a
significant progression of the atherosclerotic plaque in the 12-week period.
Atorvastatin or HDL infusion alone halted the progression of atherosclerosis, but did
not induce regression in this study. This is most likely related to the small number of
study animals and also relatively short duration of treatment. However in our study,
the combination of infusion of HDL in addition to atorvastatin resulted in significant
atherosclerotic plaque regression.
Lipid lowering therapy with statins has a significant beneficial effect on the
incidence of cardiovascular events (Downs et al. 1998; Group 1998; Group 1994;
Investigators 2002; Sacks et al. 1996; Shepherd et al. 1995) and reduces

126
cardiovascular mortality by 30 to 35% (Gotto 2001). Statin therapy not only results
in stabilization, but also regression of previously documented human atherosclerotic
lesions (Corti et al. 2001; Crisby et al. 2001; Zhao et al. 2001). There is
epidemiologic evidence of strong inverse relationship between HDL cholesterol
levels and cardiovascular risk (Gordon et al. 1989). The favourable effects of HDL
and apoA-I have been attributed to the promotion of reverse cholesterol transport in
which cholesterol from peripheral tissues including the arterial wall is transported
back into the liver for reuse or excretion (Hill and McQueen 1997). HDL has also
been suggested to have anti-inflammatory and anti-oxidant effects (Mackness et al.
1993). Strategies to increase HDL cholesterol have included fibric acid derivatives,
HDL infusion, CETP inhibition and statin therapy. Fibric acid derivatives such as
gemfibrozil and fenofibrate increase HDL cholesterol levels by 7 to 15 %. The
Helsinki Heart Study (Frick et al. 1987), and the VA-HIT study (Rubins et al. 1999),
demonstrated increases in HDL levels and significant reduction in cardiovascular
events with gemfibrozil therapy (34% in the Helsinki Heart Study and 22% in the
VA-HIT study). VA-HIT also showed a clinical benefit from raising HDL-C and
reducing triglycerides without reducing LDL-cholesterol. The FIELD study is a
multinational randomized controlled trial that evaluated the long-term effects of
fenofibrate in patients with type 2 diabetes mellitus (Keech et al. 2005). Fenofibrate
reduced total cardiovascular events from 13.9% to 12.5% or a 10% relative reduction
and included a 21% reduction in coronary revascularisation. However, fenofibrate
did not significantly reduce the risk of primary outcome of coronary events.
Infusion of reconstituted apoA-I Milano has been shown to promote regression of
coronary atherosclerosis in humans following an acute coronary syndrome (Nissen et
al. 2003). In a recent study of combined data from 4 prospective randomized

127
intravascular ultrasound trials of patients with coronary artery disease and on statin
therapy, regression of coronary atherosclerosis was found when LDL-C was
substantially reduced and HDL-C increased by greater than 7.5% suggesting that
statin benefits were derived from both reductions in atherogenic lipoprotein levels
and increases in HDL-C (Nicholls et al. 2007).
A previous study with a similar animal model and therapy with simvastatin and a
PPAR-gamma agonist alone and in combination, but for a longer period of 6 months
demonstrated that there was significant plaque regression in the group treated with
simvastatin and simvastatin plus PPAR-gamma agonist, while the PPAR-gamma
agonist alone resulted in a non-significant reduction in vessel wall area (Corti et al.
2004).
CETP inhibition may provide a powerful therapeutic approach to raising HDL levels,
lowering LDL levels and reducing the development of atherosclerosis. The CETP
inhibitor torcetrapib is effective at raising HDL cholesterol levels, however, there has
been concern about the benefits and risks of torcetrapib, with a dose-dependent
significant increase in blood pressure of about 3% seen in initial clinical trials
(McKenney et al. 2006). The Investigation of Lipid Level Management to
Understand Its Impact in Atherosclerotic Events (ILLUMINATE) study, a
randomised double-blind evaluation of the effect of torcetrapib/ atorvastatin vs.
atorvastatin alone on the occurrence of major cardiovascular events in subjects with
coronary heart disease or risk equivalents was prematurely terminated due to an
increase in observed adverse cardiovascular events (death, myocardial infarction,
angina and revascularisation procedures)(Barter et al. 2007). The results of an
independent parallel study, the Investigation of Lipid Level Management Using

128
Coronary Ultrasound to Assess Reduction of Atherosclerosis by CETP inhibition and
HDL Elevation (ILLUSTRATE) trial evaluated the effect of torcetrapib-atorvastatin
therapy versus atorvastatin alone on atherosclerotic burden in coronary arteries and
was recently reported (Nissen et al. 2007). There was a significant increase in HDL
cholesterol compared to atorvastatin monotherapy (60% relative increase) and
decrease in LDL-cholesterol (20% relative decrease) after 24 months of therapy.
However, there was an increase in systolic blood pressure of 4.6 mmHg and there
was no significant difference in the primary end point assessing the change in
percent atheroma volume in the two groups. The potential mechanisms suggested by
the authors for the lack of antiatherosclerotic efficacy include the counterbalancing
of beneficial effects from the increase in blood pressure, the HDL cholesterol
produced by torcetrapib may be dysfunctional and that the possibility remains that
CETP inhibition will not provide antiatherosclerotic benefits (Nissen et al. 2007).
6. 5. CONCLUSION
The infusion of small amounts of HDL provided incremental regression of
atherosclerosis to atorvastatin using MRI in this rabbit model. This confirms the
added benefits of HDL modification atop statin therapy in atherosclerotic disease.
This provides further support to the role of HDL modification in the setting of
current best management of patients with and at risk of coronary heart disease, and
further work is required to better understand the type of HDL modifications that
provide the best atheroprotection.

129
Chapter 7:
MULTI-DETECTOR CT IMAGING FAILS TO
ACCURATELY QUANTIFY VESSEL WALL
CALCIFICATION: ANALYSIS OF MULTIPLE
ALGORITHMS AND COMPARISON WITH MICRO-CT

130
TABLE OF CONTENTS
7. 1. INTRODUCTION ...................................................................................... 131
7. 2. METHODS ................................................................................................. 133
7. 2. 1. Subjects .................................................................................................................... 133
7. 2. 2. MDCT image acquisition ...................................................................................... 133
7. 2. 3. MDCT image analysis ........................................................................................... 134
7. 2. 3. 1. Traditional calcium scoring using coronary calcium software ................................... 134
7. 2. 3. 2. Hounsfield unit threshold-based editing software ....................................................... 134
7. 2. 3. 3. Manual tracing with Image Pro Plus. ........................................................................... 134
7. 2. 4. Micro-CT Image acquisition ................................................................................ 135
7. 2. 5. Micro-CT Image analysis...................................................................................... 135
7. 2. 6. Statistical analysis .................................................................................................. 136
7. 3. RESULTS.................................................................................................... 136
7. 3. 1. Subject Demographics ........................................................................................... 136
7. 3. 2. MDCT data ............................................................................................................. 137
7. 3. 3. Micro-CT data ........................................................................................................ 138
7. 3. 4. Comparison of MDCT versus Micro-CT data .................................................. 140
7. 4. DISCUSSION.............................................................................................. 142
7. 5. CONCLUSIONS......................................................................................... 146

131
7. 1. INTRODUCTION
Atherosclerotic diseases and its thrombotic cardiovascular complications continue to
be a leading cause of mortality (Worthley et al. 2000). The high-risk or vulnerable
coronary plaque that is prone to rupture has been described in several pathological
studies as having a large atheromatous lipid core that is rich in inflammatory cells
including macrophages with an overlying thin fibrous cap (Burke et al. 1997; Falk
1983; Virmani et al. 2006; Virmani et al. 2003).
Vascular calcification is a strong indicator of atherosclerosis, and its extent directly
relates to the overall burden of atherosclerotic disease (Rumberger et al. 1995), but
its effect on plaque instability is less evident (Virmani et al. 2006). It represents a
potential predictor of risk for acute coronary events in selected patient populations.
In addition, patients with more plaque calcification have been shown to be less likely
to undergo changes in the amount of atheroma in response to medical therapies
(Nicholls et al. 2007). However, not only is the extent of calcification a factor, but
also the location and morphologic appearance (Nicholls et al. 2007). Calcium has
been reported to be common in plaque rupture and less common in plaque erosion in
histopathological studies. Non-calcified atherosclerotic plaque, which may have
microcalcification below the threshold of detection with calcium scoring techniques
on Computed Tomography (CT), may be unstable and more prone to rupture.
Microcalcification deposits in the shoulder region of atheroma are associated with an
increased risk of fibrous cap rupture and subsequent ischaemic events (Ehara et al.
2004; Fujii et al. 2005; Nicholls et al. 2007). Ehara et al. in their study with
intravascular ultrasound, found that the average length of each calcium deposit in
patients with either acute myocardial infarction or unstable angina pectoris was
significantly smaller than in stable angina pectoris with a significant difference in the

132
pattern of coronary calcifications at the culprit lesion segment (Ehara et al. 2004).
One hypothesis for the rupture of thin fibrous cap atheroma is that microcalcification
(10 µm in diameter) in the cap, which has been undetected by in vivo imaging
techniques causes local stress-induced debonding (Vengrenyuk et al. 2006).
Multi-detector CT (MDCT) has been used to quantify coronary calcification, but is
limited by partial volume effects or blooming artifacts from excessive calcification
which limit the diagnostic accuracy of the technique for assessing stenotic severity.
The apparent volume of calcific areas is larger on CT and calcification has been
identified as the underlying reason for overestimation of coronary lumen obstruction
in false positive findings with 16-detector MDCT (Hoffmann et al. 2004). Even with
the newer 64-detector MDCT scanners, the ability to quantify the grade of luminal
obstruction is limited (Leber et al. 2005; Leschka et al. 2005). Despite several
algorithms and kernels (Busch et al. 2007; Seifarth et al. 2005), the blooming artifact
associated with calcification remains an issue.
In this study, we assessed the accuracy of quantification of atherosclerotic
calcification with MDCT in the carotid arteries of patients undergoing carotid
endarterectomy, and sought to identify algorithms or techniques that may improve
quantification of calcification. This would potentially lead to an improvement in the
ability of MDCT techniques to quantify stenotic severity in coronary arteries that
were calcified. To achieve this, we utilised MDCT in vivo and in comparison with
carotid endarterectomy specimen micro-CT. As the carotid arteries are larger and
subject to less motion than the coronary circulation, we sought to evaluate the burden
of calcification in carotid atherosclerotic lesions using in vivo carotid MDCT. In
addition, we compared the findings on MDCT with endarterectomy specimen micro-

133
CT to assess the frequency of microcalcification. We sought to identify algorithms or
techniques that may improve quantification of calcification. This would potentially
lead to an improvement in the ability of MDCT techniques to quantify stenotic
severity in coronary arteries that were calcified.
7. 2. METHODS
7. 2. 1. Subjects
Patients (n=24) scheduled for carotid endarterectomy underwent clinical carotid
MDCT (Siemens Sensation-16). The endarterectomy specimens were then imaged ex
vivo with micro-CT (Skyscan) with an in-plane resolution of 5 microns. MDCT
images were analysed for calcium volume with 3 different methods (1) coronary
calcium software (2) Hounsfield unit threshold-based editing software (Siemens) and
(3) manual tracing with Image Pro Plus. Micro-CT images were analysed with CT-
An (Skyscan). Data is presented as mean calcium volume (mm3±SD) and simple
linear regression and Bland-Altman analysis performed between the different
methods.
7. 2. 2. MDCT image acquisition
MDCT data were acquired with a 16-detector MDCT scanner (Sensation 16,
Siemens Medical Solutions, Germany). MDCT imaging parameters were tube
current 550 mA; tube voltage 120 kV; collimation 16 x 0.75mm, 130 effmAs and 0.5
second rotation time. A fixed kernel (B40f) and field of view of 130 mm was used.
A localising anterior/posterior tomogram was first acquired with bolus monitoring
over the aortic arch used to trigger the scan. Images were obtained from the aortic
arch to the circle of Willis. 100 mls of contrast agent (Isovue 370) was injected at 4

134
mls/second. The time to obtain each scan was 17 seconds and images were
reconstructed at 1mm slices at 1 mm increment.
7. 2. 3. MDCT image analysis
MDCT images were analysed for calcium volume with 3 different methods:
7. 2. 3. 1. Traditional calcium scoring using coronary calcium software
This was calculated according to the method described by Agatston (Agatston et al.
1990) where the score was derived by placing an area of interest over each calcified
carotid artery focus that had a minimal attenuation of 130 HU. The areas of
calcification and the maximal attenuation within each region of interest were then
measured using the coronary calcium software (Siemens Medical Solutions). A score
was then calculated by multiplying the measured area by an attenuation coefficient.
Images were initially analysed at a predefined window and level setting (window 700
HU and level 200 HU).
7. 2. 3. 2. Hounsfield unit threshold-based editing software
Images were loaded into 3D mulitplanar reconstruction using proprietary Hounsfield
unit threshold-based editing software (Siemens, Germany) and thresholds were
manually adjusted for each individual patient to obtain “seed” points for areas of
calcification. The lower Hounsfield unit thresholds thus were different for each
patient.
7. 2. 3. 3. Manual tracing with Image Pro Plus.
Axial CT images (reconstructed to 1mm contiguous slices) of the carotid arteries
were converted off-line from DICOM to TIFF format using software (OsiriX Dicom

135
viewer). These images were then transferred to Image Pro Plus (MediaCybernetics)
and calcified regions in both the internal carotid arteries were manually traced to
obtain calcium areas. Calcium volumes were then calculated from this. Calcified
areas were able to be distinguished from the contrast-filled carotid lumen due to
differences in “brightness”.
7. 2. 4. Micro-CT Image acquisition
A desktop micro-CT (Skyscan 1072; Aartselaar, Belgium) was used. Carotid
endarterectomy specimens, fixed in formalin were place in sealed polypropylene
tubes. The carotid specimens were held in place in the tubes with polystyrene, which
has X-ray absorption equivalent to air. Samples were then imaged using an unfiltered
tungsten x-ray source, which was run at 80kV and 120µA. Images were collected at
0.675-degree steps through a total angle of approximately 180 degrees. Total
imaging time per sample was 1 hour. Although the maximum resolution for the
Skyscan 1072 is approximately 4 µm, however due to the size of carotid
endarterectomy specimens, the resolution ranged from 10 to 18 µm.
7. 2. 5. Micro-CT Image analysis
Projection images were converted to tomogram using proprietary software (Skyscan
ConeRec). Three-dimensional rendering of the images and data analysis was
performed using CT-Analyser software (Skyscan). Non-calcified areas could not be
distinguished from surrounding tissues because of comparable X-ray absorption,
while calcified areas were able to be easily distinguished (figure 2).
Density histograms were generated which provided quantitative results. The lower
limit for threshold was selected to exclude non-calcified tissue, while the upper limit

136
corresponded to the densest calcified part. The 3-D models rendered from the
reconstructed cross-sections were analysed to determine calcium volume (figure 3).
7. 2. 6. Statistical analysis
All data was assessed for normality using the Kolmogorov-Smirnov statistic. Data is
presented as mean calcium volume (mm3±SD) and simple linear regression
performed for normally distributed data. Bland-Altman analyses were performed
between the different methods, as the most appropriate comparison of different
techniques assessing the same entity (i.e. amount of vascular calcification).
7. 3. RESULTS
7. 3. 1. Subject Demographics
All 24 patients (17 males, 7 females, mean age 69 ± 8 years) completed the MDCT
imaging protocol without complication. Subject demographics are shown in Table 1.
Table 1. Subject demographic information.
Age 69 ± 8 years
Gender 17 males, 7 females
Diabetes n = 2
Non-smoker n = 6
Smoker (current) n = 2
Smoker (past > 1 year) n = 16
Hypertension n = 13
Hypercholesterolaemia n = 18

137
7. 3. 2. MDCT data
Good quality carotid artery MDCT imaging was possible in all cases, and it was
possible to identify the atherosclerotic process in all patients (Figures 1 and 2).
Figure 1. MDCT axial images of a patient with severe internal carotid stenosis, with
calcification in the atherosclerotic lesion (arrowed). Panel A shows the calcification
in the left common carotid artery (CCA) and panel B the internal (ICA) and external
(ECA) carotid arteries.

138
Figure 2. MDCT axial image of a patient with severe ICA stenosis. Extensive
calcification (traced in red, ICA lumen traced in green) and associated “blooming”
artefact of the calcification resulted in a calcium volume that was much greater than
with micro-CT.
Due to inability to exclude lumen from the calcification, analysis with the coronary
calcium software failed in all cases. Varying the Hounsfield unit threshold with
proprietary software showed no significant relationship to calcium estimation by
manual tracing, although mean values of the data set were similar (106.3±117.4 vs
122.6±146.8).
7. 3. 3. Micro-CT data
The burden of calcification by micro-CT was much less (65.9±70.11). All patients
except one had significant micro-calcification by micro CT that was not discernible
with in vivo imaging (figures 3 and 4).

139
Figure 3. Example of an ex vivo raw axial micro-CT image of internal carotid plaque
with areas of calcification (arrowed).
Figure 4. Panel A shows a surface-rendered 3-D reconstruction from ex vivo Micro-
CT images of an atherosclerotic plaque with ICA (internal carotid artery), ECA
(external carotid artery) and CCA (common carotid artery) shown. Panel B shows

140
the same plaque with the soft tissue rendering removed to reveal the extensive
microcalcification.
7. 3. 4. Comparison of MDCT versus Micro-CT data
The sample data was normally distributed when assessed for normality with the
Kolmogorov-Smirnov statistic test for all methods of assessing vascular calcification.
Therefore, parametric testing with simple linear regression was assessed between the
different methods. There was a modest but significant relationship between the in
vivo techniques and micro-CT (Hounsfield unit threshold analysis vs. micro-CT R=
0.63, R2= 0.40, p= 0.007; manual calcium volumes vs. micro-CT R= 0.45, R
2= 0.20,
p= 0.046). However, when the more appropriate Bland Altman analyses were also
performed (figure 2), it is clear that at higher calcification volumes, there is a
tendency to overestimate the volume of calcification with the in vivo CT techniques.

141
Bland Altman Analysis
Mean threshold vs micro CT vols (mm3)
6005004003002001000-100
Diffe
rence t
hre
sho
ld v
s m
icro
CT
vols
(m
m3)
500
400
300
200
100
0
-100
-200
-300
-400
-500
Figure 2 A
Bland Altman Analysis
Mean manual vs micro CT vols (mm3)
8006004002000-200
Dif
fere
nce m
anual vs m
icro
CT v
ols
(m
m3)
600
500
400
300
200
100
0
-100
-200
-300
-400
-500
-600
Figure 2 B

142
Figure 2: Bland and Altman analyses of MDCT Hounsfield unit calcium threshold
(Figure 2A) and MDCT manual CT calcium volume vs micro-CT calcium volumes.
Solid line indicates the mean difference and dashed lines ± 2 standard deviations
(SD).
7. 4. DISCUSSION
We assessed the accuracy of quantification of atherosclerotic calcification with
MDCT in the carotid arteries of patients undergoing carotid endarterectomy. We
have shown that using micro-CT as a gold standard for the degree of vascular
calcification, that all image analysis techniques using in vivo MDCT data
overestimate the true amount of calcification, and that this over-estimation tends to
be more evident with greater levels of calcification.
Vascular calcification is an important manifestation of atherosclerosis and represents
a potential predictor of risk for acute coronary events in selected patient populations.
Its presence is a strong indicator of atherosclerosis, and its extent directly relates to
the overall burden of atherosclerotic disease (Rumberger et al. 1995). However, non-
calcified atherosclerotic plaque, which may have microcalcification below the
threshold of detection with calcium scoring techniques on CT, may be more unstable
and more prone to rupture Microcalcification deposits in the shoulder region of
atheroma are associated with an increased risk of fibrous cap rupture and subsequent
ischaemic events (Ehara et al. 2004; Nicholls et al. 2007). Ehara et al. in their study
with intravascular ultrasound, found that the average length of each calcium deposit
in patients with either acute myocardial infarction or unstable angina pectoris was
significantly smaller than in stable angina pectoris with a significant difference in the

143
pattern of coronary calcifications at the culprit lesion segment (Ehara et al. 2004).
Small calcium deposits were significantly more frequent in the culprit lesion
segments in acute coronary syndrome than in stable angina pectoris patients. Their
qualitative analysis of calcifications demonstrated that the culprit segments of AMI
patients were mostly characterised by small calcium deposits, associated with
fibrofatty plaques and positive remodelling.
We used 3 different methods to analyse calcium volumes from the MDCT images of
the carotid arteries. We found that due to inability to exclude lumen from the
calcification analysis, the coronary calcium software using Agatston score and a
threshold of 130 units HU for calcification, failed in all cases. With traditional
calcium scoring described by Agatston (Agatston et al. 1990), software multiplies the
area of a calcified plaque by an assigned coefficient selected on the basis of the
highest attenuation measured in the area. There is substantial measurement
variability (up to 30%) of the conventional Agatston score, which is a semi
quantitative measure, and of the volume score of coronary vascular calcium
(Agatston et al. 1990). There can be variation in score calculation caused by minimal
variations in estimated plaque attenuation or area on serial studies and volumetric
scoring has been shown to have better reproducibility (Callister et al. 1998). In
addition, in our study, quantification of calcium in the carotid arteries was performed
in contrast-enhanced images compared to traditional coronary artery calcium scoring
that is non-contrast. A previous study has shown that after the intravenous
administration of a contrast agent, noncalcified plaques can also be detected and that
CT attenuation correlates well with the plaque echogenicity of ultrasound (Schroeder
et al. 2001). Although there are limitations with this, combined imaging and
assessment of coronary artery calcium and coronary artery stenosis (using contrast-

144
enhanced scan) is an attractive diagnostic approach for the management of patients
with suspected coronary artery disease with reduction in radiation exposure.
The second method to quantify calcium in this study was to vary the Hounsfield unit
threshold for calcification using threshold-based editing software (Siemens). This
showed no significant relationship to the third method of calcium estimation by
manual tracing. However, mean values of both data sets were similar.
An important factor to consider is the selection of the threshold value for
calcification. A previous study by Hong et al. used a threshold of 130 HU for images
obtained without contrast and used a threshold of 350 HU for CT angiography to
ensure that the attenuation threshold used for calcium quantification was higher than
the attenuation levels in the enhanced coronary vessels. They also used a phantom
study and found that 350 HU was the lowest threshold at which actual calcium
hydroxyapatite masses greater than 10 mg could be reliably detected in the phantom
study (Hong et al. 2002). Nandalur et al. defined soft plaque with lipid-rich cores less
than or equal to 50 HU, intermediate plaques associated with large amounts of
fibrous tissue 51 to 130 HU and calcified plaques >130 HU (Nandalur et al. 2005).
Leber et al. defined coronary plaques as structures >1mm2 within the coronary artery
whose density differed from that of the contrast-enhanced vessel lumen. Plaques
were divided into calcified (>130 HU), non-calcified (<130 HU) and mixed lesions
(if plaque area consisted of >50% of non-calcified plaque tissue). The authors
rationale for choosing this definition of mixed plaques was that calcium causes
blooming artifacts due to the partial volume effects that may occur in the immediate
vicinity of calcium and may be confused with small areas of non-calcified tissue
(Leber et al. 2003).

145
As calcium is decalcified during histological processing, we used micro-CT
quantification of calcium as the gold standard for identifying calcium deposits within
the atherosclerotic plaque (Clarke et al. 2003; Langheinrich et al. 2004). We found
that the burden of calcification by micro-CT was much less compared to the calcium
volumes on the MDCT images with both the manual method and the threshold-based
method. However, there was no relationship between the in vivo techniques and
micro CT. All patients except one had significant micro-calcification by micro CT
that was not discernible with invivo imaging.
In a histopathological study of coronary arteries that were scanned with EBCT, the
sums of histopathological plaque areas versus the sums of calcium were highly
correlated for each heart and for each artery. However, coronary plaque area was five
times greater than calcium area. In addition, minimal diffuse segmental coronary
plaque could be present despite the absence of coronary calcium detectable by
EBCT. Thus, this study confirmed the relation between whole heart, coronary artery
and segmental coronary atherosclerotic plaque area and EBCT coronary calcium
area, but suggested that there is a threshold value for plaque area below which
calcium is either absent or not detectable by this method (Rumberger et al. 1995).
With a standard 512 x 512 matrix, pixel areas are approximately 0.34 mm2. Criterion
of 2 contiguous pixels with a CT density of >130 HU have been used in previous
clinical studies. This minimal calcium area may however be too small for a
consistently reproducible result in patients. Therefore, using a requirement of 3 or 4
contiguous pixels may be more reliable for clinical studies. Using these minimal
amounts of discrete calcification in patients is most consistently associated with
atherosclerotic plaques of >5mm2 or larger, but cannot reliably detect plaques of
smaller segmental areas.

146
The high-risk or vulnerable coronary plaque that is prone to rupture has been
described in several pathological studies as a having a large atheromatous core with
and an overlying thin fibrous cap infiltrated by macrophages (Burke et al. 1997; Falk
1983)
7. 5. CONCLUSIONS
In vivo MDCT imaging of carotid atherosclerotic calcification remains limited by
spatial resolution with resulting difficulties in accurate quantification of calcification,
particularly in the presence of contrast-enhanced images.

147
Chapter 8
DISCUSSION AND SUMMARY

148
In this thesis we have addressed numerous issues related to cardiac magnetic
resonance and its role in both congenital and atherosclerotic cardiovascular disease.
We began by defining normal ranges and reproducibility in chapter 3, and using
these techniques we were able to document the ability of CMR to accurately identify
cardiovascular anatomical abnormalities in atrial septal defects in Chapter 4. We
have shown that these same CMR techniques provide important insights into the
cardiovascular anatomical changes after percutaneous atrial septal defect closure in
Chapter 5, and extends previous data in this area that has shown a normalisation of
right ventricular dilatation after ASD closure, by describing the atrial remodelling
that occurs. Chapter 6 moves into the field of atherosclerosis imaging, where CMR
techniques have provided unique insights into the processes of atherosclerosis
progression and regression, and shows us the added utility of HDL modification over
statin therapy alone in regressing established atherosclerosis in a rabbit model.
Finally, in Chapter 7, we move further in the field of atherosclerosis imaging to
investigate an important limitation of atherosclerosis imaging with multi-detector CT
imaging, namely vascular calcification. Here we show that in vivo carotid
atherosclerosis imaging with MDCT is unable to accurately quantify the amount of
calcification, especially at high calcific burdens, and by comparing this to a very
high resolution CT technique (micro-CT) come to understand that this limitation is
essentially one of inadequate spatial resolution. I will go over each of these findings
in more detail below, and finish with the implications of the findings of this thesis,
and what this leads to in the future.

149
In Chapter 3, we validated the accuracy and reproducibility of CMR, the main
imaging modality we utilised. To achieve this, we assessed MR imaging of cardiac
volumes and function in a normal adult Australian population with a specific focus
on the reproducibility of the technique. In confirming that this technique in our hands
is both accurate and reproducible, we are able to confidently use this technique in our
future chapters. However, more than this, we established some normal ranges for left
and right atrial and ventricular parameters in our local population. This is crucial
background information for us in making comparisons with future studies in patients
with congenital heart disease.
In Chapters 4 and 5, we explored two specific issues in one area of congenital heart
disease, atrial septal defect. Atrial septal defect is the most common congenital heart
defect first diagnosed in adults. The traditional method of assessment of these
patients and for suitability for ASD closure involves semi-invasive investigation with
transoesophageal echocardiography (TOE) for measurement of the defect size and
atrial septal margins. In Chapter 4, MRI assessment of patients prior to percutaneous
device closure compared to TOE assessment confirms the utility of cardiac MRI as
an alternative to TOE for the work-up of these patients prior to ASD closure.
In Chapter 5, we utilised CMR to understand the effects of percutaneous ASD
closure on cardiac chamber volumes. We achieved this by assessing with cardiac
MRI pre-closure and post-closure atrial and ventricular cardiac volumes.
Longstanding right heart dilatation in the setting of an ASD may lead to
complications including right heart failure, pulmonary hypertension and arrhythmia.
Closure of the ASD leads to a reduction in right heart volumes by removing left-to-
right shunting and lead to normalisation of ventricular volumes. This also included

150
an increase in left ventricular volumes, a phenomenon related to ventricular inter-
dependence. The normalisation of right atrial volume changes with ASD closure may
be important in furthering our understanding in its contribution to arrhythmia, and
whether or not percutaneous closure leads to a reduction in future atrial arrhythmias.
Having assessed the ability of CMR to assess both the ASD dimensions, and
therefore suitability for percutaneous closure, as well as the effects of ASD closure
on cardiac chamber size, in the final two original research chapters 6 and 7, we
looked at another area of research development with these high-resolution imaging
technologies, atherosclerosis imaging. Two particular areas we focused on included
the potential of high-resolution MR imaging to monitor effects of HDL infusion on
atherosclerosis, and secondly to explore mechanisms behind limitations in MDCT
imaging of atherosclerosis, specifically calcification and blooming artefacts.
For assessing the effects of HDL infusion on atherosclerosis, we utilised a
cholesterol-fed rabbit model of atherosclerosis. The abdominal aorta of the rabbit is
comparable in size to the human coronary artery. Previous work with the rabbit
model of atherosclerosis and magnetic resonance imaging of the aortic wall has
shown that it can provide information about atherosclerotic composition as well as
provide serial data of the arterial wall. While high intensity lipid lowering with
statins remains the first line management of at risk individuals, modest manipulations
of serum HDL levels are associated with a significant impact on cardiovascular risk.
We showed that HDL infusion, in combination with atorvastatin, was superior to
either therapy alone in a rabbit model of using MRI of aortic atherosclerosis as the
end-point. This highlights the importance of modifying more than just the LDL-
cholesterol in patients with and at risk of cardiovascular events.

151
In our fifth and final original research chapter, we assessed the accuracy of
quantification of atherosclerotic calcification with MDCT in the carotid arteries of
patients undergoing carotid endarterectomy, and sought to identify algorithms or
techniques that may improve quantification of calcification. This would potentially
lead to an improvement in the ability of MDCT techniques to quantify stenotic
severity in coronary arteries that were calcified. To achieve these we utilised MDCT
in vivo and in comparison with carotid endarterectomy specimen micro-CT and of
course histopathology. Importantly, as part of this study, we undertook a thorough
assessment of reproducibility of these techniques. We however, confirmed the
inability of MDCT to accurately estimate the burden of calcification in the carotid
arteries of these patients, especially those with a higher calcific burden. Thus future
improvements in spatial resolution will be required in order to improve
atherosclerosis imaging with MDCT.
Thus, in summary, we have been able to confirm the accuracy and reproducibility of
CMR and MDCT in the areas of a specific congenital defect (ASD) and
atherosclerosis imaging, and utilised these techniques to advance our understanding
of these disease states. This thesis identifies strengths and weaknesses of these
techniques that will allow us to more appropriately use them for future purposes in
cardiovascular disease. Future work directly stemming from this thesis has already
begun, and now looks to address issues of whether CMR and MDCT may provide
complimentary information about atherosclerotic lesions that may benefit outcomes
in certain conditions. Specifically the work in this thesis has led to studies
commencing in carotid atherosclerosis and saphenous vein graft atherosclerosis and
using these imaging techniques to potentially predict adverse future outcomes.

152
REFERENCES
Agatston, A. S., Janowitz, W. R., Hildner, F. J., et al. Quantification of coronary
artery calcium using ultrafast computed tomography. J Am Coll Cardiol. 1990:
15(4): 827-32.
Alfakih, K., Plein, S., Thiele, H., et al. Normal human left and right ventricular
dimensions for MRI as assessed by turbo gradient echo and steady-state free
precession imaging sequences. J Magn Reson Imaging. 2003: 17(3): 323-9.
Anderson, K. M., Odell, P. M., Wilson, P. W., et al. Cardiovascular disease risk
profiles. Am Heart J. 1991: 121(1 Pt 2): 293-8.
Arad, Y., Spadaro, L. A., Goodman, K., et al. Prediction of coronary events with
electron beam computed tomography. J Am Coll Cardiol. 2000: 36(4): 1253-60.
Arad, Y., Spadaro, L. A., Roth, M., et al. Treatment of asymptomatic adults with
elevated coronary calcium scores with atorvastatin, vitamin C, and vitamin E: the St.
Francis Heart Study randomized clinical trial. J Am Coll Cardiol. 2005: 46(1): 166-
72.
Assmann, G., Cullen, P. and Schulte, H. Simple scoring scheme for calculating the
risk of acute coronary events based on the 10-year follow-up of the prospective
cardiovascular Munster (PROCAM) study. Circulation. 2002: 105(3): 310-5.

153
Australian Institute of Health and Welfare., National Heart Foundation of Australia.
and National Stroke Foundation (Australia) 2004. Heart, stroke and vascular
diseases: Australian facts 2004. Canberra, ACT, Australian Institute of Health and
Welfare National Heart Foundation of Australia National Stroke Foundation of
Australia.
Axel, L., Goncalves, R. C. and Bloomgarden, D. Regional heart wall motion: two-
dimensional analysis and functional imaging with MR imaging. Radiology. 1992:
183(3): 745-50.
Badimon, J. J., Badimon, L. and Fuster, V. Regression of atherosclerotic lesions by
high density lipoprotein plasma fraction in the cholesterol-fed rabbit. J Clin Invest.
1990: 85(4): 1234-41.
Bart, B. A., Shaw, L. K., McCants, C. B., Jr., et al. Clinical determinants of mortality
in patients with angiographically diagnosed ischemic or nonischemic
cardiomyopathy. J Am Coll Cardiol. 1997: 30(4): 1002-8.
Barter, P. J., Caulfield, M., Eriksson, M., et al. Effects of torcetrapib in patients at
high risk for coronary events. N Engl J Med. 2007: 357(21): 2109-22.
Baumgart, D., Schmermund, A., Goerge, G., et al. Comparison of electron beam
computed tomography with intracoronary ultrasound and coronary angiography for
detection of coronary atherosclerosis. J Am Coll Cardiol. 1997: 30(1): 57-64.

154
Beach, K. W., Hatsukami, T., Detmer, P. R., et al. Carotid artery intraplaque
hemorrhage and stenotic velocity. Stroke. 1993: 24(2): 314-9.
Becker, C. R., Kleffel, T., Crispin, A., et al. Coronary artery calcium measurement:
agreement of multirow detector and electron beam CT. AJR Am J Roentgenol. 2001:
176(5): 1295-8.
Becker, C. R., Knez, A., Ohnesorge, B., et al. Imaging of noncalcified coronary
plaques using helical CT with retrospective ECG gating. AJR Am J Roentgenol.
2000: 175(2): 423-4.
Becker, C. R., Nikolaou, K., Muders, M., et al. Ex vivo coronary atherosclerotic
plaque characterization with multi-detector-row CT. Eur Radiol. 2003: 13(9): 2094-
8.
Beckman, J. A., Ganz, J., Creager, M. A., et al. Relationship of clinical presentation
and calcification of culprit coronary artery stenoses. Arterioscler Thromb Vasc Biol.
2001: 21(10): 1618-22.
Bellenger, N. G., Burgess, M. I., Ray, S. G., et al. Comparison of left ventricular
ejection fraction and volumes in heart failure by echocardiography, radionuclide
ventriculography and cardiovascular magnetic resonance; are they interchangeable?
Eur Heart J. 2000: 21(16): 1387-96.

155
Bellenger, N. G., Davies, L. C., Francis, J. M., et al. Reduction in sample size for
studies of remodeling in heart failure by the use of cardiovascular magnetic
resonance. J Cardiovasc Magn Reson. 2000: 2(4): 271-8.
Berard, A. M., Foger, B., Remaley, A., et al. High plasma HDL concentrations
associated with enhanced atherosclerosis in transgenic mice overexpressing lecithin-
cholesteryl acyltransferase. Nat Med. 1997: 3(7): 744-9.
Berger, F., Vogel, M., Kramer, A., et al. Incidence of atrial flutter/fibrillation in
adults with atrial septal defect before and after surgery. Ann Thorac Surg. 1999:
68(1): 75-8.
Bland, J. M. and Altman, D. G. Statistical methods for assessing agreement between
two methods of clinical measurement. Lancet. 1986: 1(8476): 307-10.
Bonow, R. O. Identification of viable myocardium. Circulation. 1996: 94(11): 2674-
80.
Bostrom, K., Watson, K. E., Horn, S., et al. Bone morphogenetic protein expression
in human atherosclerotic lesions. J Clin Invest. 1993: 91(4): 1800-9.
Bots, M. L., Hoes, A. W., Koudstaal, P. J., et al. Common carotid intima-media
thickness and risk of stroke and myocardial infarction: the Rotterdam Study.
Circulation. 1997: 96(5): 1432-7.

156
Braunwald, E. and Rutherford, J. D. Reversible ischemic left ventricular dysfunction:
evidence for the "hibernating myocardium". J Am Coll Cardiol. 1986: 8(6): 1467-70.
Brenner, L. D., Caputo, G. R., Mostbeck, G., et al. Quantification of left to right
atrial shunts with velocity-encoded cine nuclear magnetic resonance imaging. J Am
Coll Cardiol. 1992: 20(5): 1246-50.
Brindle, P., Beswick, A., Fahey, T., et al. Accuracy and impact of risk assessment in
the primary prevention of cardiovascular disease: a systematic review. Heart. 2006:
92(12): 1752-9.
Brochu, M. C., Baril, J. F., Dore, A., et al. Improvement in exercise capacity in
asymptomatic and mildly symptomatic adults after atrial septal defect percutaneous
closure. Circulation. 2002: 106(14): 1821-6.
Brousseau, M. E., Schaefer, E. J., Wolfe, M. L., et al. Effects of an inhibitor of
cholesteryl ester transfer protein on HDL cholesterol. N Engl J Med. 2004: 350(15):
1505-15.
Budoff, M. J., Shaw, L. J., Liu, S. T., et al. Long-term prognosis associated with
coronary calcification: observations from a registry of 25,253 patients. J Am Coll
Cardiol. 2007: 49(18): 1860-70.
Burgstahler, C., Wohrle, J., Kochs, M., et al. Magnetic resonance imaging to assess
acute changes in atrial and ventricular parameters after transcatheter closure of atrial

157
septal defects. J Magn Reson Imaging. 2007: 25(6): 1136-40.
Burke, A. P., Farb, A., Malcom, G. T., et al. Coronary risk factors and plaque
morphology in men with coronary disease who died suddenly. N Engl J Med. 1997:
336(18): 1276-82.
Burke, A. P., Kolodgie, F. D., Farb, A., et al. Healed plaque ruptures and sudden
coronary death: evidence that subclinical rupture has a role in plaque progression.
Circulation. 2001: 103(7): 934-40.
Burke, A. P., Taylor, A., Farb, A., et al. Coronary calcification: insights from sudden
coronary death victims. Z Kardiol. 2000: 89 Suppl 2: 49-53.
Burke, A. P., Virmani, R., Galis, Z., et al. Task force #2--what is the pathologic basis
for new atherosclerosis imaging techniques? Journal of the American College of
Cardiology. 2003: 41(11): 1874-1886.
Burleigh, M. C., Briggs, A. D., Lendon, C. L., et al. Collagen types I and III,
collagen content, GAGs and mechanical strength of human atherosclerotic plaque
caps: span-wise variations. Atherosclerosis. 1992: 96(1): 71-81.
Busch, S., Johnson, T. R., Nikolaou, K., et al. Visual and automatic grading of
coronary artery stenoses with 64-slice CT angiography in reference to invasive
angiography. Eur Radiol. 2007: 17(6): 1445-51.

158
Cai, J., Hatsukami, T. S., Ferguson, M. S., et al. In vivo quantitative measurement of
intact fibrous cap and lipid-rich necrotic core size in atherosclerotic carotid plaque:
comparison of high-resolution, contrast-enhanced magnetic resonance imaging and
histology. Circulation. 2005: 112(22): 3437-44.
Cai, J.-M., Hatsukami, T. S., Ferguson, M. S., et al. Classification of Human Carotid
Atherosclerotic Lesions With In Vivo Multicontrast Magnetic Resonance Imaging.
Circulation. 2002: 106(11): 1368-1373.
Callister, T. Q., Cooil, B., Raya, S. P., et al. Coronary artery disease: improved
reproducibility of calcium scoring with an electron-beam CT volumetric method.
Radiology. 1998: 208(3): 807-14.
Callister, T. Q., Raggi, P., Cooil, B., et al. Effect of HMG-CoA reductase inhibitors
on coronary artery disease as assessed by electron-beam computed tomography. N
Engl J Med. 1998: 339(27): 1972-8.
Campbell, M. Natural history of atrial septal defect. Br Heart J. 1970: 32(6): 820-6.
Cao, Q., Radtke, W., Berger, F., et al. Transcatheter closure of multiple atrial septal
defects. Initial results and value of two- and three-dimensional transoesophageal
echocardiography. Eur Heart J. 2000: 21(11): 941-7.
Caussin, C., Ohanessian, A., Lancelin, B., et al. Coronary plaque burden detected by
multislice computed tomography after acute myocardial infarction with near-normal
coronary arteries by angiography. Am J Cardiol. 2003: 92(7): 849-52.

159
Celermajer, D. S. Noninvasive Detection of Atherosclerosis. N Engl J Med. 1998:
339(27): 2014-2015.
Chambless, L. E., Heiss, G., Folsom, A. R., et al. Association of coronary heart
disease incidence with carotid arterial wall thickness and major risk factors: the
Atherosclerosis Risk in Communities (ARIC) Study, 1987-1993. Am J Epidemiol.
1997: 146(6): 483-94.
Chan, K. C., Godman, M. J., Walsh, K., et al. Transcatheter closure of atrial septal
defect and interatrial communications with a new self expanding nitinol double disc
device (Amplatzer septal occluder): multicentre UK experience. Heart. 1999: 82(3):
300-6.
Cheng, G. C., Loree, H. M., Kamm, R. D., et al. Distribution of circumferential
stress in ruptured and stable atherosclerotic lesions. A structural analysis with
histopathological correlation. Circulation. 1993: 87(4): 1179-87.
Chu, B., Hatsukami, T. S., Polissar, N. L., et al. Determination of carotid artery
atherosclerotic lesion type and distribution in hypercholesterolemic patients with
moderate carotid stenosis using noninvasive magnetic resonance imaging. Stroke.
2004: 35(11): 2444-8.
Chu, B., Kampschulte, A., Ferguson, M. S., et al. Hemorrhage in the atherosclerotic
carotid plaque: a high-resolution MRI study. Stroke. 2004: 35(5): 1079-84.
160
Clarke, S. E., Hammond, R. R., Mitchell, J. R., et al. Quantitative assessment of
carotid plaque composition using multicontrast MRI and registered histology. Magn
Reson Med. 2003: 50(6): 1199-208.
Conroy, R. M., Pyorala, K., Fitzgerald, A. P., et al. Estimation of ten-year risk of
fatal cardiovascular disease in Europe: the SCORE project. Eur Heart J. 2003:
24(11): 987-1003.
Cooke, J. C., Gelman, J. S. and Harper, R. W. Echocardiologists' role in the
deployment of the Amplatzer atrial septal occluder device in adults. J Am Soc
Echocardiogr. 2001: 14(6): 588-94.
Coombs, B. D., Rapp, J. H., Ursell, P. C., et al. Structure of plaque at carotid
bifurcation: high-resolution MRI with histological correlation. Stroke. 2001: 32(11):
2516-21.
Corti, R., Fayad, Z. A., Fuster, V., et al. Effects of lipid-lowering by simvastatin on
human atherosclerotic lesions: a longitudinal study by high-resolution, noninvasive
magnetic resonance imaging. Circulation. 2001: 104(3): 249-52.
Corti, R., Fuster, V., Fayad, Z. A., et al. Lipid lowering by simvastatin induces
regression of human atherosclerotic lesions: two years' follow-up by high-resolution
noninvasive magnetic resonance imaging. Circulation. 2002: 106(23): 2884-7.

161
Corti, R., Osende, J. I., Fallon, J. T., et al. The selective peroxisomal proliferator-
activated receptor-gamma agonist has an additive effect on plaque regression in
combination with simvastatin in experimental atherosclerosis: in vivo study by high-
resolution magnetic resonance imaging. J Am Coll Cardiol. 2004: 43(3): 464-73.
Crisby, M., Nordin-Fredriksson, G., Shah, P. K., et al. Pravastatin treatment
increases collagen content and decreases lipid content, inflammation,
metalloproteinases, and cell death in human carotid plaques: implications for plaque
stabilization. Circulation. 2001: 103(7): 926-33.
Dangas, G., Badimon, J. J., Smith, D. A., et al. Pravastatin therapy in
hyperlipidemia: effects on thrombus formation and the systemic hemostatic profile. J
Am Coll Cardiol. 1999: 33(5): 1294-304.
Davies, H., Oliver, G. C., Rappoport, W. J., et al. Abnormal left heart function after
operation for atrial septal defect. Br Heart J. 1970: 32(6): 747-53.
Davies, M. J., Richardson, P. D., Woolf, N., et al. Risk of thrombosis in human
atherosclerotic plaques: role of extracellular lipid, macrophage, and smooth muscle
cell content. Br Heart J. 1993: 69(5): 377-81.
Davlouros, P. A., Niwa, K., Webb, G., et al. The right ventricle in congenital heart
disease. Heart. 2006: 92 Suppl 1: i27-38.
Dhillon, R., Josen, M., Henein, M., et al. Transcatheter closure of atrial septal defect

162
preserves right ventricular function. Heart. 2002: 87(5): 461-5.
Didier, D., Higgins, C. B., Fisher, M. R., et al. Congenital heart disease: gated MR
imaging in 72 patients. Radiology. 1986: 158(1): 227-35.
Didier, D., Ratib, O., Beghetti, M., et al. Morphologic and functional evaluation of
congenital heart disease by magnetic resonance imaging. J Magn Reson Imaging.
1999: 10(5): 639-55.
Doherty, N. E., 3rd, Seelos, K. C., Suzuki, J., et al. Application of cine nuclear
magnetic resonance imaging for sequential evaluation of response to angiotensin-
converting enzyme inhibitor therapy in dilated cardiomyopathy. J Am Coll Cardiol.
1992: 19(6): 1294-302.
Downs, J. R., Clearfield, M., Weis, S., et al. Primary prevention of acute coronary
events with lovastatin in men and women with average cholesterol levels: results of
AFCAPS/TexCAPS. Air Force/Texas Coronary Atherosclerosis Prevention Study.
JAMA. 1998: 279(20): 1615-22.
Du, Z. D., Cao, Q. L., Koenig, P., et al. Speed of normalization of right ventricular
volume overload after transcatheter closure of atrial septal defect in children and
adults. Am J Cardiol. 2001: 88(12): 1450-3, A9.
Du, Z. D., Hijazi, Z. M., Kleinman, C. S., et al. Comparison between transcatheter
and surgical closure of secundum atrial septal defect in children and adults: results of

163
a multicenter nonrandomized trial. J Am Coll Cardiol. 2002: 39(11): 1836-44.
Du, Z. D., Koenig, P., Cao, Q. L., et al. Comparison of transcatheter closure of
secundum atrial septal defect using the Amplatzer septal occluder associated with
deficient versus sufficient rims. Am J Cardiol. 2002: 90(8): 865-9.
Durongpisitkul, K., Tang, N. L., Soongswang, J., et al. Predictors of successful
transcatheter closure of atrial septal defect by cardiac magnetic resonance imaging.
Pediatr Cardiol. 2004: 25(2): 124-30.
Ehara, S., Kobayashi, Y., Yoshiyama, M., et al. Spotty calcification typifies the
culprit plaque in patients with acute myocardial infarction: an intravascular
ultrasound study. Circulation. 2004: 110(22): 3424-9.
Eidem, B. W., O'Leary, P. W., Tei, C., et al. Usefulness of the myocardial
performance index for assessing right ventricular function in congenital heart
disease. Am J Cardiol. 2000: 86(6): 654-8.
Eidem, B. W., Tei, C., O'Leary, P. W., et al. Nongeometric quantitative assessment
of right and left ventricular function: myocardial performance index in normal
children and patients with Ebstein anomaly. J Am Soc Echocardiogr. 1998: 11(9):
849-56.
Falk, E. Plaque rupture with severe pre-existing stenosis precipitating coronary
thrombosis. Characteristics of coronary atherosclerotic plaques underlying fatal

164
occlusive thrombi. Br Heart J. 1983: 50(2): 127-34.
Falk, E., Shah, P. K. and Fuster, V. Coronary Plaque Disruption. Circulation. 1995:
92(3): 657-671.
Fayad, Z. A., Fuster, V., Fallon, J. T., et al. Noninvasive in vivo human coronary
artery lumen and wall imaging using black-blood magnetic resonance imaging.
Circulation. 2000: 102(5): 506-10.
Fernandez-Ortiz, A., Badimon, J. J., Falk, E., et al. Characterization of the relative
thrombogenicity of atherosclerotic plaque components: implications for
consequences of plaque rupture. J Am Coll Cardiol. 1994: 23(7): 1562-9.
Ferrari, V. A., Scott, C. H., Holland, G. A., et al. Ultrafast three-dimensional
contrast-enhanced magnetic resonance angiography and imaging in the diagnosis of
partial anomalous pulmonary venous drainage. J Am Coll Cardiol. 2001: 37(4):
1120-8.
Fieno, D. S., Jaffe, W. C., Simonetti, O. P., et al. TrueFISP: assessment of accuracy
for measurement of left ventricular mass in an animal model. J Magn Reson
Imaging. 2002: 15(5): 526-31.
Fischer, G., Kramer, H. H., Stieh, J., et al. Transcatheter closure of secundum atrial
septal defects with the new self-centering Amplatzer Septal Occluder. Eur Heart J.
1999: 20(7): 541-9.

165
Fitzpatrick, L. A., Severson, A., Edwards, W. D., et al. Diffuse calcification in
human coronary arteries. Association of osteopontin with atherosclerosis. J Clin
Invest. 1994: 94(4): 1597-604.
Foger, B., Chase, M., Amar, M. J., et al. Cholesteryl ester transfer protein corrects
dysfunctional high density lipoproteins and reduces aortic atherosclerosis in lecithin
cholesterol acyltransferase transgenic mice. J Biol Chem. 1999: 274(52): 36912-20.
Frick, M. H., Elo, O., Haapa, K., et al. Helsinki Heart Study: primary-prevention trial
with gemfibrozil in middle-aged men with dyslipidemia. Safety of treatment,
changes in risk factors, and incidence of coronary heart disease. N Engl J Med. 1987:
317(20): 1237-45.
Fujii, K., Carlier, S. G., Mintz, G. S., et al. Intravascular ultrasound study of patterns
of calcium in ruptured coronary plaques. Am J Cardiol. 2005: 96(3): 352-7.
Funabashi, N., Kobayashi, Y., Perlroth, M., et al. Coronary artery: quantitative
evaluation of normal diameter determined with electron-beam CT compared with
cine coronary angiography initial experience. Radiology. 2003: 226(1): 263-71.
Fuster, V., Badimon, L., Badimon, J. J., et al. The pathogenesis of coronary artery
disease and the acute coronary syndromes (1). N Engl J Med. 1992: 326(4): 242-50.
Fuster, V., Badimon, L., Badimon, J. J., et al. The pathogenesis of coronary artery

166
disease and the acute coronary syndromes (2). N Engl J Med. 1992: 326(5): 310-8.
Fuster, V., Fayad, Z. A., Moreno, P. R., et al. Atherothrombosis and high-risk
plaque: Part II: approaches by noninvasive computed tomographic/magnetic
resonance imaging. J Am Coll Cardiol. 2005: 46(7): 1209-18.
Galal, M. O., Wobst, A., Halees, Z., et al. Peri-operative complications following
surgical closure of atrial septal defect type II in 232 patients--a baseline study. Eur
Heart J. 1994: 15(10): 1381-4.
Gatehouse, P. D. and Firmin, D. N. The cardiovascular magnetic resonance machine:
hardware and software requirements. Herz. 2000: 25(4): 317-30.
Gertz, S. D. and Roberts, W. C. Hemodynamic shear force in rupture of coronary
arterial atherosclerotic plaques. Am J Cardiol. 1990: 66(19): 1368-72.
Geva, T., Vick, G. W., 3rd, Wendt, R. E., et al. Role of spin echo and cine magnetic
resonance imaging in presurgical planning of heterotaxy syndrome. Comparison with
echocardiography and catheterization. Circulation. 1994: 90(1): 348-56.
Giardini, A., Donti, A., Specchia, S., et al. Long-term impact of transcatheter atrial
septal defect closure in adults on cardiac function and exercise capacity. Int J
Cardiol. 2007.
Giesler, T., Baum, U., Ropers, D., et al. Noninvasive visualization of coronary

167
arteries using contrast-enhanced multidetector CT: influence of heart rate on image
quality and stenosis detection. AJR Am J Roentgenol. 2002: 179(4): 911-6.
Gordon, D. J., Probstfield, J. L., Garrison, R. J., et al. High-density lipoprotein
cholesterol and cardiovascular disease. Four prospective American studies.
Circulation. 1989: 79(1): 8-15.
Gotte, M. J., Germans, T., Russel, I. K., et al. Myocardial strain and torsion
quantified by cardiovascular magnetic resonance tissue tagging: studies in normal
and impaired left ventricular function. J Am Coll Cardiol. 2006: 48(10): 2002-11.
Gotto, A. M., Jr. Statin therapy: where are we? Where do we go next? Am J Cardiol.
2001: 87(5A): 13B-18B.
Greenland, P., LaBree, L., Azen, S. P., et al. Coronary artery calcium score
combined with Framingham score for risk prediction in asymptomatic individuals.
Jama. 2004: 291(2): 210-5.
Grothues, F., Moon, J. C., Bellenger, N. G., et al. Interstudy reproducibility of right
ventricular volumes, function, and mass with cardiovascular magnetic resonance.
Am Heart J. 2004: 147(2): 218-23.
Grothues, F., Smith, G. C., Moon, J. C., et al. Comparison of interstudy
reproducibility of cardiovascular magnetic resonance with two-dimensional
echocardiography in normal subjects and in patients with heart failure or left

168
ventricular hypertrophy. Am J Cardiol. 2002: 90(1): 29-34.
Group, L.-T. I. w. P. i. I. D. L. S. Prevention of cardiovascular events and death with
pravastatin in patients with coronary heart disease and a broad range of initial
cholesterol levels. The Long-Term Intervention with Pravastatin in Ischaemic
Disease (LIPID) Study Group. N Engl J Med. 1998: 339(19): 1349-57.
Group, S. S. S. S. Randomised trial of cholesterol lowering in 4444 patients with
coronary heart disease: the Scandinavian Simvastatin Survival Study (4S). Lancet.
1994: 344(8934): 1383-9.
Haider, A. W., Larson, M. G., Benjamin, E. J., et al. Increased left ventricular mass
and hypertrophy are associated with increased risk for sudden death. J Am Coll
Cardiol. 1998: 32(5): 1454-9.
Harper, R. W., Mottram, P. M. and McGaw, D. J. Closure of secundum atrial septal
defects with the Amplatzer septal occluder device: techniques and problems.
Catheter Cardiovasc Interv. 2002: 57(4): 508-24.
Hatsukami, T. S., Ross, R., Polissar, N. L., et al. Visualization of Fibrous Cap
Thickness and Rupture in Human Atherosclerotic Carotid Plaque In Vivo With
High-Resolution Magnetic Resonance Imaging. Circulation. 2000: 102(9): 959-964.
Hauser, T. H., McClennen, S., Katsimaglis, G., et al. Assessment of left atrial
volume by contrast enhanced magnetic resonance angiography. J Cardiovasc Magn

169
Reson. 2004: 6(2): 491-7.
Helft, G., Worthley, S. G., Fuster, V., et al. Progression and Regression of
Atherosclerotic Lesions: Monitoring With Serial Noninvasive Magnetic Resonance
Imaging. Circulation. 2002: 105(8): 993-998.
Helft, G., Worthley, S. G., Fuster, V., et al. Atherosclerotic aortic component
quantification by noninvasive magnetic resonance imaging: an in vivo study in
rabbits. J Am Coll Cardiol. 2001: 37(4): 1149-54.
Herlong, J. R., Jaggers, J. J. and Ungerleider, R. M. Congenital Heart Surgery
Nomenclature and Database Project: pulmonary venous anomalies. Ann Thorac
Surg. 2000: 69(4 Suppl): S56-69.
Hernandez-Perera, O., Perez-Sala, D., Navarro-Antolin, J., et al. Effects of the 3-
hydroxy-3-methylglutaryl-CoA reductase inhibitors, atorvastatin and simvastatin, on
the expression of endothelin-1 and endothelial nitric oxide synthase in vascular
endothelial cells. J Clin Invest. 1998: 101(12): 2711-9.
Higgins, C. B., Byrd, B. F., 3rd, Farmer, D. W., et al. Magnetic resonance imaging in
patients with congenital heart disease. Circulation. 1984: 70(5): 851-60.
Hill, S. A. and McQueen, M. J. Reverse cholesterol transport--a review of the
process and its clinical implications. Clin Biochem. 1997: 30(7): 517-25.

170
Hirsch, R., Kilner, P. J., Connelly, M. S., et al. Diagnosis in adolescents and adults
with congenital heart disease. Prospective assessment of individual and combined
roles of magnetic resonance imaging and transesophageal echocardiography.
Circulation. 1994: 90(6): 2937-51.
Hoffman, J. I. and Kaplan, S. The incidence of congenital heart disease. J Am Coll
Cardiol. 2002: 39(12): 1890-900.
Hoffman, J. I., Kaplan, S. and Liberthson, R. R. Prevalence of congenital heart
disease. Am Heart J. 2004: 147(3): 425-39.
Hoffmann, M. H., Shi, H., Manzke, R., et al. Noninvasive coronary angiography
with 16-detector row CT: effect of heart rate. Radiology. 2005: 234(1): 86-97.
Hoffmann, U., Moselewski, F., Cury, R. C., et al. Predictive value of 16-slice
multidetector spiral computed tomography to detect significant obstructive coronary
artery disease in patients at high risk for coronary artery disease: patient-versus
segment-based analysis. Circulation. 2004: 110(17): 2638-43.
Holmvang, G., Palacios, I. F., Vlahakes, G. J., et al. Imaging and sizing of atrial
septal defects by magnetic resonance. Circulation. 1995: 92(12): 3473-80.
Hong, C., Becker, C. R., Schoepf, U. J., et al. Coronary artery calcium: absolute
quantification in nonenhanced and contrast-enhanced multi-detector row CT studies.
Radiology. 2002: 223(2): 474-80.

171
Hoppe, U. C., Dederichs, B., Deutsch, H. J., et al. Congenital heart disease in adults
and adolescents: comparative value of transthoracic and transesophageal
echocardiography and MR imaging. Radiology. 1996: 199(3): 669-77.
Huang, H., Virmani, R., Younis, H., et al. The impact of calcification on the
biomechanical stability of atherosclerotic plaques. Circulation. 2001: 103(8): 1051-6.
Hudsmith, L. E., Petersen, S. E., Francis, J. M., et al. Normal human left and right
ventricular and left atrial dimensions using steady state free precession magnetic
resonance imaging. J Cardiovasc Magn Reson. 2005: 7(5): 775-82.
Hundley, W. G., Li, H. F., Lange, R. A., et al. Assessment of left-to-right
intracardiac shunting by velocity-encoded, phase-difference magnetic resonance
imaging. A comparison with oximetric and indicator dilution techniques. Circulation.
1995: 91(12): 2955-60.
Investigators, M. B. H. P. S. MRC/BHF Heart Protection Study of cholesterol
lowering with simvastatin in 20,536 high-risk individuals: a randomised placebo-
controlled trial. Lancet. 2002: 360(9326): 7-22.
Janowitz, W. R., Agatston, A. S., Kaplan, G., et al. Differences in prevalence and
extent of coronary artery calcium detected by ultrafast computed tomography in
asymptomatic men and women. Am J Cardiol. 1993: 72(3): 247-54.

172
Jarvinen, V. M., Kupari, M. M., Hekali, P. E., et al. Right atrial MR imaging studies
of cadaveric atrial casts and comparison with right and left atrial volumes and
function in healthy subjects. Radiology. 1994: 191(1): 137-42.
Jarvinen, V. M., Kupari, M. M., Poutanen, V. P., et al. Right and left atrial phasic
volumetric function in mildly symptomatic dilated and hypertrophic
cardiomyopathy: cine MR imaging assessment. Radiology. 1996: 198(2): 487-95.
Jarvisalo, M. J., Toikka, J. O., Vasankari, T., et al. HMG CoA reductase inhibitors
are related to improved systemic endothelial function in coronary artery disease.
Atherosclerosis. 1999: 147(2): 237-42.
Jauhiainen, T., Jarvinen, V. M., Hekali, P. E., et al. MR gradient echo volumetric
analysis of human cardiac casts: focus on the right ventricle. J Comput Assist
Tomogr. 1998: 22(6): 899-903.
Jiamsripong, P., Honda, T., Reuss, C. S., et al. Three methods for evaluation of left
atrial volume. Eur J Echocardiogr. 2007.
Jones, H. R., Jr., Caplan, L. R., Come, P. C., et al. Cerebral emboli of paradoxical
origin. Ann Neurol. 1983: 13(3): 314-9.
Katz, J., Milliken, M. C., Stray-Gundersen, J., et al. Estimation of human myocardial
mass with MR imaging. Radiology. 1988: 169(2): 495-8.

173
Katz, J., Whang, J., Boxt, L. M., et al. Estimation of right ventricular mass in normal
subjects and in patients with primary pulmonary hypertension by nuclear magnetic
resonance imaging. J Am Coll Cardiol. 1993: 21(6): 1475-81.
Keech, A., Simes, R. J., Barter, P., et al. Effects of long-term fenofibrate therapy on
cardiovascular events in 9795 people with type 2 diabetes mellitus (the FIELD
study): randomised controlled trial. Lancet. 2005: 366(9500): 1849-61.
Kilner, P. J., Firmin, D. N., Rees, R. S., et al. Valve and great vessel stenosis:
assessment with MR jet velocity mapping. Radiology. 1991: 178(1): 229-35.
Kilner, P. J., Manzara, C. C., Mohiaddin, R. H., et al. Magnetic resonance jet
velocity mapping in mitral and aortic valve stenosis. Circulation. 1993: 87(4): 1239-
48.
Kim, R. J., Chen, E. L., Lima, J. A., et al. Myocardial Gd-DTPA kinetics determine
MRI contrast enhancement and reflect the extent and severity of myocardial injury
after acute reperfused infarction. Circulation. 1996: 94(12): 3318-26.
Kim, R. J., Fieno, D. S., Parrish, T. B., et al. Relationship of MRI Delayed Contrast
Enhancement to Irreversible Injury, Infarct Age, and Contractile Function.
Circulation. 1999: 100(19): 1992-2002.
Kim, R. J., Wu, E., Rafael, A., et al. The use of contrast-enhanced magnetic
resonance imaging to identify reversible myocardial dysfunction. N Engl J Med.

174
2000: 343(20): 1445-53.
Kircher, B., Abbott, J. A., Pau, S., et al. Left atrial volume determination by biplane
two-dimensional echocardiography: validation by cine computed tomography. Am
Heart J. 1991: 121(3 Pt 1): 864-71.
Knez, A., Becker, C., Becker, A., et al. Determination of coronary calcium with
multi-slice spiral computed tomography: a comparative study with electron-beam
CT. Int J Cardiovasc Imaging. 2002: 18(4): 295-303.
Kondo, C., Caputo, G. R., Semelka, R., et al. Right and left ventricular stroke
volume measurements with velocity-encoded cine MR imaging: in vitro and in vivo
validation. AJR Am J Roentgenol. 1991: 157(1): 9-16.
Kondos, G. T., Hoff, J. A., Sevrukov, A., et al. Electron-beam tomography coronary
artery calcium and cardiac events: a 37-month follow-up of 5635 initially
asymptomatic low- to intermediate-risk adults. Circulation. 2003: 107(20): 2571-6.
Konstantinides, S., Geibel, A., Olschewski, M., et al. A comparison of surgical and
medical therapy for atrial septal defect in adults. N Engl J Med. 1995: 333(8): 469-
73.
Kort, H. W., Balzer, D. T. and Johnson, M. C. Resolution of right heart enlargement
after closure of secundum atrial septal defect with transcatheter technique. J Am Coll
Cardiol. 2001: 38(5): 1528-32.

175
Kuettner, A., Trabold, T., Schroeder, S., et al. Noninvasive detection of coronary
lesions using 16-detector multislice spiral computed tomography technology: initial
clinical results. J Am Coll Cardiol. 2004: 44(6): 1230-7.
Kwong, R. Y., Chan, A. K., Brown, K. A., et al. Impact of unrecognized myocardial
scar detected by cardiac magnetic resonance imaging on event-free survival in
patients presenting with signs or symptoms of coronary artery disease. Circulation.
2006: 113(23): 2733-43.
Langheinrich, A. C., Bohle, R. M., Greschus, S., et al. Atherosclerotic lesions at
micro CT: feasibility for analysis of coronary artery wall in autopsy specimens.
Radiology. 2004: 231(3): 675-81.
Lardo, A. 2003. Cardiovascular magnetic resonance: established and emerging
applications. London; New York Independence, KY, Martin Dunitz; Distributed in
the USA by Fullfillment Center, Taylor & Francis.
LaRosa, J. C., Grundy, S. M., Waters, D. D., et al. Intensive lipid lowering with
atorvastatin in patients with stable coronary disease. N Engl J Med. 2005: 352(14):
1425-35.
Law, M. R., Wald, N. J. and Morris, J. K. The performance of blood pressure and
other cardiovascular risk factors as screening tests for ischaemic heart disease and
stroke. J Med Screen. 2004: 11(1): 3-7.

176
Leber, A. W., Knez, A., Becker, A., et al. Accuracy of multidetector spiral computed
tomography in identifying and differentiating the composition of coronary
atherosclerotic plaques: a comparative study with intracoronary ultrasound. J Am
Coll Cardiol. 2004: 43(7): 1241-7.
Leber, A. W., Knez, A., von Ziegler, F., et al. Quantification of obstructive and
nonobstructive coronary lesions by 64-slice computed tomography: a comparative
study with quantitative coronary angiography and intravascular ultrasound. J Am
Coll Cardiol. 2005: 46(1): 147-54.
Leber, A. W., Knez, A., White, C. W., et al. Composition of coronary atherosclerotic
plaques in patients with acute myocardial infarction and stable angina pectoris
determined by contrast-enhanced multislice computed tomography. Am J Cardiol.
2003: 91(6): 714-8.
Leschka, S., Alkadhi, H., Plass, A., et al. Accuracy of MSCT coronary angiography
with 64-slice technology: first experience. Eur Heart J. 2005: 26(15): 1482-7.
Libby, P. Current concepts of the pathogenesis of the acute coronary syndromes.
Circulation. 2001: 104(3): 365-72.
Longmore, D. B., Klipstein, R. H., Underwood, S. R., et al. Dimensional accuracy of
magnetic resonance in studies of the heart. Lancet. 1985: 1(8442): 1360-2.
Lopez, K., Dalvi, B. V., Balzer, D., et al. Transcatheter closure of large secundum

177
atrial septal defects using the 40 mm Amplatzer septal occluder: Results of an
international registry. Catheter Cardiovasc Interv. 2005.
Lorenz, C. H., Walker, E. S., Morgan, V. L., et al. Normal human right and left
ventricular mass, systolic function, and gender differences by cine magnetic
resonance imaging. J Cardiovasc Magn Reson. 1999: 1(1): 7-21.
Lorenz, M. W., Markus, H. S., Bots, M. L., et al. Prediction of clinical
cardiovascular events with carotid intima-media thickness: a systematic review and
meta-analysis. Circulation. 2007: 115(4): 459-67.
Luft, A. R., Skalej, M., Welte, D., et al. Reliability and exactness of MRI-based
volumetry: a phantom study. J Magn Reson Imaging. 1996: 6(4): 700-4.
Maceira, A. M., Joshi, J., Prasad, S. K., et al. Cardiovascular magnetic resonance in
cardiac amyloidosis. Circulation. 2005: 111(2): 186-93.
Mackness, M. I., Abbott, C., Arrol, S., et al. The role of high-density lipoprotein and
lipid-soluble antioxidant vitamins in inhibiting low-density lipoprotein oxidation.
Biochem J. 1993: 294 (Pt 3): 829-34.
Mahrholdt, H., Goedecke, C., Wagner, A., et al. Cardiovascular magnetic resonance
assessment of human myocarditis: a comparison to histology and molecular
pathology. Circulation. 2004: 109(10): 1250-8.
178
Mahrholdt, H., Wagner, A., Deluigi, C. C., et al. Presentation, patterns of myocardial
damage, and clinical course of viral myocarditis. Circulation. 2006: 114(15): 1581-
90.
Manninen, V., Elo, M. O., Frick, M. H., et al. Lipid alterations and decline in the
incidence of coronary heart disease in the Helsinki Heart Study. Jama. 1988: 260(5):
641-51.
Manning, W. J. and Pennell, D. J. 2002. Cardiovascular magnetic resonance. New
York, Churchill Livingstone.
Masani, N. D. Transoesophageal echocardiography in adult congenital heart disease.
Heart. 2001: 86 Suppl 2: II30-II40.
McCarthy, J. H. and Palmer, F. J. Incidence and significance of coronary artery
calcification. Br Heart J. 1974: 36(5): 499-506.
McCrohon, J. A., Moon, J. C. C., Prasad, S. K., et al. Differentiation of Heart Failure
Related to Dilated Cardiomyopathy and Coronary Artery Disease Using Gadolinium-
Enhanced Cardiovascular Magnetic Resonance. Circulation. 2003: 108(1): 54-59.
McKenney, J. M., Davidson, M. H., Shear, C. L., et al. Efficacy and safety of
torcetrapib, a novel cholesteryl ester transfer protein inhibitor, in individuals with
below-average high-density lipoprotein cholesterol levels on a background of
atorvastatin. J Am Coll Cardiol. 2006: 48(9): 1782-90.

179
Mehta, S. R., Eikelboom, J. W., Natarajan, M. K., et al. Impact of right ventricular
involvement on mortality and morbidity in patients with inferior myocardial
infarction. J Am Coll Cardiol. 2001: 37(1): 37-43.
Mintz, G. S., Pichard, A. D., Popma, J. J., et al. Determinants and correlates of target
lesion calcium in coronary artery disease: a clinical, angiographic and intravascular
ultrasound study. J Am Coll Cardiol. 1997: 29(2): 268-74.
Mintz, G. S., Popma, J. J., Pichard, A. D., et al. Patterns of calcification in coronary
artery disease. A statistical analysis of intravascular ultrasound and coronary
angiography in 1155 lesions. Circulation. 1995: 91(7): 1959-65.
Mohiaddin, R. H. 2002. Introduction to cardiovascular magnetic resonance. London,
Current Medical Literature.
Mollet, N. R., Cademartiri, F. and de Feyter, P. J. Non-invasive multislice CT
coronary imaging. Heart. 2005: 91(3): 401-7.
Moon, J. C., Reed, E., Sheppard, M. N., et al. The histologic basis of late gadolinium
enhancement cardiovascular magnetic resonance in hypertrophic cardiomyopathy. J
Am Coll Cardiol. 2004: 43(12): 2260-4.
Moon, J. C. C., Lorenz, C. H., Francis, J. M., et al. Breath-hold FLASH and FISP
Cardiovascular MR Imaging: Left Ventricular Volume Differences and

180
Reproducibility. Radiology. 2002: 223(3): 789-797.
Morgan-Hughes, G. J., Roobottom, C. A., Owens, P. E., et al. Highly accurate
coronary angiography with submillimetre, 16 slice computed tomography. Heart.
2005: 91(3): 308-13.
Morin, R. L., Gerber, T. C. and McCollough, C. H. Radiation dose in computed
tomography of the heart. Circulation. 2003: 107(6): 917-22.
Morton, J. B., Sanders, P., Vohra, J. K., et al. Effect of chronic right atrial stretch on
atrial electrical remodeling in patients with an atrial septal defect. Circulation. 2003:
107(13): 1775-82.
Murphy, J. G., Gersh, B. J., McGoon, M. D., et al. Long-term outcome after surgical
repair of isolated atrial septal defect. Follow-up at 27 to 32 years. N Engl J Med.
1990: 323(24): 1645-50.
Nagel, E., Lehmkuhl, H. B., Bocksch, W., et al. Noninvasive diagnosis of ischemia-
induced wall motion abnormalities with the use of high-dose dobutamine stress MRI:
comparison with dobutamine stress echocardiography. Circulation. 1999: 99(6): 763-
70.
Nandalur, K. R., Baskurt, E., Hagspiel, K. D., et al. Calcified carotid atherosclerotic
plaque is associated less with ischemic symptoms than is noncalcified plaque on
MDCT. AJR Am J Roentgenol. 2005: 184(1): 295-8.

181
Nicholls, S. J., Cutri, B., Worthley, S. G., et al. Impact of short-term administration
of high-density lipoproteins and atorvastatin on atherosclerosis in rabbits.
Arterioscler Thromb Vasc Biol. 2005: 25(11): 2416-21.
Nicholls, S. J., Tuzcu, E. M., Sipahi, I., et al. Statins, high-density lipoprotein
cholesterol, and regression of coronary atherosclerosis. Jama. 2007: 297(5): 499-508.
Nicholls, S. J., Tuzcu, E. M., Wolski, K., et al. Coronary artery calcification and
changes in atheroma burden in response to established medical therapies. J Am Coll
Cardiol. 2007: 49(2): 263-70.
Nieman, K., Cademartiri, F., Lemos, P. A., et al. Reliable noninvasive coronary
angiography with fast submillimeter multislice spiral computed tomography.
Circulation. 2002: 106(16): 2051-4.
Nieman, K., Oudkerk, M., Rensing, B. J., et al. Coronary angiography with multi-
slice computed tomography. Lancet. 2001: 357(9256): 599-603.
Nieman, K., Pattynama, P. M., Rensing, B. J., et al. Evaluation of patients after
coronary artery bypass surgery: CT angiographic assessment of grafts and coronary
arteries. Radiology. 2003: 229(3): 749-56.
Niendorf, T. and Sodickson, D. K. Parallel imaging in cardiovascular MRI: methods
and applications. NMR Biomed. 2006: 19(3): 325-41.

182
Nikolaou, K., Becker, C. R., Muders, M., et al. Multidetector-row computed
tomography and magnetic resonance imaging of atherosclerotic lesions in human ex
vivo coronary arteries. Atherosclerosis. 2004: 174(2): 243-52.
Nissen, S. E., Nicholls, S. J., Sipahi, I., et al. Effect of very high-intensity statin
therapy on regression of coronary atherosclerosis: the ASTEROID trial. Jama. 2006:
295(13): 1556-65.
Nissen, S. E., Tardif, J. C., Nicholls, S. J., et al. Effect of torcetrapib on the
progression of coronary atherosclerosis. N Engl J Med. 2007: 356(13): 1304-16.
Nissen, S. E., Tsunoda, T., Tuzcu, E. M., et al. Effect of recombinant ApoA-I Milano
on coronary atherosclerosis in patients with acute coronary syndromes: a randomized
controlled trial. Jama. 2003: 290(17): 2292-300.
Nissen, S. E., Tuzcu, E. M., Schoenhagen, P., et al. Effect of intensive compared
with moderate lipid-lowering therapy on progression of coronary atherosclerosis: a
randomized controlled trial. Jama. 2004: 291(9): 1071-80.
Nissen, S. E., Tuzcu, E. M., Schoenhagen, P., et al. Statin therapy, LDL cholesterol,
C-reactive protein, and coronary artery disease. N Engl J Med. 2005: 352(1): 29-38.
Noto, T. J., Jr., Johnson, L. W., Krone, R., et al. Cardiac catheterization 1990: a
report of the Registry of the Society for Cardiac Angiography and Interventions
(SCA&I). Cathet Cardiovasc Diagn. 1991: 24(2): 75-83.

183
O'Rourke, R. A., Brundage, B. H., Froelicher, V. F., et al. American College of
Cardiology/American Heart Association Expert Consensus document on electron-
beam computed tomography for the diagnosis and prognosis of coronary artery
disease. Circulation. 2000: 102(1): 126-40.
Oakley, C. Importance of right ventricular function in congestive heart failure. Am J
Cardiol. 1988: 62(2): 14A-19A.
Osman, N. F., Kerwin, W. S., McVeigh, E. R., et al. Cardiac motion tracking using
CINE harmonic phase (HARP) magnetic resonance imaging. Magn Reson Med.
1999: 42(6): 1048-60.
Pache, G., Saueressig, U., Frydrychowicz, A., et al. Initial experience with 64-slice
cardiac CT: non-invasive visualization of coronary artery bypass grafts. Eur Heart J.
2006: 27(8): 976-80.
Pagley, P. R., Beller, G. A., Watson, D. D., et al. Improved outcome after coronary
bypass surgery in patients with ischemic cardiomyopathy and residual myocardial
viability. Circulation. 1997: 96(3): 793-800.
Pattynama, P. M., Lamb, H. J., van der Velde, E. A., et al. Left ventricular
measurements with cine and spin-echo MR imaging: a study of reproducibility with
variance component analysis. Radiology. 1993: 187(1): 261-8.

184
Persy, V., Postnov, A., Neven, E., et al. High-resolution X-ray microtomography is a
sensitive method to detect vascular calcification in living rats with chronic renal
failure. Arterioscler Thromb Vasc Biol. 2006: 26(9): 2110-6.
Piaw, C. S., Kiam, O. T., Rapaee, A., et al. Use of non-invasive phase contrast
magnetic resonance imaging for estimation of atrial septal defect size and
morphology: a comparison with transesophageal echo. Cardiovasc Intervent Radiol.
2006: 29(2): 230-4.
Popio, K. A., Gorlin, R., Teichholz, L. E., et al. Abnormalities of left ventricular
function and geometry in adults with an atrial septal defect. Ventriculographic,
hemodynamic and echocardiographic studies. Am J Cardiol. 1975: 36(3): 302-8.
Prasad, S. K. and Pennell, D. J. Safety of cardiovascular magnetic resonance in
patients with cardiovascular implants and devices. Heart. 2004: 90(11): 1241-4.
Prasad, S. K., Soukias, N., Hornung, T., et al. Role of magnetic resonance
angiography in the diagnosis of major aortopulmonary collateral arteries and partial
anomalous pulmonary venous drainage. Circulation. 2004: 109(2): 207-14.
Raggi, P., Davidson, M., Callister, T. Q., et al. Aggressive versus moderate lipid-
lowering therapy in hypercholesterolemic postmenopausal women: Beyond
Endorsed Lipid Lowering with EBT Scanning (BELLES). Circulation. 2005: 112(4):
563-71.

185
Rauch, U., Osende, J. I., Chesebro, J. H., et al. Statins and cardiovascular diseases:
the multiple effects of lipid-lowering therapy by statins. Atherosclerosis. 2000:
153(1): 181-9.
Rehr, R. B., Malloy, C. R., Filipchuk, N. G., et al. Left ventricular volumes measured
by MR imaging. Radiology. 1985: 156(3): 717-9.
Ritman, E. L. Micro-computed tomography-current status and developments. Annu
Rev Biomed Eng. 2004: 6: 185-208.
Roos-Hesselink, J. W., Meijboom, F. J., Spitaels, S. E., et al. Excellent survival and
low incidence of arrhythmias, stroke and heart failure long-term after surgical ASD
closure at young age. A prospective follow-up study of 21-33 years. Eur Heart J.
2003: 24(2): 190-7.
Ropers, D., Baum, U., Pohle, K., et al. Detection of Coronary Artery Stenoses With
Thin-Slice Multi-Detector Row Spiral Computed Tomography and Multiplanar
Reconstruction. Circulation. 2003: 107(5): 664-666.
Ross, R. Atherosclerosis -- An Inflammatory Disease. N Engl J Med. 1999: 340(2):
115-126.
Rubins, H. B., Robins, S. J., Collins, D., et al. Gemfibrozil for the secondary
prevention of coronary heart disease in men with low levels of high-density
lipoprotein cholesterol. Veterans Affairs High-Density Lipoprotein Cholesterol

186
Intervention Trial Study Group. N Engl J Med. 1999: 341(6): 410-8.
Rumberger, J. A., Sheedy, P. F., Breen, J. F., et al. Coronary calcium, as determined
by electron beam computed tomography, and coronary disease on arteriogram. Effect
of patient's sex on diagnosis. Circulation. 1995: 91(5): 1363-7.
Rumberger, J. A., Simons, D. B., Fitzpatrick, L. A., et al. Coronary artery calcium
area by electron-beam computed tomography and coronary atherosclerotic plaque
area. A histopathologic correlative study. Circulation. 1995: 92(8): 2157-62.
Saam, T., Cai, J., Ma, L., et al. Comparison of symptomatic and asymptomatic
atherosclerotic carotid plaque features with in vivo MR imaging. Radiology. 2006:
240(2): 464-72.
Saba, L., Sanfilippo, R., Pirisi, R., et al. Multidetector-row CT angiography in the
study of atherosclerotic carotid arteries. Neuroradiology. 2007: 49(8): 623-37.
Sacks, F. M., Pfeffer, M. A., Moye, L. A., et al. The effect of pravastatin on coronary
events after myocardial infarction in patients with average cholesterol levels.
Cholesterol and Recurrent Events Trial investigators. N Engl J Med. 1996: 335(14):
1001-9.
Salehian, O., Horlick, E., Schwerzmann, M., et al. Improvements in cardiac form and
function after transcatheter closure of secundum atrial septal defects. J Am Coll
Cardiol. 2005: 45(4): 499-504.

187
Salonen, J. T. and Salonen, R. Ultrasound B-mode imaging in observational studies
of atherosclerotic progression. Circulation. 1993: 87(3 Suppl): II56-65.
Schlosser, T., Konorza, T., Hunold, P., et al. Noninvasive visualization of coronary
artery bypass grafts using 16-detector row computed tomography. J Am Coll
Cardiol. 2004: 44(6): 1224-9.
Schmermund, A., Baumgart, D., Gorge, G., et al. Coronary artery calcium in acute
coronary syndromes: a comparative study of electron-beam computed tomography,
coronary angiography, and intracoronary ultrasound in survivors of acute myocardial
infarction and unstable angina. Circulation. 1997: 96(5): 1461-9.
Schoen, S. P., Kittner, T., Bohl, S., et al. Transcatheter closure of atrial septal defects
improves right ventricular volume, mass, function, pulmonary pressure, and
functional class: a magnetic resonance imaging study. Heart. 2006: 92(6): 821-6.
Schoenhagen, P., Halliburton, S. S., Stillman, A. E., et al. Noninvasive imaging of
coronary arteries: current and future role of multi-detector row CT. Radiology. 2004:
232(1): 7-17.
Schoepf, U. J., Becker, C. R., Ohnesorge, B. M., et al. CT of coronary artery disease.
Radiology. 2004: 232(1): 18-37.
Schroeder, S., Kopp, A. F., Baumbach, A., et al. Noninvasive detection and

188
evaluation of atherosclerotic coronary plaques with multislice computed
tomography. J Am Coll Cardiol. 2001: 37(5): 1430-5.
Schroeder, S., Kopp, A. F., Kuettner, A., et al. Influence of heart rate on vessel
visibility in noninvasive coronary angiography using new multislice computed
tomography: Experience in 94 patients. Clinical Imaging. 2002: 26(2): 106-111.
Schussler, J. M., Anwar, A., Phillips, S. D., et al. Effect on right ventricular volume
of percutaneous Amplatzer closure of atrial septal defect in adults. Am J Cardiol.
2005: 95(8): 993-5.
Seifarth, H., Raupach, R., Schaller, S., et al. Assessment of coronary artery stents
using 16-slice MDCT angiography: evaluation of a dedicated reconstruction kernel
and a noise reduction filter. Eur Radiol. 2005: 15(4): 721-6.
Semelka, R., Tomei, E., Wagner, S., et al. Normal left ventricular dimensions and
function: interstudy reproducibility of measurements with cine MR imaging.
Radiology. 1990: 174(3): 763-768.
Semelka, R. C., Tomei, E., Wagner, S., et al. Interstudy reproducibility of
dimensional and functional measurements between cine magnetic resonance studies
in the morphologically abnormal left ventricle. Am Heart J. 1990: 119(6): 1367-73.
Serfaty, J. M., Chaabane, L., Tabib, A., et al. Atherosclerotic plaques: classification
and characterization with T2-weighted high-spatial-resolution MR imaging-- an in

189
vitro study. Radiology. 2001: 219(2): 403-10.
Shah, P. K., Yano, J., Reyes, O., et al. High-dose recombinant apolipoprotein A-
I(milano) mobilizes tissue cholesterol and rapidly reduces plaque lipid and
macrophage content in apolipoprotein e-deficient mice. Potential implications for
acute plaque stabilization. Circulation. 2001: 103(25): 3047-50.
Shaheen, J., Alper, L., Rosenmann, D., et al. Effect of surgical repair of secundum-
type atrial septal defect on right atrial, right ventricular, and left ventricular volumes
in adults. Am J Cardiol. 2000: 86(12): 1395-7, A6.
Shapiro, E. P., Rogers, W. J., Beyar, R., et al. Determination of left ventricular mass
by magnetic resonance imaging in hearts deformed by acute infarction. Circulation.
1989: 79(3): 706-11.
Shaw, L. J., Raggi, P., Schisterman, E., et al. Prognostic value of cardiac risk factors
and coronary artery calcium screening for all-cause mortality. Radiology. 2003:
228(3): 826-33.
Shepherd, J., Cobbe, S. M., Ford, I., et al. Prevention of coronary heart disease with
pravastatin in men with hypercholesterolemia. West of Scotland Coronary
Prevention Study Group. N Engl J Med. 1995: 333(20): 1301-7.
Shinnar, M., Fallon, J. T., Wehrli, S., et al. The diagnostic accuracy of ex vivo MRI
for human atherosclerotic plaque characterization. Arterioscler Thromb Vasc Biol.

190
1999: 19(11): 2756-61.
Sievers, B., Kirchberg, S., Addo, M., et al. Assessment of left atrial volumes in sinus
rhythm and atrial fibrillation using the biplane area-length method and
cardiovascular magnetic resonance imaging with TrueFISP. J Cardiovasc Magn
Reson. 2004: 6(4): 855-63.
Simonetti, O. P., Finn, J. P., White, R. D., et al. "Black blood" T2-weighted
inversion-recovery MR imaging of the heart. Radiology. 1996: 199(1): 49-57.
Smedema, J. P., Snoep, G., van Kroonenburgh, M. P., et al. Evaluation of the
accuracy of gadolinium-enhanced cardiovascular magnetic resonance in the
diagnosis of cardiac sarcoidosis. J Am Coll Cardiol. 2005: 45(10): 1683-90.
Soma, M. R., Donetti, E., Parolini, C., et al. Recombinant apolipoprotein A-IMilano
dimer inhibits carotid intimal thickening induced by perivascular manipulation in
rabbits. Circ Res. 1995: 76(3): 405-11.
Stary, H. C. The development of calcium deposits in atherosclerotic lesions and their
persistence after lipid regression. Am J Cardiol. 2001: 88(2A): 16E-19E.
Stary, H. C., Chandler, A. B., Dinsmore, R. E., et al. A definition of advanced types
of atherosclerotic lesions and a histological classification of atherosclerosis. A report
from the Committee on Vascular Lesions of the Council on Arteriosclerosis,
American Heart Association. Circulation. 1995: 92(5): 1355-74.

191
Steele, P. M., Fuster, V., Cohen, M., et al. Isolated atrial septal defect with
pulmonary vascular obstructive disease--long-term follow-up and prediction of
outcome after surgical correction. Circulation. 1987: 76(5): 1037-42.
Sugano, M., Makino, N., Sawada, S., et al. Effect of antisense oligonucleotides
against cholesteryl ester transfer protein on the development of atherosclerosis in
cholesterol-fed rabbits. J Biol Chem. 1998: 273(9): 5033-6.
Sukhova, G. K., Williams, J. K. and Libby, P. Statins reduce inflammation in
atheroma of nonhuman primates independent of effects on serum cholesterol.
Arterioscler Thromb Vasc Biol. 2002: 22(9): 1452-8.
Takaya, N., Yuan, C., Chu, B., et al. Presence of intraplaque hemorrhage stimulates
progression of carotid atherosclerotic plaques: a high-resolution magnetic resonance
imaging study. Circulation. 2005: 111(21): 2768-75.
Takaya, N., Yuan, C., Chu, B., et al. Association between carotid plaque
characteristics and subsequent ischemic cerebrovascular events: a prospective
assessment with MRI--initial results. Stroke. 2006: 37(3): 818-23.
Teichholz, L. E., Kreulen, T., Herman, M. V., et al. Problems in echocardiographic
volume determinations: echocardiographic-angiographic correlations in the presence
of absence of asynergy. Am J Cardiol. 1976: 37(1): 7-11.

192
Thilen, U., Berlind, S. and Varnauskas, E. Atrial septal defect in adults. Thirty-eight-
year follow-up of a surgically and a conservatively managed group. Scand
Cardiovasc J. 2000: 34(1): 79-83.
Thilen, U. and Persson, S. Closure of atrial septal defect in the adult. Cardiac
remodeling is an early event. Int J Cardiol. 2006: 108(3): 370-5.
Toussaint, J. F., LaMuraglia, G. M., Southern, J. F., et al. Magnetic resonance
images lipid, fibrous, calcified, hemorrhagic, and thrombotic components of human
atherosclerosis in vivo. Circulation. 1996: 94(5): 932-8.
Toussaint, J. F., Southern, J. F., Fuster, V., et al. T2-weighted contrast for NMR
characterization of human atherosclerosis. Arterioscler Thromb Vasc Biol. 1995:
15(10): 1533-42.
Tuzcu, E. M., Berkalp, B., De Franco, A. C., et al. The dilemma of diagnosing
coronary calcification: angiography versus intravascular ultrasound. J Am Coll
Cardiol. 1996: 27(4): 832-8.
van der Wall, E. E., Vliegen, H. W., de Roos, A., et al. Magnetic resonance imaging
in coronary artery disease. Circulation. 1995: 92(9): 2723-39.
Veldtman, G. R., Razack, V., Siu, S., et al. Right ventricular form and function after
percutaneous atrial septal defect device closure. J Am Coll Cardiol. 2001: 37(8):
2108-13.

193
Vengrenyuk, Y., Carlier, S., Xanthos, S., et al. A hypothesis for vulnerable plaque
rupture due to stress-induced debonding around cellular microcalcifications in thin
fibrous caps. Proc Natl Acad Sci U S A. 2006: 103(40): 14678-83.
Virmani, R., Burke, A. P., Farb, A., et al. Pathology of the vulnerable plaque. J Am
Coll Cardiol. 2006: 47(8 Suppl): C13-8.
Virmani, R., Burke, A. P., Kolodgie, F. D., et al. Pathology of the thin-cap
fibroatheroma: a type of vulnerable plaque. J Interv Cardiol. 2003: 16(3): 267-72.
Virmani, R., Kolodgie, F. D., Burke, A. P., et al. Lessons from sudden coronary
death: a comprehensive morphological classification scheme for atherosclerotic
lesions. Arterioscler Thromb Vasc Biol. 2000: 20(5): 1262-75.
Walker, R. E., Moran, A. M., Gauvreau, K., et al. Evidence of adverse ventricular
interdependence in patients with atrial septal defects. Am J Cardiol. 2004: 93(11):
1374-7, A6.
Wang, S., Detrano, R. C., Secci, A., et al. Detection of coronary calcification with
electron-beam computed tomography: evaluation of interexamination reproducibility
and comparison of three image-acquisition protocols. Am Heart J. 1996: 132(3):
550-8.
Wasserman, B. A., Smith, W. I., Trout, H. H., 3rd, et al. Carotid artery

194
atherosclerosis: in vivo morphologic characterization with gadolinium-enhanced
double-oblique MR imaging initial results. Radiology. 2002: 223(2): 566-73.
Weber, M., Dill, T., Deetjen, A., et al. Left ventricular adaptation after atrial septal
defect closure assessed by increased concentrations of N-terminal pro-brain
natriuretic peptide and cardiac magnetic resonance imaging in adult patients. Heart.
2006: 92(5): 671-5.
Wexler, L., Brundage, B., Crouse, J., et al. Coronary artery calcification:
pathophysiology, epidemiology, imaging methods, and clinical implications. A
statement for health professionals from the American Heart Association. Writing
Group. Circulation. 1996: 94(5): 1175-92.
Weyman, A. E., Wann, S., Feigenbaum, H., et al. Mechanism of abnormal septal
motion in patients with right ventricular volume overload: a cross-sectional
echocardiographic study. Circulation. 1976: 54(2): 179-86.
Wilson, P. W., D'Agostino, R. B., Levy, D., et al. Prediction of coronary heart
disease using risk factor categories. Circulation. 1998: 97(18): 1837-47.
Wintersperger, B. J. and Nikolaou, K. Basics of cardiac MDCT: techniques and
contrast application. Eur Radiol. 2005: 15 Suppl 2: B2-9.
Wong, N. D., Budoff, M. J., Pio, J., et al. Coronary calcium and cardiovascular event
risk: evaluation by age- and sex-specific quartiles. Am Heart J. 2002: 143(3): 456-9.

195
Wood, J. C. Anatomical assessment of congenital heart disease. J Cardiovasc Magn
Reson. 2006: 8(4): 595-606.
Worthley, S. G. and Badimon, J. J. (2005). Magnetic Resonance Imaging of high-
Risk Plaque. High-Risk Atherosclerotic Plaques. L. M. Khachigian, CRC Press: 101-
28.
Worthley, S. G., Helft, G., Fuster, V., et al. High resolution ex vivo magnetic
resonance imaging of in situ coronary and aortic atherosclerotic plaque in a porcine
model. Atherosclerosis. 2000: 150(2): 321-9.
Worthley, S. G., Helft, G., Fuster, V., et al. Noninvasive in vivo magnetic resonance
imaging of experimental coronary artery lesions in a porcine model. Circulation.
2000: 101(25): 2956-61.
Worthley, S. G., Helft, G., Fuster, V., et al. Serial in vivo MRI documents arterial
remodeling in experimental atherosclerosis. Circulation. 2000: 101(6): 586-9.
Worthley, S. G., Helft, G., Zaman, A. G., et al. Atherosclerosis and the vulnerable
plaque--imaging: Part II. Aust N Z J Med. 2000: 30(6): 704-10.
Yang, P. C., Kerr, A. B., Liu, A. C., et al. New real-time interactive cardiac magnetic
resonance imaging system complements echocardiography. J Am Coll Cardiol. 1998:
32(7): 2049-56.

196
Yuan, C., Beach, K. W., Smith, L. H., Jr, et al. Measurement of Atherosclerotic
Carotid Plaque Size In Vivo Using High Resolution Magnetic Resonance Imaging.
Circulation. 1998: 98(24): 2666-2671.
Yuan, C., Kerwin, W. S., Ferguson, M. S., et al. Contrast-enhanced high resolution
MRI for atherosclerotic carotid artery tissue characterization. J Magn Reson
Imaging. 2002: 15(1): 62-7.
Yuan, C., Mitsumori, L. M., Ferguson, M. S., et al. In Vivo Accuracy of
Multispectral Magnetic Resonance Imaging for Identifying Lipid-Rich Necrotic
Cores and Intraplaque Hemorrhage in Advanced Human Carotid Plaques.
Circulation. 2001: 104(17): 2051-2056.
Yuan, C., Zhang, S.-x., Polissar, N. L., et al. Identification of Fibrous Cap Rupture
With Magnetic Resonance Imaging Is Highly Associated With Recent Transient
Ischemic Attack or Stroke. Circulation. 2002: 105(2): 181-185.
Zhao, X. Q., Yuan, C., Hatsukami, T. S., et al. Effects of prolonged intensive lipid-
lowering therapy on the characteristics of carotid atherosclerotic plaques in vivo by
MRI: a case-control study. Arterioscler Thromb Vasc Biol. 2001: 21(10): 1623-9.
Zhu, W., Cao, Q. L., Rhodes, J., et al. Measurement of atrial septal defect size: a
comparative study between three-dimensional transesophageal echocardiography and
the standard balloon sizing methods. Pediatr Cardiol. 2000: 21(5): 465-9.