multinational banks and the global financial crisis ... · 1 bloomberg, 27 -10 2011, ‘foreign...
TRANSCRIPT

Multinational Banks and the Global Financial Crisis.
Weathering the Perfect Storm?
Ralph De Haas and Iman Van Lelyveld*
Abstract
We use data on the 48 largest multinational banking groups to compare the lending of their
199 foreign subsidiaries during the Great Recession with lending by a benchmark of 202
domestic banks. Contrary to earlier and more contained crises, parent banks were not a
significant source of strength to their subsidiaries during 2008-09. When controlling for other
bank characteristics, multinational bank subsidiaries had to slow down credit growth almost
three times as fast as domestic banks. This was in particular the case for subsidiaries of
banking groups that relied more on wholesale funding. We conclude that while multinational
banks may contribute to financial stability during local crisis episodes, they also increase the
risk of ‘importing’ instability from abroad.
Keywords: Multinational banks, financial stability, crisis transmission, funding structure
JEL codes: F15; F23; F36; G21
* De Haas is with the European Bank for Reconstruction and Development (EBRD) and Van Lelyveld with De
Nederlandsche Bank (DNB). The authors thank Thorsten Beck, Erik Berglöf, Martin Brown, Hans Degryse, Sebnem
Kalemli-Ozcan, Luc Laeven, Hyun Song Shin, Jeromin Zettelmeyer, an anonymous referee, and participants at the EBRD-
G20-RBWC Conference on Cross-Border Banking in Emerging Markets, the DNB-European Banking Center-JMCB-
University of Kansas Post-Crisis Banking Conference, the 27th Congress of the European Economic Association, and
seminars at DNB, EBRD, Maastricht University, the Higher School of Economics (Moscow), and the University of Surrey
for useful comments. Any remaining errors are our own and the views expressed in this paper are those of the authors and
not necessarily of the institutions they are affiliated with. E-mail: [email protected] and [email protected].

1
1. Introduction
Over the last two decades many countries have opened up their banking sectors to foreign
investors with the aim of improving the quantity and quality of financial services available to
domestic firms and households. This has led to the emergence of a few truly global banking
groups, such as Citigroup and HSBC, and a large number of multinational banks with a more
regional focus, such as UniCredit and Standard Chartered. What are the economic
implications of multinational banking for the countries that opened up? In particular, has
international banking integration made host countries more resilient or more susceptible to
financial shocks?
This paper contributes to answering this question by analyzing a comprehensive dataset
on both multinational bank subsidiaries and stand-alone domestic banks. We compare the
lending stability of both types of banks during the 2008-09 Great Recession (as well as
during earlier crises) while also taking account of bank funding structure. In doing so, we
build on De Haas and Van Lelyveld (2010) who used similar data to examine bank lending
during previous, more contained bouts of financial turmoil. During such local crises,
subsidiaries of financially strong parent banks did typically not rein in credit whereas
domestic banks had to do so. Strong parent banks used their internal capital market to provide
subsidiaries with capital and liquidity and this financial support stabilized local lending.
The 2008-09 crisis, which struck at the core of the international financial system and
affected virtually all large banking groups (Acharya and Schnabl, 2010) necessitates a
reappraisal of the evidence on the stability implications of multinational banking. Just like
strong parent banks supported subsidiaries during local crises, weak parent banks may have
discontinued such support during the global crisis. Fragile parent banks hit by a freeze in
short-term funding, may even have used their internal capital markets to repatriate funds from
subsidiaries to headquarters. For instance, according to the business press, subsidiaries in
Russia and the Czech Republic used local liquidity to support their foreign headquarters in
Italy and France in the wake of the Lehman Brothers collapse and during the Eurozone
crisis.1 If multinational bank subsidiaries are dependent on parent-bank funding and if such
parental support was not forthcoming during the crisis, financial integration may have made
host countries vulnerable to financial shocks that originated elsewhere.
1 Bloomberg, 27-10-2011, ‘Foreign banks in Russia support European owners since mid-year’ and ft.com/alphaville, 04-11-
2011, ‘Honey, I shrunk Emerging Europe’.

2
Against this background, we ask whether multinational bank subsidiaries managed to
keep up lending relatively well during the recent crisis or, alternatively, whether the absence
of parental support meant that they had to stand on their own feet and were no longer in an
advantageous position compared with stand-alone domestic banks. We find that multinational
bank subsidiaries curtailed credit growth more aggressively than domestic banks, almost
three times as much. Subsidiaries that relied to a greater extent on wholesale funding or
whose parents depended on wholesale funding, had to slow down credit growth the most.
This suggests that parent banks that lost access to wholesale markets, which dried up at
various points during the crisis, subsequently reduced funding to their foreign subsidiaries.
We also confirm the earlier finding that subsidiaries are relatively stable lenders during
local crises and therefore conclude that while the presence of multinational banks mitigates
domestic financial shocks it also opens the door for the transmission of foreign shocks.
Finally, we show that multinational banks performed better in their home country when
compared with domestic competitors without foreign subsidiaries. Just like parent banks tend
to be a source of strength to subsidiaries that experience a local idiosyncratic shock, a foreign
subsidiary network may in turn provide some support when parent banks themselves
experience funding problems.
Our paper contributes in three main ways to the banking literature. First, we use a
geographically comprehensive dataset to analyze the relationship between bank ownership
and lending stability during the Great Recession. A small number of papers have assessed
this link for specific countries or regions. De Haas, Korniyenko, Loukoianova, and
Pivovarsky (2011) and Popov and Udell (2012) find that multinational bank subsidiaries in
Emerging Europe cut lending more than domestic banks.2 Fungácová, Herrala and Weill
(2011) and Aiyar (2012) find the same for Russia and the United Kingdom, respectively.
Other studies provide evidence of a crisis-related credit crunch without focussing on the role
of bank ownership.3 Our comprehensive yet detailed data on the largest multinational banks
cover all main geographical regions and the whole crisis period. This allows us to assess the
external validity of earlier country-specific findings. More importantly, we not only identify
the home country of each bank subsidiary –as in Micco, Panizza, and Yañez (2007) and
2 In contrast to these papers, Barba Navaretti, Calzolari, Pozzolo, and Levi (2010) argue that multinational banks were a
stabilizing force in Europe as they displayed a stable loan-to-deposit ratio. However, their analysis is limited to the years
2007-08 while much of the reduction in bank lending only took place in 2008-09.
3 See Puri, Rocholl, and Steffen (2011) on Germany; Jimenéz, Ongena, Peydró, and Saurina (2012) on Spain; and Presbitero,
Udell, and Zazzaro (2012) on Italy.

3
Claessens and Van Horen (2013)– but also link it to its parent bank and to other subsidiaries
in the same group. This complete organizational picture of the main banking groups is unique
and allows us to track how shocks to one part of the group resonate in other parts.
Second, our paper adds to the literature on bank-funding structure and lending stability.
During the Great Recession, banks that relied more on short-term wholesale funding reduced
domestic credit more (see Ivashina and Scharfstein (2010) and Cornett, McNutt and Strahan
(2011) for the U.S.; Yorulmazer and Goldsmith-Pinkham (2010) for the U.K.; and Iyer,
Lopes, Peydró, and Schoar (2010) for Portugal); cut cross-border credit more (Cetorelli and
Goldberg, 2011)4; were more often financially distressed (Cihák and Poghosyan, 2009); and
experienced a worse stock-price performance when Lehman Brothers collapsed (Raddatz,
2010) and during the crisis in general (Beltratti and Stulz, 2012). Relying on short-term
wholesale funding made banks vulnerable to sudden liquidity shortages during which they
could not roll over debt.5 By comparing domestic and multinational banks we can distinguish
between the impact of banks’ ownership and funding structure on lending stability.
Third, our paper adds to the more general literature on multinational banking. On the
theoretical side, a number of papers model the relationship between banking integration and
business cycle synchronization. The seminal contribution by Morgan, Rime and Strahan
(2004), a two-country version of Holmström and Tirole's (1997) 'double-decker' moral hazard
model, predicts that banking integration increases (decreases) output co-movement after
asymmetric shocks to the financial (real) sector. Kalemli-Ozcan, Papaioannou, and Perri
(2012) arrive at similar predictions using a general equilibrium model of international
business cycles with multinational banks.6 The intuition is that multinational banks reallocate
capital to countries where bank capital is in short supply (e.g. those experiencing a banking
crisis) and away from countries where investment opportunities are scarce (e.g. countries in a
downturn). Multinational banks consequently mitigate local financial shocks, transmit foreign
financial shocks, and exacerbate shocks to the real economy.
4 Cetorelli and Goldberg (2011) also use data on multinational bank lending through local affiliates, but an important
difference with our paper is that we use bank-level data whereas they use country-pair level data. This makes our analysis
considerably more detailed as we can analyze the role of various bank-specific characteristics as well characteristics of
parent banks and other subsidiaries in the same bank holding company.
5 Short-term wholesale markets freeze easily in response to noisy public signals about the quality of bank assets (Huang and
Ratnovski, 2011) whereas core deposits are less volatile, in particular when insured (Feldman and Schmidt, 2001). Failed
U.K. bank Northern Rock, which saw wholesale lenders run before retail depositors started to queue outside its offices, has
perhaps become somewhat of a poster child for this literature.
6 See also Devereux and Yetman (2010) and Kollman, Enders, and Muller (2011).

4
A number of papers have confirmed these theoretical predictions by taken them to macro-
and microeconomic data. At the macro level, Kalemli-Ozcan, Papaioannou, and Peydró
(2012) show that when real productivity shocks dominate shocks to the financial sector,
deeper financial integration leads to more divergent output fluctuations. As expected, this
positive relationship weakened during 2007-09 as the cross-border transmission of financial
shocks synchronized business cycles. Bruno and Hauswald (2012) show that financially-
dependent industries are less affected during local banking crises when multinational bank
subsidiaries are present. This suggests that these subsidiaries act as a ‘safety net’ by
mitigating the adverse impact of a local credit crunch.
At the micro level, two key papers are Peek and Rosengren (1997; 2000) who
demonstrate how the drop in Japanese stock prices in 1990 made Japanese bank branches in
the U.S. reduce lending. In a similar vein, Schnabl (2012) analyzes how the 1998 Russian
crisis spilled over to Peru as banks, including multinational bank subsidiaries, had to reduce
local lending. Chava and Purnanandam (2011) find similar evidence for U.S. banks.
Moreover, evidence for the U.S. (Morgan, Rime, and Strahan (2004) and Loutskina and
Strahan (2011)); Japan (Imai and Takarabe, 2011), and the Netherlands (Cremers, Huang, and
Sautner, 2011) indicates that similar mechanisms are at play in the case of large banks that
operate across several regions or states within one and the same country.
The remainder of this paper is structured as follows. Section 2 describes our dataset and
empirical approach, after which Section 3 presents our main results. Section 4 then provides a
concise discussion of the country-level implications of our findings. Section 5 concludes.
2. Data and methodology
2.1. Sample
We expand and update the data used in De Haas and Van Lelyveld (2010) to create a
comprehensive sample of multinational banks based on the Top 1000 as published by The
Banker. From the 150 largest banks (asset rank) we identify banks with more than one
significant foreign bank subsidiary.7 This results in a group of 48 holding companies, for
which we then identify – on the basis of Bureau Van Dijk's BankScope database, websites,
7 We include commercial, savings, mortgage, long-term credit, and cooperative banks and exclude investment and state
banks, securities houses, and non-bank credit institutions.

5
and correspondence with banks – all subsidiaries that account for at least 0.5 per cent of
parent-bank assets in 2009 and that are at least 50 per cent owned by the parent. We therefore
limit ourselves to relatively large foreign subsidiaries in which the parent has a controlling
stake. A parent bank owns on average 4.3 of such significant subsidiaries. Table A3 in the
Annex contains a list of all banks in our sample.
If parent banks are the result of a merger or acquisition in year t we include them from
t+1 onwards. We disregard banks for which we have less than three consecutive years of data
(all Chinese and most Japanese banks). For each subsidiary we trace back in which year t it
became part of the holding company as a result of a takeover. For greenfield subsidiaries that
were established by the bank itself, we use data from year t onwards, whereas we include
take-over subsidiaries from t+1.
For each subsidiary (level 1) we check whether it owns sub-subsidiaries (level 2) that are
larger than 0.5 per cent of the ultimate bank holding company (level 0). If not, we include
consolidated data for the level 1 subsidiaries. If it does, we include unconsolidated data for
the level 1 subsidiary and include the sub-subsidiary as a separate entity (using consolidated
data) of the parent bank. We use unconsolidated data for the parent banks.
Subsidiaries may also undertake some foreign activities of their own. A parent bank in
country A may for instance operate a subsidiary in country B which in turn employs activities
in country C. Such business in country C is typically limited as parent banks tend to set up a
separate subsidiary in county C in case of ample business opportunities. An interesting
exception is Nordea, the Swedish bank holding company that resulted from the merger of
Nordbanken (Sweden), Meritabanken (Finland), Unibank (Denmark), and Christiania Bank
og Kreditkasse (Norway). Nordea’s main foreign operations are subsidiaries in Denmark,
Finland, Norway, and Russia (all in our dataset). However, Nordea Bank Finland also
comprises the group’s activities in the Baltic countries Estonia, Latvia, and Lithuania. It does
so through local branches which are an integral part of Nordea Finland’s balance sheet.8 If the
Baltic activities were structured as subsidiaries, and if these would be large in terms of the
balance sheet of Nordea as a whole, we would have included them as separate entities in our
dataset. However, as they are branches we treat them as part of Nordea Finland.
We also create a benchmark set of domestic banks that consists of up to five of the largest
domestically owned banks in each of the host countries in our sample. This results in a
8 This contrasts with the other large Swedish banking groups Swedbank and SEB. These banks have six independent
subsidiaries in the Baltic region which are included in our dataset as separate entities under the Swedish holding companies.

6
sample of 202 domestic banks. The panel of domestic and multinational banks covers 1992-
2009 but is unbalanced as we do not have data for all years for each bank. Because not all
banks report in the same currency we convert financial variables into US dollars.
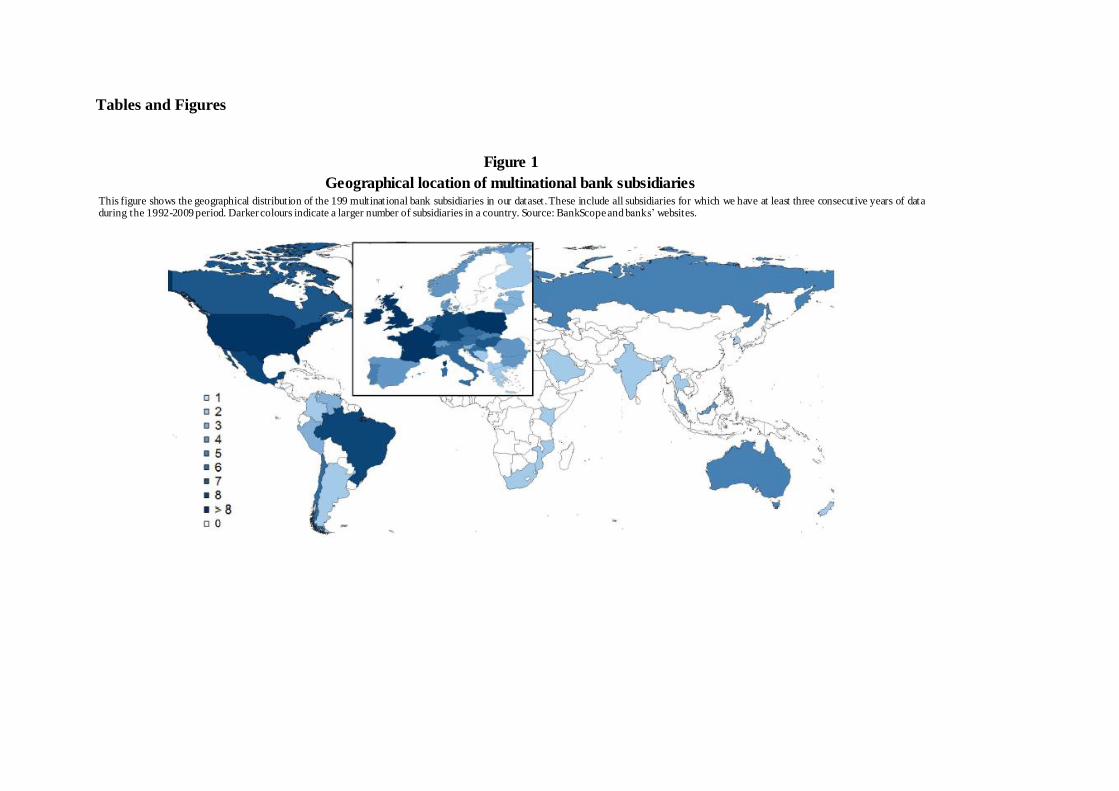
Figure 1 provides a graphical representation of our multinational bank sample which
consists of 48 parent banks from 19 home countries with 199 subsidiaries across 53 countries.
Most parent banks and subsidiaries are European, reflecting the ownership links that were
established between western and eastern European banks after the fall of the Berlin wall.
Foreign banks now own 68 per cent of all banking assets in eastern Europe (source:
Claessens and Van Horen, 2013).
About 19 per cent of our sample of parent banks and subsidiaries are based in North
America. North American banks are less internationalised than European banks, which is not
surprising given their substantially larger home market. Still, in 2009 almost twenty per cent
of all bank assets in the U.S. itself were owned by foreign financial institutions.
[Insert Figure 1 around here]
Figure 1 shows that multinational banks also hold significant positions in many other
countries and regions. For instance, 62 per cent of all banking assets in Eastern and Southern
Africa are in foreign hands. Western groups like Standard Chartered as well as multinational
African banks have made significant cross-border inroads in recent years.
In Central and South America, multinational banks of Spanish and North American origin
own 53 and 31 per cent of all banking assets, respectively. Our sample reflects the strong
presence of these banks in Argentina, Brazil, Chile, Mexico, and Peru in particular. Foreign
bank entry into Latin America accelerated during the 1990’s and 2000’s when state banks
were privatized and weak private banks sold off, more conducive investment laws were
passed, and the macroeconomic outlook stabilized.
While multinational banks also entered Asia, in particular after the 1997-98 crisis, strict
regulation has forced banks to operate mainly in the form of branches or representative
offices instead of locally incorporated subsidiaries. Yet even in Asia there are a number of
countries, such as Malaysia, where foreign bank subsidiaries play an important role.
2.2. Descriptive statistics
Our dependent variable is the percentage growth of gross loans and we measure gross loans
by adding loan-loss reserves to net loans. This corrects for changes in net loans that are not

7
caused by actual new loans but by loan loss provisioning. We check for outliers and remove
observations with implausible values. To control for mergers and acquisitions we also
remove observations where absolute annual loan growth exceeds 75 per cent.
Table 1 provides basic descriptive statistics for credit and deposit growth, two of our
main variables. The data show how after rapid growth in 2007 – the peak of the credit cycle –
financial intermediation slowed sharply in 2008-09. The reduction in credit growth was
particularly pronounced for multinational bank subsidiaries in 2008. Moreover, whereas
credit growth of domestic banks rebounded in 2009 and even exceeded its long-term average,
credit dynamics remained subdued for multinational bank subsidiaries.
[Insert Table 1 around here]
The table also shows how during 2000-07 deposit growth was persistently and
significantly higher for domestic banks. This reflects that multinational bank subsidiaries
typically have better access to alternative funding sources, such as the international bond and
syndicated loan markets as well as parent-bank funding. They are therefore not as dependent
on just deposit growth. Consequently the data show a stronger correlation between deposit
and loan growth for domestic banks than for multinational bank subsidiaries, in particular
during the crisis (0.63 versus 0.39). Deposit growth halted for both types of banks in 2008
after which growth resumed.
It is interesting to compare the deposit and credit dynamics during the 2008-09 crisis with
those exactly ten years earlier, at the time of the Asian, Russian, and Latin American crises of
1998-1999. Depositor confidence was shaken less at the time and compared to the average
for the preceding period 1992-97, the reduction in credit growth was also less pronounced.
This underlines the unique character of the Great Recession in terms of the strength of the
shock to the global financial system.
Tables A1 and A2 in the Annex provide an overview of the variable definitions, data
sources, and further descriptive statistics. This shows that both before and during the crisis
the median liquidity and solvency of stand-alone domestic banks is slightly higher than that
of multinational bank subsidiaries. The latter can rely on support from the bank group they
belong to and therefore tend to hold a slightly lower liquidity and solvency buffer over and
above the minimum levels required by local regulators (pre-crisis (crisis) differences are
significant at the 1% (10%) level)

8
Profitability levels have been persistently higher for multinational bank subsidiaries
compared to domestic banks and this holds true both before and during the crisis (1% level).
This may indicate a focus on somewhat better clients9 as well as more efficient operations
(Martinez Peria and Mody, 2004). Table A2 also shows that both multinational bank
subsidiaries and their domestic competitors saw their profitability decline only marginally
during the crisis. In sharp contrast, parent banks experienced a steep drop in profitability of
60 per cent compared to the average 1992-2007 level. This provides a further indication that
the Great Recession hit multinational banks mainly ‘at home’.
Finally, Table A2 shows that compared to subsidiaries, parent banks make significantly
more use of wholesale funding (1% level). This reflects that large and internationally
diversified banks tend to have easier access to international wholesale markets compared to
their locally incorporated subsidiaries (which may nevertheless benefit indirectly if part of
this wholesale funding is allocated to them via the group’s internal capital market).
2.3. Methodological approach
Our dependent variable is the credit growth of bank i in year t and the independent variables
comprise a set of host-country variables, characteristics of bank i - including lagged credit
growth and an ownership dummy variable -, and a crisis dummy for the years 2008 and 2009:
∑
∑
(1)
Where
ΔLit (Δ Lit-1) is the percentage credit growth of bank i in year t (t-1 if lagged);
α is an intercept, γ and δ are coefficients and βk are coefficient vectors;
Hostit is a matrix of host-country macroeconomic variables;
Bankit is a matrix of characteristics of bank i itself, including a dummy to distinguish
between multinational bank subsidiaries and domestic banks, and/or its parent bank;
Crisist is a dummy variable that is 1 for observations in 2008 or 2009;
εit is an idiosyncratic error εit ~IDD (0, σ2
ε);
i=1,..., N where N is the number of banks in the sample;
t=1,..., Ti where Ti is the number of years in the sample for bank i.
9 On ‘cherry-picking’ or ‘cream-skimming’ by foreign banks see Detragiache, Tressel, and Gupta (2008) and Degryse,
Havrylchyk, Jurzyk, and Kozak (2011).

9
The host-country macroeconomic variables reflect the attractiveness of expanding credit in a
particular country. We expect a positive relationship with host-country GDP growth, a proxy
for credit demand at the country level, as banks expand credit in a procyclical way. GDP
growth is only a rough proxy for credit demand and we are careful not to interpret our
findings as pure supply-side effects. To fully control for credit demand one would either have
to match banks with individual borrowers or analyze firms that borrow from more than one
bank (keeping credit demand constant).10
This level of detail is not available in our data. We
therefore need to assume either that banks grant credit to similar market segments11
or that
heterogeneity in credit demand across market segments is orthogonal to bank ownership and
our other explanatory variables.
We expect a negative impact of inflation as rapid price increases may worsen market
frictions and force banks to ration credit (Boyd, Levine, and Smith, 2001). Yet, as host-
country inflation increases the nominal value of loan portfolios there will be a positive
mechanical effect of inflation on bank lending. Since we convert our data to U.S. dollars,
inflationary effects should disappear to the extent that purchasing power parity holds. We
include the nominal exchange rate to ensure that our results for other macroeconomic
variables are not driven by residual exchange-rate fluctuations.
We anticipate a negative sign for Crisist as banks, regardless of their ownership structure,
had to slow down credit growth during the crisis due to tighter funding constraints. To
compare lending by multinational bank subsidiaries and domestic banks, we include a
dummy variable that is one for domestic banks. To the extent that domestic banks were better
able to continue lending than multinational bank subsidiaries, we expect a positive coefficient
for this interaction term between Crisist and Domestic. In contrast, if multinational bank
subsidiaries were supported by their parent banks and if this support gave them a competitive
advantage during the crisis, their lending would have been more stable than that of stand-
alone domestic banks. We would then observe a negative interaction.
10 See Beck, Ioannidou, and Schäfer (2012) and De Haas and Van Horen (2013) for examples of this approach. The former
paper uses data on firms that borrow from both domestic and foreign banks to show that both types of banks may lend to the
same clientele while using different lending techniques.
11 While evidence suggests that multinational banks focus more on large, foreign, and transparent borrowers than domestic
banks – see Berger and Udell (1995) and the references in footnote 9 – recent contributions indicate that over time foreign
and domestic banks’ client segments may converge (De Haas and Naaborg, 2006). Multinational bank subsidiaries may
amass local knowledge and successfully apply transaction technologies that use hard information, such as credit scoring, to
lend to opaque borrowers (Berger and Udell, 2006; Petersen and Rajan, 2002).

10
To analyze the impact of funding structure on the stability of bank lending, we first
include deposit growth. Deposits are a relatively stable funding source as they are (partially)
government insured in many countries (Song and Thakor, 2007). We expect that access to a
stable deposit base was particularly important during the crisis when wholesale funding dried
up. Because banks differ substantially in the relative importance of their deposit base, we also
include the variable Wholesale, the ratio between total loans and the bank's customer funding.
This measure proxies for the amount of lending that the bank has funded from non-deposit
sources. As a third funding measure, we include the ratio of internally generated income at
the end of year t to total loans at the end of year t-1. This variable captures the sensitivity of a
bank’s loan growth to internally generated cash flow (Campello, 2002).
In addition to these ownership and funding variables, we include the following bank-
specific control variables: profitability (return on average assets), solvency (equity to assets),
and liquidity (liquid assets to customer deposits). On the one hand, high capital and liquidity
ratios may reflect that a bank is risk-averse and expands credit only slowly.12
Vice versa,
undercapitalized banks may be prone to moral hazard and rapidly expand (risky) lending
(Black and Strahan, 2002). Both effects imply a negative relationship between bank capital
and loan growth. On the other hand, high capital and liquidity ratios may indicate that
funding constraints are not binding, enabling banks to rapidly expand lending. The expected
sign of the coefficients for these variables is therefore indeterminate.
We use two estimation methods for our panel regressions: fixed effects and a dynamic
GMM panel estimator. The choice for fixed effects estimations is based on Hausman tests,
which indicate that fixed effects are preferred over random effects as the independent
variables and bank-specific effects are correlated. Since lagged credit growth may be
correlated with the panel-level effects and our time dimension is relatively limited, there is a
risk that our estimator is inconsistent (Nickell, 1981). We therefore also report the results of a
GMM difference estimator, where the instruments consist of lags of the levels of the
explanatory and dependent variables (Arellano and Bond, 1991).13
To test whether the instruments are valid, we perform Hansen’s J test for overidentifying
restrictions. If we cannot reject the null, the model is supported and this is the case
throughout the paper (see the p-values at the bottom of the tables). These p-values are not
exceptionally high (i.e. not above 0.9) which gives us some comfort that the instruments are
12 Degryse, Elahi, and Penas (2012) find that more liquid and better capitalized banks reduce regional banking fragility.
13 We also ran regressions using the Arellano and Bover (1995) or the Hausman and Taylor (1981) estimator. As the results
are very similar to those obtained with the other estimators we do not report them for reasons of brevity.

11
not weak (Roodman, 2009). We also report the outcomes of the Arellano and Bond (1991)
test for autocorrelation of order 1 and 2. These consistently show that we cannot reject the
null hypothesis of no second-order autocorrelation (since the estimator is in first differences,
first-order autocorrelation does not imply inconsistent estimates). Robust estimators are used
to correct for heteroscedasticity.
3. Empirical results
3.1. Baseline results
Table 2 summarizes our baseline results based on the full sample that includes both
multinational bank subsidiaries and domestic banks. The first lines indicate that relatively
solvent and liquid banks grow more slowly, possibly because these banks are more
conservative. In terms of funding structure, we find that deposit growth is positively
correlated with credit growth and that a higher proportion of wholesale funding in total
liabilities has a positive impact on loan growth. Banks also grow faster when they generate
more income internally (as measured by the income to loans ratio). As expected, lending is
procyclical.14
[Insert Table 2 around here]
In the bottom half of Table 2 we then distinguish between both ownership types through
interaction terms with the Domestic dummy. Columns 1-4 indicate that banks had to reduce
their credit growth quite substantially during the 2008-09 crisis. However, the interaction
terms between the Global crisis dummy and Domestic show that this reduction was
significantly smaller for domestic banks, all else equal. Domestic banks had to reduce their
lending growth by only 4.6 percentage points: about a third of the credit slowdown by
multinational bank subsidiaries.
In columns 3-4 we also interact Domestic with a Local crisis dummy, which we create
using the updated dataset by Laeven and Valencia (2012). This dummy identifies (the timing
of) local banking crises in the host countries in our dataset. In line with De Haas and Van
14 A comparison of the odd and even columns shows that our fixed effects (FE) and Arellano-Bond GMM (AB) results are
very similar. In the remainder of the paper we therefore present AB results only.

12
Lelyveld (2006, 2010) we find that domestic banks are less stable lenders during such local
crises, exactly the opposite of what we find for the recent, global crisis. This is confirmed in
the subsequent columns and in line with the theoretical results discussed in Section 2.
In columns 5-6 we then add an interaction term between Global crisis and Wholesale
funding. This specification allows us to investigate the relative importance of bank funding
structure and bank ownership structure for credit growth during the crisis. In columns 7-8 we
also add interaction terms between Global crisis and three other funding-related bank
characteristics. This final step allows us to check whether any findings on ownership and
funding structure are not spurious.15
We find that even when we interact Global Crisis with a
number of bank characteristics, the interaction term between Domestic and Global Crisis
remains significantly positive. In addition, we find that banks that depended less on
wholesale funding grew faster. The economic significance of this result is substantial. A one
standard deviation decrease in a subsidiary’s wholesale funding corresponds to 2.5
percentage points higher credit growth during the crisis.
Once we add the interaction term between Global crisis and Wholesale funding, the
global crisis dummy itself becomes insignificant, further underlining the importance of
funding structure as a driver of lending behaviour. Banks that were able to generate more
deposits during the crisis grew faster too. When wholesale funding was increasingly difficult
to roll over, access to deposits became an even stronger determinant of credit growth.
We conclude that both funding structure and ownership structure mattered during the
crisis. In other words, we find a separate ownership effect on lending stability over and above
the impact of banks’ funding structure. Foreign-bank subsidiaries are not simply different
because of a different balance-sheet structure but also because they are part of a multinational
bank holding company.
Finally, we perform a robustness test where we consecutively rerun the two main
specifications of Table 2 while each time omitting the observations of one particular region
(Emerging Europe, North America, South America, and Asia). Table A4 in the Appendix
shows that our findings are robust to this consecutive elimination of geographic regions. In
particular, the table indicates that domestic banks were relatively stable lenders across
regions and that the negative relationship between wholesale funding and lending stability
during the global crisis also holds across regions. Our findings do not just apply to emerging
15 We are limited in the number of interactions we can include by our degrees of freedom and the potential for instrument
proliferation in the GMM regressions. We experimented by including different sets of interaction terms and our findings on
the impact of ownership and funding structure are robust to such variations.

13
Europe, with its exceptional level of banking integration, but also reflect multinational banks’
operations in other parts of the world.
3.2. Group characteristics and subsidiary lending
In Table 3 we focus specifically on multinational bank subsidiaries. We consecutively add a
number of variables –both on their own and as part of interaction terms with Global crisis–
that measure characteristics of the parent bank (columns 1-3) and of the other subsidiaries of
that parent (columns 4-7). In this way we analyze whether group characteristics partially
explain the variation in the credit decline among multinational bank subsidiaries.
[Insert Table 3 around here]
While there is no apparent relationship between parent-bank liquidity and subsidiary
lending (column 1), we find that lending was more stable during the crisis by subsidiaries that
belong to banks that were better capitalized at the group level (column 2). Subsidiaries of
wholesale-funded parent banks had to rein in credit more strongly, all else equal (column
3).16
Interestingly, when we account for differences in the level of wholesale funding at the
group level, we no longer find a significant impact of the Global crisis dummy itself. The
negative impact of the global crisis on subsidiary lending can be largely explained by the
extent to which parent banks had funded themselves in the wholesale market. This mirrors
our previous finding for subsidiary-level wholesale funding and reflects that wholesale
funding at the parent and subsidiary level is positively correlated.
The results in columns 4-7 indicate that subsidiaries were also more stable lenders during
the crisis in case other subsidiaries in the same group were more liquid, held more capital,
and (at the 10 per cent level) did not experience a banking crisis in their own respective host
countries. These results are all in line with multinational banks operating an internal capital
market through which they reallocate liquidity and capital in response to shocks. In
particular, parent banks may allocate funding and capital from the periphery to the core in
case of a financial shock in the latter.
In unreported regressions we also experimented with a dummy variable Parent support
that indicates whether a parent bank received government support during the crisis. To create
16 Düwel and Frey (2012) show that short-term funding by foreign subsidiaries of German banks made them more vulnerable
during the 2008-09 crisis. Subsidiaries that relied on intra-bank funding had to reign in credit more as well, although less so
in the case of parent banks that had access to more deposits and long-term wholesale funding.

14
this dummy we developed a comprehensive database of financial support measures (capital
injections, loan guarantees, and removals of toxic assets) taken since the start of the crisis.
We pull this information from various publications by the European Commission and the
IMF, Reuters news service, and bank websites. State support is an indicator of bank fragility
and thus a proxy for the bank's need to deleverage, both at home and through its foreign
subsidiaries. Kamil and Rai (2010) suggest that rescue programs may also have caused banks
to reduce foreign lending.
Yet, when controlling for a battery of subsidiary and parent-bank characteristics we do
not find an independent effect of parent support. When we split our support variables into
specific dummies for support through capital injections, bank-specific guarantees, and asset
sales to the government we do not find an impact of these specific support measures either.
Moreover, we do not find an impact of banks’ participation in the European Bank
Coordination (“Vienna”) Initiative, which is not too surprising as this international crisis
response focused on five countries only, all in Emerging Europe.
3.3. Multinational bank heterogeneity: Size and distance
Our results in Table 2 indicate that during the Great Recession multinational bank
subsidiaries had to rein in credit growth more than domestic banks. This difference remains
when we control for a battery of bank characteristics, including funding structure. In Table 3
we saw that the financial strength of the parent bank and of other subsidiaries can partly
explain why multinational banks are different: they are financially connected to operations in
other countries. This raises the question whether the strength of such connections varies
across subsidiaries, a question we address in Table 4.
[Insert Table 4 around here]
We differentiate between subsidiary types along two dimensions: size and distance to the
parent bank. In columns 1 and 2 we first focus on subsidiary size which we measure either as
assets relative to total group assets or relative to total assets of the banking sector in the host
country. Cetorelli and Goldberg (2012a) show that during the recent crisis U.S. parent banks
shielded their ‘core’ (relatively large) foreign affiliates when they had to reduce internal
funding, while Cetorelli and Goldberg (2012b) find a similar pecking order among the
branches of foreign banks in the U.S. Berrospide, Black, and Keeton (2011) show that within
the U.S. banks transmitted shocks by reducing mortgage lending in lower-delinquency

15
markets in response to losses in high-delinquency markets. Such spill-overs affected in
particular more peripheral operations that accounted for a small share of the bank’s overall
lending. At the international level, Claessens and Van Horen (2013) show that lending by
foreign bank subsidiaries during the recent crisis was more stable in countries where foreign
banks (jointly) dominate the banking system. We therefore expect a positive relationship
between subsidiary size and lending stability.
Yet, the results in columns 1 and 2 indicate that credit growth during (and before) the
financial crisis was unrelated to subsidiary size. This holds regardless of whether we calculate
size as a percentage of the group’s balance sheet or of total banking assets in the host country.
A likely explanation is that our dataset comprises the main (‘core’) subsidiaries of each
multinational banking group but not smaller ones. This means that by construction the
variation in (relative) size is limited, making it harder to pick up any residual correlation
between bank size and lending stability.
Next, in columns 3-5 we analyze the role of the geographical and cultural distance
between parent bank and subsidiary. We measure geographical distance as the log of the
great-circle distance (in km) between the location of the parent headquarters and the location
of the subsidiary. A longer ‘within-bank’ or hierarchical distance makes it more difficult to
efficiently pass along (soft) borrower information from the subsidiary to headquarters
(Aghion and Tirole, 1997; Stein, 2002). This may also impede the efficient operation of an
internal capital market across borders.17
Moreover, if the incentives of distant loan officers
and local management are not aligned with those of the parent bank, internal agency costs
may hamper lending as well (Scharfstein and Stein, 2000).
Based on this literature we expect that more distant subsidiaries displayed a sharper
decline in bank lending as the crisis exacerbated agency problems between parents and
distant subsidiaries in particular. Interestingly, however, the interaction term between
Distance and Global crisis in column 3 shows that distant bank subsidiaries were more stable
lenders during the crisis, all else equal. A one standard-deviation increase in distance, which
corresponds to an additional 4,561 km, implies a 5.7 percentage point higher credit growth
during the crisis (4.5 percentage points when based on column 5 where we also control for
cultural distance). There are three main explanations for this finding.
17 Alessandrini, Presbitero, and Zazzaro (2009) show for Italy that a greater distance between loan officers and headquarters
adversely affects credit availability of local firms. Presbitero, Udell, and Zazzaro (2012) find that during the recent crisis the
supply of Italian bank credit was reduced in particular in provinces with branches of distantly-managed banks. De Haas and
Van Horen (2013) show that after the Lehman Brothers default cross-border credit was reduced more to distant destinations.

16
First, distant subsidiaries may simply be less integrated into the group’ internal capital
market and therefore better able to evade its financial discipline (that is, they are less likely to
be asked to provide financial support to the parent bank). Parent bank’s senior management
may find it difficult to manage junior management in far-away places (Rajan, Servaes, and
Zingales, 2000). While in good times a long distance to the parent may hamper subsidiary
growth – as distant subsidiaries are less successful in lobbying for internal funding (Carlin,
Charlton, and Mayer, 2006) – a ‘safe’ distance to a troubled parent bank that is in need of
financial support may turn out to be a blessing during a financial crisis.
Second, distant subsidiaries may have a special status within the bank holding company.
Setting up distant subsidiaries typically involves high fixed costs, and while these costs were
already sunk when the Great Recession erupted, they signal the strategic commitment of a
parent bank to a distant market. Indeed, senior management of expanding banks may
temporarily focus more on recently purchased remote subsidiaries and less on nearby
subsidiaries that have been part of the holding for longer (Berger and DeYoung, 2001).
Third, the higher lending stability of distant subsidiaries may also reflect that the crisis
erupted in the West, where many parent banks are based, while many distant subsidiaries are
located in emerging markets. To the extent that we do not fully control for local demand
conditions (via GDP growth), higher lending by these remote subsidiaries may also reflect
that the crisis hit many emerging markets later and to a lesser extent compared to Western
and nearer countries.
Another ‘distance’ measure is cultural or social affinity. Proximity in this respect may
foster lending stability as (re-)negotiations are facilitated and the costs of contracting and
information gathering are lower (Giannetti and Yafeh, 2012). If social interactions between
parent banks and subsidiaries are facilitated, as in the case of a common language, such
interactions may also gradual bias banks towards socially-close subsidiaries and their
borrowers (Landier, Nair, and Wulf, 2006).18
To measure these effects we include an
interaction term between Global crisis and cultural proximity (column 4), which we proxy by
Shared language, a dummy that is ‘1’ if a significant share of the population of the home and
host country share a common language.19
18 Galindo, Izquierdo, and Rojas-Suarez (2010) find for Latin America that the interest rates charged and amount of loans
supplied by foreign banks respond more to external shocks than those supplied by domestic banks. Yet, the -culturally close-
Spanish banks form an exception as they did not amplify the impact of foreign shocks on the price and amount of credit.
19 In columns 3-5 we include Distance but not Shared language as a separate main effect (in addition to the interaction
term). This is because Shared language is time invariant and therefore omitted from the AB model which is fitted in first
17
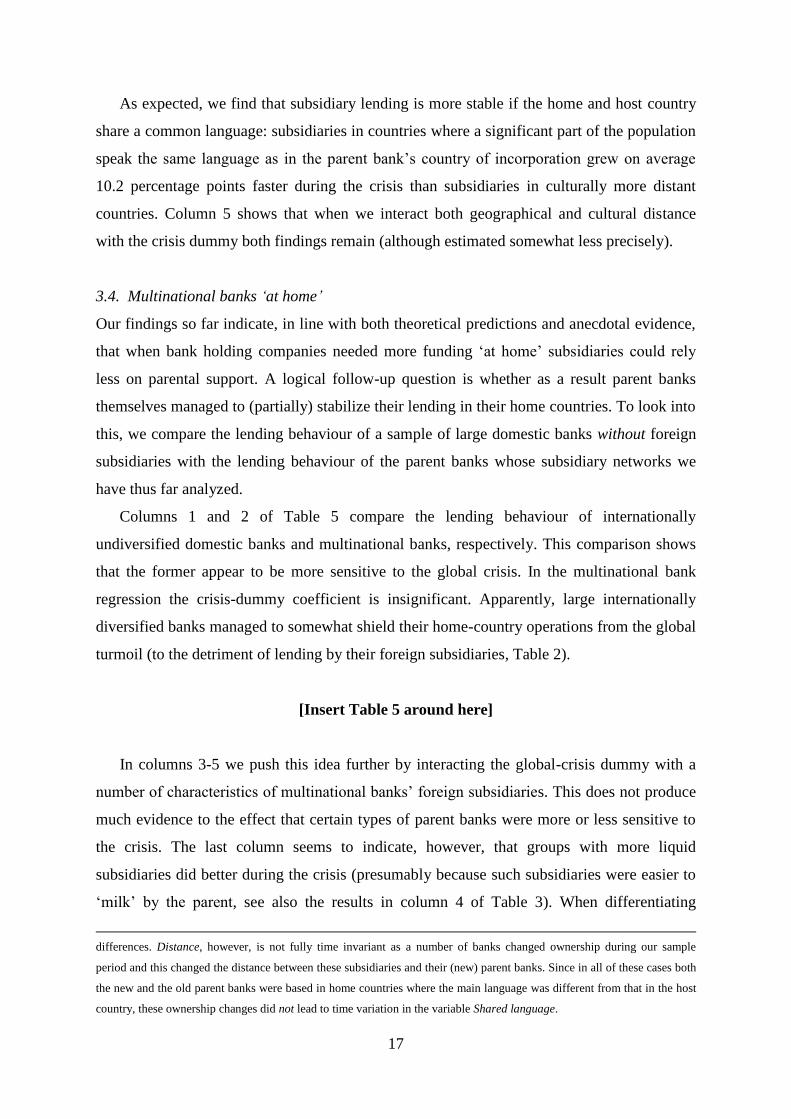
As expected, we find that subsidiary lending is more stable if the home and host country
share a common language: subsidiaries in countries where a significant part of the population
speak the same language as in the parent bank’s country of incorporation grew on average
10.2 percentage points faster during the crisis than subsidiaries in culturally more distant
countries. Column 5 shows that when we interact both geographical and cultural distance
with the crisis dummy both findings remain (although estimated somewhat less precisely).
3.4. Multinational banks ‘at home’
Our findings so far indicate, in line with both theoretical predictions and anecdotal evidence,
that when bank holding companies needed more funding ‘at home’ subsidiaries could rely
less on parental support. A logical follow-up question is whether as a result parent banks
themselves managed to (partially) stabilize their lending in their home countries. To look into
this, we compare the lending behaviour of a sample of large domestic banks without foreign
subsidiaries with the lending behaviour of the parent banks whose subsidiary networks we
have thus far analyzed.
Columns 1 and 2 of Table 5 compare the lending behaviour of internationally
undiversified domestic banks and multinational banks, respectively. This comparison shows
that the former appear to be more sensitive to the global crisis. In the multinational bank
regression the crisis-dummy coefficient is insignificant. Apparently, large internationally
diversified banks managed to somewhat shield their home-country operations from the global
turmoil (to the detriment of lending by their foreign subsidiaries, Table 2).
[Insert Table 5 around here]
In columns 3-5 we push this idea further by interacting the global-crisis dummy with a
number of characteristics of multinational banks’ foreign subsidiaries. This does not produce
much evidence to the effect that certain types of parent banks were more or less sensitive to
the crisis. The last column seems to indicate, however, that groups with more liquid
subsidiaries did better during the crisis (presumably because such subsidiaries were easier to
‘milk’ by the parent, see also the results in column 4 of Table 3). When differentiating
differences. Distance, however, is not fully time invariant as a number of banks changed ownership during our sample
period and this changed the distance between these subsidiaries and their (new) parent banks. Since in all of these cases both
the new and the old parent banks were based in home countries where the main language was different from that in the host
country, these ownership changes did not lead to time variation in the variable Shared language.
18
between multinational banks with more and less liquid subsidiaries, the coefficient of the
Global crisis dummy itself is also more precisely estimated. While on average multinational
banks had to contract home-country lending less than similar domestic banks, this relative
stability was due to those multinational banks with more liquid subsidiaries abroad.
4. Some macroeconomic implications
The bank-level evidence provided in the previous sections begs the question whether
countries with more foreign banks also suffered sharper declines in aggregate credit growth
when compared with countries where foreign banks are less prominent. That is, do our micro
findings add up to a macroeconomic impact, or was the deleveraging by foreign banks offset
by faster domestic bank lending? While a complete discussion of such equilibrium effects is
beyond the scope of the paper, this section provides a concise analysis of the relationship
between foreign bank penetration and aggregate lending during the crisis.
For our analysis we combine data on foreign bank ownership (based on Claessens and
Van Horen, 2013), on cross-border funding of banking systems (BIS Locational Statistics),
and macroeconomic data from the IMF’s International Financial Statistics. In Figure 2A we
first plot foreign bank penetration before the crisis, as measured by the percentage of banking
assets owned by foreigners in 2007, against nominal credit growth at the height of the crisis.
The fitted line indicates that countries with higher levels of foreign bank penetration
experienced lower credit growth during the crisis. An example can illustrate this. While
within Emerging Europe foreign bank penetration is high on average, there is substantial
cross-country variation. For instance, in 2007 the foreign share of banking assets in Estonia
was 96 per cent while in Slovenia it was only 24 per cent. Credit growth in Estonia was
affected dramatically by the crisis, falling from 32 per cent in 2007 to 8 per cent in 2008 and
minus 4 per cent in 2009. In contrast, Slovenia – while hardly immune to the crisis – saw
credit growth rates fall from 33 per cent in 2007 (virtually the same as in Estonia) to 17 per
cent in 2008 and a still positive 3 per cent in 2009.
[Insert Figure 2 around here]
Figure 2B shows a similar graph but we now limit the sample to countries where the banking
system was relatively dependent on cross-border borrowing before the crisis. We use the BIS
Locational Statistics to calculate for each country total cross-border borrowing by the

19
banking system as a percentage of GDP. We then select all countries where the average ratio
over 2005-2007 exceeded 30 per cent. When we now plot the relationship between foreign
bank presence and credit growth during the crisis, we find two clusters of countries. On the
left there are mainly Western European countries (and the U.S.) with low foreign bank
ownership and sustained credit growth during the crisis. In these developed countries high
pre-crisis cross-border borrowing was mainly intermediated via domestic banks. In contrast,
on the right we find a cluster of countries, many in Central and Eastern Europe, where foreign
banks were dominant and responsible for the high level of pre-crisis wholesale borrowing. In
these countries, credit growth was low or even negative during the crisis.
Next, Figure 2C focuses on countries where at least 30 per cent of all bank assets are in
foreign hands. As expected, within this group of countries dominated by foreign banks, those
with more pre-crisis cross-border borrowing, often in the form of intra-bank funding from
their parent banks, show lower credit growth during the crisis. In countries with a ratio of
cross-border funding to GDP of less than 10 per cent, credit grew at 9.3 per cent. This
compares to an average of 2.7 per cent in countries above the 10 per cent threshold
(difference statistically significant at the 5% level).
Finally, in Figure 2D we split our country sample into those with above/below median
levels of pre-crisis use of cross-border funding. For each group we then plot the relationship
between foreign bank presence and GDP growth during the crisis. The result is striking. In
both cases we find a negative relationship between foreign bank assets and GDP growth,
mirroring the earlier negative relationship between foreign bank presence and credit growth
in Figure 2A. However, the fitted line for the “heavy” borrowers is significantly below the
fitted line for the “light” borrowers. For a given level of foreign bank presence, we find that
countries that relied heavily on cross-border borrowing before the crisis had a 5.2 percentage
point lower growth (stronger recession) during the crisis compared to countries where the
banking sector relied more on local funding.
In all, this brief analysis shows that countries with higher levels of foreign bank
penetration experienced lower credit growth during the crisis. This was in particular the case
for those banking systems that were both largely owned by foreign banks and relied more on
cross-border wholesale funding. These countries not only experienced sharper credit
contractions but also lower GDP growth.

20
5. Conclusions
We use bank-level data on a large group of multinational bank subsidiaries and stand-alone
domestic banks to compare the stability of their lending during the 2008-09 financial crisis.
Contrary to earlier and more contained crisis episodes, we find that parent banks were not a
significant source of strength to their subsidiaries. As a result, multinational bank subsidiaries
had to slow down lending growth about three times as fast as domestic banks.20
Multinational
bank subsidiaries' access to parent bank and wholesale funding, one of their main competitive
advantages before the crisis, turned out to be a mixed blessing when these alternative funding
sources dried up in the wake of the Lehman Brothers collapse. Indeed, we find that
subsidiaries whose parent banks made greater use of wholesale funding had to reduce credit
growth more during the crisis. These results provide further evidence on the negative impact
that banks' excessive reliance on wholesale funding may have on financial stability.
Moreover, we show that these bank-level results hold for a variety of regions across the world
and that our main findings on the relationship between bank ownership, bank funding
structure, and lending stability are also reflected in a concise country-level analysis.
We also confirm earlier results that show that multinational bank subsidiaries did not
have to reduce their lending when a host country was hit by a banking crisis (while
unaffiliated domestic banks had to do so). Both findings can be understood within a
framework in which multinational banks allocate capital and liquidity to that part of the group
that is hit by a financial shock. When a subsidiary experiences a shock, capital will flow from
the parent to the subsidiary. However, the flipside of the operation of an internal capital
market is that when a banking group is hit at its core, parental support may no longer be
forthcoming and internal funding may even flow from the periphery to the core.
In all, our results indicate that financial integration is more of a double-edged sword than
previously thought. The organisational and financial structure of global banks facilitates the
cross-border transmission of shocks and therefore requires effective coordination and
cooperation between national supervisory authorities to prevent the international spill-over of
financial shocks. That such coordination is not yet well-established was made clear during the
recent crisis, when an ad hoc coordination mechanism, the Vienna Initiative, had to be set up
to ensure a continued commitment of Western banks to their Eastern European subsidiaries.
20 Alfaro and Chen (2012) compare a global dataset of non-bank multinational subsidiaries and domestic firms and conclude
that multinational subsidiaries performed better during the Great Recession. This greater resilience was especially apparent
for establishments with strong production and financial linkages with their parents. This may indicate that overall non-bank
parents were less affected by the financial crisis than banks and thus able to continue to support foreign subsidiaries.

21
Improved supervisory coordination is necessary for two other reasons as well. First,
because bank regulation itself may have significant cross-border spill-overs. Banks that face
tighter restrictions and higher minimum capital requirements at home may loosen their
lending standards in host countries, in particular when faced with lenient supervisory
regimes.21
Better cooperation between home and host authorities can limit such arbitrage
where national regulators are played off against each other.
Second, the alternative to enhanced international cooperation is to force banking groups
to hold more capital and liquidity in each subsidiary and this will prove costly.22
‘Ring-
fencing’ subsidiaries is costly to multinational banks themselves, because the sum of ring-
fenced pools of capital will exceed current capital as banks can no longer exploit international
diversification benefits. At the macroeconomic level there may be costs too as full ring-
fencing would prevent multinational banks from moving scarce capital and liquidity across
borders to the most worthy investment projects.
Ideally, an integrated supervisory regime would continue to allow multinational banks to
operate a network of branches and subsidiaries through which they allocate capital and
liquidity to its most productive use. At the same time, supervisors should be able to
adequately respond to local shocks that hit a banking group and that may have knock-on
effects on other parts of the group. Better supervisory cooperation could include, at a
minimum, a strengthening of the role of colleges of supervisors and (ex ante) burden-sharing
agreements. Moreover, supervisors could cushion the international transmission of financial
shocks by imposing prudential limits on subsidiaries' reliance on foreign wholesale and
parent-bank funding (‘partial’ ring-fencing). This is a process that is already well underway,
with multinational banking groups themselves rebalancing the funding structure of their
subsidiaries towards local sources.
Whether enhanced supervisory cooperation will be able to limit regulatory arbitrage and
reduce the international transmission of financial shocks will largely determine to what extent
multinational banks can be expected to foster local economic growth in the years to come.
Compared to the counterfactual of an autarchic banking system, an integrated banking sector
will boost economic growth if it leads to more –and more efficient– financial intermediation
without undoing these benefits by an excessive increase in economic volatility. Evidence
from before the Great Recession indicates that this net impact of multinational banks on host
21 See Ongena, Popov, and Udell (2012); Barth, Caprio, and Levine (2006); and Acharya, Wachtel, and Walter (2009).
22 See Cerutti, Ilyina, Makarova, and Schmieder (2010) for an analysis of the costs in regards to (partial) ring-fencing of
subsidiaries in Emerging Europe and Van Lelyveld and Spaltro (2011) for the cost associated with burden sharing.

22
countries has been positive: the direct positive effect of financial liberalization on long-run
growth has outweighed the indirect negative effect of a higher likelihood for occasional
financial crises.23
Further research is necessary to analyze how countries that want to benefit
from further banking integration should open up their banking system. A particularly
interesting question is to what extent a country’s exposure to foreign shocks can be
diversified away by allowing entry of banks from a broad variety of home countries.
References
Acharya, V.V. and P. Schnabl (2010), Do global banks spread global imbalances? Asset-
backed commercial paper during the financial crisis of 2007-09, IMF Economic Review
58, 37–73.
Acharya, V.V., P. Wachtel, and I. Walter (2009), International Alignment of Financial Sector
Regulation, In: “Restoring Financial Stability: How to Repair a Failed System”, ed.
V.V. Acharya and M. Richardson, NYU University Stern School of Business, John
Wiley & Sons.
Aiyar, S. (2012), From Financial Crisis to Great Recession: The Role of Globalized Banks,
American Economic Review 102(3), 225–30.
Aghion, P. and J. Tirole (1997), Formal and Real Authority in Organisations, Journal of
Political Economy 105, 1–29.
Alessandrini, P., A.F. Presbitero, and A. Zazzaro (2009), Banks, Distances, and Firms’
Financing Constraints, Review of Finance 13, 261–307.
Alfaro, L., and M.X. Chen (2012), Surviving the Global Financial Crisis: Foreign Ownership
and Establishment Performance, American Economic Journal: Economic Policy 4(3),
30–55.
Arellano, M. and S. Bond (1991), Some Tests of Specification for Panel Data : Monte Carlo
Evidence and an Application to Employment Equations, Review of Economic Studies
58(2), 277–297.
Arellano, M. and O. Bover (1995), Another look at the instrumental variable estimation of
error-components models, Journal of Econometrics 68(1), 29–51.
Barba Navaretti, G., G. Calzolari, A.F. Pozzolo, and M. Levi (2010), Multinational Banking
in Europe: Financial Stability and Regulatory Implications and Lessons from the
Financial Crisis, Economic Policy 25(64), 703–753.
23 Rancière, Tornell, and Westermann (2008); Levchenko, Rancière, and Thoenig (2009); and Bruno and Hauswald (2012).

23
Barth, J.R., G. Caprio, and R. Levine (2006), Rethinking Bank Regulation: Till Angels
Govern, Cambridge: Cambridge University Press.
Beck, T., V. Ioannidou, and L. Schäfer (2012), Foreigners vs. Natives: Bank Lending
Technologies and Loan Pricing, Tilburg University, Center for Economic Research
Discussion Paper 2012-055.
Beltratti, A. and R.M. Stulz (2012), The credit crisis around the globe: Why did some banks
perform better? Journal of Financial Economics, 105(1), 1–17.
Berger, A.N. and R. DeYoung (2001), The effects of geographic expansion on bank
efficiency, Journal of Financial Services Research 19, 163–184.
Berger, A.N. and G.F. Udell (1995), Relationship lending and lines of credit in small business
finance, Journal of Business 68, 351-382.
Berger, A.N. and G.F. Udell (2006), A more complete conceptual framework for SME
finance, Journal of Banking & Finance 11, 2945-2966.
Berrospide, J., L. Black and W. Keeton (2011), The Cross-Market Spillover of Economic
Shocks through Multi-Market Banks, Federal Reserve Board Working Paper.
Black, S.E. and P.E. Strahan (2002), Entrepreneurship and Bank Credit Availability, Journal
of Finance 57(6), 2807–2833.
Boyd, J.H., R. Levine, and B.D. Smith (2001), The Impact of Inflation on Financial Sector
Performance, Journal of Monetary Economics 47(2), 221–248.
Bruno, V. and R. Hauswald (2012), The Real Effects of Foreign Banks, Paolo Baffi Centre
Research Paper No. 2009-50.
Campello, M. (2002), Internal Capital Markets in Financial Conglomerates: Evidence from
Small Bank Responses to Monetary Policy, Journal of Finance 57(6), 2773–2805.
Carlin, W., A. Charlton, and C. Mayer (2006), Capital Markets, Ownership and Distance,
Centre for Economic Performance Discussion Paper No. 744, CEPR, London.
Cerutti, E., A. Ilyina, Y. Makarova, and C. Schmieder (2010), Bankers without Borders?
Implications of Ring-Fencing for European Cross-Border Banks, IMF Working Paper
WP/10/247, International Monetary Fund, Washington D.C.
Cetorelli, N. and L.S. Goldberg (2011), Global Banks and International Shock Transmission:
Evidence from the Crisis, IMF Economic Review, 59(1), 41–76.
Cetorelli, N. and L.S. Goldberg (2012a), Liquidity management of U.S. global banks:
Internal capital markets in the great recession, Journal of International Economics,
forthcoming.
24
Cetorelli, N. and L.S. Goldberg (2012b), Follow the Money: Quantifying Domestic Effects of
Foreign Bank Shocks in the Great Recession, American Economic Review 102(3), 213–
218.
Chava, S. and A. Purnanandam (2011), The effect of banking crisis on bank-dependent
borrowers. Journal of Financial Economics 99(1), 116–135.
Cihák, M. and T. Poghosyan (2009), Distress in European banks: An analysis based on a new
data set, IMF Working Paper No. WP/09/9, International Monetary Fund, Washington
D.C.
Claessens, S. and N. Van Horen (2013), Foreign banks: Trends and Impact, Journal of
Money, Credit, and Banking, forthcoming.
Cornett, M. M., J.J. McNutt, and P.E. Strahan (2011), Liquidity risk management and credit
supply in the financial crisis, Journal of Financial Economics 101(2), 297–312.
Cremers, M., R. Huang, and Z. Sautner (2011), Internal Capital Markets and Corporate
Politics in a Banking Group, Review of Financial Studies 24(2), 358–401.
De Haas, R., Y. Korniyenko, E. Loukoianova, A. Pivovarsky (2012), Foreign banks and the
Vienna Initiative: turning sinners into saints, EBRD Working Paper 143, London.
De Haas, R. and I. Naaborg (2006), Foreign banks in transition countries: To whom do they
lend and how are they financed? Financial Markets, Institutions & Instruments 15,
159-199.
De Haas, R. and N. Van Horen (2013), Running for the Exit? International bank lending
during a financial crisis, Review of Financial Studies, 26(1), 244-285.
De Haas, R. and I. Van Lelyveld (2006), Foreign banks and credit stability in Central and
Eastern Europe. A panel data analysis, Journal of Banking and Finance 30(7), 1927–
1952.
De Haas, R. and I. Van Lelyveld (2010), Internal Capital Markets and Lending by
Multinational Bank Subsidiaries, Journal of Financial Intermediation 19(1), 1–25.
Degryse, H., M.A. Elahi, and M.F. Penas (2012), Determinants of Banking System Fragility:
A Regional Perspective, CEPR Discussion Paper 8858.
Degryse, H., O. Havrylchyk, E. Jurzyk and S. Kozak (2011), Foreign bank entry, credit
allocation, and lending rates in emerging markets: empirical evidence from Poland,
Journal of Banking and Finance, 36(11), 2949-2959.
Detragiache, E., T. Tressel and P. Gupta (2008), Foreign Banks in Poor Countries: Theory
and Evidence, Journal of Finance, 63(5), 2123–21260.

25
Devereux, M. and J. Yetman (2010), Leverage constraints and the international transmission
of shocks, Journal of Money, Credit, and Banking 41 (s1), 71–105.
Düwel, C. and R. Frey (2012), Competition for internal funds within multinational banks:
foreign affiliate lending in the crisis, Working Paper No. 19/2012, Deutsche
Bundesbank, Frankfurt.
Feldman, R. and J. Schmidt (2001), Increased Use of Uninsured Deposits: Implications for
Market Discipline, Federal Reserve Bank of Minneapolis-FED Gazette (March), 18–
19.
Fungácová, Z., R. Herrala and L. Weill (2011), The Influence of Bank Ownership on Credit
Supply: Evidence from the Recent Financial Crisis, mimeo Institute for Economies in
Transition.
Galindo, A.J., A. Izquierdo, and L. Rojas-Suarez (2010), Financial Integration and Foreign
Banks in Latin America: Do They Amplify External Financial Shocks ?, IDB Working
Paper 116, Inter-American Development Bank, Washington D.C.
Giannetti, M. and Y. Yafeh (2012), Do Cultural Differences Between Contracting Parties
Matter? Evidence from Syndicated Bank Loans, Management Science 58, 365–83.
Hausman, J.A. and W.E. Taylor (1981) Panel Data and Unobservable Individual Effects,
Econometrica 49(6), 1377–1398.
Holmström, B. and J. Tirole (1997), Financial Intermediation, Loanable Funds and the Real
Sector, Quarterly Journal of Economics 112, 663–691.
Huang, R. and L. Ratnovski (2011), The Dark Side of Bank Wholesale Funding, Journal of
Financial Intermediation 20(2), 248-263.
Imai, M. and S. Takarabe (2011), Bank integration and transmission of financial shocks:
Evidence from Japan, American Economic Journal: Macroeconomics 3, 155–183.
Ivashina, V., and D.S. Scharfstein (2010), Bank Lending During the Financial Crisis of 2008,
Journal of Financial Economics 97, 319–38.
Iyer, R., S. Lopes, J.-L. Peydró, and A. Schoar (2010), The Inter-Bank Liquidity Crunch and
the Firm Credit Crunch: Evidence from the 2007–2009 Crisis, mimeo.
Jimenéz, G., S. Ongena, J.L. Peydró, and J. Saurina (2012), Credit Supply versus Demand:
Bank and Firm Balance-Sheet Channels in Good and Crisis Times, Discussion Paper
2012-005, Tilburg University, Center for Economic Research.
Kalemli-Ozcan, S., E. Papaioannou, and F. Perri (2012), Global banks and crisis
transmission, Journal of International Economics, forthcoming.

26
Kalemli-Ozcan, S., E. Papaioannou, and J.L. Peydró (2012), Financial regulation, financial
globalization, and the synchronization of economic activity, Journal of Finance,
forthcoming.
Kamil, H. and K. Rai (2010), The Global Credit Crunch and Foreign Banks’ lending to EMs:
Why did Latin America fare better? IMF Working Paper WP/10/102, International
Monetary Fund, Washington D.C.
Kollman, R., Z. Enders and G. Muller (2011), Global banking and international business
cycles. European Economic Review 55, 407–426.
Laeven, L. and F. Valencia (2008), Systemic Banking Crises: A New Database, IMF
Working Paper WP/08/224, International Monetary Fund, Washington D.C.
Landier, A., V. Nair, and J. Wulf (2011), Trade-offs in Staying Close: Corporate Decision
Making and Geographic Dispersion, Review of Financial Studies 22(3), 1119-1148.
Levchenko, A.A., R. Rancière, and M. Thoenig (2009), Growth and risk at the industry level:
The real effects of financial liberalization, Journal of Development Economics 89(2),
210-222.
Loutskina, E. and P.E. Strahan (2011), Financial Integration, Housing and Economic
Volatility. mimeo.
Martinez Peria, M.S. and A. Mody (2004), How Foreign Participation and Market
Concentration Impact Bank Spreads: Evidence from Latin America, Journal of Money,
Credit and Banking 36(3), pp. 511–537.
Micco, A., U. Panizza, and M. Yañez (2007), Bank ownership and performance. Does
politics matter?, Journal of Banking & Finance, 31(1), 219-241.
Morgan, D., B. Rime, and P. Strahan (2004), Bank Integration and State Business Cycles,
Quarterly Journal of Economics 119(4), 1555–1585.
Nickell, S. (1981), Biases in Dynamic Models with Fixed Effects, Econometrica 49(6),
1417–1426.
Ongena, S., A. Popov, and G.F. Udell (2012), When the Cat’s Away the Mice Will Play’:
Does Regulation At Home Affect Bank Risk Taking Abroad? Journal of Financial
Economics, forthcoming.
Peek, J. and E.S. Rosengren (1997), The International Transmission of Financial Shocks: The
Case of Japan, American Economic Review 87(4), 495–505.
Peek, J., and E.S. Rosengren (2000), Collateral Damage: Effects of the Japanese Bank Crisis
on the United States, American Economic Review 90(1), 30–45.

27
Petersen, M.A. and R.G. Rajan (2002), Does distance still matter? The information revolution
in small business lending, Journal of Finance 57, 2533-2570.
Popov, A. and G. Udell (2012), Cross-Border Banking, Credit Access, and the Financial
Crisis, Journal of International Economics 87(1), 147–161.
Presbitero, A.F., G.F. Udell, and A. Zazzaro (2012), The Home Bias and the Credit Crunch:
A Regional Perspective, mimeo.
Puri, M., J. Rocholl, and S. Steffen (2011), Global retail lending in the aftermath of the US
financial crisis: Distinguishing between demand and supply effects, Journal of
Financial Economics 100, 556-578.
Raddatz, C. (2010), When the Rivers Run Dry. Liquidity and the Use of Wholesale Funds in
the Transmission of the U.S. Subprime Crisis, Policy Research Working Paper No.
5203, World Bank, Washington D.C.
Rajan, R.G., H. Servaes, and L. Zingales (2000), The Cost of Diversity: The Diversification
Discount and Inefficient Investments, Journal of Finance 55, 35–80.
Rancière, R., A. Tornell, and F. Westermann (2008), Systemic Crises and Growth, The
Quarterly Journal of Economics 123(1), 359-406.
Roodman, D. (2009), A note on the theme of too many instruments, Oxford Bulletin of
Economics and Statistics 71 (1), 135–158.
Scharfstein, D.S. and J.C. Stein (2000), The Dark Side of Internal Capital Markets:
Divisional Rent-Seeking and Inefficient Investment, Journal of Finance 55, 2537–64.
Schnabl, P. (2012), Financial Globalization and the Transmission of Bank Liquidity Shocks:
Evidence from an Emerging Market, Journal of Finance 67(3), 897-932.
Song, F. and A.V. Thakor (2007), Relationship Banking, Fragility, and the Asset-Liability
Matching Problem, Review of Financial Studies 20(6), 2129–2177.
Stein, J.C. (2002), Information Production and Capital Allocation: Decentralized versus
Hierarchical Firms, Journal of Finance LVII:1891–921.
Van Lelyveld, I. and M. Spaltro (2011), Coordinating Bank Failure Costs and Financial
Stability, DNB Working Paper 306, De Nederlandsche Bank, Amsterdam.
Yorulmazer, T. and P. Goldsmith-Pinkham (2010), Liquidity, Bank Runs, and Bailouts:
Spillover Effects During the Northern Rock Episode, Journal of Financial Services
Research 37(2), 83–98.
Tables and Figures
Figure 1
Geographical location of multinational bank subsidiariesThis figure shows the geographical distribution of the 199 multinational bank subsidiaries in our dataset.These include all subsidiaries for which we have at least three consecutive years of dataduring the 1992-2009 period. Darker colours indicate a larger number of subsidiaries in a country. Source: BankScopeand banks’ websites.

29
Figure 2
Multinational banking and lending stability - Aggregate evidenceThe four panes in this figure show country-level statistics on the relationship between a country's pre-crisis financial structure and credit and economic growth during the crisis. Pane A and B plotforeign bank penetration in 2007 against aggregate credit growth in 2009. Pane A shows all 82 countries for which data are available whereas Pane B shows those 36 countries where the averageratio of the banking sector's cross-border funding to GDP over the period 2005-07 was above the median. Pane C plots total cross-border borrowing by the banking sector over 2005-07 against
credit growth in 2009. Pane D plots foreign bank penetration in 2007 against GDP growth in 2009 and distinguishes between countries where banking systems had a high (low) level of pre-crisiscross-border funding (indicated by blue (red) squares). Sources: International Monetary Fund, Bank for International Settlements, and Claessens and Van Horen (2012).

1992-97 1998 1999 2000-06 2007 2008 2009Whole
period
Δ Gross Loans % Subsidiary 13.5 9.5 11.4 12.5 19.2 0.9 10.5 11.9
Domestic 12.7 19.8 10.1 14.6 22.8 4.0 18.7 14.3
All 12.9 17.8 10.3 13.9 21.2 3.1 15.0 13.5
Δ Deposits % Subsidiary 19.8 21.6 14.0 10.6 15.3 5.1 16.4 12.1
Domestic 13.7 18.9 9.6 15.3 20.4 2.7 23.9 14.7
All 14.7 19.4 10.4 13.6 18.2 3.7 20.9 13.9
Correlation between deposit growth and loan growth
Pre-crisis Crisis
Subsidiary 0.43 0.39
Domestic 0.54 0.63
Table 1
Credit and deposit growth by bank ownership
This table compares, for various sub-periods of our 1992-2009 sample period, the average annual creditand deposit growth of the multinational bank subsidiaries and the stand-alone domestic banks in ourdataset. The row ’All’ shows the averages over all banks independent of their ownership structure. The
coefficients at the bottom of the table show the correlation between deposit growth and credit growth forboth types of banks and for the pre-crisis and the crisis (2008-09) period. Table A1 in the Appendixcontains all variable definitions and data sources.
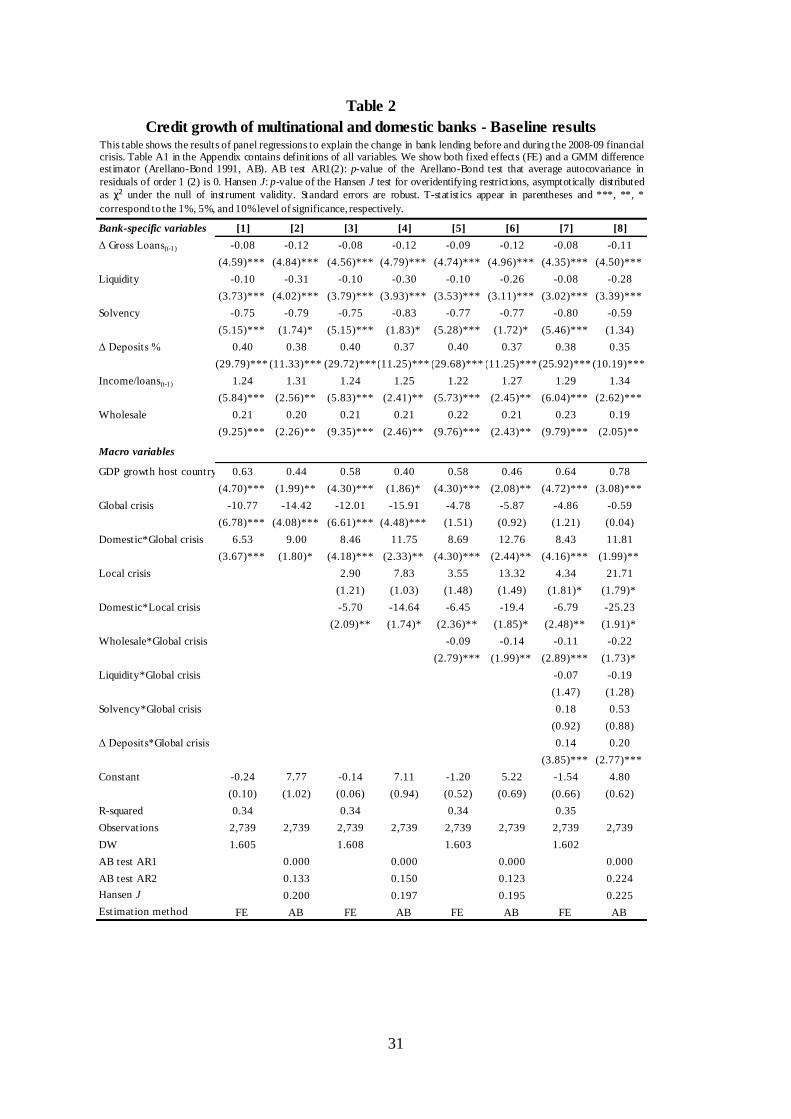
31
Bank-specific variables [1] [2] [3] [4] [5] [6] [7] [8]
Δ Gross Loans(t-1) -0.08 -0.12 -0.08 -0.12 -0.09 -0.12 -0.08 -0.11
(4.59)*** (4.84)*** (4.56)*** (4.79)*** (4.74)*** (4.96)*** (4.35)*** (4.50)***
Liquidity -0.10 -0.31 -0.10 -0.30 -0.10 -0.26 -0.08 -0.28
(3.73)*** (4.02)*** (3.79)*** (3.93)*** (3.53)*** (3.11)*** (3.02)*** (3.39)***
Solvency -0.75 -0.79 -0.75 -0.83 -0.77 -0.77 -0.80 -0.59
(5.15)*** (1.74)* (5.15)*** (1.83)* (5.28)*** (1.72)* (5.46)*** (1.34)
Δ Deposits % 0.40 0.38 0.40 0.37 0.40 0.37 0.38 0.35
(29.79)*** (11.33)*** (29.72)***(11.25)*** (29.68)*** (11.25)*** (25.92)*** (10.19)***
Income/loans(t-1) 1.24 1.31 1.24 1.25 1.22 1.27 1.29 1.34
(5.84)*** (2.56)** (5.83)*** (2.41)** (5.73)*** (2.45)** (6.04)*** (2.62)***
Wholesale 0.21 0.20 0.21 0.21 0.22 0.21 0.23 0.19
(9.25)*** (2.26)** (9.35)*** (2.46)** (9.76)*** (2.43)** (9.79)*** (2.05)**
Macro variables
GDP growth host country 0.63 0.44 0.58 0.40 0.58 0.46 0.64 0.78
(4.70)*** (1.99)** (4.30)*** (1.86)* (4.30)*** (2.08)** (4.72)*** (3.08)***
Global crisis -10.77 -14.42 -12.01 -15.91 -4.78 -5.87 -4.86 -0.59
(6.78)*** (4.08)*** (6.61)*** (4.48)*** (1.51) (0.92) (1.21) (0.04)
Domestic*Global crisis 6.53 9.00 8.46 11.75 8.69 12.76 8.43 11.81
(3.67)*** (1.80)* (4.18)*** (2.33)** (4.30)*** (2.44)** (4.16)*** (1.99)**
Local crisis 2.90 7.83 3.55 13.32 4.34 21.71
(1.21) (1.03) (1.48) (1.49) (1.81)* (1.79)*
Domestic*Local crisis -5.70 -14.64 -6.45 -19.4 -6.79 -25.23
(2.09)** (1.74)* (2.36)** (1.85)* (2.48)** (1.91)*
Wholesale*Global crisis -0.09 -0.14 -0.11 -0.22
(2.79)*** (1.99)** (2.89)*** (1.73)*
Liquidity*Global crisis -0.07 -0.19
(1.47) (1.28)
Solvency*Global crisis 0.18 0.53
(0.92) (0.88)
Δ Deposits*Global crisis 0.14 0.20
(3.85)*** (2.77)***
Constant -0.24 7.77 -0.14 7.11 -1.20 5.22 -1.54 4.80
(0.10) (1.02) (0.06) (0.94) (0.52) (0.69) (0.66) (0.62)
R-squared 0.34 0.34 0.34 0.35
Observations 2,739 2,739 2,739 2,739 2,739 2,739 2,739 2,739
DW 1.605 1.608 1.603 1.602
AB test AR1 0.000 0.000 0.000 0.000
AB test AR2 0.133 0.150 0.123 0.224
Hansen J 0.200 0.197 0.195 0.225
Estimation method FE AB FE AB FE AB FE AB
Table 2
Credit growth of multinational and domestic banks - Baseline resultsThis table shows the results of panel regressions to explain the change in bank lending before and during the 2008-09 financialcrisis. Table A1 in the Appendix contains definitions of all variables. We show both fixed effects (FE) and a GMM differenceestimator (Arellano-Bond 1991, AB). AB test AR1(2): p-value of the Arellano-Bond test that average autocovariance in
residuals of order 1 (2) is 0. Hansen J: p-value of the Hansen J test for overidentifying restrictions, asymptotically distributed
as χ2 under the null of instrument validity. Standard errors are robust. T-statistics appear in parentheses and ***, **, *
correspond to the 1%, 5%, and 10%level of significance, respectively.

32
[1] [2] [3] [4] [5] [6] [7]
Δ Gross Loans(t-1) -0.21 -0.20 -0.22 -0.19 -0.18 -0.19 -0.21
(5.48)*** (4.77)*** (5.37)*** (4.38)*** (3.90)*** (4.17)*** (4.81)***
GDP growth host country 0.54 1.34 0.61 0.66 0.92 0.43 0.28
(1.43) (2.81)*** (1.49) (1.46) (1.91)* (1.04) (0.71)
Global crisis -13.37 -47.89 31.34 -26.22 -48.97 -18.04 -11.92
(1.74)* (2.76)*** (1.47) (5.82)*** (5.00)*** (1.37) (3.35)***
Liquidity -0.03 -0.03 -0.02 -0.08 -0.14 -0.08 -0.11
(0.38) (0.28) (0.18) (1.23) (1.75)* (1.20) (1.75)*
Solvency -0.86 -0.94 -0.92 -1.96 -0.74 -1.56 -1.62
(0.81) (0.84) (0.87) (1.58) (0.67) (1.31) (1.32)
Δ Deposits 0.24 0.23 0.23 0.18 0.19 0.20 0.19
(6.43)*** (6.39)*** (6.36)*** (5.54)*** (5.45)*** (5.81)*** (4.68)***
Income/loans(t-1) 1.88 2.11 2.30 2.02 2.24 1.99 2.21
(3.33)*** (3.32)*** (3.56)*** (3.32)*** (3.62)*** (3.60)*** (2.95)***
Wholesale 0.49 0.50 0.52 0.18 0.23 0.21 0.24
(3.61)*** (3.62)*** (3.57)*** (1.32) (1.73)* (1.53) (1.74)*
Group liquidity 0.01 -0.17
(0.14) (2.90)***
Group liquidity*Global crisis -0.01 0.37
(0.06) (2.90)***
Group solvency 0.08 -1.05
(0.04) (1.66)*
Group solvency*Global crisis 7.20 5.97
(1.99)** (3.28)***
Group wholesale -0.19 0.13
(0.96) (1.66)*
Group wholesale*Global crisis -0.50 0.04
(2.07)** (0.26)
Other subs*Local crisis -11.30
(1.91)*
Constant -17.40 -20.75 -4.80 19.41 7.06 -0.57 9.30
(1.41) (1.49) (0.28) (1.93)* (0.65) (0.05) (0.84)
Observations 734 734 734 751 755 749 687
AB test AR1 0.001 0.000 0.002 0.006 0.001 0.000 0.000
AB test AR2 0.173 0.301 0.434 0.430 0.858 0.419 0.342
Hansen J 0.886 0.893 0.836 0.908 0.891 0.857 0.808
Estimation method AB AB AB AB AB AB AB
Table 3
Group characteristics and multinational bank lending
Group: Parent bank Group: O ther subsidiaries
This table shows the results of panel regressions to estimate the relationship between shocks to parent banksand other subsidiaries to lending by multinational bank subsidiaries. The 'Group' variables refer tocharacteristics of the parent bank (other subsidiaries) in columns 1-3 (4-7). Table A1 in the Appendix
contains definitions of all variables. Results are based on a GMM difference estimator (Arellano-Bond 1991,AB). AB test AR1(2): p-value of the Arellano-Bond test that average autocovariance in residuals of order 1(2) is 0. Hansen J: p-value of the Hansen J test for overidentifying restrictions, which is asymptotically
distributed as χ2 under the null of instrument validity. Standard errors are robust. T-statistics appear in
parentheses and ***, **, * correspond to the 1%,5%, and 10% level of significance, respectively.

33
Bank-level variables [1] [2] [3] [4] [5]
Δ Gross Loans(t-1) -0.20 -0.18 -0.19 -0.19 -0.19
(5.03)*** (4.20)*** (5.00)*** (4.58)*** (4.86)***
Liquidity -0.15 -0.15 -0.18 -0.13 -0.16
(2.09)** (1.93)* (2.44)** (1.69)* (2.07)**
Solvency -1.22 -0.99 -1.46 -1.28 -1.36
(1.04) (0.87) (1.33) (1.19) (1.27)
Δ Deposits 0.21 0.22 0.21 0.21 0.22
(6.01)*** (5.69)*** (6.31)*** (5.95)*** (6.25)***
Income/loans(t-1) 2.03 1.82 2.06 2.09 2.12
(3.20)*** (2.84)*** (2.84)*** (3.17)*** (2.96)***
Wholesale 0.21 0.13 0.18 0.24 0.22
(1.75)* (1.06) (1.38) (1.87)* (1.73)*
Macro variables
GDP growth host country 0.29 0.12 0.10 0.29 0.17
(0.68) (0.28) (0.22) (0.67) (0.40)
Global crisis -12.70 -12.18 -43.05 -16.63 -38.81
(4.30)*** (4.27)*** (3.67)*** (6.11)*** (3.33)***
Size sub to group 0.02
(0.03)
Size sub to group*Global crisis -0.25
(0.47)
Size sub to country 0.14
(1.39)
Size sub to country*Global crisis -0.06
(0.14)
Distance (log) -39.1 -43.94
(1.49) (1.35)
Distance (log)*Global crisis 3.96 3.13
(2.51)** (1.93)*
Shared language*Global crisis 10.15 7.01
(2.84)*** (1.76)*
Constant 7.41 10.18 308.1 4.95 339.47
(0.77) (1.02) (1.53) (0.53) (1.37)
Observations 767 700 767 767 767
AB test AR1 0.001 0.010 0.000 0.000 0.000
AB test AR2 0.362 0.231 0.373 0.409 0.356
Hansen J 0.821 0.837 0.789 0.857 0.918
Estimation method AB AB AB AB AB
Credit growth of multinational bank subsidiaries
Table 4
Subsidiary heterogeneityThis table shows the results of panel regressions to explain the change in bank lending bydifferent types of multinational bank subsidiaries before and during the 2008-09 financialcrisis. Table A1 in the Appendix contains definitions of all variables. Results are based
on a GMM difference estimator (Arellano-Bond 1991, AB). AB test AR1(2): p-value ofthe Arellano-Bond test that average autocovariance in residuals of order 1 (2) is 0.Hansen J: p-value of the Hansen J test for overidentifying restrictions, which is
asymptotically distributed as χ2 under the null of instrument validity. Standard errors are
robust. T-statistics appear in parentheses and ***, **, * correspond to the 1%, 5%, and10% level of significance, respectively.
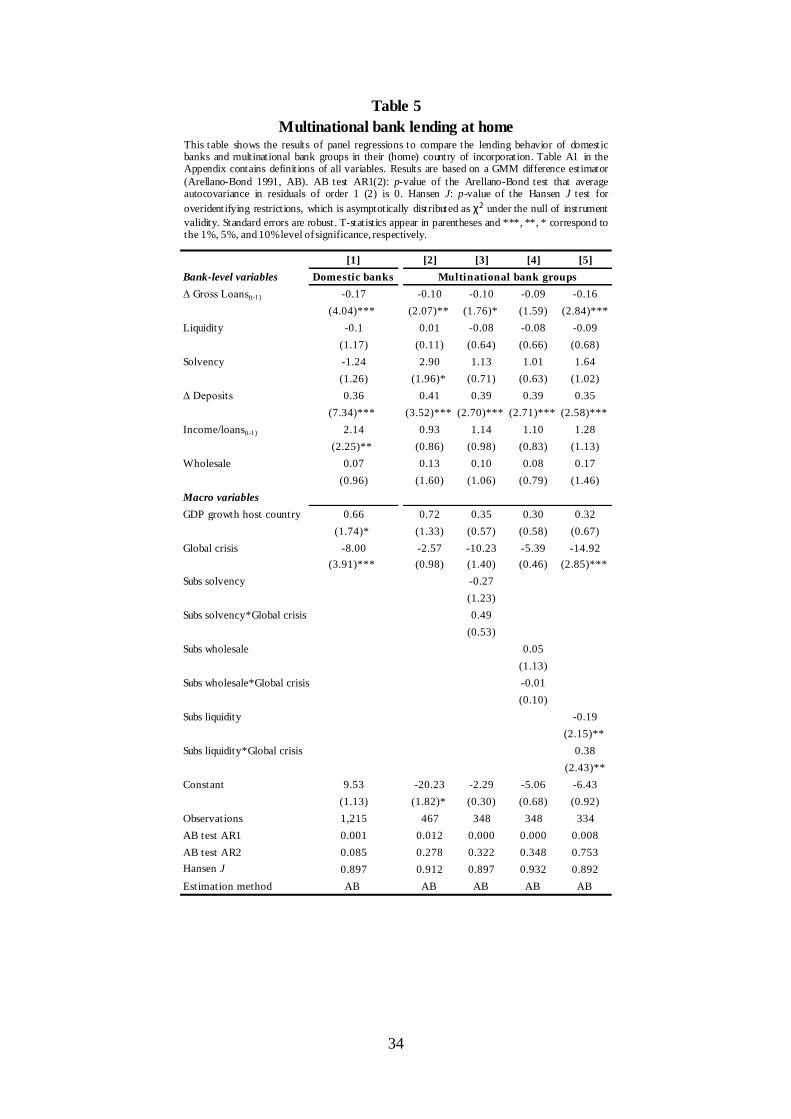
34
[1] [2] [3] [4] [5]
Bank-level variables Domestic banks
Δ Gross Loans(t-1) -0.17 -0.10 -0.10 -0.09 -0.16
(4.04)*** (2.07)** (1.76)* (1.59) (2.84)***
Liquidity -0.1 0.01 -0.08 -0.08 -0.09
(1.17) (0.11) (0.64) (0.66) (0.68)
Solvency -1.24 2.90 1.13 1.01 1.64
(1.26) (1.96)* (0.71) (0.63) (1.02)
Δ Deposits 0.36 0.41 0.39 0.39 0.35
(7.34)*** (3.52)*** (2.70)*** (2.71)*** (2.58)***
Income/loans(t-1) 2.14 0.93 1.14 1.10 1.28
(2.25)** (0.86) (0.98) (0.83) (1.13)
Wholesale 0.07 0.13 0.10 0.08 0.17
(0.96) (1.60) (1.06) (0.79) (1.46)
Macro variables
GDP growth host country 0.66 0.72 0.35 0.30 0.32
(1.74)* (1.33) (0.57) (0.58) (0.67)
Global crisis -8.00 -2.57 -10.23 -5.39 -14.92
(3.91)*** (0.98) (1.40) (0.46) (2.85)***
Subs solvency -0.27
(1.23)
Subs solvency*Global crisis 0.49
(0.53)
Subs wholesale 0.05
(1.13)
Subs wholesale*Global crisis -0.01
(0.10)
Subs liquidity -0.19
(2.15)**
Subs liquidity*Global crisis 0.38
(2.43)**
Constant 9.53 -20.23 -2.29 -5.06 -6.43
(1.13) (1.82)* (0.30) (0.68) (0.92)
Observations 1,215 467 348 348 334
AB test AR1 0.001 0.012 0.000 0.000 0.008
AB test AR2 0.085 0.278 0.322 0.348 0.753
Hansen J 0.897 0.912 0.897 0.932 0.892
Estimation method AB AB AB AB AB
Table 5
Multinational bank lending at home
Multinational bank groups
This table shows the results of panel regressions to compare the lending behavior of domesticbanks and multinational bank groups in their (home) country of incorporation. Table A1 in theAppendix contains definitions of all variables. Results are based on a GMM difference estimator
(Arellano-Bond 1991, AB). AB test AR1(2): p-value of the Arellano-Bond test that averageautocovariance in residuals of order 1 (2) is 0. Hansen J: p-value of the Hansen J test for
overidentifying restrictions, which is asymptotically distributed as χ2 under the null of instrument
validity. Standard errors are robust . T-statistics appear in parentheses and ***, **, * correspond tothe 1%, 5%, and 10%level of significance, respectively.

35
Variable Definition Data source Unit
Loan growth Growth of (net loans plus loan loss reserves) BankScope %
Deposit growth Percentage growth of total deposits BankScope %
Solvency Equity/Total Assets BankScope %
Liquidity Liquid assets/customer deposits BankScope %
Income to loans Net current income t/total loans (t - 1) BankScope %
Profitability Return on average equity BankScope %
Wholesale Net loans as a perc. of cust. funding BankScope %
Size sub to group Total assets subsidiary/total assets parent bank BankScope %
Size sub to country Total assets subsidiary/total assets banking sector host
country
BankScope; IFS %
Distance Distance in km between parent bank and subsidiary
according to the great circle distance formula (in log)
CIA World Factbook (2005)Log km.
Shared language Dummy that is '1' if a language is spoken by at least 9 per
cent of the population in both countries
GeoDist at www.cepii.fr 0/1
GDP growth Yearly change in GDP in host country IMF-IFS %
Inflation Annual inflation rate in host country IMF-IFS %
Global crisis Yearly dummy. '1' in 2008 and 2009 - 0/1
Local crisis Yearly dummy. '1' in case of banking crisis Laeven and Valencia
(2012); Carstens et al.
(2004)
0/1
Table A1
Variable definitions and data sourcesThis table presents variable definitions and data sources of thevariables used in the paper. BankScope is Bureau van Dijk'sdatabase of bank balance sheet and income statement data. IFS are the International Financial Statistics provided by theInternational Monetary Fund.

36
Variable Bank type Mean Median Mean Median O bs. St. dev. Min Max
Loan growth Parent 12.02 10.24 7.71 4.19 536 13.88 -37.22 67.74
Subsidiary 13.74 11.35 5.64 4.01 1,112 20.38 -65.41 72.07
Domestic 14.96 13.16 9.31 6.92 2,335 19.51 -73.16 74.09
Deposit growth Parent 11.89 10.43 5.57 3.04 536 18.13 -50.01 120.37
Subsidiary 11.71 9.70 9.64 6.56 1,083 28.73 -72.63 186.92
Domestic 14.95 12.37 10.87 6.80 2,330 23.34 -64.67 195.94
Solvency Parent 5.13 4.67 5.28 5.02 536 2.59 0.86 21.68
Subsidiary 8.35 7.36 8.41 7.90 1,117 5.29 0.35 88.54
Domestic 9.13 7.71 9.44 8.03 2,337 5.95 0.50 68.74
Liquidity Parent 36.00 33.92 37.83 30.82 536 18.92 0.88 98.54
Subsidiary 24.55 19.06 22.40 17.81 1,051 21.84 0.01 95.12
Domestic 27.88 23.34 25.21 21.02 2,329 19.78 0.03 99.97
Income to loans Parent 1.77 1.38 0.78 0.71 536 1.81 -2.75 17.16
Subsidiary 1.94 1.22 2.02 1.43 1,117 2.45 -11.79 23.07
Domestic 2.25 1.62 1.79 1.25 2,337 2.94 -11.48 38.41
Profitability Parent 13.72 14.48 5.46 6.29 536 9.09 -29.78 45.92
Subsidiary 13.71 13.03 12.52 11.26 1,117 10.48 -29.87 48.42
Domestic 11.47 10.61 10.11 9.73 2,337 9.58 -29.83 48.55
Wholesale Parent 77.86 71.37 89.38 82.93 536 28.59 29.42 192.5
Subsidiary 70.30 67.85 80.42 81.89 1,103 27.88 10.63 200.14
Domestic 73.21 71.95 78.66 77.23 2,318 26.74 10.59 193.85
GDP growth 3.54 3.30 0.18 0.40 3,982 2.84 -6.40 18.30
Inflation 3.79 2.40 4.47 3.50 3,987 2.50 -3.90 100.01
Local crisis 0.05 0.00 0.42 0.00 3,990 0.30 0.00 1.00
1992-2007 2008-2009 1992-2009
Table A2
Descriptive statisticsThis table presents basic descriptive statistics, by bank type and before versus during the global crisis, of the variables used inthe paper.

37
Bank group name Home
country
Number of
subsidiaries
Host countries
ABN AMRO Holding nl 2 br, us
Allied Irish Banks ie 2 pl, gb
Banca Monte dei Paschi di Siena it 2 be, fr
Banco Bilbao Vizcaya Argentaria es 12 ar, cl, co, mx, pe, pt, us, ve
Banco do Brasil br 1 at
Banco Popular Espanol es 3 fr, pt, us
Banco Santander es 13 br, cl, de, mx, pt, gb, us, ve
Bank of America us 2 br, gb
Bank of Nova Scotia ca 8 cl, sv, jm, mx, pe, gb, us
Barclays Bank gb 2 es, za
Bayerische Hypo-und Vereinsbank de 9 hr, cz, hu, pl, ru, at
Bayerische Landesbank de 1 hu
BNP Paribas fr 3 it , us
Citigroup us 5 br, ca, my, mx, pl
Commerzbank de 3 nl, pl, sk
Crédit Agricole Group fr 3 de, it
Danske Bank dk 1 no
Deutsche Bank de 6 au, it , es, us
Deutsche Zentral-Genossenschaftsbank de 1 ie
Dexia be 9 fr, de, it , nl, es
Erste Group Bank at 5 hr, cz, hu, ro, sk
FIA Card Services us 2 ca, gb
Fortis Bank be 1 nl
HBOS gb 1 ie
HSBC gb 12 br, ca, fr, de, hk, ind, my, mx, sa, us
ING Bank nl 5 au, be, ca, fr, pl
Intesa Sanpaolo it 7 hr, fr, hu, ie, pe, sk
Itau Unibanco br 1 pt
KBC Bank be 5 cz, de, hu, ie, pl
Millennium bcp-Banco Comercial Portugues pt 6 fr, gr, mz, pl, us
Mitsubishi UJF jp 3 us
National Australia Bank au 2 nz, gb
National Bank of Greece gr 6 bg, ca, cy, us, ro, mk
Nordea Bank se 5 dk, fi, no, ru
Rabobank nl 1 ie
Raiffeisen Zentralbank Oesterreich at 12 bg, hr, cz, hu, pl, ru, si, ro, sk, al, ba, rs
Royal Bank of Canada ca 2 gb, us
Royal Bank of Scotland gb 3 ie, us
SanPaolo IMI it 1 si
Skandinaviska Enskilda Banken se 5 dk, ee, de, lv, lt
Société Générale fr 4 au, ca, cz, de
Standard Chartered gb 5 hk, ke, kr, my, th
Swedbank se 3 ee, lv, lt
Toronto Dominion Bank ca 3 au, nl, us
UBS ch 2 gb, us
UniCredit it 10 bg, hr, cz, de, hu, ie, pl, ru
WestLB de 6 be, br, fr, ie, pl, ru
Westdeutsche Genossenschafts-Zentralbank de 1 ie
Table A3
Overview of multinational bank subsidiaries
The average number of subs: 4.31. Country names are according to ISO 3166-2 classification.

38
Bank-specific variables [1] [2] [3] [4] [5] [6] [7] [8] [9] [10]
Δ Gross Loans(t-1) % -0.12 -0.12 -0.12 -0.11 -0.12 -0.12 -0.11 -0.12 -0.13 -0.14
(4.84)*** (4.96)*** (4.46)*** (4.59)*** (4.54)*** (4.73)*** (4.43)*** (4.55)*** (5.12)*** (5.38)***
Liquidity -0.31 -0.26 -0.30 -0.27 -0.14 -0.11 -0.15 -0.11 -0.15 -0.10
(4.02)*** (3.11)*** (3.88)*** (3.53)*** (1.94)* (1.61) (1.83)* (1.43) (1.75)* (1.28)
Solvency -0.79 -0.77 -0.68 -0.60 -1.54 -1.6 -1.52 -1.5 -1.61 -1.53
(1.74)* (1.72)* (1.19) (1.11) (3.53)*** (3.70)*** (3.48)*** (3.56)*** (3.78)*** (3.85)***
Δ Deposits % 0.38 0.37 0.37 0.38 0.36 0.36 0.35 0.35 0.35 0.35
(11.33)*** (11.25)*** (9.98)*** (10.07)*** (12.21)*** (12.51)*** (10.55)*** (10.56)*** (10.95)*** (10.95)***
Income/loans(t-1) 1.31 1.27 1.38 1.41 1.26 1.2 1.21 1.19 1.27 1.19
(2.56)** (2.45)** (2.64)*** (2.72)*** (3.39)*** (3.32)*** (3.04)*** (3.08)*** (3.27)*** (3.17)***
Wholesale 0.2 0.21 0.17 0.20 0.22 0.23 0.18 0.19 0.21 0.22
(2.26)** (2.43)** (1.84)* (2.25)** (3.23)*** (3.36)*** (2.61)*** (2.90)*** (3.13)*** (3.31)***
Macro variables
GDP growth host 0.44 0.46 0.53 0.55 0.27 0.34 0.37 0.37 0.6 0.76
(1.99)** (2.08)** (2.45)** (2.49)** (1.29) (1.59) (1.51) (1.45) (2.50)** (3.20)***
Global crisis -14.42 -5.87 -12.83 -2.00 -14.55 -6.28 -13.74 -1.54 -14.91 -4.60
(4.08)*** (0.92) (4.07)*** (0.32) (5.12)*** (1.14) (5.08)*** (0.30) (5.64)*** (0.85)
Domestic*Global crisis 9.00 12.76 8.70 6.62 8.13 9.86 7.71 6.49 8.79 7.72
(1.80)* (2.44)** (2.05)** (1.79)* (2.25)** (2.47)** (2.24)** (1.79)* (2.57)** (2.22)**
Local crisis 13.32 1.04 9.20 4.19 10.45
(1.49) (0.23) (1.77)* (1.00) (2.03)**
Domestic*Local crisis -19.40 1.36 -10.82 -5.42 -10.86
(1.85)* (0.23) (1.73)* (0.87) (1.87)*
Wholesale*Global crisis -0.14 -0.12 -0.12 -0.14 -0.12
(1.99)** (2.01)** (2.35)** (2.82)*** (2.33)**
Constant 7.77 5.22 7.12 3.15 9.34 8.28 11.09 9.07 9.70 6.73
(1.02) (0.69) (0.86) (0.41) (1.32) (1.22) (1.62) (1.37) (1.40) (1.01)
Observations 2,739 2,739 2,433 2,433 2,457 2,457 2,465 2,465 2,375 2,375
AB test AR1 0.000 0.000 0.001 0.000 0.000 0.002 0.003 0.000 0.000 0.001
AB test AR2 0.133 0.123 0.143 0.153 0.333 0.383 0.111 0.119 0.233 0.293
Hansen J 0.200 0.195 0.529 0.557 0.234 0.389 0.351 0.453 0.333 0.332
Estimation method AB AB AB AB AB AB AB AB AB AB
Excl. Asia
Table A4
Robustness - Regional heterogeneity
Base Excl. CEE Excl. North
America
Excl. South
America
This table replicates the base results from column 2 and 6 of Table 2 in columns 1 and 2.The subsequent columns then replicate the baselinemodel while each time leaving out the observations in one particular geographic region. Table A1 in the Appendix contains definitions of allvariables. Results are based on a GMM difference estimator (Arellano-Bond 1991, AB). AB test AR1(2): p-value of the Arellano-Bond test
that average autocovariance in residuals of order 1 (2) is 0. Hansen J: p-value of the Hansen J test for overidentifying restrictions, which is
asymptotically distributed as χ2 under the null of instrument validity. Standard errors are robust. T-statistics appear in parentheses and ***,
**, * correspond to the 1%, 5%, and 10%level of significance, respectively.