multinational versus expatriate fdi: a comparative
TRANSCRIPT

WORKING PAPER NO. 56
MULTINATIONAL VERSUS EXPATRIATE FDI: A COMPARATIVE ANALYSIS OF THE CHINESE AND INDIAN EXPERIENCE
ASHOK GUHA &
AMIT S. RAY
APRIL, 2000
INDIAN COUNCIL FOR RESEARCH ON INTERNATIONAL ECONOMIC RELATIONS
Core-6A, 4th Floor, India Habitat Centre, Lodi Road, New Dlehi-110 003

2
TABLE OF CONTENTS
Foreword....................................................................................................... 3
I. Introduction................................................................................................ 4
II. FDI: The Standard Model And Its Implications For India and China .......... 5
III. Expatriate Investment and Labour- Intensive Exports ............................... 6
IV. Expatriate Investment in the New International Division of Labour............ 8 V. FDI in China’s Economic Development: Stylized Facts ........................... 10 VI. FDI in India: MNC’s and Expatriates ....................................................... 11 VII. The Evidence on China ........................................................................... 12 VIII. The Evidence on India............................................................................. 17 IX. The Econometric Analysis....................................................................... 22 X. The Econometric Model Specification ..................................................... 22 XI The Data and Variables........................................................................... 23 XII The Econometric Methodology................................................................ 25 XIII Conclusion............................................................................................... 33
Bibliography ................................................................................................ 36

3
Foreword This study attempts a comparative analysis of Foreign Direct Investment in Chinese and Indian economic development. The stylized facts of such a comparison are well-known. In volume, FDI in China exceeds that in India many-fold, notwithstanding strong doubts about the reliability of Chinese official statistics in this area. In China significant inflow of FDI began at least a decade or so earlier than in India, due to the early origins of reforms dating back to 1979 in China as against 1992 in India. The sources of FDI in the two countries have been very different. Chinese FDI is dominated by East Asian sources, particularly Hong Kong and Taiwan and mostly from expatriate Chinese population, whereas NRI investment in India has been abysmally low. The study finds that investments by large transnational corporations in both countries have been primarily oriented to the domestic market and to infrastructure development. Low wage costs have also been an added attraction for MNCs to investment in these two locations. However, in both, MNC investment responses have been delayed. In China, it has by now acquired substantial momentum but it is yet to take off in India. Expatriate investment in China has essentially been a process of relocation of export oriented simple labour intensive manufactures from the neighbouring expatriate settlements into China. This process has been facilitated by China’s low wages coupled with rapid growth of manufactured exports globally. However India’s failure to tap NRI investments may be attributed to the risk averse nature of the Indian diaspora, lack of learning process in managing export oriented labour intensive manufacturing, and the lack of a decentralised sanctioning mechanism for FDI in India. The study is a part of the South Asia Network of Economic research Institutes (SANEI) project.
Isher Judge Ahluwalia Director & Chief Executive
ICRIER, New Delhi April, 2000
4
I. Introduction Few pairs of countries invite comparison as obviously as do India and China. Both have teeming populations topping the billion mark; both are large continental land-masses; both have primarily agrarian economies rooted in river-valley agriculture. Both moreover are in the process of transition from a regime of dirigiste autarchy to a more market-oriented engagement with the outside world in trade and investment. Just as striking as the similarities are the differences. China is a basically homogeneous society, dominated by the Han Chinese despite the presence of a few ethnic, religious and linguistic minorities in regions like Tibet, Sinjiang and Manchuria. India in contrast is a veritable museum of the species with every conceivable variety of race, language, cult and culture. The Chinese polity is a monolithic dictatorship of one party with a single individual wielding vast power – or at least influence. The Indian political system is a complex federal democracy with power so widely diffused that Galbraith’s famous description of it as ‘a functioning anarchy’ remains to this day its most apt characterisation. Both in their resemblances and their distinctions, the two economies seem to be made for each other, if not in anything else, at least in terms of comparability. The present authors have succumbed to the temptation to attempt such a comparison. We confine ourselves however to just one aspect of the contemporary economic development of the two countries – the role of foreign direct investment in their growth. The stylised facts of such a comparison are well-known. In volume, FDI in China exceeds that in India many-fold, despite strong doubts about the reliability of Chinese official statistics in this area. Thus, FDI inflow into India in 1997-98 totalled $3.2 billion as against the 1997 Chinese aggregate of almost $39 billion. In chronology, significant direct investment in China began much earlier, at least a decade or more so, than in India. In part, this reflected the earlier origin of the present phase of reforms in China, basically in 1979 as against 1991 when the Indian liberalisation process really got under way despite some rhetoric about reform in the Rajiv era of the eighties. To some extent therefore, the shortfall of FDI inflows into India below Chinese levels mirrors the delay in the onset of reform in India. Indeed, the time-profile of total FDI in India since 1992 is not very different from that in China since 1983: the $3.2 billion figure in the sixth year of reform is not drastically smaller than the $3.4 billion received by China in 1988, the sixth year since she began courting foreign investment. Perhaps, FDI in the two countries follows the same stationary process. However, foreign investment in China comes from very different sources than that received by India. Chinese FDI is dominated by East Asian sources, particularly Hong Kong and Taiwan, which together account for over 72% of all FDI flows into the mainland, rising in certain years to over 80%. The composition of FDI, its sectoral and regional distributions, also differ significantly between the two Asian giants.

5
II. FDI: The Standard Model And Its Implications For India and China Traditional theories of FDI shed but little light on the peculiarities of international investment in these two countries. The received wisdom on FDI focuses essentially on the behaviour pattern of the transnational corporation. In this area, the well-known work of theorists such as Vernon (33-37), Kindleberger (18-20), Hymer (16,17), Caves (7-10), Aliber (1,2,3), Buckley and Casson (5,6) has been aptly synthesised by Dunning (11-14) in terms of the advantages of ownership, location and internalisation (OLI). In order to invest abroad, the conglomerate must own certain specific intangible assets whose capacity is not exhausted by production for the home market. This ownership must be exclusive and the assets must confer benefits that offset the costs of operating in an alien environment in competition with firms indigenous to the host country. Only very decisive advantages on this score can enable the MNC to overcome the handicap of its high administrative and communication costs. Such costs arise out of its vast requirements of accounting and control information and of confidentiality and supervision which are of the utmost importance in an LDC where technology imitation is pervasive. These costs are a function of the geographical and cultural distance – the differences in language and in social and business environments – spanned by the firm. Typically, the specific assets referred to in the previous paragraph are reputation, technology and a distribution network. Once built up, these assets are almost unlimited in their capacity and constitute a strong incentive to expansion of production by their owners. In an imperfect capital market, the financial power of the multinational, with its deep pockets and its easy access to global credit and equity markets, constitutes another asset which may be decisive in capital-intensive industries. But if production is to be expanded abroad rather than at home, foreign location must offer benefits that cannot be captured by export from a home base. Examples of such benefits are low labour costs, geographic advantages, favourable tax-treatment or a market protected by import restrictions or transport costs (which may even be infinite for non-tradeable products). Finally, FDI will be induced only if more profitable than the options of selling the asset or leasing or licensing it. In the limit, the lease market may have disappeared due to the moral hazard and adverse selection problems characteristic of a situation of asymmetric information. Thus, if a buyer cannot know in advance the quality of the product he is buying, the seller, who does, cannot credibly communicate this information to the buyer. He (the seller) cannot therefore expect a premium for quality and is sorely tempted to sell an inferior variety. The buyer knows this and tends therefore to offer a low price – which in turn intensifies the moral hazard of the seller and may drive sellers of high-quality products out of the market. The process may culminate in the collapse of the market altogether so that FDI remains the only possible option. The Dunning model rightly incorporates the role of locational advantage in attracting FDI. However, within the range of products thus defined, it explains

6
FDI only in a rather narrow set of activities. Technologically sophisticated products represent one such field. Technology is par excellence the realm of asymmetric information. In many situations where the quality of a product cannot be assessed by inspection, the possibility of repeat purchases by the buyer and of a build-up of reputation by the seller offers safeguards against moral hazard. Not so however in the technology market. Here the buyer is the sole customer for any given technology and purchases are not repeated. Thus, moral hazard and adverse selection can run riot. Hence it is that transnational investments are viewed in LDC’s as vehicles of technology transfer even more than as purveyors of capital. However, capital-intensive industries constitute another area of obvious advantage for the multi-national. Activities in which reputation is a crucial asset (as an assurance of quality to otherwise helpless customers) constitute yet another field in which FDI is likely to flow. Examples are hotels and financial services, fast food outlets, soft drinks and packaged foods. Finally, where standardised but labour-intensive operations can be separated from an otherwise capital- and technology-intensive process and located in labour-abundant, low-wage economies, this could be a basis for FDI. Of course, FDI is induced only when it is essential to avoid subcontracting these phases to local producers (perhaps to preempt the possibility of opportunistic hold-up by the latter). The technology – and capital-intensive character of most of the activities that are likely to attract foreign investment according to the OLI theory implies that FDI will not spearhead the growth of exports from low-wage economies. The basic comparative advantage of such economies lies in labour-intensive industries. Thus, the Dunning model appears to predict a concentration of FDI in domestic market-oriented and infra-structural activities at least in the poorer, densely populated Asian countries. There may of course be exceptions. Mining or plantation agriculture for export may be heavily multinationalised because of their capital-intensive technology, the transaction costs saved through forward integration with user industries and their dependence on a world-wide distribution network. In countries where low wages of unskilled labour have translated into cheap technically skilled manpower, a comparative advantage may emerge in human capital – intensive, high tech products, which could form the basis of export-oriented FDI (as in software). However, this remains the exception rather than the rule. III. Expatriate Investment and Labour- Intensive Exports While this may not be an inaccurate picture of Western conglomerate activity, its value is limited by inadequate attention to expatriate investment and its distinctive characteristics. In an economy like China’s, where FDI is dominated by inflows from overseas Chinese sources, this is a serious limitation indeed. The pattern of expatriate investment is determined by the specific advantages

7
that expatriates command over their competitors. Expatriates have an advantage over domestic producers in exports because of their superior knowledge of foreign markets and technology. They score over conglomerates in their knowledge of local conditions and languages and their possible familiarity with the problems of managing low-wage unskilled labour, which is an important determinant of an LDC’s comparative advantage in manufactured exports. A question that arises naturally at this point is the following: if expatriates possess certain valuable and specific skills, why don’t MNC’s simply acquire them by hiring? The answer is simple. Such inputs are unobservable and therefore non-contractible. No employer can determine whether an employee is deploying his skill in managing low-wage labour or exploiting his local connections to the fullest. Such contracts cannot be monitored, verified or enforced. The optimal contract for these inputs is in fact one in which their owner is the residual claimant. If an MNC wishes to tap his abilities, it must sell itself to him rather than buy his services for a price. The net profit it could make from such a transaction would be essentially zero. It is the ownership of such non-contractible inputs that defines the identity of a firm and gives legitimacy to the notion of firm comparative advantage. Firms are not ‘boneless wonders’ – amorphous, perfectly malleable entities, capable of reinventing themselves in any shape or form through recourse to the market. They have a bundle of specific skills which constitute the basis of what Michael Porter calls their ‘core competency’. This is a concept that is central to the analysis and conclusions of this paper. Broadly then, in a low-wage economy, expatriate investment, with its core competency in labour-intensive exports, may be able to supply the export momentum which MNC investment, on account of its capital- and technology-intensive bias, is – with a few notable exceptions – ill-equipped to generate. However, for the expatriate investor, this ability is not an inborn, but an acquired characteristic; he must learn his distinctive skills, whether in language, familiarity with local conditions or ability to manage unskilled labour, and in the absence of this learning process, he may not do any better in the export arena than the MNC. Where the sectoral patterns of expatriate and MNC investment differ, there will also tend to be a difference in timing. Light, labour-intensive manufactures involve small commitment and offer quick returns; the immediate stance of government policy is more relevant to them than its long-term prospects. On the other hand, capital-intensive investment particularly in infrastructure, has a long gestation period and makes the investor a hostage to fortune. Thus, in countries like India and China, that have experienced a major change in economic regimes, the large capital-intensive producer, generally the MNC needs (much more than the smaller light manufacturer), to assure himself that the welcome to foreign investment is an irreversible attitude and that the growth of the domestic market will be sustained in the long run. Such assurance takes a long time to build. In consequence, the MNC’s response to the open door is often slow and hesitant. Who knows when the red carpet will be rolled up and the open door

8
slammed shut again? MNC reactions to policy changes may therefore often take as long as a decade. IV. Expatriate Investment in the New International Division of Labour While the theory of FDI is an essential part of our story, an equally indispensable element is the process of global economic growth over the last three decades and the role played in it by FDI in Asia. Since the late sixties, the rapid expansion of the world economy (particularly in Asia) has been powered by the spectacular growth of world trade. The growth of trade was not a random process of widening exchange but one of intensifying specialisation based on factor endowments a la Heckscher-Ohlin. A new international division of labour began to emerge. The main feature of this was the shift first of labour-intensive industries and then of standardised manufacturing to low-wage economies and the concentration of the West in services, research- intensive technologies and high-tech manufacturing. The early Asian beneficiaries of this specialisation pattern were the open economies of the Pacific rim, the Gang of Four. Here, development rode a tidal wave of labour-intensive manufactured exports to astronomical heights in the sixties and seventies. However, this shift had its distributional consequences, following the predictions of the factor price equalisation theorem. Wages and employment stagnated in the West. Over the last thirty years, for the first time in U.S. recorded history, real wages remained constant. In Western Europe, wage levels indeed rose somewhat, but at the expense of prolonged large-scale unemployment. In sharp contrast, labour demand and real wages rose very rapidly indeed in East Asia. Korea, Taiwan and Singapore witnessed a wage explosion. Hong Kong trailed, but not by much. In Taiwan, the index of real manufacturing earnings rose four-fold between 1960 and 1979. In Korea, it more than tripled between 1966 and 1980. In Singapore average real wages almost doubled between 1975 and 1988. In Hong Kong, they increased by about 150% between 1960 and 1980 (Fields-15; Lim- 29). Wage pressures in Hong Kong were dampened a little by proximity to the mainland with its vast reservoir of cheap labour. The rise in wages in the Gang of Four had its repercussions on the pattern and distribution of production. Techniques became more capital-intensive. In Korea, for example, the average capital-intensity in manufacturing rose from 3.6 in 1968 to 13.0 in 1985 (You- 41). The change in the commodity composition of output was reflected in the fall in the share of light industry in manufacturing – in Taiwan from 51.2% in 1965 to 41.5% in 1984, in Korea from 81.8% in 1965 to 43.2% in 1984 (Scitovsky, 30). Meanwhile the share of chemicals and machinery in total value added rose from 24.3% in 1961 to 47.2% in 1982 in Taiwan, from 22.8% to 40.4% in the same period in Korea (Wade- 38). By the early eighties, the profiles of most industries had changed – with the heavier and more capital-intensive phases beginning to eclipse the labour-intensive assembly phases. 49% of Taiwan’s electronics output, for example, was now comprised of components, 6% of industrial appliances and only 45% of consumer appliances. For Korea, the comparable figures were 50%, 10% and 40%. Hong Kong, in contrast,
9
persisted with a lighter, more labour-intensive industry profile: there components accounted for only 30%, industrial appliances for 2% and consumer appliances for as much as 68% of electronics production (Wade- 38). As rising wages undermined the profitability of labour-intensive manufactures in the Four Tigers, entrepreneurs in these industries found themselves in possession of assets that called for urgent re-deployment. These included experience of managing low-wage labour and links with world-wide export markets, both acquired as a result of a two-decade-long learning process. In contrast to the technological capacity developed by MNC’s through R and D, these were abilities nurtured through Arrovian learning by doing. Some of these resources were diverted to SE Asia, to Malaysia, Indonesia, Thailand and the Philippines where they triggered off an acceleration of growth. However, the most obvious theatre of redeployment was China. Here, wages and rents were lower than elsewhere in East or Southeast Asia. Further, unlike the other countries of the region, with their small sizes and limited populations, China had near infinite elasticity of labour supply. Chinese wages were not only low, but also showed no rising trend. The increasing demand for labour-intensive exports produced a Stolper-Samuelson effect on factor prices in the rest of East Asia with its inelastic factor endowment. In China, it induced an Arthur Lewis process. What was more, the entrepreneurs who pioneered export-led industrialisation in all the East Asian countries except Korea were ethnic Chinese with family links and linguistic affinities to the mainland. So China was the natural destination for expatriates seeking cheap – labour locations to relocate their light, export-oriented manufactures. When, in 1985, China opened the Pearl River Delta and ten coastal cities to foreign investment, thousands of small and medium Chinese manufacturers flooded into Guangdong and Southern Fujian through Hong Kong. China was thus the beneficiary of external economies generated by two decades of labour-intensive export growth in the Asia-Pacific and the overseas Chinese were the vehicle for the transmission of these spillovers. While these learning effects were induced by the earlier phases of the Pacific miracle, the expatriates possess another advantage over MNC’s, one which they owe to their social structure. All diasporas build up a network of long-term relationships of trust and reciprocity through repeated transactions in an alien, possibly hostile environment. In markets characterised by asymmetric information, where moral hazard, adverse selection and opportunism may otherwise reign, such relationships are invaluable in averting Prisoner’s dilemma outcomes. In more impersonal dealings, resolution of Prisoner’s dilemmas often calls for elaborate contracts, costly to write, more so to enforce. Long-term personal networks with their implicit codes of conduct, standards of reputation and social sanctions minimise such transaction costs. The credibility of commitments relating to vital matters such as loan repayment, product quality and timely supply are stronger within a network. A network also supplies a channel for information flows; and a diaspora with its international spread has a reach which only a very few MNC’s can match, a reach which is priceless to the exporter. In addition, the familistic character of firms makes for strong managerial loyalty and for long run dynastic planning with maximum

10
reinvestment in the firm and in the education of the next generation. Finally, the personalised, informal, unwritten nature of promises within the diaspora protects their secrecy without necessarily making them less effective. In contrast to the explosion of expatriate investment in the early days of China’s reforms, the curve of MNC investment in China climbed but slowly. MNC’s followed the implicit predictions of the OLI model. They were largely oriented to the domestic market and to infrastructure; and they lagged at least a decade behind the overseas Chinese investors. It was only from 1992 that MNC investment began to really accelerate, doubling in 1991-92 and doubling again in 1992-93. V. FDI in China’s Economic Development: Stylized Facts Chinese economic development since 1978 can be broadly conceptualised as a sequential process with the following phases:
1. 1978-1984: Agricultural transformation, massive increases in rural income and savings and release of labour to industry.
2. 1984-1992: Growth of TVEs through exploitation of rural savings and demand and a simultaneous explosion of FDI, overwhelmingly from the overseas Chinese, in the Special Economic Zones and related coastal areas, primarily for export of labour-intensive light manufactures.
3. 1992-2000: Proliferation of multinational investments in heavier, more capital- and technology-intensive industries and infrastructure, mainly for the domestic market or the non-tradeable sector.
The sectoral and temporal distinctions may not be quite as sharp as posited by the above stylised picture. For instance, during the first phase, the Joint Venture Law of 1979 was passed, permitting foreign investment (generally upto 50%) in fields other than finance and banking, transportation, post and telecommunications and retail. Four Special Economic Zones (Shenzhen, Zhuhai and Shantou in Guangdong and Xiamen in Fujian ) were set up with special preferences for foreign investors. In consequence, by 1983, a cumulative total of $ 1.8 billion of FDI was attracted, much of it in early, large, and fairly futile MNC oil-exploration projects, but some in small, labour-intensive ventures from Hong Kong. Further, expatriate investment is also likely to respond to the profit opportunities presented by a rapidly growing domestic market even when primarily export–oriented. However, it is perhaps legitimate to model the Chinese development process as one in which the initial growth of a huge domestic market through an agricultural revolution followed by rural industrialisation and export explosion with its domestic multiplier effects acted as an irresistible lure for the inrush of large multinationals. The process gained momentum with the unfolding of the international division of labour. This model implies a two-tier FDI process:
1. mainly export-oriented investment in light manufacturing by the Overseas Chinese;

11
2. an accelerating inflow of multinational investment eager to establish a presence in what was apparently going to be in a few years the largest domestic market in the world.
VI. FDI in India: MNC’s and Expatriates China’s development as a haven for FDI and a source of labour-intensive exports is a logical – as well as chronological – sequel to the Pacific miracle. India’s development has no such organic link with East Asian experience. Expatriate Indian entrepreneurs played but a minor role in East Asia’s growth, and expatriate investment had a negligible share in India’s total FDI. Of course, the open door is a far more recent phenomenon in India, dating back only to 1991, as opposed to the early 1980’s in China. However, enough time has already passed since 1991 for us to assert that India has not experienced anything like the early surge of expatriate investment in China. MNC investment in India has been accelerating after a slow start and its growth curve is not too dissimilar to that of early MNC investment in China. Nor is the character of MNC investment very different in the two countries. By and large, in both countries, such investment has been oriented to the domestic market rather than to exports. They have been attracted by economies of scale and large market sizes, not primarily by low wage costs. NRI investment, on the other hand, has been far more export-oriented. It has tended also to favour small scales and labour-intensive technologies. However, in stark contrast to Chinese experience, the overriding fact about NRI investment is its small volume. As in China, NRI investment as a proportion of total FDI took off early in the reform process: but after climbing steeply to a peak of 35% in 1993-94, it maintained its share only for the next two years and began thereafter a precipitous decline — not merely in relative, but also in absolute, volumes. In fact, the time-profile of NRI investment echoes that of the growth rates of industrial output and investment. Its volatility reflects either an acceleration effect or high sensitivity to a set of common causes that also explain industrial deceleration. Cyclical factors such as inventory accumulation and the satiation of pent-up demand for consumer durables during the boom of 1993-96 were among these common causes. So was the East Asian crisis with its impact on investor confidence and on the market for Indian exports. However, the most important of these common causes is political instability. Between the Narasimha Rao government of 1991-96 and the Vajpayee government of late 1999, India was ruled by a succession of unstable coalitions. None of these were homogeneous enough to give coherent signals on economic policy, and none certainly looked long-lived enough to make credible promises about the future. From 1996 to 1999, therefore, industrial investment and output growth stagnated or declined and so did NRI investment. MNC investment, on the other hand, was largely independent of the short-run vicissitudes of policy: it was based on the growing belief that reforms and globalization in India had gone beyond the point of no return regardless of the preferences of the political establishment.

12
VII. The Evidence on China The empirical basis of our analysis has two distinct components. First, in the realm of descriptive statistics, we present time-series of aggregate FDI along with data on the size-distribution, industrial composition and location patterns of enterprises with foreign investment, both of the expatriate and conglomerate varieties. In the Indian case, we also add data on the relative export intensities of units with foreign collaboration or NRI participation. In the Chinese case, we report data from micro-surveys of small overseas Chinese investors as well as some information about the investments of expatriate Chinese tycoons. This is followed by an econometric analysis of macro-level economy-wide data. We have confined our econometric exercise to the aggregative plane because of our lack of access to enterprise-level data for the Chinese economy. Expatriate investment is not separately identified in the Chinese data. We have therefore taken the figures for inflows from Hong Kong, Macau and Taiwan as representative of overseas Chinese FDI. Hong Kong is indeed the financial capital of the Chinese business sphere and the main point of entry into the mainland for overseas Chinese investors, not only from Hong Kong but from Singapore, Malaysia, Indonesia, Thailand and the Philippines as well. Until 1992, all Taiwanese investments too were per force routed through Hong Kong. Much of Hong Kong’s investment in China (perhaps 15-25%) is actually mainland Investment which is being recycled via Hong Kong to take advantage of the concessions given by China to foreign investors. As against this, all expatriate Chinese investment from North America and Australia are reported as originating in these regions and has therefore been classed by us as MNC investment. Thus, our estimates of the relative proportions of expatriate and MNC investment may not be very widely off the mark. Evidence of our hypothesis with regard to China can be gleaned from the time-profile of aggregate FDI (TOFDI) (Table 1 and Fig.1) with its sharp accelerations
in 1984 and 1992 - 93. In 1984, total FDI grew by 70%. In 1992, it grew by
NRC&TOFDI
0
10000
20000
30000
40000
50000
60000
70000
1983 1984 1985 1986 1987 1988 1989 1990 1991 1992 1993 1994 1995 1996 1997
US$Million
Yea
r TOFDINRC

13
163%, to be followed by a growth of 132% in 1993. The differential sequence of expatriate (NRC) and MNC investment is evident from the same table and the same graph. The proportion of overseas Chinese investment in total FDI rose from a minimum of about 55% in 1983-85 to a peak of 83% in 1993 and then declined steadily.
Table 1 FDI (NRC-Actuals)
Unit: US$ Million
Year NRC MNC TO FDI 1983 472 327.9 799.9 1984 748 617.1 1365.1 1985 956 795.6 1751.6 1986 1329 697.9 2026.9 1987 1809 590.5 2399.5 1988 2429 957.2 3386.2 1989 2342 770.7 3112.7 1990 1913 1097.35 3010.35 1991 2959 1192.22 4151.22 1992 8762 2143.17 10905.17 1993 21001 4328.85 25329.85 1994 23565 6650.49 30215.49 1995 23790 9206.03 32996.03 1996 24940 11055.47 35995.47 1997 25296 13641.48 38937.48
Source: NRC::China Statistical Yearbook, 1998 The differences in the sectoral composition and size distribution of overseas Chinese and conglomerate investments are reflected in the country-of-origin effects illustrated in Tables 2 and 3. Labour-intensive sectors like food and beverage, textiles and sewing and light manufactures absorb 45.8% of Hong Kong’s investment in mainland manufacturing, and 45.2% of Taiwan’s, as against 35.2% of U.S. and 32.4% of European investment. The capital- and technology-intensive sectors – chemicals, pharmaceuticals, electronics (much of which is actually labour-intensive) and machinery – account for 45.7% of Hong Kong and 44.1% of Taiwanese investment, much of which actually flows to the labour-intensive assembly phases of the electronic industry. These contrast with the U.S. and European shares, of 52.5 % and 61.8% respectively.
Table2 Industry Distribution of Pledged FDI in China from Different Sources (1992)
% Shares of Different Industries in Pledged Investment from Industries HK Taiwan Japan U.S.A Europe Others
Food & beverage 9 15.7 13.9 12.4 8.7 15.9 Textiles & sewing 22.4 16.5 27.8 14.2 16.4 17 Light mfr. 14.4 13 8.8 8.6 7.3 23.2 Chemicals, plastic 19 15.8 9.7 22 27.1 7.3 Pharmaceutical 3.1 1.4 2.1 2.7 3.7 11 Electronics, machinery 23.6 26.9 27.4 27.8 31 17.3 Others 8.5 10.6 10.3 12.4 5.9 8.4 Source: MOFTEC,1993
14
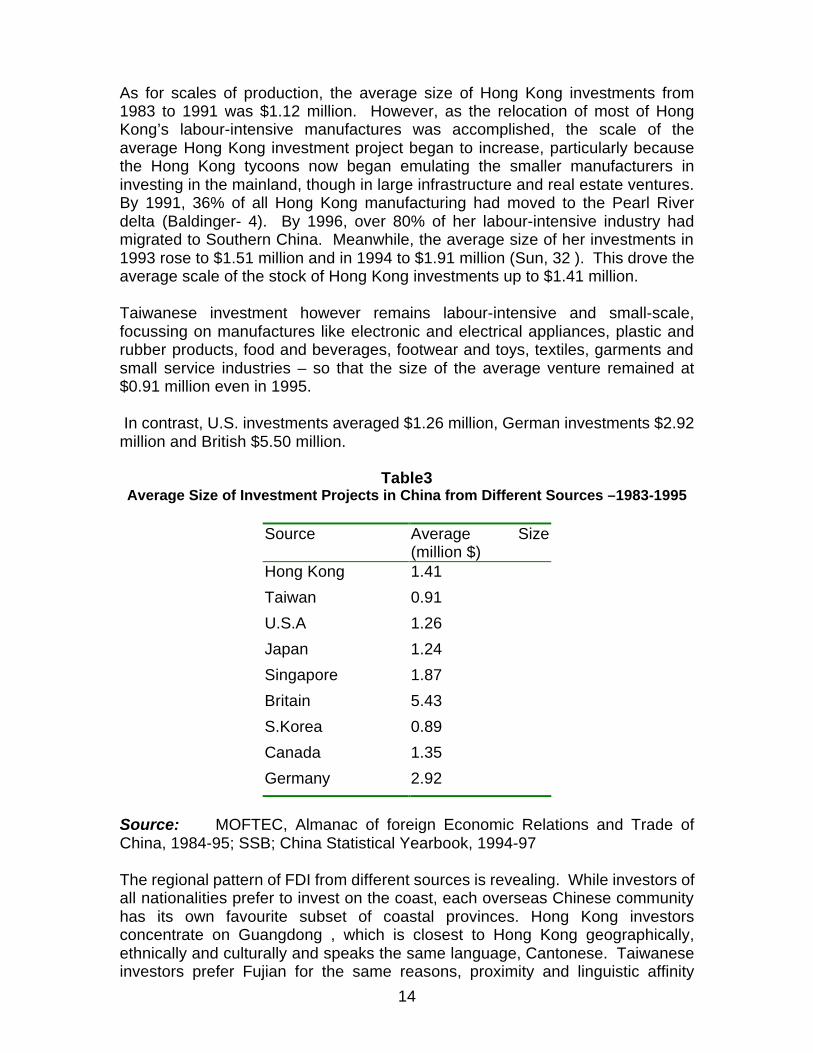
As for scales of production, the average size of Hong Kong investments from 1983 to 1991 was $1.12 million. However, as the relocation of most of Hong Kong’s labour-intensive manufactures was accomplished, the scale of the average Hong Kong investment project began to increase, particularly because the Hong Kong tycoons now began emulating the smaller manufacturers in investing in the mainland, though in large infrastructure and real estate ventures. By 1991, 36% of all Hong Kong manufacturing had moved to the Pearl River delta (Baldinger- 4). By 1996, over 80% of her labour-intensive industry had migrated to Southern China. Meanwhile, the average size of her investments in 1993 rose to $1.51 million and in 1994 to $1.91 million (Sun, 32 ). This drove the average scale of the stock of Hong Kong investments up to $1.41 million. Taiwanese investment however remains labour-intensive and small-scale, focussing on manufactures like electronic and electrical appliances, plastic and rubber products, food and beverages, footwear and toys, textiles, garments and small service industries – so that the size of the average venture remained at $0.91 million even in 1995. In contrast, U.S. investments averaged $1.26 million, German investments $2.92 million and British $5.50 million.
Table3 Average Size of Investment Projects in China from Different Sources –1983-1995
Source Average Size
(million $) Hong Kong 1.41
Taiwan 0.91
U.S.A 1.26
Japan 1.24
Singapore 1.87
Britain 5.43
S.Korea 0.89
Canada 1.35
Germany 2.92
Source: MOFTEC, Almanac of foreign Economic Relations and Trade of China, 1984-95; SSB; China Statistical Yearbook, 1994-97 The regional pattern of FDI from different sources is revealing. While investors of all nationalities prefer to invest on the coast, each overseas Chinese community has its own favourite subset of coastal provinces. Hong Kong investors concentrate on Guangdong , which is closest to Hong Kong geographically, ethnically and culturally and speaks the same language, Cantonese. Taiwanese investors prefer Fujian for the same reasons, proximity and linguistic affinity

15
based on the Minnan dialect. Koreans concentrate on Shandong for reasons of proximity and Japanese on Liaoning. Overseas Chinese invest on the coast also because of the export-oriented character of their enterprises: a coastal location minimizes the costs and delays of overland transportation for exporters. Western investors also favour coastal locations – but for different reasons. Coastal regions have, on account of their attraction for expatriate investment, become highly urbanized centres of population and income with large consumer markets. They have also developed infrastructural facilities, which, while less important for small, labour-intensive, expatriate investments, are absolutely indispensable for large-scale, capital- and technology-intensive industry. However, Western investors spread their investments widely over the coastal region instead of focussing on one or two provinces.
Table 4 Shares of Different Regions in Pledged FDI in China from Different Sources- 1987-93
Major Regional Provinces
% Shares in Pledged FDI from
(I) (II) (III) (IV) HK Taiwan* Japan U.S.A Guangdong 41.7 13.6 11.2 13 Fujian 10.9 19.1 3.5 3.4 Tiangsu 7.9 18 13.8 16 Zhejiang 3.6 5.1 2.6 3.8 Shanghai 5.2 5.1 12 11.1 Shandong 4.9 8.2 8.9 11.1 Hebei 1.5 1.7 6.3 2.6 Beijing 4 4.3 7 10 Tianjin 1.4 2.3 4 5.6 Liaoning 2.7 2.8 17 6.2 Guangxi 3.1 2.4 1.3 1.7 Hainan 3.5 4.2 4.1 4
Source: SSB, Foreign Economic Statistical Yearbook, 1979-91 and 1994. *Taiwan figures for 1989-93 The acceleration of FDI, particularly of expatriate FDI, from the mid-80’s was correlated with major changes in the volume and composition of exports and in the export shares of different provinces. China’s exports doubled between 1985 and 1990 and again between 1990 and 1994 and continued to accelerate throughout the 90’s. Primaries (mainly petroleum) – which accounted for about 50% of exports in 1985 – dwindled to less than 25% in 1991. Meanwhile, labour-intensive products rose from 41% of exports in 1980 to 58% in 1989, human capital-intensive light manufactures from below 5% to 17% (Lardy, 27). The flood of FDI in the second half of the 80’s was heavily skewed towards the provinces of Guangdong and Fujian, the major targets of Hong Kong and Taiwanese investors. This was accompanied by a rise in the export shares of these provinces: Guangdong’s contribution to China’s exports rose from 31% in 1988 to 42% in 1992, Fujian’s from 3% to 4.4% (see table 5).

16
Table 5 Contribution of FDI in China's and Guangdong's Exports
Exports from
China Guangdong Year Total (billion$)
FIEs % Total (billion$)
FIEs %
1985 27.4 0.3 1.1 3 0.22 7.3 1986 30.9 0.6 1.9 4.3 0.39 9.2 1987 39.4 1.2 3.1 5.4 0.62 11.4 1988 47.5 2.5 5.2 7.5 1.2 16.1 1989 52.5 4.9 9.4 8.2 2.3 27.9 1990 62.1 7.8 12.6 10.6 3.7 35.2 1991 71.9 12.1 16.8 13.7 5.3 38.9 1992 85 17.4 20.4 18.4 8.2 44.3 1993 91.8 25.2 27.5 37.6 14.4 38.2 1994 121 34.7 28.7 53.3 19.8 37.2 1995 148.8 46.9 31.5 59.1 25.8 43.6
Source: SSB, China's Foreign Economic Statistics, 1979-91, 94 & 96 and Statistical Yearbook of China, 1996. The contribution of foreign-invested enterprises to China’s exports rose steadily throughout this period from 1.1% in 1985 to 31.5% in 1995. Their role in Guangdong’s exports was larger, increasing from 7.3% in 1985 to 43.6% in 1995 – a decade during which Guangdong’s export value itself multiplied twenty-fold. This domination of China’s export growth by Guangdong, and of Guangdong’s export growth by foreign – invested enterprises reflected the export-oriented character of the expatriate investment which was the prime motor of growth in Guangdong. These trends are confirmed by micro-surveys of expatriate investors in China. Lever-Tracy, Ip and Tracy (28) surveyed about 400 such investors, about 100 each in Nanhai and Panyu in Guangdong and Quanzhou and Xiamen in Fujian. Over 80% of the enterprises surveyed were small (with a total investment by all partners, including mainland Chinese, below $5 million): investments below $1 million dominated in Nanhai and Quanzhou and accounted for 44% in Panyu and 34% in Xiamen. Two-thirds of the enterprises in Quanzhou and over 45% in the three other locations employed less than 200 workers. The small size of the typical enterprise was a matter of choice rather than a consequence of the budget constraints of the investors, many of whom were in fact medium or large (over $ 5 million). Exporters dominated the survey in all locations: 87% in Panyu, 74% in Xiamen, 71% in Quanzhou and 61% in Nanhai exported the bulk of their output.

17
Studies of the expatriate tycoons are also revealing. Many of them began investing in the mainland only in the 1990’s. For instance, Oei Hong Leong of the Indonesian Widjaja family left Singapore for Hong Kong in 1991 and initiated his large-scale mainland investments (eg. a pulp and paper mill in Zhejiang and a rubber factory in Hangzhou ) only thereafter. Li Ka-shing, the greatest of the Hong kong billionaires who, by 1993, had climbed to the 16th rank in Fortune magazine’s list of the wealthiest individuals in the world, began investing in China only in the 90’s – though his investments thereafter were large and diverse ( container terminals, property development and reclamation, superhighways, power projects, industrial parks, zinc refineries etc. ). The Kuok brothers of Malaysia and Singapore began investing in hotels on the mainland in 1993. Many of the tycoons follow a policy of limiting the scale of each of their enterprises. The Chearavanont family, the largest single investor in China, was listed by Forbes in 1994 among the top 25 in the world ( with net wealth in excess of $ 5 billion ): but none of its companies ranked in the largest 1000. Indeed, while ethnic Chinese families accounted for 20% of the 25 largest personal fortunes in the world, none of their companies ranked among the top 100 firms and only 1 among the top 200. There were exceptions, of course, notably Gordon Wu, the Hong Kong billionaire, whose Hopewell Holdings invested large sums in power plants and highways from the mid-80’s. However, in general, Chinese billionaires, when they did invest in China in the 80’s, preferred a diversified investment pattern dominated by small enterprises – very much like the smaller expatriate businessmen. VIII. The Evidence on India The time pattern of aggregate FDI in India with its slow but steady acceleration bears witness to our hypothesis regarding India. The differential response of NRI and MNC investment is reflected in the changing share of NRI’s in this aggregate, its initial rise and subsequent dramatic decline (see Table 6 and Figure 2).
Table 6 FDI (NRI-Actuals)
Unit:US $ million
Year NRI TO FDI 1992-93 61 341 1993-94 217 620 1994-95 442 1314 1995-96 715 2133 1996-97 639 2696 1997-98* 241 3197
*Figures for this year are provisional Source: RBI Annual Report

18
Figure 2
There is no data on the export shares or the industry distribution of firms in which foreigners and NRI’s have invested directly. However, we do have the industry distribution of firms with foreign or NRI equity at a given date listed on the Indian stock exchanges. This shows a distinct difference in the industry patterns of units with foreign and those with NRI participation. Of the total number of plants with significant foreign equity, 33.4% produce machinery and equipment and 14% automobiles and their parts. The corresponding figures for NRI units are 9.3% and 3.4% respectively. On the other hand, NRI’s have a decidedly stronger preference for textiles (20.9% as against 8.5% for foreigners), jewellery (1.6% as against 0.3%), services (3% as against 0.8%) and paper and printing (2.7% as against 0.2%). In other fields – including software, food and beverages and chemicals – differences exist, but are not of the same order of magnitude. Within industry groupings, a parallel difference is evident in the specific subgroups preferred by NRI’s and MNC’s: thus, in the textiles category, MNC’s concentrate on yarn and NRI’s on fabrics and garments. Clearly, NRI’s prefer the lighter, less capital-intensive end of the technological spectrum relative to MNC’s (see Table7).
Table 7 Industry-wise Distribution of Plants with
Foreign Collaboration & with NRI Participation
In each industry no. of plants with
% share of each industry in total no. of plants with
Industry Name
FC NRI FC (%) NRI (%) Food & Beverages 37 39 6.15 8.87 Textiles 51 92 8.47 20.91 Paper, Printing etc. 1 12 0.17 2.73 Leather & Allied 14 6 2.33 1.36 Chemicals 102 94 16.95 21.36
Plastic,Rubber,Petro&Coke 41 47 6.81 10.68 Non-metals 17 22 2.82 5 Metallic Ores & Manufacturing 34 34 5.65 7.73 Manufacture of Machinery 201 41 33.39 9.32 Medical & Photographic Equipment 3 7 0.498 1.59 Jewellery 2 7 0.33 1.59 Software and Computer Systems 10 9 1.66 2.04
NRI&TOFDI
0
500
1000
1500
2000
2500
3000
3500
4000
1992-93 1993-94 1994-95 1995-96 1996-97 1997-98
Year
US
$mill
ion
TOFDI
NRI

19
Automobiles & their parts 84 15 13.95 3.41 Services 5 13 0.83 2.95 Power generation & distribution 2 0.45 Total 602 440 100 100
For the same sample, a comparison of export-intensities of MNC and NRI enterprises reveals that the latter export a larger proportion of their output in every industry group except computers and software. Further, while NRI’s are attracted to major export industries, MNC’s tend to avoid them. This is true of the three major industry groups that bulk largest in India’s exports – textiles and textile products, jewellery and food and beverages; but it is also true of industries like leather and chemicals. The solitary exception, computers and software, is heavily biased by the inclusion of a single large hardware firm with NRI participation which produces for the domestic market (see Table 8).
Table 8 Comparative Export Intensities
Industry Name FC (sample) NRI (sample) ALL (populn.) Food 12.50 36.09 11.57 Textiles 14.73 23.93 19.89 Paper 0.03 2.77 2.86 Leather 8.86 84.15 33.05 Chemicals 8.82 11.53 10.15 Rubber, Plastic, Petrolium and Coke 3.08 12.42 3.13 Nonmetals 3.36 7.69 5.49 Metals 24.82 51.43 8.21 Machinery 8.94 12.42 6.95 Medical & Photographic Equipments 2.63 21.47 8.35
Jewellery 20.75 94.00 62.68 Software and Computer Systems 27.85 3.85 31.20 Automobiles 6.66 7.83 7.03 Services 44.19 52.58 5.20 Power Distribution and Generation 2.43 0.58
All figures are in percentage. Source : CAPITALINES 2000
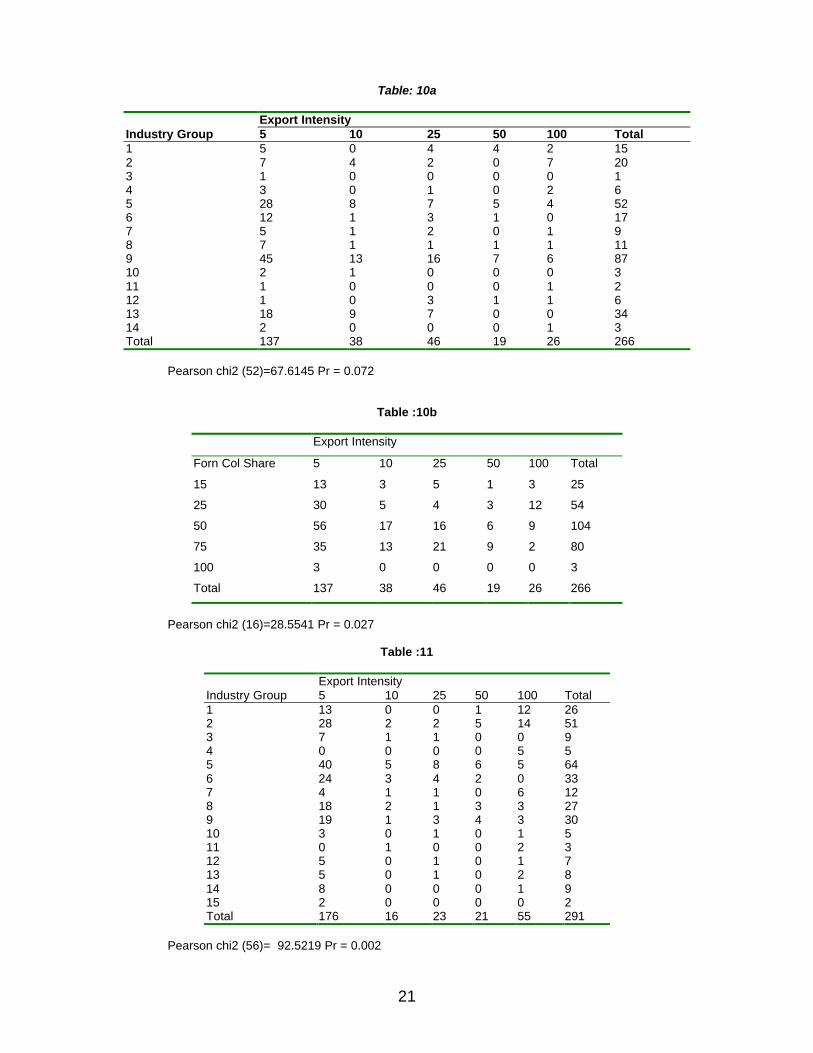
Analyses of variance confirm these impressions. The number of plants with foreign collaboration varies significantly between industries as well as between export share classes. So does the number of plants with NRI participation (see Tables 9a,9a’,9b,9b’) Chi-square tests indicate that export-intensities of firms are significantly related to foreign collaboration shares as well as to industry groups. The pair-wise correlation between export ratios and foreign collaboration shares is significantly negative, while that between export intensity and NRI shares is significantly positive (both at the 5% level) (see Tables 10a,10b,11).

20
Table 9a FOREIGN COLLABORATION Export Intensity Industry Name 0-5% 5-10% 10-25% 25-50% 50%&above Food & Beverages 12 0 16 6 3 Textiles 17 16 11 0 7 Paper, Printing etc. 1 0 0 0 0 Leather & Allied 7 0 3 0 4 Chemicals 57 13 18 8 6 Plastic,Rubber,Petro&Coke 22 8 9 2 0 Non-metals 10 3 3 0 1 Metallic Ores & Manufacturing 14 1 12 4 3 Manufacture of Machinery 85 67 29 11 9 Medical & Photographic Equipments 2 1 0 0 0 Jewellery 1 0 0 0 1 Software & Computer Systems 1 0 7 1 1 Automobiles & their parts 41 29 14 0 0 Services 4 0 0 0 1
Table 9a’
ANOVA (Foreign Collaboration) Source of Variation SS Df MS F P-value F crit Rows 7881.2 13 606.2462 5.331362 5.87E-06 1.913456 Columns 2774.514 4 693.6286 6.099808 0.000421 2.549761 Error 5913.086 52 113.7132 Total 16568.8 69
Table 9b
NRI Export Intensity Industry Name 0-5% 5-10% 10-25% 25-50% 50%&above
Food & Beverages 17 0 0 1 21 Textiles 55 5 4 8 20 Paper, Printing etc. 8 3 1 0 0 Leather & Allied 0 0 0 0 6 Chemicals 59 6 15 6 8 Plastic,Rubber,Petro&Coke 36 4 4 3 0 Non-metals 11 2 1 0 8 Metallic Ores & Manufacturing 18 3 1 7 5 Manufacture of Machinery 26 1 3 6 5 Medical & Photographic Equipment 5 0 1 0 1 Jewellery 0 1 0 0 6 Software & Computer Systems 7 0 1 0 1 Automobiles & their parts 10 0 1 0 4 Services 11 0 0 0 2 Power generation & distribution 2 0 0 0 0
Table 9b’
ANOVA(Non Resident Indians)
Source of Variation SS Df MS F P-value F crit Rows 2440.267 14 174.3048 2.824819 0.002965 1.872589 Columns 2778.933 4 694.7333 11.25899 8.99E-07 2.536581 Error 3455.467 56 61.70476 Total 8674.667 74
21
Table: 10a Export Intensity Industry Group 5 10 25 50 100 Total 1 5 0 4 4 2 15 2 7 4 2 0 7 20 3 1 0 0 0 0 1 4 3 0 1 0 2 6 5 28 8 7 5 4 52 6 12 1 3 1 0 17 7 5 1 2 0 1 9 8 7 1 1 1 1 11 9 45 13 16 7 6 87 10 2 1 0 0 0 3 11 1 0 0 0 1 2 12 1 0 3 1 1 6 13 18 9 7 0 0 34 14 2 0 0 0 1 3 Total 137 38 46 19 26 266
Pearson chi2 (52)=67.6145 Pr = 0.072
Table :10b
Export Intensity
Forn Col Share 5 10 25 50 100 Total
15 13 3 5 1 3 25
25 30 5 4 3 12 54
50 56 17 16 6 9 104
75 35 13 21 9 2 80
100 3 0 0 0 0 3
Total 137 38 46 19 26 266
Pearson chi2 (16)=28.5541 Pr = 0.027
Table :11
Export Intensity Industry Group 5 10 25 50 100 Total 1 13 0 0 1 12 26 2 28 2 2 5 14 51 3 7 1 1 0 0 9 4 0 0 0 0 5 5 5 40 5 8 6 5 64 6 24 3 4 2 0 33 7 4 1 1 0 6 12 8 18 2 1 3 3 27 9 19 1 3 4 3 30 10 3 0 1 0 1 5 11 0 1 0 0 2 3 12 5 0 1 0 1 7 13 5 0 1 0 2 8 14 8 0 0 0 1 9 15 2 0 0 0 0 2 Total 176 16 23 21 55 291
Pearson chi2 (56)= 92.5219 Pr = 0.002

22
IX. The Econometric Analysis Our objective is to estimate econometric models of FDI inflows into China and India, making a clear distinction between multinational versus expatriate investments. Data on FDI is available according to source country specifications without making a direct distinction between the two categories of investments: MNC and expatriate. To capture MNC investment flows, we use FDI from the major countries investing in China and India. This gives us a panel of FDI inflow data from different source countries over a given period of time. Similarly, as explained earlier, we had to proxy expatriate investments into China by considering the main pockets of settlements of the Chinese Diaspora from where there have been substantial flows of investments into main land China. These countries are Hong Kong, Taiwan, Macau and Singapore. FDI flows from these countries might be taken to reflect the extent of expatriate FDI into China.1 For India, data on FDI by non-resident Indians (NRI) is directly available although it is not classified according to source countries. We therefore have a simple time series for NRI investments. There are multiple data sources for both China and India, which we have exploited. A detailed description of the data is presented in a subsequent section. X. The Econometric Model Specification FDI from a source country i at a given point of time t (Yit) is believed to be determined by a set of source specific factor (Xit) and host specific factors (Zt). Accordingly we posit the following panel model: (1) Yit = α + βit Xit + γt Zt + εit The vector Xit includes all supply side determinants of FDI flows from a specific source country i, primarily reflecting their macro environment stipulated by macro variables like interest rate, exchange rate, fiscal balance, inflation and so on. All of these can be captured by a summary measure of total FDI outflow from the source country. The vector Zt (capturing host country specific factors), as explained earlier, would vary according to the type of FDI (MNC or expatriate) for each of the two countries analyzed. As hypothesized above, MNC investment is likely to respond to the strength of domestic demand or market size and perhaps the low relative wage cost advantage enjoyed by the two countries under consideration. Expatriate FDI in China has essentially been a process of relocation of export oriented simple labor intensive manufacturing units from the neighbouring expatriate settlements into China. Flow of NRC investment can therefore be expected to respond to low Chinese wages relative to its neighbors and rapid
1 The inclusion of Singapore however was muting the results of our estimated model, perhaps
due to the fact that FDI from Singapore also contains a significant proportion of MNC investment into China. We therefore decided to exclude Singapore from our model of expatriate investments into China.

23
growth of manufactured exports. In addition, market size effect would also be included in our model specification. NRI investment in India while sensitive to export opportunities does not have a relocation aspect, unlike in China, and would therefore be modeled using the conventional wage cost and market size factors. Since NRI investment data is not classified according to source country, we have a simple time series model for this category: (2) Yt = α + γt Zt + εt In all models we include the time trends effects of FDI flows as well as possible structural breaks in the trend using intercept and slope dummies. XI The Data and Variables Dependent Variable (FDI Flows) China There are two data sources for FDI inflows into China: 1) China Statistical Yearbook (CSY) published by the State Statistical Bureau, China and 2) OECD’s International Direct Investment Statistical Yearbook (OECD). While the former gives FDI inflows into China from all major countries, the latter reports the same only from OECD countries. Thus we have only one data source (CSY) for expatriate Chinese investments from Hong Kong, Taiwan and Macau for the period 1983-97. But there are two independent data sources (CSY and OECD) for MNC investment flows. CSY data for MNC investment includes source countries like US, France, Germany, UK, Japan, Italy and Korea and covers the period 1983-97. OECD data includes investments into China from France, Germany, Netherlands, Sweden, Switzerland, UK, Korea, US, Italy and Japan and covers the period 1986-1996. Two observations are worth noting. First, there exist wide and random differences in the data from the two sources which cannot be attributed to any apparent or obvious reason. In fact the data from CSY source is by and large much more inflated compared to the OECD data. Other authors have also reported such discrepancy in data (see Shang-Jin Wei- 39). Secondly, Japanese FDI in China has been behaving somewhat erratically according to the OECD data. It correlates negatively with Japan’s total outflow of FDI. Therefore we decided to exclude Japan from our model estimation based on the OECD data. India There are three data sources for FDI in India: 1) Reserve Bank of India, Annual Reports (RBI), 2) OECD’s International Direct Investment Statistical Yearbook (OECD), and 3) Government of India’s Secretariat of Industrial Approval Newsletters (SIA). RBI provides data on NRI investment (aggregate) and MNC investment from US, Korea, Japan, Netherlands, Germany, UK, Hong Kong, Italy, Switzerland, Singapore and France. However, the period covered by RBI data is too short, 1992-97. OECD provides a longer time series (1986-96), but

24
only for MNC investment flows from France, Germany, Netherlands, Sweden, Switzerland, UK, Japan, Korea, US and Italy. The third data source SIA presents approvals as opposed to actual flows of investments. But it covers a longer time period, 1981-96. NRI investments approvals are given in aggregate terms while MNC investment approvals are given according to the following source countries: Singapore, China, Sri Lanka, Malaysia, Thailand, Hong Kong, Bahrein, Denmark, France, Germany, Italy, Japan, Netherlands, Norway, Sweden, Switzerland, UAE, UK, USA, Mauritius, Korea, Australia, Israel, Belgium, Canada, S.Africa. One might question the appropriateness of modeling FDI flows based on approvals data. But in so far as approvals reflect intentions to invest in India, it is legitimate to use this information to model the determinants of investment flows into India. The Explanatory Variables Source Specific Factors As stated above all source specific factors are captured by a summary measure of the total outflow of FDI from the source country (TOFDIit). The data is obtained from IMF’s International Financial Statistics Yearbook (IFS) for all source countries. Host Specific Factors: Market Size or Domestic Demand: This is captured by two variables: lagged GDP (GDPL) and the rate of growth of GDP (GRGDP) of the host country. GDPLt = GDPt-1
and GRGDPt = (GDPt – GDPt-1) / GDPt where GDP is the real GDP index obtained from the IFS and CSY (for China). Higher values of either of these would attract larger investment flows: the former (GDPL) through the simple demand (size) effect and the latter (GRGDP) through the acceleration principle. Relative Wage Cost Differential: This variable (WAGEDIF) is measured as the absolute wage differential between the host country and those of its neighbours which also attract considerable FDI. For instance, Chinese wages were compared with those of Hong Kong, while Indian wages were compared with Chinese wages. Wages of these countries were obtained in local currency from the Yearbook of Labor Statistics (ILO) and from ADB’s Key Indicators of Developing Asian and Pacific Countries. These were converted into SDR terms using exchange rates from IMF’s International Financial Statistics Yearbook. Manufactured Exports Growth: This was measured for China only. Lagged values of Chinese manufactured exports in current US dollars (MFEXPL) were obtained from ADB and WTO sources.

25
Trend and Dummies For all models we incorporated a simple time trend variable (t). For China, we used two time dummies, 1989 and 1992. The first one intends to capture the Tienanmen Square incident and the resultant slowdown in the process of FDI inflow into China. The second one reflects a leap forward towards further liberalisation of the Chinese economy. For India, we used a time dummy at 1992 to capture India’s policy break towards liberalisation and reforms. All dummies are used with respect to both the intercept and the slope of the time trend variable. XII The Econometric Methodology Our model (1) is a panel regression. This can be specified as either a Fixed Effects Model or a Random Effects Model. The former assumes that differences across cross sectional units (source-country, in our case) can be captured in differences in the constant term reflecting parametric shifts of the regression function for different units. The fixed effects model is thus specified as: (1a) Yit = αi + βit Xit + γt Zt + εit The random effects model, on the other hand, views individual specific constant terms to be randomly distributed across cross sectional units. This model is specified as: (1b) Yit = α + βit Xit + γt Zt + ui + εit We apply the Hausman χ2 to test for the presence of fixed versus random effects in our models. For the fixed effects specifications, we use the Least Squares Dummy Variables (LSDV) Model, while the random effects models are estimated using Feasible Generalized Least Squares Method, correcting for possible heteroscedastic errors and panel specific serial correlation. For our model equation (2), we apply OLS using robust methods to correct for possible heteroscedastic disturbances. We performed the Durbin-Watson test but failed to detect any presence of serial correlation. Before estimating the models, we obtained a matrix of correlation coefficients between the explanatory variable to rule out possible multicollinearity problems. In some cases we were constrained to include some of the variables separately to avoid multicollinearity. However, in the case of the China expatriate FDI model, the two principal determinants, WAGEDIF and MFGEXPL were highly correlated. Since both of these variables essentially jointly determine the extent to which expatriate FDI will be attracted into China, we calculated a principal component of the two variables (called WDMEL) which is then used as a regressor in our model. WDMEL is the first principal components of WAGEDIF and MFGEXPL, which explains 97.6% of the variation. The Results and Analysis The Chinese Expatriate Model: The correlation matrix for this model (Table 12) displays a serious multicollinearity problem between WAGEDIF and MFGEXPL

26
which are used together in the form of a principal component WDMEL. GDPL and the time variables are also highly correlated and had to be included separately. Table 13 reports the estimated regressions. The results confirm the relocation hypothesis for expatriate FDI in China. WDMEL is positive and highly significant in all specifications, suggesting that the combined effect of rising wage costs in neighbouring countries and rapid growth of manufactured exports led to massive inflow of NRC investments into China in the form of relocation of export oriented labor intensive manufacturing units.2 Interestingly, market size or domestic demand (particularly captured by GDPL) has also been positive and significant. This suggests that expatriate investment in China has also, at least in part, responded to the growing domestic Chinese market. The time trend variables display an overall negative trend with 1992 as a turning point for the level as well the slope of the function. This negative trend however disappears with the inclusion of the dummy at 1989 (model 2) which experienced a major slowdown. The NRI Model NRI investment flows are available in aggregate terms constituting a simple time series as opposed to a panel. The actual flows obtained from RBI sources were available only for 1992-97 and therefore could not be used for model estimation for lack of adequate data points. The NRI model was estimated with the approvals data from SIA. The correlation matrix (table 14) shows multicollinearity problems for GDPL, WAGEDIF and the time variables and they are applied separately. The results (table 15) show that low wage cost as well as domestic market size appear to be significantly attracting NRI investments into India. There is no significant time trend for this inflow, although there are positive signs of an upward shift of the function in 1992. The MNC Investment Model for China There is high degree of multicollinearity between WAGEDIF, GDPL and time variables (tables 16A & 16B), which are applied separately. The estimated models are reported in table 17. We must note that despite disparities between the data obtained from the two sources, the results of our econometric estimation are largely similar. Apart from the supply side determinant of TOFDI, the low wage cost advantage (WAGEDIF) and the strength of a large domestic market (GDPL) both appear to significantly attract MNC investments into China. From the trend and the time dummy variables, we find that although there was a downward shift of the inflow curve in 1989, from 1992 inflow has again taken off at higher pace as reflected in a
2 Each element of this principal component also appears positive and significant when applied
separately.

27
positive and significant slope dummy (TRDNT). To ascertain the relative importance of two host specific attractions (low wage cost versus large domestic market) for FDI, we estimated a model (see models 4 and 8 in table 17) incorporating all variables, notwithstanding the multicollinearity problem. We find that WAGEDIF is knocked out as a significant variable while GDPL continues to be positive and significant. It thus appears that it is the large Chinese market which proves to be more important than China’s lower relative wages in attracting MNCs. The MNC Investment Model for India The Indian data from OECD and SIA sources cover overlapping periods and the results obtained from these two data sets are almost identical. The correlation matrices (tables 18a,18b and 18c) indicate high multicollinearity of WAGEDIF with GDPL and time variables and GDPL with time variables. The estimated models in table 19 (models 1-6) show that TOFDI as well as the low Indian wages (WAGEDIF) and domestic market size (GDPL and GRGDP) are important determinants of MNC investment in India. We further observe a distinct rise in the pace of FDI inflow from 1992 with a positive and significant coefficient of the slope dummy at 1992 (TRDNT). The RBI data covers this period only (1992-97). The results from this data (table 19, models 7-9) reveal that FDI in the post 1992 period has been primarily driven by the supply side determinant of TOFDI with some weak indication of a positive time trend and a positive impact of GDPL. WAGEDIF is no longer significant. But GRGDP is (surprisingly) negative and significant, for which we do not have any obvious explanation.
Table 12 Correlation Matrix (Chinese NRC INV.-CSY Data)
gdp1 grgdep tr Den dnt Trdnt wdmel Gdp1 1.0000 Grgdp -0.1718 1.0000 0.2592 Tr 0.9763 -0.1724 1.0000 0.0000 0.2574 Den 0.7662 -0.3694 0.8504 1.0000 0.0000 0.0125 0.0000 Dnt 0.8481 0.2236 0.8504 0.6667 1.0000 0.0000 0.1397 0.0000 0.0000 Trdnt 0.9393 -0.0104 0.8528 0.5641 0.8461 1.0000 0.0000 0.9459 0.0000 0.0001 0.0000 Wdmel 0.3467 -0.0456 0.2948 0.1417 0.2355 0.3669 1.0000 0.1237 0.8443 0.1946 0.5402 0.3041 0.1018

28
Table 13
China Expatriate(CSY Data)
Model1a Model1b Model2 Model3 Specification: fgls,p(h) fgls,p(h)
c(psar1) Fe Fe
Dependent Variable: nrc(fdi) nrc(fdi) nrc(fdi) nrc(fdi) Independent Variables: Gdpl 3.695684 2.278801 z=4.863*** z=2.612*** Grgdp 28440.89 6588.839 z=1.874* z=0.567 Tr -442.205 -1142.17 t=1.068 t=2.466** Den -4579.96 t=2.347*** Dnt 3410.721 3459.704 t=2.039* t=-1.900* Trdnt 889.0398 t=1.730* Wdmel 4583.907 4591.855 9699.855 9037.278 z=11.553*** z=8.633*** t=6.908*** t=6.221*** Intercept -4972.55 701.9752 11696.79 13190.59 z=-2.051** z=0.279 t=3.539*** t=3.500*** R-Sq 0.7329 0.7588 Hausman Chi-Sq H(3)=5.36 H(3)=5.36 Wald Chi-Sq/F W(3)= 211.68*** W(3)= 94.30*** F(4,15)=
60.87*** F(4,15)= 52.94***
*=10% **=5% ***=1%
Table 14 Correlation Matrix (Indian NRI INV.-SIA Data)
wagedif Gdp1 Grgdp tr dnt Trdnt wagedif 1.0000 gdp1 0.9328 1.0000 0.0000 Grgdp 0.1304 0.0874 1.0000 0.7568 tr 0.9184 0.9936 0.1121 1.0000 0.0000 0.0000 0.6906 dnt 0.8536 0.7731 0.2256 0.7676 1.0000 0.00001 0.0007 0.4188 0.0008 trdnt 0.7903 0.7715 0.3317 0.7423 0.8864 1.0000 0.0005 0.0008 0.2271 0.0015 0.0000

29
Table 15
India Expatriate(SIA Data)
Specification: Model1 Model2 Model3 Ols Ols ols,robust Dependent Variable: Nri(fdi) nri(fdi) nri(fdi) Independent Variables: Wagedif 158.2839 t=5.020*** Gdpl 2.205797 t=3.644*** Grgdp 6965.044 13445.26 t=0.290 t=0.464 Tr 11.29791 t=1.620 Den Dnt 5872.805 t=1.845* Trdnt 248.0021 t=0.294 Intercept 3757.317 -8863.859 62.268 t=2.388** t=-2.831*** t=1.493 R-Sq 0.6327(adj) .4593(adj) 0.8507 Hausman Chi-Sq Wald Chi-Sq/F F(2,12)= 13.06*** F(2,12)=
6.95*** F (3,11)= 20.89***
*=10% **=5% ***=1%
Table 16a Correlation Matrix (Chinese MNC INV.-CSY Data)
wagedif Tofdi Gdp1 Grgdp Tr Trdnt den Wagedif 1.0000 Tofdi 0.4528 1.0000 0.0000 Gdp1 0.9763 0.4703 1.0000 0.0000 0.0000 Grgdp -0.1886 -0.1718 1.0000 0.0540 0.0797 Tr 0.9725 0.4699 0.9763 -0.1724 1.0000 0.0000 0.0000 0.0000 0.0786 Trdnt 0.9858 0.4364 0.9743 -0.0546 0.9515 1.0000 0.0000 0.0000 0.0000 0.5803 0.0000 den 0.8209 0.3994 0.7662 -0.3694 0.8504 0.7746 1.0000 0.0000 0.0000 0.0000 0.0001 0.0000 0.0000

30
Table 16b Correlation Matrix (Chinese MNC INV.-OECD Data, Without Japan)
wagedif tofdi Gdp1 grgdp tr Trdnt den Wagedif 1.0000 Tofdi 0.2971 1.0000 0.0028 Gdp1 0.9570 0.3118 0.0000 0.0017 1.0000 Grgdp 0.3114 0.0221 0.2362 1.0000 0.0017 0.8277 0.0186 Tr 0.9923 0.3083 0.9715 0.2888 1.0000 0.0000 0.0019 0.0000 0.0037 Trdnt 0.8818 0.2859 0.9662 0.3164 0.8922 1.0000 0.0000 0.0041 0.0000 0.0014 0.0000 den 0.7873 0.2426 0.6601 -0.1189 0.7746 0.4712 1.0000 0.0000 0.0155 0.0000 0.2412 0.0000 0.0000
Table 17
China MNC(CSY Data) China MNC(OECD Data)
Model1 Model2 Model3 Model4 Model5 Model6 Model7 Model8
Specification:
fgls,p(h) fgls,p(h) fgls,p(h) fgls,p(h) c(psar1)
fgls,p(h) c(psar1)
fgls,p(h) c(psar1)
fgls,p(h) fgls,p(h) c(psar1)
Dependent Variable:
fdi fdi Fdi fdi fdi fdi fdi fdi
Independent Variables:
Wagedif 1.171727 0.6617997 0.4041637 0.1098075
z=3.766*** z=1.691* z=4.025*** z=0.445
Tofdi 0.0238111 0.0230531 0.0244256 0.006764 0.0043559 0.0030557 0.005062 0.0035645
z=8.560*** z=8.527*** z=10.359*** z=3.805*** z=4.293*** z=2.993*** z=5.156*** z=3.726***
Gdpl 0.343263 1.494747 0.1725492 0.3853194
z=4.519*** z=8.569*** z=6.756*** z=6.097***
Grgdp 2061.733 2878.891 -860.3288 1147.16 173.0969 236.1003 -498.2794 494.4692
z=1.240 z=1.727* z=-0.503 z=2.881*** z=0.897 z=1.190 z=1.142 z=2.417***
Tr -82.73123 -183.1776 5.670247 -45.84914
z=-1.696* z=-6.506*** z=0.290 z=-2.633***
Trdnt 245.8622 58.63861
z=4.409*** z=2.697***
Den -422.1466 -71.53631
z=-1.958** z=-0.966
Intercept -910.3536 -1021.622 184.8947 -1363.829 -176.7411 -277.5155 13.74709 -537.5907
z=-3.702*** z=-4.154*** z=.0627 z=-8.621*** z=-2.962*** z=-5.290*** z=0.355 z=-5.505***
R-Sq
Hausman Chi-Sq H(3)=0.63 H(3)=0.61 H(5)=0.36 H(5)=0.38 H(3)=1.21 H(3)=0.44 H(5)=0.63 H(5)=0.66
Wald Chi-Sq/F W(3)= 143.92***
W(3)= 161.74***
W(3)= 259.34***
W(3)= 236.22***
W(3)= 46.83***
W(3)= 88.90***
W(3)= 194.58***
W(3)= 157.65***
*=10% ***=1%
**=5%

31
Table 18A
Correlation Matrix (Indian MNC Inv.-OECD Data, With Japan) tofdi Wagedif gdp1 grgdp tr dnt trdnt Tofdi 1.0000 wagedif 0.2275 1.0000 0.0228 gdp1 0.2693 0.9441 1.0000 0.0044 0.0000 grgdp 0.1070 0.0799 0.1544 1.0000 0.2660 0.4296 0.1073 Tr 0.2640 0.9667 0.9904 0.1821 1.0000 0.0053 0.0000 0.0000 0.0569 dnt 0.1797 0.8553 0.8123 0.2746 0.8660 1.0000 0.0603 0.0000 0.0000 0.0040 0.0000 Trdnt 0.2314 0.7902 0.9012 0.3852 0.8922 0.8429 1.0000 0.0150 0.0000 0.0000 0.0000 0.0000 0.0000
Table 18b Correlation Matrix (Indian MNC Inv.-SIA Data)
tofdi Wagedif gdp1 grgdp tr dnt trdnt Tofdi 1.0000 Wagedif 0.2855 1.0000 0.0000 gdp1 0.3102 0.9417 1.0000 0.0000 0.0000 Grgdp 0.0951 0.0849 0.1708 1.0000 0.0816 0.1194 0.0005 Tr 0.3081 0.9366 0.9909 0.1808 1.0000 0.0000 0.0000 0.0000 0.0002 Dnt 0.2268 0.8492 0.8099 0.2783 0.8044 1.0000 0.0000 0.0000 0.0000 0.0000 0.0000 Trdnt 0.2484 0.7849 0.8326 0.3722 0.7840 0.8693 1.0000 0.0000 0.0000 0.0000 0.0000 0.0000 0.0000

32
Table 18c Correlation Matrix (Indian MNC Inv.-RBI Data)
Tofdi Wagedif gdp1 grgdp tr tofdi 1.0000 wagedif 0.1168 1.0000 0.4730 gdp1 0.2407 0.6401 1.0000 0.0663 0.0000 grgdp 0.0053 0.1796 0.0894 1.0000 0.9682 0.2434 0.4754 tr 0.2377 0.6450 0.9911 0.1947 1.0000 0.0699 0.0000 0.0000 0.1173
Table 19
India MNC(OECD Data) India MNC(SIA Data) India MNC(RBI Data) Model1 Model2 Model3 Model4 Model5 Model6 Model7 Model8 Model9
Specification:
fe fe Fgls,p(h) Fe fe fe fe fe fe Dependent Variable:
fdi fdi Fdi Fca fca fca fdi fdi fdi
Independent Variables:
Tofdi 0.0009833
0.0008674
0.0019066
0.0115040
0.01572 0.0166285 0.0020592 0.0051928 0.0051388
t=2.343*** t=1.734* z=7.787***
t=9.516*** t=12.118*** t=14.022*** t=2.208*** t=3.811*** t=3.796***
Wagedif 1.256561 1.551724 1.885977 t=4.297*** t=2.505*** t=1.038 Gdpl 0.039658
1 0.0220959 0.0400259
t=6.844*** t=2.286*** t=1.719* Grgdp 325.8088 438.8647 -117.9933 878.0175 981.7763 -394.9442 793.4022 -1581.16 -1822.682 t=1.927** t=2.156** z=-0.632 t=2.236*** t=2.195** t=-0.896 t=1.474 t=-2.011** t=-2.303** Tr -4.759299 -17.08796 17.28084 z=-1.480 t=-4.684*** t=1.794* Dnt -14.62867 -18.20847 z=-0.929 t=-0.451 Trdnt 32.59999 82.07616 z=5.965**
* t=6.905***
Intercept 5.066042 -205.6775 8.264798 -59.43762 -209.2729 43.76634 -65.42457 -203.0469 4.863106 t=0.398 t=7.026*** t=0.453 t=-2.162** t=-4.435*** t=1.213 t=-2.017** t=-1.522 t=0.087 R-Sq 0.4279 0.4862 0.4003 0.4419 0.5059 0.6763 0.6049 0.6087 Hausman Chi-Sq H(5)=5.00 Wald Chi-Sq/F F(3,87)=
14.24*** F(3,97)= 28.83***
W(5)= 208.23***
F(3,248)= 53.12***
F(3,311)= 84.30***
F(5,309)= 74.48***
F(3,18)= 6.62***
F(3,32)= 17.52***
F(3,32)= 17.73***
*=10% **=5% ***=1%

33
XIII Conclusion The two Asian giants, China and India, after living long years in splendid isolation, disdainful of foreign goods and capital, have in recent decades thrown their doors wide open to both. China’s isolation had been the more profound. However, her policy reversal came a decade earlier and was the more radical and complete (at least in respect of foreign direct investment). India’s reforms began in 1991; and FDI has now been welcomed by all Indian policy-makers, regardless of their political affiliations, though the rhetoric of economic chauvinism continues to be sustained by the rank and file of most political parties as well as by major segments of domestic business. It is still perhaps premature to generalize about India. Yet on the basis of evidence to date, some interesting parallels have emerged in the responses of FDI to the opening up of the two economies. So have some striking contrasts. In both countries, investment by large transnational corporations has been primarily oriented to the domestic market and to infrastructure development; and in both, TNC investment responses have been delayed, though, at least in China, they have by now acquired substantial momentum. As against these similarities, there is a striking difference in the role of the expatriate in these two countries. While the overseas Chinese have dominated the inflow of FDI into China, the non-resident Indian has figured only marginally in FDI in India. Indeed, it is this disparity which primarily accounts for the vast discrepancy in FDI volumes between India and China. The time-profiles of OECD investment in the two countries are not radically different (after taking into account the difference in the dates of exposure to the outside world). But the volumes of expatriate investment differ astronomically. What explains India’s abysmal failure to tap NRI investment? One theory attributes it to the risk-averse character of the typical NRI – usually salaried professionals in the West or wage-earning labour in the mid-East – as against the mercantile, entrepreneurial character of the Chinese Diaspora. However, the NRI community also has its share of entrepreneurs – from the tycoons of the West, the Mittals, the Hindujas, the Pauls, the Bagris etc. to the Gujaratis of East Africa, the Chettiyars of Southeast Asia and the Sindhis of Hong Kong. What distinguishes them qualitatively from the expatriate Chinese entrepreneurs is the lack, by and large, of a learning process in the management of export production with low-wage labour. Taiwan, Hong Kong and the Southeast Asian Chinese passed through such a learning experience in the 1960’s and 1970’s. The evidence we have presented bears out the crucial role of this factor in explaining the differences between India and China in this regard. A question of some importance remains. How significant were policy differences between India and China in shaping the differential response of the expatriate? The Chinese FDI policy regime, like Chinese economic policy generally, has been more decentralized: the small foreign investor (primarily the expatriate) has exploited this fact to side-step the red tape of the central and provincial bureaucracies by investing in local small-scale industry. Upto a limit, this is permissible without elaborate sanctions from the central and provincial

34
governments. The consequent savings in time and unpaid bribes are large enough to be a major inducement to invest for the small overseas Chinese businessman. No comparable inducement exists in India for the non-resident Indian investor, who must run the gauntlet of the central, state and local authorities. However, the introduction of automatic approvals within 90 days for investments below $2 million in basic and capital goods industries or 100% export-oriented units has minimized this problem. The policy advantage of China, if any, is the unintended consequence of an anarchic dispersion of power which began with the Cultural Revolution. It is not a deliberately designed device. One cannot, for instance, plausibly argue that the larger inflow of FDI into China reflected the generally greater receptivity of the Chinese government to foreign capital. Innumerable examples exist of the central government seeking to force foreign investors into joint ventures with loss-making state-owned enterprises, essentially as rescue packages for the latter. Foreign investment approvals have been increasingly linked to high technology content, location in backward areas, promised indigenisation of supply sources and the like. Official decisions suddenly reversed, agreements abruptly cancelled are no less common in China than in India, the Enron, Cogentrix and Tata-Singapore Airlines fiascos notwithstanding. Corruption is a widespread to foreign investment in India, but hardly less so than in China (particularly to MNC’s unschooled in the arts of guanxi). Indeed, Transparency International’s rating of corruption levels in the two countries is strikingly similar(3.75 for India as against 3.88 for China on the Transparency International 1997 index for immunity to corruption). Judicial intervention against foreign investment is more common in India, but this may well be offset by the greater transparency and codified character of Indian law with its close links to Anglo-Saxon legal tradition. Harvard economist Shang–jin Wei has argued that Hong Kong’s investments in China should not really be considered as FDI, that OECD investments in China have been grossly inflated in Chinese official statistics and that OECD data on capital outflows to China are more reliable. Once these corrections are made, the only puzzle that remains is the one propounded in the title of Shang’s paper “Why does China attract so little foreign direct investment?” given its GDP, wages and other economic parameters. Shang’s solution to this puzzle lies in the deterrent force of China’s red tape and corruption. Much the same could be said of India – so that the disparity between the two countries cannot be accounted for by such factors. What kind of a perspective for the future is foreshadowed by our analysis of the past? First, in both China and India, rapid growth of GNP and the domestic market is likely to continue, sustaining the incentive to invest of the MNC. In China, this may be threatened by the political consequences of an explosion of unemployment as the overmanned state-owned enterprises are restructured. This may temper the hectic recent pace of growth and foreign investment down to more moderate levels. On the other hand, India, with her new-found political stability, could well be poised for a surge of multi-national FDI somewhat similar to what China experienced from 1992 onwards. A crucial factor here may be the positive signals on reform emanating from the new government. Fortunately for the believers in reform, the reformist signals are not just a reflection of the pious

35
intentions of the government but of its lack of other options: thanks to the bankruptcy of the state precipitated by the instability and consequent indecisiveness and populism of the last three years, major reforms (eg. privatization of public enterprises and cuts in subsidies) have become inescapable. This could well trigger an FDI boom. Second, given the high elasticity of labour supply in both countries, wages will continue to be well below world levels, encouraging investment in labour-intensive manufacturing for export. But China’s advantage in the supply of expatriate capital to this sector will probably persist for two reasons: (a) the acquired skills of the Chinese diaspora, (b) the fifty year-old Indian policy of reservation of the most important labour-intensive products for small (or, more precisely, tiny) industries, thus decimating the textile industry, the cutting edge of export-oriented growth in the rest of the labour-abundant world. Third, India has however one area of distinct advantage. Thanks to her colonial past and her extensive university system, she has transformed some of her low-wage labour into cheap human capital with some knowledge of English: in software and information services, this is an immeasurable asset. So both NRI’s and MNC’s have an incentive to invest in India in what promise to be the major growth industries of the millennium. In fact, this is one of the few areas in which the NRI is the beneficiary of a learning process appropriate to India thanks to the proliferation of Indian engineers and entrepreneurs in the Silicon Valley. Perhaps, cyberspace will be the main focus of FDI, both by MNC’s and NRI’s, in India over the next decade.

36
Bibliography Aliber, R.Z (1970) : “A Theory of Direct Foreign Investment” in C.P.Kindleberger (ed)-The International Corporation : A Symposium, Cambridge Mass; MIT Press Aliber, R.Z (1971). : “The Multinational Enterprise in a Multi-Currency World” in Dunning (ed)-The Multinational Enterprise, London; Allen and Unwin Aliber, R.Z. (1983) : “Money, Multinationals and Sovereigns” in C.P.Kindleberger & D.B.Audretsch (ed)- The Multinational Corporations in the 1980s, Cambridge Mass; MIT Press Baldinger, P (1992) : “The Birth of Greater China”, China Business Review, May-June. Buckley,P.J & M.Casson (1976): Future of Multinationals, London; Macmillan Buckley,P.J & M.Casson (1995): The Economic Theory of the Multinational Enterprise, London; Macmillan Caves, R.E. (1980): “Investment and Location Policy of the Multinational Companies”, Zeitschrift fur Volkswirtschaft und Statistik Caves, R.E. (1982) : Multinational Enterprises and Economic Analysis, Cambridge; Cambridge University Press Caves, R.E. (1971) “International Corporations: the Industrial Economics of Foreign Investment”, Economica 38, Feb. Caves, R.E. (1974) : “International Trade, International Investment and Imperfect Markets”-Special Papers in International Economics No. 10 (Princeton, International Finance Section; Princeton University) Dunning, J.H. (1988) : Multinationals, Technology and Competitiveness, Unwin Hyman, Dunning, J.H. (1974) : Economic Analysis and the Multinational Enterprise, Allen and Unwin Dunning, J.H. (1971) : The Multinational Enterprise, Allen and Unwin Dunning, J.H. (ed) (1993)-The Theory of Transnational Corporation, vol I-IV, United Nations Library on TNCs Fields, G (1984): “Employment, Income Distribution and Economic Growth in Seven Small Open Economies”, Economic Journal Hymer, S. : “The Efficiency (Contradictions) of Multinational Corporations”, AER 60 May.

37
Hymer, S. (1976). : The International Operation of National Firms : A Study of Direct Investment, Ph.D. Thesis, Cambridge Mass; MIT Press Kindleberger, C.P. (1969): American Business Abroad: Six Lectures on Direct Investment, New Havens; Yale University Press. Kindleberger, C.P. (1969) : Foreign Trade and the National Economy, New Havens; Yale University Press. Kindleberger, C.P. (1974) : “Size of the Firm and Size of the Nation” in J.H. Dunning (ed)-Economic Analysis and the Multinational Enterprise, Praeger; New York. Knickerbocker, F.T. (1973) : Oligopolistic Reaction and Multinational Enterprise, Cambridge Mass; MIT Press. Kojima, K. (1978) : Direct Foreign Investment, London; CroomHelm. Kojima, K. (1978) : Direct Foreign Investment: A Japanese Model of Multinational Business Operations, Beckenham; Croomhelm. Kojima, K. (1990): Japanese Direct Investment Abroad, International Christian University; Mitaka, Tokyo. Monograph Series I. Lall, S. (1979) : “Developing Countries As Exporters of Technology: A Preliminary Analysis” in H.Giersch(ed)-International Development and Resourse Transfer, Tubingen: Mohr. Lall, S. and P.Streeten (1977) : Foreign Investment, Transnationals and Developing Countries, London and Basingstoke; Macmillan. Lardy, N. (1992) : “Chinese Foreign Trade”, The China Quarterly, 131,Sepetmber. Levor-Tracy, C., D. Ip and N. Tracy (1992): The Chinese Diaspora and Mainland China, Macmillan; London. Lim, L.Y.C. (1990): “The Experience of Singapore” in S. Herzenberg & J.E. Perez-Lopez (ed)- Labor Standards and Development in the Global Economy. Scitovsky, T (1986) : “Economic Development in Taiwan and South Korea, 1965-1981” in L.J.Lau (ed)- Models of Development, ICS Press; San Francisco. Siddharthan, N.S. (1981): Conglomerates and Multinationals in India: A Study of Investment and Profit, New Delhi; Allied. Sun, Haishun (1998): Foreign Investment and Economic Development in China: 1979-1996, Aldershot; Ashgate.

38
Vernon, R.P (1966): “International Investment and International Trade in the Product Cycle”, Quarterly Journal of Economics 80,May. Vernon, R.P. (1970) : “Future of the Multinational Enterprise” in C.P. Kindleberger (ed)-The International Corporation, Cambridge Mass; MIT Press. Vernon, R.P. (1974) : “The Location of Economic Activity” in J.H. Dunning (ed)- Economic Analysis and Multinational Enterprise, London; Allen and Unwin. Vernon, R.P. (1971) : “The Economic Consequences of US Foreign Direct Investment”, United States International Economic Policy in an Independent World, Paper I, Washington D.C., July. Vernon (1997): Storm Over the Multinationals-The Real Issues, London; Macmillan. Wade, R. (1990): Governing the Market, Princeton University Press; Princeton. Wei,Shang-jin (1998): “Why Does China Attract So Little Foreign Direct Investment?”, Paper written for NBER-EASE conference at Osaka, June Wells, L.T.(Jr.) (1983) : Third World Multinationals-The Rise of Foreign Investment from Developing Countries, MIT Press. You, J.II (1990): “The Experience of South Korea” in S. Herzenberg & J.E. Perez-Lopez (ed)- Labor Standards and Development in the Global Economy.