multiphase screen development
TRANSCRIPT

Montana Tech LibraryDigital Commons @ Montana Tech
Honors Theses Student Scholarship
Spring 2013
Multiphase Screen DevelopmentChris TarrantMontana Tech
Follow this and additional works at: http://digitalcommons.mtech.edu/honors_theses
Part of the Mechanical Engineering Commons
This Honors Thesis is brought to you for free and open access by the Student Scholarship at Digital Commons @ Montana Tech. It has been acceptedfor inclusion in Honors Theses by an authorized administrator of Digital Commons @ Montana Tech. For more information, please [email protected].
Recommended CitationTarrant, Chris, "Multiphase Screen Development" (2013). Honors Theses. 1.http://digitalcommons.mtech.edu/honors_theses/1

Multiphase Screen Development
AbstractThis honors thesis research project was the study and development of a compact separation device for the oiland gas industry involving a multiphase cylindrical screen filter. Cylindrical screens can be used for solidsremoval in multiphase flow in upstream oil and gas applications. This study focused on cylindrical wire-wrapscreen test unit design and performance characterization to determine volumetric flow rate and pressure dropcorrelations.
The project goals were met with research, test unit design, CFD modeling, calculations, and physical testing.The comprehensive testing will take place during the summer of 2013 and is planned to consist of building thedesigned flowloop and housing and using high capacity pumps to achieve higher flow rates. Multiphase testingwill be performed with water, air, and sand particles and flow and pressure effects will be evaluated for solidsfiltering over time.
Keywordsseparation device, oil and gas industry, multiphase cylindrical screen filter
DisciplinesMechanical Engineering
CommentsProject Mentor: Hank Rawlins, Ph.D., Technology Director, eProcess Technologies; Project Advisor: DavidBunnell, Ph.D., General Engineering Department, Montana Tech.
Creative Commons License
This work is licensed under a Creative Commons Attribution-Noncommercial-No Derivative Works 3.0License.
This honors thesis is available at Digital Commons @ Montana Tech: http://digitalcommons.mtech.edu/honors_theses/1

MONTANA TECH OF THE UNIVERSITY OF MONTANA
Multiphase Screen Development
Honors Thesis Research, Fall 2012 and Spring 2013
Chris Tarrant
General Engineering - Mechanical May 10th, 2013

1
Table of Contents Introduction .................................................................................................................................................. 2
Background ................................................................................................................................................... 2
Requirements ........................................................................................................................................ 3
Approach ............................................................................................................................................... 3
Research ........................................................................................................................................................ 3
Screen Types ......................................................................................................................................... 3
Multiphase Flow Behavior .................................................................................................................... 4
Multiphase Screen Performance .......................................................................................................... 5
Testing Methods ................................................................................................................................... 6
Test Unit Design ............................................................................................................................................ 6
Housing and Flow Loop ............................................................................................................................. 7
Screen Selection ........................................................................................................................................ 8
Cost and Parts ........................................................................................................................................... 9
CFD Model and Simulations .......................................................................................................................... 9
CFD Results .......................................................................................................................................... 10
Mechanistic Calculations ............................................................................................................................ 13
Initial Lab Testing ........................................................................................................................................ 17
Testing Results ........................................................................................................................................ 19
Conclusions ................................................................................................................................................. 20
References .................................................................................................................................................. 22
Appendix ..................................................................................................................................................... 24
2
Introduction
This honors thesis research project is the study and development of a compact separation device for the oil and gas industry involving a multiphase cylindrical screen filter. Cylindrical screens can be used for solids removal in multiphase flow in upstream oil and gas applications. This study focuses on cylindrical wire-wrap screen test unit design and performance characterization to determine volumetric flow rate and pressure drop correlations.
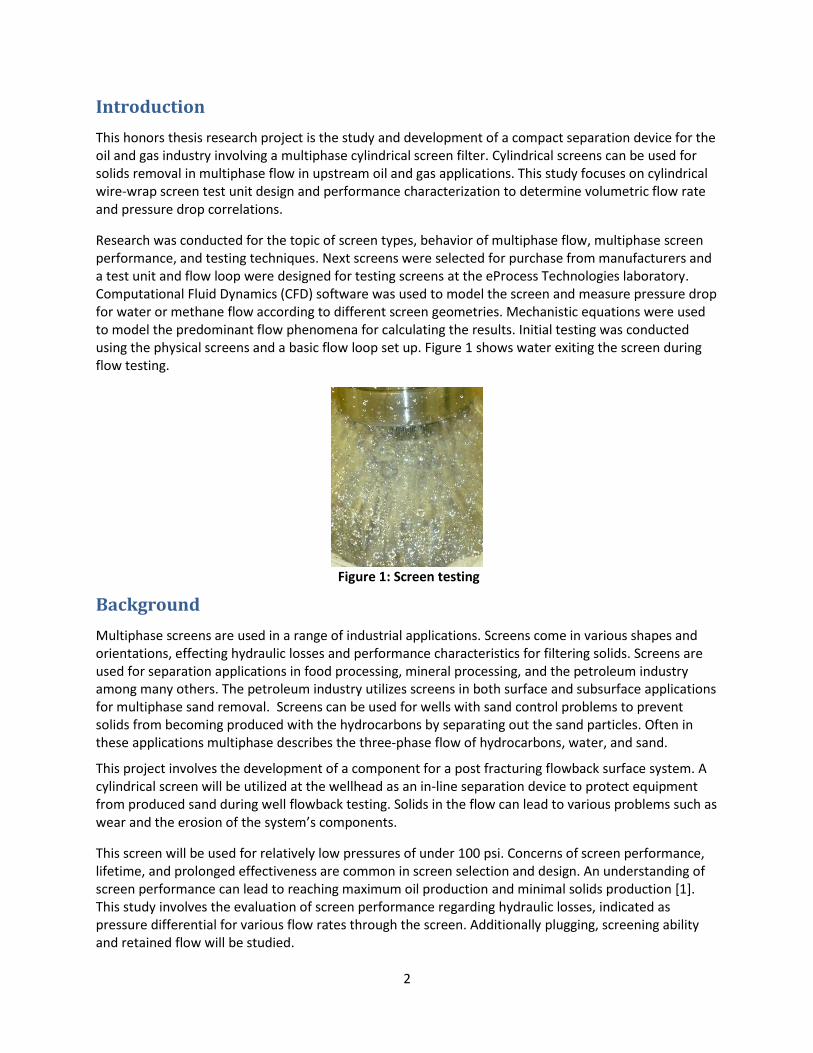
Research was conducted for the topic of screen types, behavior of multiphase flow, multiphase screen performance, and testing techniques. Next screens were selected for purchase from manufacturers and a test unit and flow loop were designed for testing screens at the eProcess Technologies laboratory. Computational Fluid Dynamics (CFD) software was used to model the screen and measure pressure drop for water or methane flow according to different screen geometries. Mechanistic equations were used to model the predominant flow phenomena for calculating the results. Initial testing was conducted using the physical screens and a basic flow loop set up. Figure 1 shows water exiting the screen during flow testing.
Figure 1: Screen testing
Background
Multiphase screens are used in a range of industrial applications. Screens come in various shapes and orientations, effecting hydraulic losses and performance characteristics for filtering solids. Screens are used for separation applications in food processing, mineral processing, and the petroleum industry among many others. The petroleum industry utilizes screens in both surface and subsurface applications for multiphase sand removal. Screens can be used for wells with sand control problems to prevent solids from becoming produced with the hydrocarbons by separating out the sand particles. Often in these applications multiphase describes the three-phase flow of hydrocarbons, water, and sand.
This project involves the development of a component for a post fracturing flowback surface system. A cylindrical screen will be utilized at the wellhead as an in-line separation device to protect equipment from produced sand during well flowback testing. Solids in the flow can lead to various problems such as wear and the erosion of the system’s components.
This screen will be used for relatively low pressures of under 100 psi. Concerns of screen performance, lifetime, and prolonged effectiveness are common in screen selection and design. An understanding of screen performance can lead to reaching maximum oil production and minimal solids production [1]. This study involves the evaluation of screen performance regarding hydraulic losses, indicated as pressure differential for various flow rates through the screen. Additionally plugging, screening ability and retained flow will be studied.

3
Requirements
The design requirements and constraints are shown below for both the test unit and screens. Test unit:
Instrumentation to monitor flow rate and pressure drop across the screen
Housing must hold screens of 1 to 2 m in length
Accessibility to the inside of housing to change out screens
Screens must seal at both ends
All parts selected for low cost Screens:
Screen 3" nominal diameter, or smallest possible
Screening length of 1 meter (39") plus ends
NPT end fittings
Screen constructed of 304 stainless steel
Screen mesh: one screen at 150 micron opening (100 mesh), one screen at 300 micron opening (48/50 mesh)
Wedge wire screen construction
Axially-aligned screen slot openings
Flow pattern of inside to outside
Approach
The Fall 2012 semester consisted of reviewing technical papers, designing a test unit, and generating a computer model and running simulations with CFD. The Spring 2013 semester involved calculating results mechanistically and comparing the results with the experimental data from laboratory testing. This research focuses primarily on screen performance and characterizing pressure differential for various geometries, determined by screen opening size and overall length.
Research
Research was conducted to learn about common screen types, behavior of multiphase flow, screen performance evaluation, and testing procedures. Technical papers were reviewed from sources including the Society of Petroleum Engineers (SPE), Journal of Mass and Heat Transfer, and Journal of Fluids Engineering. The documents discuss topics related to screen selection, performance, and hydraulic resistance characteristics. Additionally, flow loop and filter designs from eProcess Technologies Malaysia were reviewed to gather ideas for designing the test unit.
Screen Types
Screens come in different types with variations in construction and orientation. Oil and gas industry screen applications generally utilize profile wire-wrap screens or premium, mesh-type screens. Mesh-type screens consist of wires woven together and can be plain or twill patterns in square, fourdrinier, or Dutch weaves [2]. Profile wire-wrap screens, commonly known as wedge wire or V-wire, consist of triangular-shaped rods. Different weaves and opening sizes produce different amounts of pressure drop due to hydraulic loss by resistance to flow.

4
Figure 2 shows examples of mesh-type and wire-wrap screens.
Figure 2: Mesh-type (L) [2] and wire-wrap (R) [3] screens.
The performance of woven-type and wire-wrap screens varies considerably. Wire-wrapped screens have a reputation of being susceptible to plugging [4]. Mesh-type screens are also better than wire-wrap screens for sand retention [5]. Screen opening orientation must be taken into consideration for design and testing of multiphase screens.
Wire-wrap screens have either radial or axial slot orientation and are designed for inside-to-outside or outside-to-inside flow patterns. Water wells commonly use cylindrical screens downhole to filter out solids from the formation. This screen is similar to a water well screen, except the screen orientation is designed for inside-to-outside flow, rather than for flow from outside-in. The screens are designed with the orientation of the wire toward the direction of flow, with the flat side of the wire facing the flow to filter out particles. Figure 3 shows the direction of flow approaching the screen.
Figure 3: Wire-wrap screen orientation [6].
Multiphase Flow Behavior
Multiphase flow is the incidence of two or more phases interacting with each other and moving as a fluid. Multiphase flow describes combinations of the solid, liquid, or gas phases. Multiphase flow is often water or brine with sand particles, containing oil and dissolved gas. Separation of the phases is often a concern for multiphase flow, for example when solids are not desired. For separation applications several losses result from the screen, interrupting normal flow patterns. For screens, resistance of flow can be determined by viscous and inertial or kinetic loss components [7]. Viscous drag results from skin friction at the surface of the screen wires or from form drag. At high flow rates, viscous drag can be considered negligible. Inertial losses result from turbulent eddies and the losses from sudden enlargement and contraction of channel cross section of flow [8]. Boundary layer wall effects can also occur when the ratio of test chamber diameter to bed particle diameter is small.

5
This ratio must be large so these effects do not interfere with the resistance measurement through a packed bed or screen [9]. Darcy’s equation can be used to calculate pressure drop for porous material, in this case the screen or sandpack. Equations have been developed experimentally for correlating pressure drop and permeability across a flat, mesh-type screen for gas flow [10]. Darcy’s Law is shown in equation 1 below.
𝑄 =−𝑘𝐴
𝜇(
𝛥𝑃
𝐿) Equation 1
Where Q is flow rate, k is permeability of material, A is cross-sectional area, μ is the dynamic viscosity of fluid, ΔP is pressure differential, and L is length.
Multiphase Screen Performance
Screening particles from multiphase flow can lead to various phenomena that affect screen performance. The ultimate goal of screen filtering in petroleum applications is to achieve “acceptable solids retention with minimum loss in production” [5]. Screen performance can be evaluated by dirt-holding capacity and plugging tendency, which are impacted by particle size distribution [1]. The major concerns for screen performance are solids retention and screen plugging and permeability or retained flow capacity [11]. Solids retention is the measure of a screen’s ability to capture particles. Screen solids retention is found to be primarily due to the “population of particles larger than the screen openings” rather than due to the bridging of particles. The most particle retention occurs when screen the pore opening is smaller or equal to 2.5 times the median diameter of the median particle distribution (d50), for somewhat uniform sand size in mesh-type screens [5]. Screen performance testing is often carried out to find the value of maximum solids production or retained screen permeability. “Master curves” or performance curves can be created from lab testing for retained screen permeability versus a ratio of effective formation size divided by screen pore opening [12]. The maximum acceptable
amount of produced solids for oil wells is 0.12 𝑙𝑏𝑚
𝑓𝑡2 or 0.15 𝑙𝑏𝑚
𝑓𝑡2 for screen inflow area [5].
Effective solids retention should not be confused with plugging, and solids retention concerns are more relevant than plugging [5]. Nonetheless, the goal of screen performance is to prevent both plugging of the screen and sand production. Plugging can be said to occur when the pressure difference across the screen is more than twice as high as expected from the Darcy equation [4]. Plugging is less of a concern than pressure drop from buildup of sandpack [11].
Sand porosity and permeability refer to the particle’s properties of absorbing fluids or allowing fluids to pass through, respectively. Sand porosity and permeability properties are important because after time the sand is retained by the screen and the flow experiences resistance due to both the screen and due to the properties of the sandpack buildup. Sandpack buildup creates a pressure drop depending on the porosity of sand [11].To understand screen behavior retained filter porosity/permeability must be examined [1]. For particle flow, erosion can is a concern [5]. More about the evaluation of sand buildup effects are discussed in Testing Methods. Sand porosity (ϵ) can be equated using equation 2 with volume or area.
𝜖 =𝑉𝑎𝑖𝑟
𝑉 𝑡𝑜𝑡𝑎𝑙=
𝐴𝑎𝑖𝑟
𝐴𝑡𝑜𝑡𝑎𝑙 [13] Equation 2

6
For experiments, when back-calculating for the permeability of a sand from a measured pressure drop across the sandpack and screen, certain effects must accounted for. Maintaining linear Darcy Flow and linear Forchheimer flow these in lab tests will simplify the results and ensure correct measuring [4].
Testing Methods
For evaluating different screen types and quantifying multiphase separation performance, several common testing procedures can be carried out in a laboratory. The objectives for performance testing are to characterize solids retention and hydraulic resistance of the screen, which is measured as a pressure drop. The two most popular laboratory tests include the prepack test and slurry test. Prepack and slurry tests are two ways to analyze solids retention performance of screens in a laboratory setting. For the prepack test, sandpack is initially formed on the screen and water is flowed through at a set flow rate or pressure drop, and the solids that pass through the screen are collected. The slurry test involves pumping a slurry of less than 1% sand by volume through a screen at a given flow rate or pressure drop. It is most common to execute the slurry test by injecting sand at a constant rate into the flow upstream from a screen [5]. As solids build up behind a screen, the first layers of sand will have the convergence effects of the wire-wrap screen. If the test is continued, the pressure drop through the sandpack itself will govern local pressure gradient slope and pressure profiles. Sandpack a depth of 5 to 10 times the screen opening size is the transition for near-screen behavior and sandpack behavior for pressure drop. For sand layers under 5 to 10 times the screen opening size, the screen alone will primarily govern the pressure gradient. After sand depth of over 5 to 10 times the screen opening size has accumulated at the screen, the sandpack governs the pressure drop. Both situations should be tested to characterize screen performance. Tests should be run long enough for solids production to stop or stabilize [5].
A thin porous bed or section of packed bed containing glass particles can be used for simulating sandpack or screens. Studies of air flow resistance through crushed porous solids depends on factors of rate of fluid, viscosity and density of fluid, closeness and orientation of packing, and size, shape, and surface of particles [13]. For simulating a well’s flow behavior, two scenarios may be tested: low sand concentration and high sand concentration tests [11]. When installing instrumentation, suitable room must be left from the ends of the test section so pressure transducers do not pick up biased pressure data due to entrance and exit flow patterns [9].
Test Unit Design
A flow loop test unit will be assembled and used to evaluate the performance of several cylindrical screens, but is contingent upon funding. eProcess Technologies in Butte, MT supported this research and will provide a laboratory for testing.
Testing will occur in a high capacity pump flow loop configuration for evaluating screens, with a continuous flow through a test unit housing. The design of a flow loop and screen test unit housing, and screens were selected for purchase from manufacturers. Several preliminary flow loop designs were improved to create the final design. The major design challenges were to find clear PVC (polyvinylchloride) pipe and PVC fittings that are large enough for constructing a housing to surround
7
the screen, while selecting a screen that is small enough to fit within the housing. A parts list with costs was created for the test system design.
Housing and Flow Loop
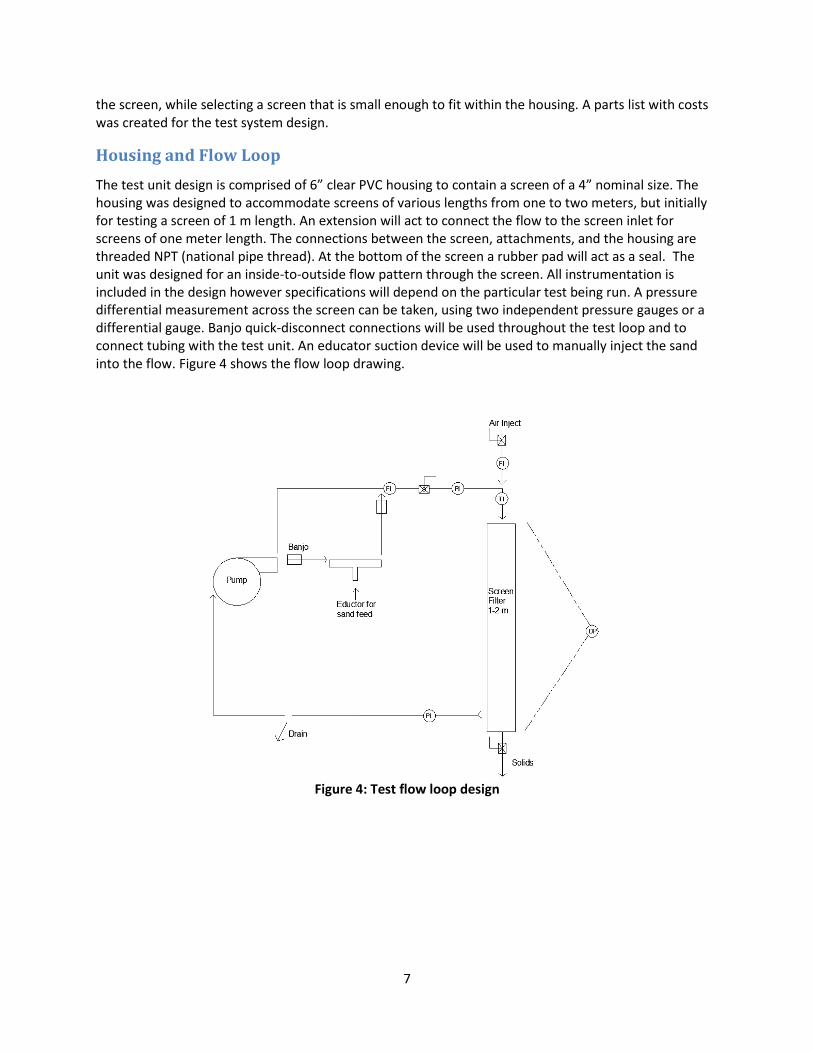
The test unit design is comprised of 6” clear PVC housing to contain a screen of a 4” nominal size. The housing was designed to accommodate screens of various lengths from one to two meters, but initially for testing a screen of 1 m length. An extension will act to connect the flow to the screen inlet for screens of one meter length. The connections between the screen, attachments, and the housing are threaded NPT (national pipe thread). At the bottom of the screen a rubber pad will act as a seal. The unit was designed for an inside-to-outside flow pattern through the screen. All instrumentation is included in the design however specifications will depend on the particular test being run. A pressure differential measurement across the screen can be taken, using two independent pressure gauges or a differential gauge. Banjo quick-disconnect connections will be used throughout the test loop and to connect tubing with the test unit. An educator suction device will be used to manually inject the sand into the flow. Figure 4 shows the flow loop drawing.
Figure 4: Test flow loop design

8
The housing design and construction specifications are shown in Figure 5.
Figure 5: Housing design for 6” test unit
Screen Selection
To select screens to test, product research was conducted and manufacturers were contacted for fabrication options and limitations. AMACS/Amistco, Delta Screens, Alloy Screen Works, and Johnson Screens were contacted regarding the fabrication and cost of these screens. Screen manufacturer research included looking into reverse-flow water well screens and custom oil and gas cylindrical wire-wrap screens, which are constructed from wedge-wire. The screen construction was to be axial slot screen with the wedge-wire flat side facing inside, toward the direction of flow for inside to outside flow pattern.
Three 1 m long screens of nominal 4” ID were selected in 600, 300, and 150 micron sizes from the manufacturer Johnson Screens. The screen meets all the design requirements except the nominal size specification. For a relatively small diameter screen size (under 8”), structural integrity may become an issue because the welds tend to break when forming the screen. It was found that producing these screen constructions requires special machines and advanced techniques. For this reason, the 3” nominal size requirement could not be met, and instead the small possible diameter was chosen.
9
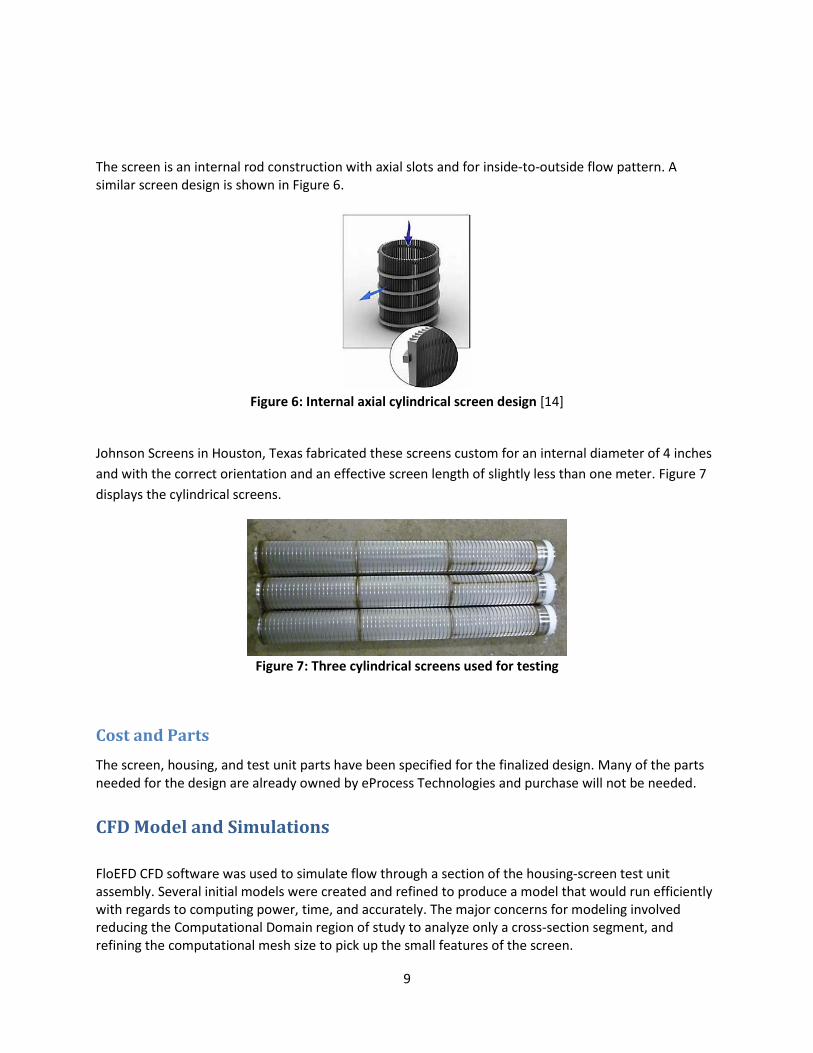
The screen is an internal rod construction with axial slots and for inside-to-outside flow pattern. A similar screen design is shown in Figure 6.
Figure 6: Internal axial cylindrical screen design [14]
Johnson Screens in Houston, Texas fabricated these screens custom for an internal diameter of 4 inches
and with the correct orientation and an effective screen length of slightly less than one meter. Figure 7
displays the cylindrical screens.
Figure 7: Three cylindrical screens used for testing
Cost and Parts
The screen, housing, and test unit parts have been specified for the finalized design. Many of the parts needed for the design are already owned by eProcess Technologies and purchase will not be needed.
CFD Model and Simulations
FloEFD CFD software was used to simulate flow through a section of the housing-screen test unit assembly. Several initial models were created and refined to produce a model that would run efficiently with regards to computing power, time, and accurately. The major concerns for modeling involved reducing the Computational Domain region of study to analyze only a cross-section segment, and refining the computational mesh size to pick up the small features of the screen.

10
Due to computational resources and run time concerns, the FlowEFD CFD simulations were modeled using cross-sections of 1/20th and 1/40th of the overall one meter screen length. Appendix Figures 1, 2, and 3 show the CFD model dimensions. The results were then plotted on curves for pressure drop versus flow rate and cylindrical screen sizes of 600, 300, and 150 microns with water-only flow. The screen geometry was modeled in CFD and shown in Appendix Figures 5, with the wedge-wire features drawn according to actual dimensions [15]. The analyses were set up to run at fine resolution and at a manual gap size slightly smaller than the slot size, depending on the screen size. The gap sizes were specified to be 0.02”, 0.01”, and 0.005”, for the 600, 300, and 150 micron sizes, respectively. The model was set up with ambient initial conditions of 25 °C and 1 atm. The boundary conditions included an inlet volumetric flow rate at the inside of the screen. A solid cap was modeled at the end of the screen. The outlet boundary condition was an environmental pressure of 1 atm at the annulus area, between the outside of the screen end and the inside of the housing. The model is shown in Figure 8 below. Notice the inlet and outlet boundary conditions are shown with the red and blue arrows, respectively.
Figure 8: CFD model with boundary conditions
CFD Results
The run times for CFD simulations ranged from 5 minutes to 1 hour. The mesh indicates that the refinement of computation exceeds the resolution of the small slot sizes, indicating that calculations properly account for the screen’s resistance to flow. Figure 9 shows both 3D the mesh pattern and mesh on a pressure plot.
Figure 9: Mesh displayed in CFD model

11
The results show that FloEFD correctly analyzed the model, indicated by the discrete pressure changes observed around the interface of the screen and water. The small pressure changes are displayed in the pressure cut plot in Figure 10.
Figure 10: Validating small model features
The resulting pressure differential was determined for the 600 micron, 300 micron, and 150 micron size screens for flow rates at several points varying from 10 to 200 GPM.
The results from the model sections were than scaled to the full meter length of the screen. The relationship between pressure drop and area was determined using the Bernoulli Equation. Equation 3 shows the Bernoulli Equation.
𝑃1 +1
2 𝜌 𝑉1
2 + 𝜌𝑔ℎ1 = 𝑃2 +1
2 𝜌 𝑉2
2 + 𝜌𝑔ℎ2 Equation 3
Simplifying the Bernoulli equation for the differential pressure yields the expression below in Equation 4.
𝑃 = 𝜌
2∗ (
𝑄
𝐴)
2 Equation 4
Using Equation 4 the relationship for scaling the results from 1/20th of a 1 meter screen can be found below.
𝐴1𝑚 = 20 ∗ 𝐴
Where 𝐴1𝑚 is the area for 1 meter length and A is the area of the 1/20th section. After substituting this into Equation 4 above, the resulting expression for the relationship between pressure drop, flow rate, and area if all other variables remain constant is shown below.
𝑃1𝑚 = (𝑄
𝐴1𝑚/20)
2
So it can be noted that to magnify the results from the 1/20th section to a full meter length, the flow rate must be multiplied by 20 or the pressure drop be divided by 400.
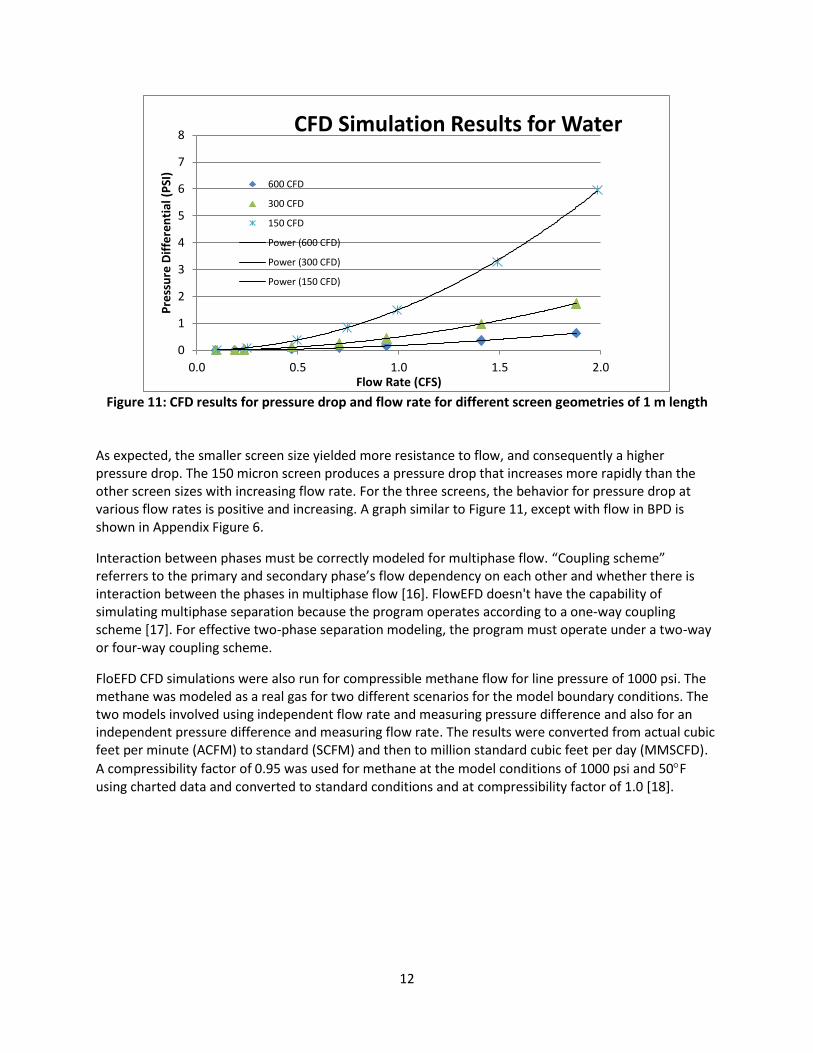
The results from plotting the pressure drop for different flow rates is summarized in the graph in Figure 11 on the next page characterizing performance for various screen geometries of 1 meter lengths.
12
Figure 11: CFD results for pressure drop and flow rate for different screen geometries of 1 m length
As expected, the smaller screen size yielded more resistance to flow, and consequently a higher pressure drop. The 150 micron screen produces a pressure drop that increases more rapidly than the other screen sizes with increasing flow rate. For the three screens, the behavior for pressure drop at various flow rates is positive and increasing. A graph similar to Figure 11, except with flow in BPD is shown in Appendix Figure 6.
Interaction between phases must be correctly modeled for multiphase flow. “Coupling scheme” referrers to the primary and secondary phase’s flow dependency on each other and whether there is interaction between the phases in multiphase flow [16]. FlowEFD doesn't have the capability of simulating multiphase separation because the program operates according to a one-way coupling scheme [17]. For effective two-phase separation modeling, the program must operate under a two-way or four-way coupling scheme.
FloEFD CFD simulations were also run for compressible methane flow for line pressure of 1000 psi. The methane was modeled as a real gas for two different scenarios for the model boundary conditions. The two models involved using independent flow rate and measuring pressure difference and also for an independent pressure difference and measuring flow rate. The results were converted from actual cubic feet per minute (ACFM) to standard (SCFM) and then to million standard cubic feet per day (MMSCFD).
A compressibility factor of 0.95 was used for methane at the model conditions of 1000 psi and 50F using charted data and converted to standard conditions and at compressibility factor of 1.0 [18].
0
1
2
3
4
5
6
7
8
0.0 0.5 1.0 1.5 2.0
Pre
ssu
re D
iffe
ren
tial
(P
SI)
Flow Rate (CFS)
CFD Simulation Results for Water
600 CFD
300 CFD
150 CFD
Power (600 CFD)
Power (300 CFD)
Power (150 CFD)

13
The CFD methane simulation results are summarized for each of the three screens using the two methods in Figure 12.
Figure 12: CFD methane results for 1 m long screen
Mechanistic Calculations
Mechanistic equation modeling of the predominant flow phenomena was carried out to approximate
results from the hydraulic losses in terms of pressure differential for various flow rates. Uniform internal
pressure, non-uniform internal pressure, head loss, per slot approach, and hydraulic resistance
approaches were used to calculate the results. For equation modeling that included a coefficient of
discharge (Cd) or loss factor (k), an average value for various hydraulic head of 0.65 was used for Cd. This
value is an average of Bovey’s coefficients for rectangular shaped orifices of 1.26 cm2 area, 10:1 ratio of
sides to height, and oriented with the length horizontal [19]. This value was the closest among tabulated
information for the flow scenario that could be found.
The uniform internal pressure approach involved rearranging the Energy Equation for differential
pressure, and adding the entrance factor for head loss. The open and closed surface areas of the screen
were summed and the flow situation was simplified into a blunt reduction in area. For this situation the
flow experiences two changes. First the water fills and the screen, stops and changes direction, then the
water flows through and exists the screen. The two velocities consist of the total flow rate divided by the
total surface area and open surface area of the screen, indicating a symmetric radial path of flow.
0
0.5
1
1.5
2
2.5
3
3.5
4
4.5
5
0 10 20 30 40 50 60 70 80 90 100
Pre
ssu
re D
iffe
ren
tial
(P
SI)
Flow Rate (MMSCFD)
CFD Methane Simulations150 micron, ind flow rate model
150 micron, ind pressure model
300 micron, ind flow rate model
300 micron, ind pressure model
600 micron, ind flow rate model
600 micron, ind pressure model
Power (150 micron, ind flow ratemodel)Power (150 micron, ind pressuremodel)Power (300 micron, ind flow ratemodel)Power (300 micron, ind pressuremodel)Power (600 micron, ind flow ratemodel)Power (600 micron, ind pressuremodel)

14
Because the velocities of water flow are somewhat low this idealization is reasonable. The minor losses,
velocity head, and pressure head were evaluated. Equation 5 shows the relationship derived from the
Energy Equation for calculating the pressure drop assuming a uniform internal pressure. The theoretical
expression for the hydraulic head (h) of the system is shown below.
𝛥ℎ𝑝𝑟𝑒𝑠𝑠𝑢𝑟𝑒 = 𝛥ℎ𝑣𝑒𝑙𝑜𝑐𝑖𝑡𝑦 + ℎ𝐿𝑜𝑠𝑠𝑒𝑠
The relationship above can be expressed in variables as shown below in Equation 5.
𝛥𝑃 =𝜌
2∗ 𝛥 (
𝑉2
2 𝑔) + 𝐾 ∗ 𝛾 ∗ (
𝑉𝑠𝑐𝑟𝑒𝑒𝑛2
2𝑔) Equation 5
Where K is the loss coefficient, velocity is the change through the screen and Vscreen is the velocity as the
flow passes through the screen open area.
The non-uniform internal pressure method is the same approach as the uniform internal pressure
approach however the screen was divided into ten discrete sections along the length. The centerline
velocity of the water flow was correlated with the water escaping the screen, and furthermore the
building pressure inside the screen. Since the centerline velocity changes from a maximum value at the
entrance of the screen to a value of zero at the closure plate end of the screen, the pressure may
increase along the same trend as decreasing centerline velocity. The pressure was assumed to increase
linearly along the length of the screen. At each section the Energy Equation in Equation 5 was used to
evaluate the pressure difference due to changes in area as well as minor losses in the screen for the that
velocity through the screen.
A screen head loss equation from Chemical Engineering Handbook was also used to model the pressure
difference. This equation can be used for various screen types. Equation 6 shows this screen head loss
equation where the velocity is the approach velocity of the flow toward the screen, calculated used the
total surface area of the screen.
𝛥ℎ = (𝑛
𝐶2)(1−𝛼2)
𝛼2 (𝑉2
2𝑔) Equation 6
Equation 6 shows the coefficient of discharge C, number of screen layers n, percent open screen area ,
and approach velocity V.

15
For the per slot basis, Equation 5 was used without the head loss term to calculate the losses halfway
between two of the axial wires based on area open or closed to flow. In this scenario the open and
closed areas were calculated for one slot opening, from the cross section of the screen. The amount of
pressure drop was reduced for the total area of the total number of slots for each screen based on the
geometry.
The hydraulic resistance model involved accounting for the major losses in the screen due to fiction
during flow along the length. Because of wall effects and zero velocity at the wall surface, interaction
between the fluid and wall causes losses along the wall boundaries. These losses were modeled for both
the length of the screen and the annulus space. To account for flow through any of these areas the
average of the maximum value and zero velocity were taken when calculating both the head losses for
the inside of the screen and the annulus space. The cross-sectional velocities were used for calculating
the friction factor using the Swamee-Jain equation and pressure drop.
The results from these mechanistic calculations are shown in Figures 13 through 15 below and on the
next page. The graphs show a range in flow rate in CFS from 0.1 to 2.0, which is about 1400 to 30,000
BPD.
Figure 13: 150 micron mechanistic approximations for 1 m screen
0
0.2
0.4
0.6
0.8
1
1.2
1.4
0.0 0.5 1.0 1.5 2.0
Pre
ssu
re D
iffe
ren
tial
(p
si)
Flow Rate (CFS)
150 Micron Screen Mechanistic Calculations150 Micron Resistance Model
150 Micron Uniform InternalPressure
150 Micron Screen Head LossEqn
150 Micron Per Slot Basis
150 Micron Non-UniformInternal Pressure
Power (150 Micron ResistanceModel)
Power (150 Micron UniformInternal Pressure)
Power (150 Micron ScreenHead Loss Eqn)
Power (150 Micron Per SlotBasis)
Power (150 Micron Non-Uniform Internal Pressure)

16
Figure 14: 300 micron mechanistic approximations for 1 m screen
Figure 15: 600 micron mechanistic approximations for 1 m screen
0.0
0.1
0.2
0.3
0.4
0.5
0.6
0.7
0.0 0.2 0.4 0.6 0.8 1.0 1.2 1.4 1.6 1.8 2.0
Pre
ssu
re D
iffe
ren
tial
(p
si)
Flow Rate (CFS)
300 Micron Screen Mechanistic Calculations
300 Micron Per Slot Basis
300 Micron Resistance Model
300 Micron Uniform InternalPressure
300 Micron Head Loss Eqn
300 Micron Non-UniformInternal Pressure
Power (300 Micron Per SlotBasis)
Power (300 Micron ResistanceModel)
Power (300 Micron UniformInternal Pressure)
Power (300 Micron Head LossEqn)
Power (300 Micron Non-UniformInternal Pressure)
0.0
0.1
0.1
0.2
0.2
0.3
0.0 0.2 0.4 0.6 0.8 1.0 1.2 1.4 1.6 1.8 2.0
Dif
fere
nti
al P
ress
ure
(p
si)
Flow Rate (CFS)
600 Micron Screen Mechanistic Calculations
600 Micron Resistance Model
600 Micron Per Slot Basis
600 Micron Uniform Internal Pressure
600 Micron Non-Uniform Data
600 Micron Head Loss Eqn
Power (600 Micron Resistance Model)
Power (600 Micron Per Slot Basis)
Power (600 Micron Uniform Internal Pressure)
Power (600 Micron Non-Uniform Data)
Power (600 Micron Head Loss Eqn)

17
The mechanistic approximation results for methane are included in the appendix. The methane flow was
modeled as compressible flow; however for velocities under about 0.3 Mach (335 ft/s) compressible
flow behaves the very close to non-compressible flow such as for water [20]. The same equations for
mechanistically modeling water flow were used for methane, with the exception of the loss coefficient
value used. A coefficient of discharge was selected for the methane scenario from air duct tables for
minor loss coefficients. These values were used for each grill ratio of open area to total surface area.
Appendix Figure 7 displays the estimation of the minor loss coefficient using the data available for air
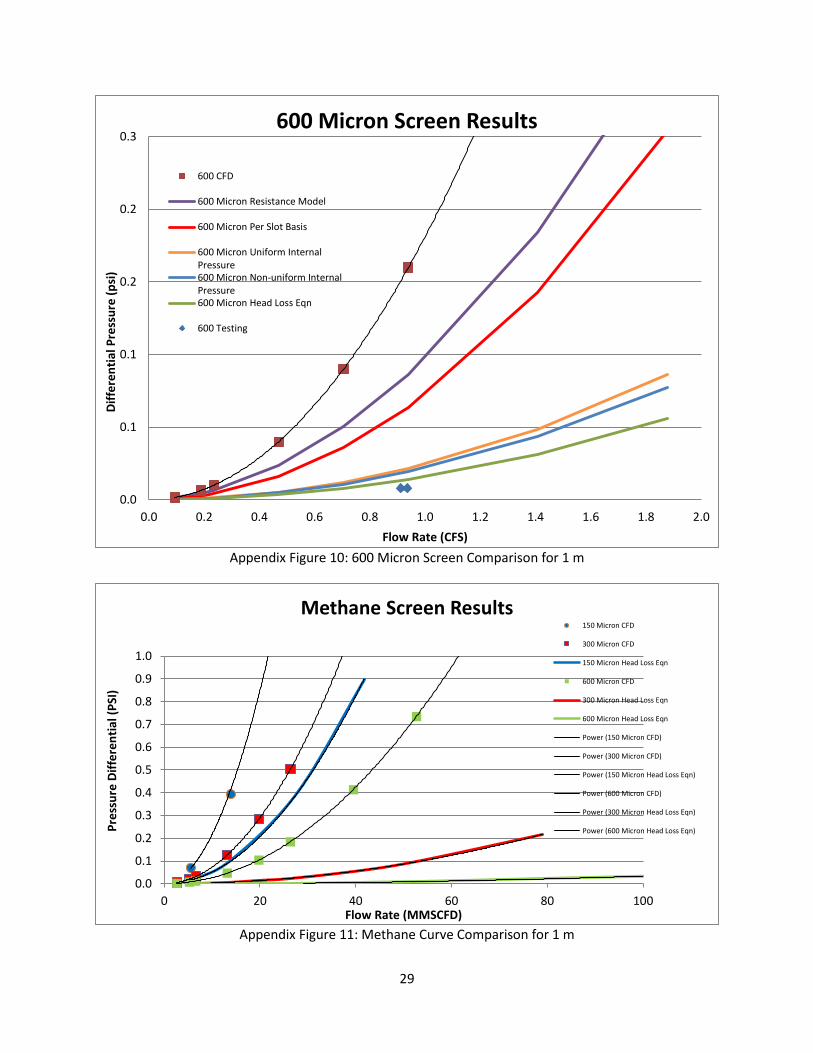
duct grills. Appendix Figure 11 shows the methane comparison for the head loss equation and the CFD
results. The screen head loss equation was selected for the methane mechanistic modeling because of
its closeness to the actual testing results from the water tests.
Initial Lab Testing
Initial testing was performed at the eProcess Technologies laboratory. Conducting comprehensive
testing is planned for summer of 2013 but is contingent on funding.
Three different screens were tested fort slot opening sizes of 150, 300, and 600 micron. Screen area had
to be reduced because high capacity pumps were not available for achieving noticeable pressure drop.
Area was reduced to 3.8% of the total area for the 1 m long screens and the results were scaled up to
represent values for the entire 1 meter long screens. The screen and insert for reducing the area
internally are shown in Figure 16 below.
Figure 16: Screen (bottom) and insert (top) for reducing effective screening area
Inlet pressure and flow rate indicators were used to collect data. The screen was not set up with a
housing chamber; rather the screen was placed inside a tank so that the water exiting the screen would
be collected and recirculated. The inlet pressure gauge was zeroed to read differential pressure between
the inlet and atmosphere.

18
The initial lab testing set up is shown in Figure 17 and Figure 18 with the components labeled and the
direction of flow indicated.
Figure 17: Test setup in lab
Figure 18: Testing flow loop
The screen is shown with turbulent flow exiting the screen within a viewing chamber in Figure 19.
Figure 19: Flow exiting screen during testing
Inlet
Pressure
Indicator
Inlet
Flow
Indicator
Screen
Inside
Tank
Pump
Screen
19
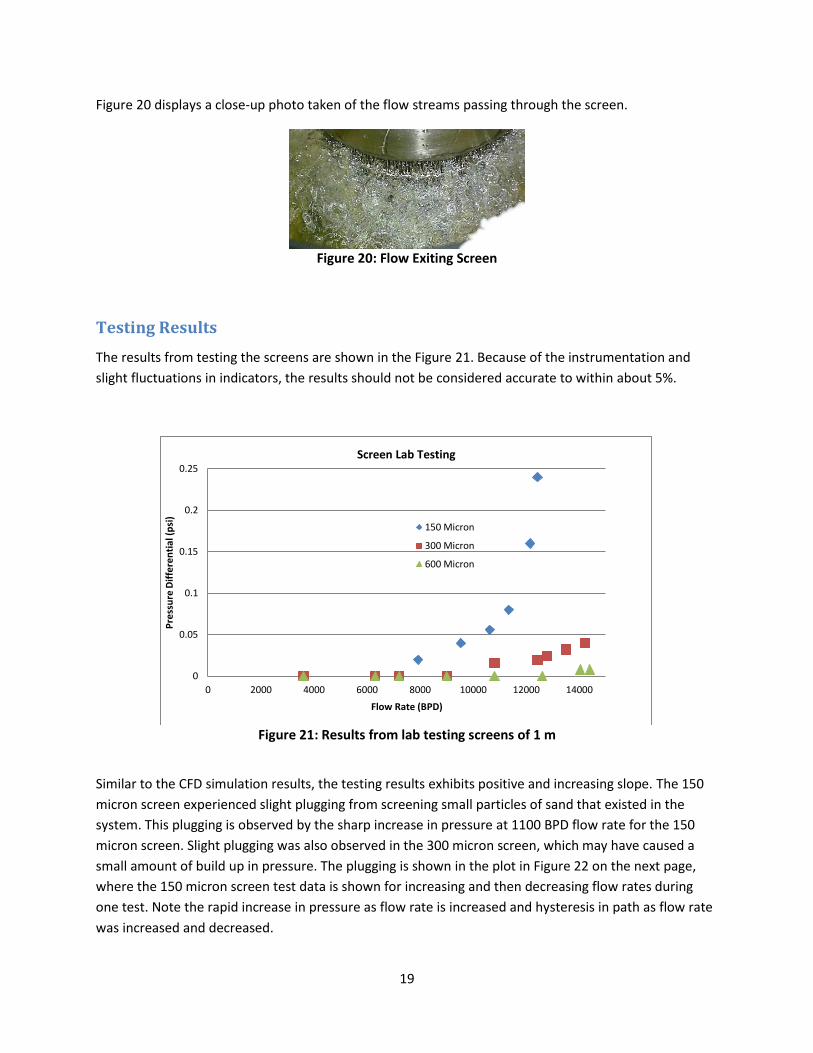
Figure 20 displays a close-up photo taken of the flow streams passing through the screen.
Figure 20: Flow Exiting Screen
Testing Results
The results from testing the screens are shown in the Figure 21. Because of the instrumentation and
slight fluctuations in indicators, the results should not be considered accurate to within about 5%.
Figure 21: Results from lab testing screens of 1 m
Similar to the CFD simulation results, the testing results exhibits positive and increasing slope. The 150
micron screen experienced slight plugging from screening small particles of sand that existed in the
system. This plugging is observed by the sharp increase in pressure at 1100 BPD flow rate for the 150
micron screen. Slight plugging was also observed in the 300 micron screen, which may have caused a
small amount of build up in pressure. The plugging is shown in the plot in Figure 22 on the next page,
where the 150 micron screen test data is shown for increasing and then decreasing flow rates during
one test. Note the rapid increase in pressure as flow rate is increased and hysteresis in path as flow rate
was increased and decreased.
0
0.05
0.1
0.15
0.2
0.25
0 2000 4000 6000 8000 10000 12000 14000
Pre
ssu
re D
iffe
ren
tial
(p
si)
Flow Rate (BPD)
Screen Lab Testing
150 Micron
300 Micron
600 Micron

20
Figure 22: Screen Plugging Effects
Conclusions
The theoretical curve that best fit the data was the head loss Equation 6. The testing results are shown
in Figure 23 for the three screens along with the theoretical results for the head loss equation with a Cd
value of 0.8. Appendix Figure 12 shows the curves with fit lines.
Figure 23: Results Comparison for 1 m screens
0
0.02
0.04
0.06
0.08
0.1
0.12
0.14
0.16
0 2000 4000 6000 8000 10000 12000 14000
Dif
fere
nti
al P
ress
ure
(PSI
)
Flow Rate (BPD)
Screen Performance
150 Micron Testing
150 Micron Theoretical
300 Micron Testing
300 Micron Theoretical
600 Micron Testing
600 Micron Theoretical
0
1
2
3
4
5
6
7
0 500 1000 1500 2000
Dif
fere
nti
al P
ress
ure
(P
SI)
Flow Rate (GPM)
150 Micron Screen Plugging
Decreasing Flow Rate
Increasing Flow Rate

21
The head loss equation was found to produce the closest trend to the water testing data. Figure 24 shows the comparison for the test data and head loss equation for a coefficient of discharge of 0.8. This value is the fit best to the data and is reasonable since Cd is usually around 0.6 for blunt area reductions and about 1.0 for nozzles [21].
The water-only results were fitted with a power curve. The coefficients of correlation for the test data show values near unity, indicating that the data consistently followed a power trend. The CFD trends were found to increase with the same power as the theoretical curves. The curves for the mechanistic results, CFD, and testing results all have the same general shape of positive and increasing slope. As flow rate increases the pressure differential was found to increase, but by larger amounts. The coefficients for the test data and the theoretical results compare closely, however the test data exponent had a higher value. The shapes for all the testing, theoretical, and modeling results compare closely, increasing exponentially with a power curve shape and this data was fit to power curve lines. The CFD results were found to be at higher pressures than the testing and theoretical results. Screens of finer slot opening sizes were found to cause comparatively larger pressure differential values. Because of its closeness to the actual test data, the head loss equation with a Cd of 0.8 can be used to predict flow rate for the screens with relative accuracy.
The project goals were met with research, test unit design, CFD modeling, calculations, and physical testing. The comprehensive testing will take place during the summer of 2013 and is planned to consist of building the designed flowloop and housing and using high capacity pumps to achieve higher flow rates. Multiphase testing will be performed with water, air, and sand particles and flow and pressure effects will be evaluated for solids filtering over time.
Thanks to their assistance, this research was carried out with supervision and guidance from eProcess Technologies’ Technology Director, Hank Rawlins, PhD and Montana Tech General Engineering professor, David Bunnell, PhD.

22
References
[1] D. Underdown and S. Hopkins, "Design and Implementation of Retention/Filtration Media for Sand
Control," Society of Petroleum Engineers Drilling and Completion, pp. 1-7, September 2008.
[2] W. Wu, J. Liu, W. Li and W. Hsieh, "Measurement and correlation of hydraulic resistance of flow
through woven metal screens," International Journal of Heat and Mass Transfer, no. 48, pp. 1-10, 6
April 2005.
[3] Amistco Separation Productions, Inc. Worldwide, "Wedge Wire Screen Products," AMACS Process
Tower Internals, 2008. [Online]. Available:
http://www.amistco.com/BULLS_PDF/Updated_Nov2011/13aWedgeWire.pdf. [Accessed 6
December 2012].
[4] P. Markestad, O. Christie, A. Espedal and O. Rorvik, "Selection of Screen Slot Width to Prevent
Plugging and Sand Production. SPE 31087," in SPE International, Lafayette, LA, 1996.
[5] R. Chanpura, R. Hodge, J. Andrews, E. Toffanin, T. Moen and M. Parlar, "A Review of Screen
Selection for Standalone Applications and a New Methodology. SPE 127931," Society of Petroleum
Engineers Drilling and Completion, pp. 84-95, March 2011.
[6] AMACS, AMACS Screen Products, Separation Products, Alvin, TX: Amistco Separation Products,
Inc.Worldside, 2010.
[7] S. V. Belov, V. A. Devisilov and V. N. Zhdanov, "HYDRAULIC RESISTANCE OF WOVEN METAL
SCREENS," NEW MACHINERY AND EQUIPMENT, pp. 1-5.
[8] J. Armour and J. Cannon, "Fluid Flow Through Woven Screens," AlChE Journal, vol. 14, no. 3, pp.
415-420, 1968.
[9] D. Jones, "GAS FLOW RESISTANCE MEASUREMENTS THROUGH PACKED BEDS AT HIGH REYNOLDS
NUMBERS," Journal of Fluids Engineering, vol. 105, no. 2, pp. 168-173, 1983.
[10] M. Conrath and M. Dreyer, "GAS SEPARATION AND BUBBLE BEHAVIOUR AT A WOVEN SCREEN,"
Interdisciplinary Transport Phenonmena VI: Fluid, Thermal, Biolgical, Materials and Space Sciences,
vol. 4, no. 9, pp. 2,8, 2009.
[11] R. Hodge, R. Burton, V. Constien and V. Skidmore, "An Evaluation Method for Screen-Only and
Gravel-Pack Completions. SPE 73772," in SPE International, Lafayette, LA, 2002.

23
[12] V. Constien and V. Skidmore, "Standalone Screen Selection Using Performance Mastercurves, SPE
98363," in SPE International, Layfayette, LA, 2006.
[13] S. Ergun, "Fluid Flow through packed Columns," Chemical Engineering Progress, vol. 48, no. 2, pp.
89-94, 1952.
[14] Johnson Screens Inc., "The Design: Cylindrical Screen for Inside Outside Filtration," 2010. [Online].
Available:
http://www.johnsonscreens.com/sites/default/files/2/680/Johnson%20Industrial%20Screens.pdf.
[Accessed 16 December 2012].
[15] Industrial Screen Products Inc., "Profile Wire Screens," Industrial Screen Products Inc., 1997.
[Online]. Available: http://www.wedgewire.com/wedgewirescreens.pdf. [Accessed October 2012].
[16] H. Duscha, M. Hesler and C. Sparrell, "Computational Fluid Dynamics Analysis of Two-Phase Flow in
a Packed Bed Reacto: 2.2.1 Fundamentals of CFD for Multiphase Flow," Worcester Polytechnic
Institute, 2012.
[17] Mentor Graphics Corporation, "FloEFD Technical Reference, Software Version FE11.1.0," Mentor
Graphics Corp., Wilsonville, Oregon, 2011.
[18] J. L. Savidge, "The first requirement of gas measurement is accuracy," in COMPRESSIBILITY OF
NATURAL GAS.
[19] E. F. Brater, H. W. King, J. E. Lindell and C. Wei, "Handbook of Hydraulics 7th Ed," in Orifices, Gates,
and Tubes, McGraw Hill, 1996, p. 4.11.
[20] Auld and Srinivas, "Compressible Flow," Aerodynamics for Students, 2006 . [Online]. Available:
http://www.aeromech.usyd.edu.au/aero/gasdyn/node1.html. [Accessed 9 May 2013].
[21] The Engineering Tool Box, "Orifice, Nozzle and Venturi Flow Rate Meters,"
Engineeringtoolbox.com, [Online]. Available: http://www.engineeringtoolbox.com/orifice-nozzle-
venturi-d_590.html. [Accessed May 2013].
[22] G. Ehrhardt, "FLOW MEASUREMENTS FOR WIRE GAUZES," International Chemical Engineering.,
vol. 23, no. 3, pp. 455-465, 1983.
[23] R. Sodre, "Friction factor determination for flow through finite wire-mesh woven-screen matrices,"
Journal of Fluids Engineering, vol. 119, no. 4, pp. 847-851, 1997.
[24] A. Miquel, "Airflow through porous screens: from theory to practical considerations," Energy and
Buildings, no. 28, pp. 63-69, 1997.

24
[25] Engineering Tool Box, "Refrigerants - Physical Properties," Engineering Tool Box, [Online].
Available: http://www.engineeringtoolbox.com/refrigerants-d_902.html. [Accessed 28 April 2013].
[26] Industrial Energy Management, "Facilities - Industrial Cooling Systems," [Online]. Available:
http://www-3.unipv.it/energy/web/Libro%20petrecca/pdf/capitolododicesimo.pdf. [Accessed 28
April 2013].
[27] Montana Tech General Engineering Dept, EMEC 402 Mech Engr Lab Experiment 7, Butte: Montana
Tech of the University of Montana, 2013.
Appendix
Appendix Figure 1: 150 Micron CFD Model Dimensions
Appendix Figure 2: 300 Micron CFD Model Dimensions

25
Appendix Figure 3: 600 Micron CFD Model Dimensions
Appendix Figure 4: Flow trajectory pattern of CFD model: 600 micron screen and 200 GPM
Appendix Figure 5: CFD Model Screen Images

26
Appendix Figure 6: CFD Results showing flow in BPD
Figure 7: Air Flow Minor Loss Coefficient Estimation
0
0.1
0.2
0.3
0.4
0.5
0.6
0.7
0.8
0.9
1
0 5000 10000 15000
Pre
ssu
re D
iffe
ren
tial
(P
SI)
Flow Rate (BPD)
CFD Simulation Results for Water
600 CFD
300 CFD
150 CFD
Power (600 CFD)
Power (300 CFD)
Power (150 CFD)
http://www.engineeringtoolbox.com/minor-
loss-air-ducts-fittings-d_208.html
Ratio of free to total
surface area Minor Loss Coefficient
Grilles, 0.7 ratio free area to total surface 0.7 3
Grilles, 0.6 ratio free area to total surface 0.6 4
Grilles, 0.5 ratio free area to total surface 0.5 6
Grilles, 0.4 ratio free area to total surface 0.4 10
Grilles, 0.3 ratio free area to total surface 0.3 20
Grilles, 0.2 ratio free area to total surface 0.2 50
Input
150 micron screen 0.087 328.2367844
300 micron 0.163 78.77929424
600 micron 0.278 23.40996096
y = 1.2756x-2.273
R² = 0.9993
0
10
20
30
40
50
60
0 0.2 0.4 0.6 0.8
Co
eff
icie
nt
Ratio Free Space
Minor Loss Data for Air Flow
Series1
Power (Series1)y = 1.2759x-2.273
R² = 0.9998
0
50
100
150
200
250
300
350
0 0.2 0.4 0.6 0.8
Co
eff
icie
nt
Ratio Free Space
Minor Loss Data Extrapolation
Series1
Power (Series1)
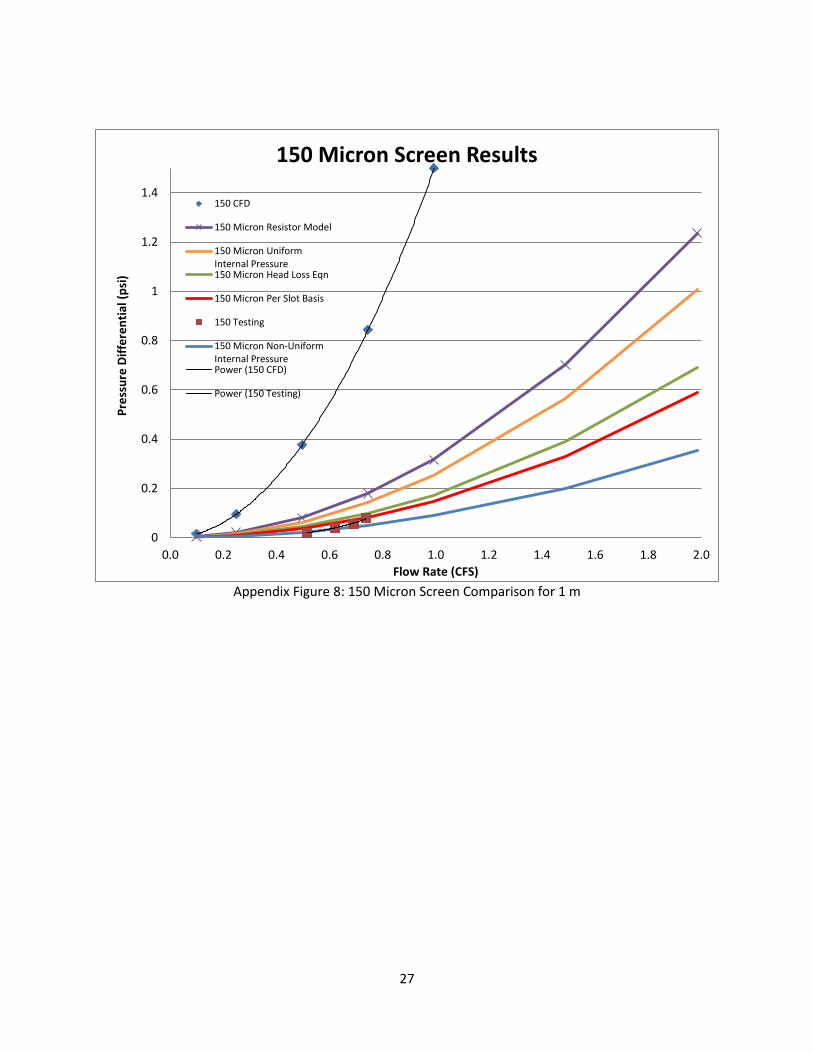
27
Appendix Figure 8: 150 Micron Screen Comparison for 1 m
0
0.2
0.4
0.6
0.8
1
1.2
1.4
0.0 0.2 0.4 0.6 0.8 1.0 1.2 1.4 1.6 1.8 2.0
Pre
ssu
re D
iffe
ren
tial
(p
si)
Flow Rate (CFS)
150 Micron Screen Results
150 CFD
150 Micron Resistor Model
150 Micron UniformInternal Pressure150 Micron Head Loss Eqn
150 Micron Per Slot Basis
150 Testing
150 Micron Non-UniformInternal PressurePower (150 CFD)
Power (150 Testing)

28
Appendix Figure 9: 300 Micron Screen Comparison for 1 m
0.0
0.1
0.2
0.3
0.4
0.5
0.6
0.7
0.0 0.2 0.4 0.6 0.8 1.0 1.2 1.4 1.6 1.8 2.0
Pre
ssu
re D
iffe
ren
tial
(p
si)
Flow Rate (CFS)
300 Micron Screen Results
300 CFD
300 Micron Per Slot Basis
300 Micron ResistanceModel300 Micron Uniform InternalPressure300 Micron Head Loss Eqn
300 testing
300 Micron Non-UniformInternal PressurePower (300 CFD)
Power (300 testing)
29
Appendix Figure 10: 600 Micron Screen Comparison for 1 m
Appendix Figure 11: Methane Curve Comparison for 1 m
0.0
0.1
0.1
0.2
0.2
0.3
0.0 0.2 0.4 0.6 0.8 1.0 1.2 1.4 1.6 1.8 2.0
Dif
fere
nti
al P
ress
ure
(p
si)
Flow Rate (CFS)
600 Micron Screen Results
600 CFD
600 Micron Resistance Model
600 Micron Per Slot Basis
600 Micron Uniform InternalPressure600 Micron Non-uniform InternalPressure600 Micron Head Loss Eqn
600 Testing
0.0
0.1
0.2
0.3
0.4
0.5
0.6
0.7
0.8
0.9
1.0
0 20 40 60 80 100
Pre
ssu
re D
iffe
ren
tial
(P
SI)
Flow Rate (MMSCFD)
Methane Screen Results150 Micron CFD
300 Micron CFD
150 Micron Head Loss Eqn
600 Micron CFD
300 Micron Head Loss Eqn
600 Micron Head Loss Eqn
Power (150 Micron CFD)
Power (300 Micron CFD)
Power (150 Micron Head Loss Eqn)
Power (600 Micron CFD)
Power (300 Micron Head Loss Eqn)
Power (600 Micron Head Loss Eqn)

30
Appendix Figure 12: Results comparison with curve fits
0
0.02
0.04
0.06
0.08
0.1
0.12
0.14
0.16
0.0 0.2 0.4 0.6 0.8 1.0
Dif
fere
nti
al P
ress
ure
(P
SI)
Flow Rate (CFS)
Screen Performance150 Micron Testing
150 Micron Theoretical
300 Micron Testing
300 Micron Theoretical
600 Micron Testing
600 Micron Theoretical
Power (150 Micron Testing)
Power (150 MicronTheoretical)Power (300 Micron Testing)
Power (300 MicronTheoretical)