multiple criteria decision analysis (mcda) to identify the ... jararaa.pdf · multiple criteria...
TRANSCRIPT

An-Najah National University
Faculty of Graduate Studies
Multiple Criteria Decision Analysis (MCDA)
to Identify the Setting Priorities of the
Sanitation Sector in the West Bank
By
Baraa Yaseen Jararaa
Supervisor
Prof. Marwan Haddad
This Thesis is Submitted in Partial Fulfillment of the Requirements for
the Degree of Master of Water and Environmental Engineering,
Faculty of Graduate Studies, An-Najah National University, Nablus,
Palestine.
2013


III
Acknowledgment I would like to express my sincere gratitude to my supervisor Dr. Prof.
Marwan Haddad for his helpful efforts, fruitful guidance, and continual
encouragement throughout the entire research. Special thanks go also to
my friends for the help in preparing the proposal of this study and guidance
during its preparation.
I would like to thanks to Palestinian Water Authority (PWA) and Austrian
project for funding my master study and helping me in providing the data.
Special thanks go to Eng. Adel Yasin, Dr. Subhi Samhan, and Eng. Hazem
Kitana.
Special thanks to my parents for help, encouragements, and patience.
My wife I love you so much, thank you for your understanding and love
during my study.
Finally, I am very grateful to all those who helped and encouraged me to
make this research possible.

IV
االقرار أنا الموقع أدناه مقدم الرسالة التي تحمل العنوان :
Multiple Criteria Decision Analysis (MCDA) to
Identify the Setting Priorities of the Sanitation
Sector in the West Bank
أقر بأن ما اشتممت عميو ىذه الرسالة إنما ىي نتاج جيدي الخاص، باستثناء ما تمت اإلشارة لم يقدم لنيل أية درجة أو لقب عممي إليو حيثما ورد، وأن ىذه الرسالة ككل، أو أي جزء منيا
أو بحثي لدى أية مؤسسة تعميمية أو بحثية أخرى .
Declaration
The work provided in this thesis, unless otherwise referenced, is the
researcher's own work, and has not been submitted elsewhere for any
other degree or qualification.
Student's Name : : اسى انطانب
Signature: : انتوقيغ
:Date : انتاريخ

V
Table of Contents Page Content No
III Acknowledgment
IV Declaration
V Table of Contents
X List of Tables
XII List of Figures
XIII Acronyms
XIV Abstract
1 Chapter 1. Introduction
1 Multi-Criteria Decision Analysis (MCDA) 1.1
2 Sanitation Sector in general 1.2
4 Research Question 1.3
4 Objectives of the Research 1.4
5 Methodology 1.5
11 Chapter 2. Literature review
11 Multi-Criteria Decision Analysis (MCDA) 2.1
11 Introduction 2.1.1
15 Multicriteria Solving Methodologies 2.1.2
15 Regulatory Uses of MCDA 2.1.3
16 U.S. Army Corps of Engineers 2.1.3.1
18 U.S. Environmental Protection Agency 2.1.3.2
20 U.S. Department of Energy 2.1.3.3
22 European Union 2.1.3.4
23 MCDA Applications for Environmental Management
and Related Uses
2.1.4
24 Application to general environmental management 2.1.4.1
32 Application to Stakeholder Involvement 2.1.4.2
35 Application to Management of Contaminated Lands 2.1.4.3
36 Sanitation Sector in Palestinian Territories 2.2
36 Introduction 2.2.1
38 Regulatory Framework 2.2.2
40 Water Law No. 3, 2002 2.2.2.1
41 Joint Water Committee 2.2.2.2
42 Environment Law No. (7) of 1999 2.2.2.3
43 National Water Plan 2.2.2.4
44 Waste Water Management Plan report (PWA
Wastewater Policies)
2.2.3
44 Wastewater Collection Policies 2.2.3.1
46 Industrial Wastewater Policies 2.2.3.2
47 Wastewater Treatment Policies 2.2.3.3

VI
49 Awareness and Stakeholders participation 2.2.3.4
49 Tariff Policy 2.2.3.5
51 Legal and Administration Policy 2.2.3.6
52 Chapter 3. Current situation of institutional
wastewater management agencies in palestine
53 National Water Council 3.1
55 The Palestinian Water Authority 3.2
56 Other Government Institutions 3.3
58 Local Committees, Municipalities, and Village Councils 3.4
58 Local NGO’s and International Organizations 3.5
60 Chapter 4. Situation of sanitation in palestine and
future plans
61 Situation of Wastewater in the Urban Area (1996-2012) 4.1
62 Situation of Wastewater in the Refugee Camps (1996-
2012)
4.2
64 Situation of Wastewater in Rural (1996-2012) 4.3
67 Situation of Wastewater in Rural (1996-2012) 4.4
71 Deficiencies and Problems 4.5
75 Driving Forces for WW Management 4.6
76 Opportunities 4.7
76 Existing and Future Plans: 4.8
76 To Stop Flowing Wastewater Toward the Green LINE
to be Treated and Reused in Palestine
4.8.1
77 Criteria for WWT Selection 4.8.2
77 Look into the Future Sustainable Planning of WWTP 4.8.3
78 Centralized WWTP (>15000 m3/day or 200,000
PE)
4.8.4
79 Look into the Future Sustainable Operation Small
WWTP
4.8.5
79 Main Cities and Urban Areas 4.8.6
80 Priorities for Selecting Wastewater Projects (Main
Cities &Urban Areas)
4.8.7
80 Semi Urban (Population 5000-10000) and Rural Areas
(Population 2000-5000)
4.8.8
80 Priorities for Selecting Wastewater Projects (Semi
Urban and Rural Areas)
4.8.9
81 Rural Areas and Small Communities (De-Centralized
(Local WWTP))
4.8.10
82 Reuse & Recycling 4.8.11
82 PWA with Cooperation and Coordination with all 4.8.12

VII
Stakeholders and Beneficiaries will do Strongly and
Effectively
83 Chapter 5. Criteria identification
83 Criteria Used in Some Countries 5.1
83 Egypt 5.1.1
85 Iraq 5.1.2
86 Libya 5.1.3
87 South Africa 5.1.4
88 Stakeholder Consultation 5.2
88 Consultation with Palestinian Ministries 5.2.1
89 Ministry of Agriculture (MoA) 5.2.1.1
91 Palestinian Water Authority (PWA) 5.2.1.2
92 Ministry of Tourism and Antiquities (MoTA) 5.2.1.3
92 Environmental Quality Authority (EQA) 5.2.1.4
93 Ministry of Local Governments (MoLG) 5.2.1.5
94 Ministry of Labor (MoL) 5.2.1.6
94 Consultation with Universities 5.2.2
95 Consultation with NGOs 5.2.3
96 Consultation with Private sector 5.2.4
97 Universal Group for Engineering & Consulting (UG) 5.2.4.1
98 Center for Engineering and Planning (CEP) 5.2.4.2
99 Consultation with Municipalities 5.2.5
99 Nablus Municipality 5.2.5.1
100 Ramallah Municipality 5.2.5.2
102 Citizens Questionnaire 5.3
102 Sample Size 5.3.1
106 Analysis of the Questionnaire 5.3.2
107 First Topic: Water Situation 5.3.2.1
107 Second Topic: Current status of sanitation and citizens'
satisfaction
5.3.2.2
108 Third Topic: Impact of wastewater on citizens 5.3.2.3
109 Fourth Topic: Economic and social aspects 5.3.2.4
110 Fifth Topic: citizens' awareness, and awareness
campaigns
5.3.2.5
110 Sixth Topic: Institutional issues 5.3.2.6
111 Seventh Topic: Decision-making 5.3.2.7
112 EQA Terms of Reference (TOR) 5.4
113 Selected Criteria Used in the Sanitation Projects (donors
criteria)
5.5
113 Wastewater Projects for USAID Funding 5.5.1
114 Assessment of Potential West Bank Water Projects for 5.5.1.1

VIII
USAID Funding
114 Identification of Potential Projects 5.5.1.1.1
115 Establishment of project selection criteria 5.5.1.1.2
116 Evaluation of Shortlisted Projects 5.5.1.1.3
118 Recommended Criteria for Prioritizing Projects 5.5.1.1.4
121 Site selection report 5.5.1.2
123 Criteria 1: Civil Administration Permitting 5.5.1.2.1
125 Criteria 2: Operational Simplicity 5.5.1.2.2
127 Criteria 3: Environmental and Health Impacts 5.5.1.2.3
129 Criteria 4: Municipal Readiness 5.5.1.2.4
131 Wastewater Projects for European Union (EU) Funding 5.5.2
133 Wastewater Projects for German Bank for
Reconstruction (KFW) Funding
5.5.3
134 Multi-Criteria Screening of Options 5.5.3.1
134 Environmental Issues 5.5.3.2
134 Socio-Economic Impact 5.5.3.2.1
134 Institutional Criteria 5.5.3.2.2
135 Wastewater Projects for Ministry of Foreign Affairs
(MFA) Republic of Finland Funding
5.5.4
135 Selection Criteria and Screening 5.5.4.1
136 Wastewater Projects for Local Finance Investment
Projects
5.5.5
136 Suitability of Land 5.5.5.1
136 Political Constraints 5.5.5.2
137 Potential Aquifer Impacts 5.5.5.3
138 Proximity of Reuse Sites 5.5.5.4
138 Proximity to Existing and/or Planned Utilities 5.5.5.5
138 Flood Plain Elevation 5.5.5.6
139 Proximity to Landfill 5.5.5.7
139 Nuisance to Surrounding Urban Areas 5.5.5.8
139 Population Served 5.5.5.9
139 Criteria Identification 5.6
141 Chapter 6. Mcda tools development
141 Normalize the Weights of Criteria 6.1
144 Carries a Value Rating for Each Criteria 6.2
144 Demography 6.2.1
144 Water Consumption / Wastewater Production 6.2.2
145 Reusing Wastewater 6.2.3
146 Environmental Factor 6.2.4
148 Operation Body 6.2.5
149 Risk for Industrial Waste 6.2.6

IX
149 Socio-Economic Factor 6.2.7
150 Geographical Factor (topography, catchment) 6.2.8
151 Political Issues 6.2.9
152 Chapter 7. Priorities settings
152 Identify Communities 7.1
163 Application of MCDA Tools 7.2
163 Carries a Value Rating for Each Criteria 7.2.1
163 Demography 7.2.1.1
164 Water Consumption / Wastewater Production 7.2.1.2
166 Reusing Wastewater 7.2.1.3
167 Environmental Factor 7.2.1.4
170 Operation Body 7.2.1.5
171 Risk for Industrial Waste 7.2.1.6
174 Socio-Economic Factor 7.2.1.7
179 Geographical Factor (topography, catchment) 7.2.1.8
181 Political Issues 7.2.1.9
182 Evaluation Measure for Each Community 7.2.2
187 Setting Priorities 7.3
188 Sensitivity and Certainty Analysis 7.4
189 Program Implementation (Case Study) 7.4.1
192 Chapter 8. Conclusions and recommendations
192 Conclusions 8.1
193 Recommendations 8.2
195 References
213 Annex
اشن ة

X
List of Tables
Page Table No.
6 Calculate normalize weights to each attributes 1.1
9 Calculate evaluation measure 1.2
28 Applications of decision support tools in environmental
management
2.1
61 Wastewater status in WB-Main Cities (WW
Departments in PWA, 2012)
4.1
62 Existing WW Treatment Plants -urban area (WW
Departments in PWA, 2012)
4.2
63 Wastewater status in WB -Refugee Camps (WW
Departments in PWA, 2012)
4.3
65 Existing Small Scale Treatment Plant-Sample 4.4
65 Existing On-site (Household level) Treatment plants 4.5
67 On-going WW Projects (WW Departments in PWA,
2012)
4.6
68 Proposed and Ongoing WW Treatment Plants (urban
area) (WW Departments in PWA, 2013)
4.7
104 Number of families in the selected communities 5.1
105 Number of samples for each community 5.2
125 Numerical Scoring Description for Criteria 1 ‐ Ease of
Civil Administration Approval
5.3
127 Numerical Scoring Description for Subcriteria 2A –
Operational Simplicity – Gravity Collection
5.4
127 Numerical Scoring Description for Subcriteria 2B –
Operational Simplicity – Wastewater Generation
5.5
128 Numerical Scoring Description for Criteria 3 –
Environmental and Health Impacts
5.6
131 Numerical Scoring Description for Criteria 3 –
Municipal Readiness
5.7
143 Calculate normalize weights to each criteria 6.1
148 Municipal ranking on the basis of performance for the
municipal development program (MDP) in MDLF
6.2
155 Communities that are expected to have a population of
more than 10,000 people in 2030
7.1
163 Demography score of each community 7.2
164 Water consumption score of each community 7.3
166 Wastewater reuse score of each community 7.4
168 Environmental factor score of each community 7.5
170 Operation body score of each community 7.6
172 Risk for Industrial Waste score of each community 7.7

XI
175 Socio-economic factor score of each community 7.8
179 Geographical factor score of each community 7.9
171 political issues score of each community 7.10
183 Calculate evaluation measure for each community 7.11
187 Setting priorities for communities 7.12
190 Setting priorities for the top ten communities according
to four various alternatives
7.13

XII
List of Figures
Page Figure No.
8 Methodological approach to characterizing and
quantifying uncertainty
1.1
10 Flowchart for research methodology 1.2
52 Water Sector Framework 3.1
53 Main stakeholders in water and sanitation sect 3.2
54 National Water Council framework 3.3
68 Existing and future WWTP Projects (WW Departments
in PWA, 2012)
4.1
108 Censorship of wastewater disposal 5.1
108 The impact of wastewater on citizens directly 5.2
109 Illustrates the problems faced by citizens because of
wastewater
5.3
111 Attention to the wastewater sector by government
institutions and civil society organizations (NGO's)
5.4
112 Management of the sanitation sector 5.5
112 Provides wastewater disposal services 5.6
145 Value agricultural land 6.1
147 Hydrogeological vulnerability of groundwater to
pollution in the West Bank
6.2
188 Program Structure (Excel Program) 7.1

XIII
Acronyms ANERA America Near East Refugee Aid
ARIJ Applied Research Institute Jerusalem
CARE Christian Action Research and Education
CEOHS Centre for Environmental and Occupational Health Sciences at
Bethlehem University
EQA Environmental Quality Authority
EU European Union
GTZ German Agency for Technical Co-operation
JICA Japanese International Cooperation Agency
JWU Jerusalem Water Undertaking
KFW German Bank for Reconstruction
MCDA Multi-Criteria Decision Analysis
MFA Ministry of Foreign Affairs, Republic of Finland
MoA Ministry of Agriculture
MoL Ministry of Labor
MoLG Ministry of Local Governments
MoTA Ministry of Tourism and Antiquities
MOU Memorandum of Understanding
PARC Palestinian Agricultural Relief Committee
PCBS Palestinian Central Bureau for Statistics
PHG Palestinian Hydrology Group
PWA Palestinian Water Authority
SCF Save the Children Federation
UNDP United Nations Development Program
UNRW
A
United Nations Relief and Works Agency for the Palestinian
Refugees in the Near East
USAID US Agency for International Development)
WB World Bank
WBG West Bank and Gaza Strip
WESI Water and Environmental Studies Institute at An-Najah National
University
WSERU Water and Soil Environmental Research Unit at Bethlehem
University
IEWS Institute of Environmental and Water Studies at Bir-Zeit
University
WW Waste Water
WWTP Waste Water Treatment Plant

XIV
Multiple Criteria Decision Analysis (MCDA) to Identify the Setting
Priorities of the Sanitation Sector in West Bank
By
Baraa Yaseen Jararaa
Supervisor
Prof. Marwan Haddad
Abstract
During the last two decades, millions of dollars have been invested in the
sanitation sector in the Palestinian lands. Nonetheless, the sanitation sector
is considered one of the sectors that have been neglected over the past
decades as only 28% to 32% of the populations are provided with sewage
systems. Such networks serve some of the main cities, camps and villages
while most of the populations get rid of wastewater via cesspits.
Many researches and studies have been conducted over the sanitation
sector in Palestine, and many plans and strategies have been developed in
this field over the past years. However, none of such researches and
strategies managed to set the priorities of the areas in need to solve the
problem of wastewater disposal.
This research aims at identifying and setting the priorities of the areas in
need to solve the problem of wastewater disposal by using Multiple
Criteria Decision Analysis (MCDA) approach in an attempt to start
projects in such areas. The research has shown that the current way they
are selecting target areas to sanitation projects are either based on the
policies of the donor or on a non-scientific method. So they do not take all
the right criteria to make the right decision.

XV
The research has shown that the criteria which significantly affect the
decision-making process in the sanitation sectors are: the demography,
water consumption - wastewater production, reusing wastewater,
environmental factor, the operation body, the risks of the industrial waste,
the socio-economic factor, the geographical factor and political issues. The
research discussed the evaluative mechanism of such criteria, and a
mathematical relationship was found between the different criteria which
facilitate identifying setting the priorities of areas.
The number of communities whose population is expected to reach up to
10 thousand in 2013 is 97 communities. There are 33 communities served
with sewage systems or in the design or implementation stages with funds
specified for these communities. On the other hand, there are 64
communities that disposed of wastewater via cesspits. According to the
PWA water sector plan for 2010-2030, the number of population of all
communities shall have reached 10 thousand, all connected and served with
a sewage system.
The Multiple Criteria Decision Analysis (MCDA) approach, developed
through this research and which is recommended to be put into use in
2010 and end by 2030 in accordance with the water sector plan, was
applied to 64 communities which consider cesspits as a means of getting
rid of wastewater. The 64 communities were ordered by priority.
The study has put forward a number of recommendations such as that the
Palestinian Water Authority set a long-term plan and a five-year plan to
serve 20 communities ordered by priority and that donating bodies abide
with this plan.

1
Chapter .1
Introductions
1.1 Multi-Criteria Decision Analysis (MCDA)
Multi-Criteria Decision Analysis (MCDA) or Multi-Criteria Decision
Making (MCDM) is a discipline aimed at supporting decision makers faced
with making numerous and sometimes conflicting evaluations. MCDA
aims at highlighting these conflicts and deriving a way to come to a
compromise in a transparent process.
Multi-criteria decision analysis has been recognized as an important tool in
environmental decision-making for formalizing and addressing the problem
of competing decision objectives (Janssen 1992, Lahdelma et al. 2000,
Linkov et al. 2006, Regan et al. 2007, Yatsalo et al. 2007).
The decision-maker’s preferences over options depend on how well they
perform according to a number of objectives or ―criteria‖ {C1…CM} that
have been identified by relevant stakeholders to be the (only) issues on
which a decision between options should be made.
Unlike methods that assume the availability of measurements,
measurements in MCDA are derived or interpreted subjectively as
indicators of the strength of various preferences. Preferences differ from
decision maker to other, so the outcome depends on who is making the
decision and what their goals and preferences are.
Here, we use MCDA method that depend on rankings of options for each
criterion, and also weightings for the criteria. We chose the method because
it has been employed widely in environmental and other decision-making

2
contexts (Janssen 1992, Lahdelma et al. 2000, Linkov et al. 2006, Regan et
al. 2007, Yatsalo et al. 2007). Our chief concern is to highlight the impact
that scoring scales and other assumptions in the process have on decision
outcomes, and to suggest some resolutions for the identified problems.
1.2 Sanitation Sector in general
The Sanitation problem is one of the problems facing communities and
environment and thus affects the lives of humans, plants, and animals not
only in Palestine but in all over the world. Therefore we need clear
comprehensive and sustainable criteria for its development.
There have been substantial developments in (waste) water management
and treatment technology worldwide during the past decades (Gijzen,
2001). In spite of that, in 1997 three billion people on earth lacked
adequate sanitation. In Africa alone, 80 million people are at risk of
cholera, and 16 million cases of typhoid infections each year are a result of
lack of clean drinking water and adequate sanitation (WHO, 1996).
According to the Kyoto summit in 2003, two billion people will not have
access to safe drinking water supplies in the year 2015. The Mediterranean
countries are among the most affected region in the world. Wastewater has
been identified as the main land-based point source pollutant causing
contamination of the (coastal) marine environment (UNEP/GPA, 2000).
The increase in population and therefore in sewage production poses a
great challenge to developing and introducing sustainable sewage
collection and treatment. The efforts in providing these essential services,
especially for poorer regions of the world, are hindered by the

3
shortcomings of the current concept of urban water management and
financial limitations.
Water is a scarce and precious resource in the Middle East. The
Mediterranean countries are among the regions of water stress in the world
(Water stress < 1700 m3/cap. year). Comparing the average international
per capita minimum need according to the WHO (2006) standards (150
l/c/d) with the actual Palestinian water consumption (82 l/c/d); the deficit
in water supply reached up to 41 million cubic meters (mcm) annually.
Population growth, rising living standards and urbanization increase the
pressure on the resource, leading to increasing costs of water supply.
Palestine is a typical example where scarce water resources are being
massively contaminated by excessive use of both fertilizer and manure in
agriculture and by uncontrolled discharge of municipal sewage into the
environment. This might seriously endanger future potable water supplies
of the population at large.
In Palestine, the only substantial water resource available is groundwater.
Presently, the application of wastewater treatment is limited due to high
costs and the technological complexity of conventional systems. Seepage
of domestic wastewater from on-site cesspits, inadequately performing
off-site sewage treatment plants, together with the excessive use of
fertilizer in agriculture has resulted in a dramatic increase of nitrate levels
in aquifers. In the West Bank, signs of nitrate pollution in some
agricultural wells and freshwater springs were reported every others, by
Alawneh and Al-Sa`ed (1997).

4
Palestine suffers from both water scarcity and water pollution; water supply
is dependent upon annual precipitation, which replenishes the aquifers,
natural springs and streams in Palestinian territories. Ground water and
rainwater collected in cisterns is exposed to severe pollution especially
from untreated wastewater.
In Palestine, domestic and industrial wastewaters are collected mainly in
cesspits or, to a much lesser extent, in sewerage networks. In some villages
and refugee camps, black wastewater is collected in cesspits (PCBS, 2007).
1.3 Research Question
The following are the research questions:
1. What are the criteria that affect the decision-making in the sanitation
sector in Palestine? And how to harmonize these criteria?
2. What are the locations of most need to solve the problem of sewage
in West Bank?
1.4 Objectives of the Research
This research aims to:
Overview and assess the sanitation sector investments, progress,
deficiencies, problems, existing and future plans.
Identify the criteria that affect the decision-making in the sanitation
sector and how to harmonize these criteria.
Develop a relationship to setting priorities of the sanitation sector
according to the various criteria obtained by MCDA.
Identify the areas which most need to solve the problem of sewage in
the West Bank.

5
1.5 Methodology The research methodology goes through five phases. Figure 1.2 shows the
relation between the phases. These phases are:
Phase 1: Data collection
A. Review the present strategy of the PWA, MEnA and the PA
environmental laws.
B. Review the available documents, papers, reports, strategy of some
countries and studies on the sanitation sector.
C. Identify the involved stakeholders in the sanitation sector such as
institutions; organizations; ministries; universities and municipalities.
D. Review the methods for determining the priorities in sanitation sector
in the ministries and relevant institutions.
E. Review the selected criteria used in the sanitation projects.
F. Review the performed projects in the sanitation sector (Investments).
G. Address the current status of sanitation in the West Bank (sewage
systems, pumps, treatment plants, cesspits).
Phase 2: Criteria Identification
A. Identify the criteria established by the laws and strategy in Palestine.
B. Identify the criteria used in some countries.
C. Stakeholder Consultation such as institutions; organizations;
ministries; universities and municipalities.
D. Questionnaire for citizens.
E. EIA Terms of Reference (TOR) of sanitation projects.
F. Determine the criteria followed by donors in the projects.

6
Phase 3: MCDA tools development
A. Realistic evaluations should take into account multiple attributes in
decision making, so, in reality we have different attributes (criteria)
that differ in importance. The ―difference in importance‖ makes it
essential to give a weight for each attribute. This is done through
consultation with stakeholders in the sanitation sector.
B. Normalize the weights by: Give a score for each attribute’s weight,
compute the summation of all the scores, and divide the score of each
attribute by the total score. See Table 1.1 and equation below:
Table 1.1 Calculate normalize weights to each attributes
Attributes Weights Normalize weight
1 W1 W1/∑W
2 W2 W2/∑W
3 W3 W3/∑W
. . .
. . .
. . .
m Wm Wm/∑W
C. Each alternative carries a value rating for each attribute. The rating of
each alternative for each attribute indicates how well the alternative
will perform as each attribute is considered. The rating will be
determined by reference to the books, references and scientific papers
and by reference to the owners of specialty in these attribute.

7
D. Managing uncertainty: The methodology for managing uncertainty
developed for characterizing and quantifying uncertainty in the
decision-making process is showing in Figure 1.1 as can be seen from
this figure, the decision-making process starts by defining the set of
options of interest (i.e. potential, alternative solutions) for the analysed
problem. At the same time, a set of criteria that will be used to
evaluate these optional solutions is identified too. This preliminary
analysis is carried out by liaising with stakeholders and supported by
the MCDA analyst. The objective is to identify/formulate planning
decisions that could be potentially used to solve the problem analysed
and, at the same time, to define the quality standards that should be
met by the implemented decision. This is an iterative process which
eventually results in a list of optional solutions to be considered and
the multiple criteria that will be used to evaluate and compare them.

8
Figure 1.1: Methodological approach to characterizing and quantifying uncertainty
Phase 4: Priorities settings
A. Identify communities. We will take the towns that have population over
10 thousand people. In accordance with the directives of the PWA to
resolve sanitation problems in the towns and villages with the population
over 10 thousand people by 2030.
B. Compile information on each community through PCBS, PWA, EQA,
various ministries, municipalities, and village councils.
C. GIS application, expected the availability of the following maps: basins
map, geological map, rainfall map, soil map, springs map, topography map,
land use map, catchment area map, built up areas map, drainage systems
map and satellite image.

9
D. Application of MCDA tools to each community.
E. Evaluation measure for each community. See in the Table below:
Table 1.2: Calculate evaluation measure Attri
bute
s
Normalize
weight
Score for each
alternative (community)
Evaluation measure for each
alternative (community)
1 2 3 n 1 2 3 n
1 W1 S11 S21 S31 W1*Sn1 W1*S11 W1*S21 W1*S31 W1*Sn1
2 W2 S12 S22 S32 W2*Sn2 W2*S12 W2*S22 W2*S32 W2*Sn2
3 W3 S13 S23 S33 W3*Sn3 W3*S13 W3*S23 W3*S33 W3*Sn3
. . . . . . . . . .
. . . . . . . . . .
. . . . . . . . . .
m Wm S1m S2m S3m Snm Wm
*S1m
Wm
*S2m
Wm
*S3m
Wm
*Snm
F. Setting priorities for each community based on evaluation measure.
Phase 5: Results and thesis writing
It will begin from the first phase and continuous through all phases and
include thesis drafting and finalizing the thesis.

10
Figure 1.2: Flowchart for research methodology

11
Chapter 2
Literature review
2.1 Multi-Criteria Decision Analysis (MCDA)
2.1.1 Introduction
Multiple criteria problems in general have received different approaches
throughout history and different authors have been using multiple
approaches and several methods for more than half a century. In that
period, multiple criteria analysis has received ―different names‖ such as
Multi-Criteria Decision Making (MCDM), Multi-Criteria Evaluation
(MCE), Multi-Attribute Utility (MAU), and Multi-Objective Programming
(MOP). Terms to describe similar decision analysis methods in the
literature vary. For example Doumpos (2002) uses the term ―multicriteria
decision aid‖ (MCDA) and Dodgson et al, use a broader term ―multicriteria
analysis‖ (MCA) which includes multicriteria decision analysis . For
purposes of this thesis, the term ―multiple criteria decision analysis‖
(MCDA) will be used for the sake of consistency.
Environmental managers of developing countries are faced with an
additional problem. The situation they often face is one of a limited budget
to implement all of their projects.
They can perform cost effectiveness analyses to determine the best
alternative and they can perform cost-benefit analyses to demonstrate that
the project benefits outweigh the costs, but the issue they often encounter is
that they have more justifiable projects than they have budget. The tools
that these managers need are those that help them to determine which of

12
these justifiable projects are the most important. In other words, ―Which
projects provide the most benefit to the successful management of their
mission?‖ To make this determination, they need a tool to prioritize their
projects in a manner, consistent with established criteria, that is satisfactory
to all stakeholders (including ultimately the public and donor countries,
which are typically the source of funding for such projects). Often the
method that environmental managers resort to is one of ad hoc decision
making. Disadvantages of this method are that such decisions are not
transparent to other stakeholders and may appear unfair. With no structured
basis for the decision process, it becomes less reliable and more difficult to
defend to others. Often times experienced mangers set the right priorities
based on ad hoc decision making, but cannot back up their decision
satisfactorily to all stakeholders. According to Satterstrom Linkov, ―A
systematic method of combining quantitative and qualitative inputs from
scientific studies of risk, cost and cost-benefit analyses, and stakeholder
views has yet to be fully developed for environmental decision making‖
(Linkov, et. al., 2006). More integrative decision analysis processes such as
multiple criteria decision analysis (MCDA) may serve environmental
managers better than the other tools.
MCDA is an ―umbrella term to describe a collection of formal approaches
which seek to take explicit account of multiple criteria in helping
individuals or groups explore decisions that matter‖ (Belton and Stuart,
2002). MCDA facilitates understanding of the problem and uses the
priorities and values of the decision makers to take the most appropriate

13
course of action. MCDA does not relieve the decision maker from the
requirement to make a difficult decision; rather, it provides a structure
within which decision makers and stakeholders express their values and
priorities to each other, resulting in a better understanding of the problem,
potential solutions, and areas in which different stakeholders agree. Many
times a course of action results from the process that was not originally
considered that reflects a compromise of the stakeholders. The MCDA
process in general includes problem identification, problem structuring,
model building, and implementation of the model to inform and challenge
thinking, followed by determination of a course of action. MCDA ―…
integrates common sense with empirical, quantitative, normative,
descriptive, and value-judgment-based analysis‖ (Haimes, 2005).
MCDA is supported by data management procedures, modeling
methodologies, optimization and simulation techniques, and decision
making approaches for the ultimate purpose of improving the decision
making process (Haimes, 2005). According to Dodgson (2000), the main
role of MCDA techniques is to ―deal with the difficulties that human
decision-makers have been shown to have in handling large amounts of
complex information in a consistent way. . . . [MCDA involves breaking a]
problem into more manageable pieces to allow [for easier analysis] and
then of reassembling the pieces to present a coherent overall picture to [aid
in thinking and decision making.] As a set of techniques, MCDA provides
different ways of disaggregating a complex problem, of measuring the

14
extent to which options achieve objectives, of weighting the objectives, and
of reassembling the pieces‖ (Dodgson et al., 2000).
A common technique in MCDA models is the use a preference matrix that
displays how each alternative under consideration compares to others in
terms of the different selection criteria established for the evaluation. In
simple applications, the analysis of the performance matrix directly may be
all that is needed to determine the best solution.
According to Dodgson (2000), in these situations one of the first steps is to
determine ―if any of the [alternatives] are dominated by others. Dominance
occurs when one option performs at least as well as another for all criteria
and is better than the other for at least one criterion‖ (Dodgson et al., 2000).
An analysis for dominance can be used to eliminate alternatives from
consideration or to review the criteria used to determine if all applicable
criteria has been included in the analysis.
In most MCDA applications, numerical analysis is conducted on the
performance matrix to determine the preferred alternative. The analysis
typically involves scoring in which a numerical score is assigned to each
alternative based on strength of preference scale for each criterion.
Weighting is also commonly used to define the relative value or importance
of each criterion. Models using this approach are referred to as
compensatory techniques since low scores on some criteria can be offset by
high scores on others. ―The most common way to combine scores on
criteria, and relevant weights between criteria, is to calculate a simple
weighted average of scores. Use of such weighted averages depends on the

15
assumption of mutual independence of preferences. This means that the
judged strength of preference for an option on one criterion will be
independent of its judged strength of preference on another‖ (Dodgson et
al., 2000).
2.1.2 Multicriteria Solving Methodologies
According to Saaty (1996), there are four major approaches or
methodologies of multicriteria.
First, the Analytic Hierarchy Process (AHP) that is a utility and value
theory of economics based on the use of lottery comparisons.
The second approach is probabilistic, based on Bayesian Theory.
Third, Outranking Method based on ordinal comparison of concordance
and discordance.
And fourth, Goal programming that is basically a modified version of
Linear Programming.
2.1.3 Regulatory Uses of MCDA
Decision process implementation is often based on the results of physical
modelling and engineering optimization schemes. Even though federal
agencies are required to consider social and political factors, the typical
decision analysis process does not provide specifically for explicit
consideration of such issues. Comparatively little effort is applied to
engaging and understanding stakeholder perspectives (including the general
public as well as potentially responsible parties and natural resource
trustees) or to provide for potential learning among stakeholders. A result
of this weakness in current and common decision models is that the process

16
tends to quickly become adversarial whereby there is little incentive to
understand multiple perspectives or to share information. However, a
review of regulatory and guidance documents reveals several programs in
the United States where regulatory agencies involved in environmental
issues are beginning to implement formal decision-analytic tools (such as
MCDA) in their decision-making process.
2.1.3.1 U.S. Army Corps of Engineers
Historically, the U.S. Army Corps of Engineers (USACE) has used
essentially a single-measure approach to civil works, planning decisions
through its Principles and Guidelines (P&G) framework (USACE 1983).
The USACE has primarily used net national economic development (NED)
benefits as the single measure to choose among different alternatives. The
P&G method makes use of a complex analysis of each alternative to
determine the benefits and costs in terms of dollars and other non dollar
measures (e.g., environmental quality and safety); the alternative with the
highest net NED benefit (i.e., with no environmental degradation) is
usually selected. The USACE uses a variety of mechanistic and
deterministic fate and transport models to provide information in
quantifying the various economic development and ecological restoration
accounting requirements as dictated by P&G procedures. The level of
complexity and scope addressed by these models is determined at the
project level by a planning team. Issues such as uncertainty and risk are
also addressed through formulation at the individual project management
level.

17
While the P&G method is not specifically required for planning efforts
related to military installation operation and maintenance, regulatory
actions or operational or maintenance dredging, it presents a general
decision approach that influences many USACE decisions. The USACE
planning approach is essentially a mono criterion approach where a
decision is based on a comparison of alternatives using 1 or 2 factors. Cost-
benefit analysis, for example, is a mono criterion approach. The P&G
approach has its challenges in that knowledge of the costs, benefits,
impacts, and interactions is rarely precisely known. This single-number
approach is limiting and may not always lead to an alternative or decision
process satisfactory to stakeholders.
In response to a USACE request for a review of P&G planning procedures,
the National Research Council (NRC 1999) provided recommendations for
streamlining planning processes, revising P&G guidelines, analyzing cost-
sharing requirements, and estimating the effects of risk and uncertainty
integration in the planning process. As an integration mechanism, the NRC
(1999) recommended that further decision analysis tools be implemented to
aid in the comparison and quantification of environmental benefits from
restoration, flood damage reduction, and navigation projects. In addition,
new USACE initiatives, such as the Environmental Operating Principles
within USACE civil works planning, dictate that projects adhere to a
concept of environmental sustainability that is defined as ―a synergistic
process, whereby environmental and economic considerations are
effectively balanced through the life of project planning, design,

18
construction, operation and maintenance to improve the quality of life for
present and future generations‖ (USACE 2003a, p. 5).
In addition, revised planning procedures have been proposed to formulate
more sustainable options through ―combined‖ economic development and
ecosystem restoration plans (USACE 2003b). While still adhering to the
overall P&G methodology, USACE (2003b) advises project delivery teams
to formulate acceptable, combined economic development and ecosystem
restoration alternatives using MCDA and trade-off methods (Males 2002).
Despite the existence of new guidance and revisions on the application of
MCDA techniques to environmental projects, there remains a need for a
systematic strategy to implement these methods within specific USACE
mission areas (e.g., navigation and restoration) as well as linkage with
existing risk analysis and adaptive management procedures.
2.1.3.2 U.S. Environmental Protection Agency
Stahl et al. (2002) and Stahl (2003) reviewed the decision analysis process
in the U.S. Environmental Protection Agency (USEPA) and observed that
although USEPA has a mandate to make decisions in the public interest
pertaining to the protection of human health and welfare, there are barriers
in current USEPA decision processes that may discourage stakeholder
participation, integration of perspectives, learning about new alternatives,
and consensus building. Similar to the USACE, the USEPA uses a variety
of modeling tools to support its current decision-making processes. The
majority of these tools are quantitative multimedia systems that assess

19
benefits and risks associated with each proposed alternative with the
objective of selecting the best option (Stahl 2003).
Several USEPA guidance documents introduce decision-analytic tools and
recommend their use. Multicriteria integrated resource assessment (MIRA)
has been proposed as an alternative framework to existing decision analysis
approaches at USEPA (Stahl et al. 2002; USEPA 2002; Stahl 2003). MIRA
is a process that directs stakeholders to organize scientific data, establishes
links between the results produced by the research community, and
organizes applications in the regulatory community. MIRA utilizes AHP-
based trade-off analysis to determine the relative importance of decision
criteria.
Multi-attribute product evaluation is inherent in the nature of life-cycle
assessment, which has rapidly emerged as a tool to analyze and assess the
environmental impacts associated with a product, process, or service
(Miettinen and Hamalainen 1997; Seppala et al. 2002). Further, the USEPA
has developed the ―Framework for Responsible Environmental Decision-
Making‖ to assist the Office of Pollution Prevention and Toxics in their
development of guidelines for promoting the use of environmentally
preferable products and services (USEPA 2000). The ―Framework for
Responsible Environmental Decision-Making‖ decision-making method
provides a foundation for linking life cycle indicator results with technical
and economic factors for decision makers when quantifying the
environmental performance of competing products.

20
2.1.3.3 U.S. Department of Energy
Similar to the USACE and USEPA, the U.S. Department of Energy
(USDOE) uses a variety of multimedia models to support its decision-
making process. A recent review (Corporate Project 7 Team 2003)
concluded that even though there are a significant number of guidance
documents, systems, and processes in use within the USDOE to determine,
manage, and communicate risk, there is a great need for comparative risk
assessment tools, risk management decision trees, and risk communication
tools that would allow site managers to reach agreement with their
regulators and other stakeholders while achieving mutual understanding of
the relationship between risk parameters, regulatory constraints, and
cleanup. Several USDOE models have been developed specifically for
dealing with radiologically contaminated sites and sites with dual (chemical
and radiological) contamination. Several of the current models are
deterministic, although probabilistic multimedia models have also been
developed and used (USDOE 2003).
Several USDOE guidance documents introduce decision-analytical tools
and recommend their use. Technical guidance developed for a wide range
of USDOE decision needs (Baker et al. 2001) segregate the decision
process into 8 sequential steps: defining the problem, determining the
requirements, establishing the goals of the project, identifying alternative
methods and products, defining the criteria of concern, selecting an
appropriate decision-making tool for the particular situation, evaluating the
alternatives against the criteria, and, finally, validating solution(s) against

21
the problem statement. Guidance also focuses on how to select a decision-
making tool from among 5 recommended evaluation methods. These
methods include pros-and-cons analysis, Kepner-Tregoe (K-T) decision
analysis, AHP, MAUT, and cost-benefit analysis.
The USDOE has developed a standard paradigm for selecting or
developing a risk-based prioritization (RBP) system (USDOE 1998). The
paradigm describes the issues that should be considered when comparing,
selecting, or implementing RBP systems. It also identifies characteristics
that should be used in evaluating the quality of a RBP system and its
associated results. The USDOE (1998) recommends the use of MAUT as
an RBP model because it is a flexible, quantitative decision analysis
technique and management tool for clearly documenting the advantages
and disadvantages of policy choices in a structured framework. The MAUT
merits special consideration because it provides sound ways to combine
quantitatively dissimilar measures of costs, risks, and benefits, along with
decision-maker preferences, into high-level, aggregated measures that can
be used to evaluate alternatives. The MAUT allows full aggregation of
performance measures into 1 single measure of value that can be used for
ranking alternatives. However, USDOE (1998) cautions that the results of
MAUT analysis should not normally be used as the principal basis for
decision making because decision making will generally require accounting
for factors that cannot be readily quantified (e.g., equity). Furthermore,
USDOE (1998) guidance states that no technique can eliminate the need to

22
rely heavily on sound knowledge, data, and judgments or the need for a
critical appraisal of results.
The USDOE has used a multi-attribute model as the core of its
Environmental Restoration Priority System for prioritizing restoration
projects developed in the late 1980s (Jenni et al. 1995). Although the
Environmental Restoration Priority System was designed to operate with
any specified set of values and tradeoffs, its use was limited to values that
were elicited from USDOE managers, including those based on risk
analysis. The USDOE has not applied the Environmental Restoration
Priority System because of stakeholder opposition, although similar
decision support systems have since been adopted for use at various
USDOE sites (CRESP 1999). The USDOE has attempted to use simple
weighting to aid program planning and budget formulation processes
(CRESP 1999).
2.1.3.4 European Union
A detailed review of the regulatory background and use of decision-
analytic tools in the European Union (EU) was recently conducted within
the EU-sponsored Contaminated Land Rehabilitation Network for
Environmental Technologies project (Bardos et al. 2002). The review
found that environmental risk assessment, cost-benefit analysis, life cycle
assessment, and MCDA were the principal analytical tools used to support
environmental decision making for contaminated land management in 16
EU countries (Austria, Belgium, Denmark, Finland, France, Germany,
Greece, Ireland, Italy, the Netherlands, Norway, Portugal, Spain, Sweden,

23
Switzerland, and the UK). Similar to the United States, quantitative
methods such as risk assessment and cost-benefit analysis are presently the
dominant decision support approaches, while MCDA and explicit tradeoffs
are used less frequently.
Pereira and Quintana (2002) reviewed the evolution of decision support
systems for environmental applications developed by the EU Joint
Research Center. The concept of environmental decision support has
evolved from highly technocratic systems aimed at improving
understanding of technical issues by individual decision makers to a
platform for helping all parties involved in a decision process engage in
meaningful debate. Applications developed in the group include water
resources management, sitting of waste disposal plants, hazardous
substance transportation, urban transportation, management, and
groundwater management.
2.1.4 MCDA Applications for Environmental Management and
Related Uses
The MCDA applications are relevant to environmental management,
stakeholder involvement, and the management of contaminated lands.
Recent publications present more comprehensive reviews of studies
relevant to management of terrestrial sites (Linkov et al. 2004) and
contaminated sediments (Linkov et al. 2005). The use of MCDA is more
strongly evident within the broad areas of environmental management and
stakeholder involvement. Fewer efforts have been made to apply MCDA to
the management of contaminated lands and risk analysis. It should be noted

24
that MCDA has also been applied in many other related policy
development areas, such as manufacturing and services; medical, military,
and public policy (Keefer et al. 2002a, 2002b); climate change (Bell et al.
2003); industrial facility sitting (Larichev and Olson 2001); energy policy
(Hobbs and Meier 2000; Keefer et al. 2002a, 2002b); agricultural resource
management (Hayashi 2000); and life-cycle assessment (Seppala et al.
2002).
2.1.4.1 Application to general environmental management
The MCDA methods have been extensively applied to a range of
environmental management challenge. Each of the examples identified in
the course of this review were classified into 1 of 5 application areas: (1)
prioritization of site/areas for industrial/military activity, (2)
environmental/remedial technology selection, (3) environmental impact
assessment, (4) stakeholder involvement, and (5) natural resource planning.
Prioritization of sites/areas for industrial/military activity—
Management of contaminated sites often requires site zoning for
remediation, restoration, or other uses. Even though applications of
MCDA methods for contaminated site zoning could not be found in
this review, the MCDA methods described in (Kiker 2009) (e.g.,
multi-attribute value theory (MAUT/MAVT), analytical hierarchy
process (AHP), and outranking) have been used, in conjunction with
geographic information system, for selection of site boundaries and
the identification of geographical areas for related uses (e.g.,
industrial or military).

25
Mendoza et al. (2002) used AHP for allocating areas for military
training exercises at Ford Hood, Texas, USA. Keisler and Sundell
(1997) and Sharifi et al. (2003) proposed a framework that integrates
MAUT and spatial analysis to determine national park boundaries.
Joerin and Musy (2000) developed a generic method to integrate
multiple considerations, such as impacts, air quality, noise,
accessibility, climate, utility networks (e.g., water, electricity), and
aesthetics related to land management. Vaillancourt and Waaub
(2002) used outranking and a geographic information system
framework to select a site for a new waste management facility in
Montreal, Quebec, Canada.
Environmental/remedial technology selection— the selection of a
feasible remedial action is usually the final stage of a contaminated
site investigation (e.g., as required under the U.S. Superfund
program). This review identified several instances in which MCDA
methods were used to select the best technology or remedial method.
For example, a MAUT-based method was applied to compare
current and alternative water control plans in the Missouri River,
USA (Prato 2003). A related problem of regulating water flow in a
river–lake system was addressed by Hamalainen et al. (2001) from
the perspectives of group decision theory and stakeholder consensus
building. Wakeman (2003) used the simple multiattribute rating
technique (SMART) (Edwards 1977) to decide which action
alternative to implement in handling the contaminated river sediment

26
at Milltown Dam, Montana, USA. Factors considered by Edwards
(1977) included availability of materials and services, ability to
construct, and reliability. One of the most advanced applications of
MCDA techniques in this area was implemented for nuclear accident
emergency management as a part of the EU-RODOS project, which
used a MAUT analysis for strategy selection for population
protection after a nuclear accident (Ehrhardt and Shershakov 1996).
Environmental impact assessment—Environmental impact
assessments (EIA) are routinely conducted for all major projects in
the United States with the potential to affect the environment. The
assessment of site contamination is often an integral part of EIA.
Janssen (2001) reviewed 21 EIAs conducted in the Netherlands in
the period 1992–2000. Most of the EIAs reviewed by Janssen (2001)
used weighted summation methods, although a few projects used
either the AHP or a MAUT-based approach.
Marttunen and Hamalainen (1995) reviewed MAUT/SMART and
the AHP methods used for decision analysis in EIAs for the
assessment of environmental impacts of a water development project
in Finland. SMART was chosen over AHP because the AHP
procedure proved to be too time consuming for stakeholders
(Marttunen and Hamalainen 1995). Ramanathan (2001)
recommended the use of AHP for considering multiple criteria and
multiple stakeholders in EIA as well as to assess the socioeconomic
impact of a proposed liquefied petroleum gas recovery plant in an

27
industrial area in India. Rogers and Bruen (1998) used Elimination
Et Choix Traduisant la Realite (ELECTRE) III (outranking)
methodology in evaluating thresholds for noise impacts from a
highway project in Ireland. Al-Rashdan et al. (1999) used Preference
Ranking Organization Method for Enrichment Evaluations
(PROMETHEE) (outranking) methodology to rank environmental
impact assessments related to wastewater projects in Jordan; the
methodology was found to be very useful in solving problems with
conflicting criteria.
Natural resource management—the management of natural
resources has involved the application of MCDA. Steiguer et al.
(2003) developed an annotated bibliography that includes 124
examples of the application of MCDA to projects ranging from
theoretical studies to real-world forest and natural resource
management situations. Steiguer et al. (2003) indicate that MCDA
constitutes a newer and, perhaps, more acceptable method for
quantifying and evaluating public preferences. Nevertheless, few
studies included empirical testing of MCDA utility or its feasibility
and, in most of the studies, researchers have used hypothetical data
or, at best, simplified decision situations; few studies were designed
to implement an MCDA-generated management strategy.
The AHP approach within MCDA has received the most attention in
natural resource management applications (Steiguer et al. 2003). The
application of AHP in natural resource planning is summarized in

28
Schmoldt et al. (2001) with Table 2.1 listing some representative
publications. Schmoldt et al. (1994) and Schmoldt and Peterson
(2001b) used AHP to address different aspects of natural park
management, including developing inventory and monitoring
programs, as well as strategic management plans. Pavlikakis and
Tsihrintzis (2003) evaluated the utility of MAUT and AHP in
selecting a technically suitable and socially acceptable management
plan for a national park in eastern Macedonia and Thrace in Greece.
Table 2.1: Applications of decision support tools in environmental
management
Applicat
ion area Method Decision context Funding agency Citation
Prioritiza
tion of
sites/area
s for
industrial
/military
activity
AHP+ GIS
Land condition
assessment for
allocation of
military training
areas
U.S. Army
Engineering
Research and
Development
Center
Mendoza et al.
(2002)
AHP+ GIS
Selection of
boundaries for
national park
International
Institute for
Geo-information
Science and
Earth
Observation,
The Netherlands
Sharifi et al.
(2002)
PROMETH
EE
Waste
management
activities in
Canada
Natural Sciences
and Engineering
Research
Council of
Canada
Vaillancourt
and Waaub
(2002)
ELECTRE +
GIS
Land
management:
Swiss National
Foundation for
Joerin and
Musy (2000)

29
Applicat
ion area Method Decision context Funding agency Citation
develop a land
suitability map
for housing in
Switzerland
Research
(FNRS)
AHP + GIS Landfill sitting Siddiqui et al.
(1996)
MAUT +
GIS
Selection of park
boundaries USDOE
Keisler and
Sundell (1997)
Environ
mental/re
medial
technolo
gy
selection
SMART
Choosing a
remedial action
alternative at
Superfund site
U.S. Army
Corps of
Engineers
Wakeman
(2003)
MAUT
Selection of
management
alternative
Missouri River
University of
Missouri—
Columbia, USA
Prato (2003)
MAUT +
AHP
Regulation of
water flow in a
lake–river
system
Academy of
Finland
Hamalainen et
al. (2001)
MAUT
Offsite
emergency
management
following a
nuclear accident
(such as the
Chernobyl
accident)
European
Commission,
Ukraine
Ehrhardt and
Shershakov
(1996);
Hamalainen et
al. (2000)
Environ
mental
impact
assessme
nt
Review
Review of
MCDA use for
EIAs in
Netherlands
Vrije University,
The Netherlands Janssen (2001)
AHP Socioeconomic
impact
Indira Gandhi
Institute of
Ramanathan
(2001)

30
assessment for a
construction
project in India
Development
Research, India
ELECTRE
Highway
environmental
appraisal in
Ireland
Dublin Institute
of Technology;
University
College Dublin,
Ireland
Rogers and
Bruen (1998)
AHP and
MAUT/SM
ART
Environmental
impact
assessment of 2
water
development
projects on a
Finnish river
Finnish
Environmental
Agency;
Helsinki
University of
Technology
Marttunen and
Hamalainen
(1995)
PROMETH
EE
Prioritization of
EIAs in Jordan
Staffordshire
University,
United Kingdom
Al-Rashdan et
al. (1999)
Natural
resource
manage
ment
AHP Natural park
management
USDA Forest
Services
Schmoldt et al.
(1994);
Peterson et al.
(1994);
Schmoldt and
Peterson
(2001b)
AHP
Management of
small forest in
North Carolina,
USA
USDA Forest
Services
Rauscher et al.
(2000)
MAUT
Management of
spruce budworm
in Canadian
forests
National Science
and Engineering
Research
Council of
Canada
Levy et al.
(2000)
AHP,
MAUT, and
outranking
Forestry
planning in
Finland
Finnish
Academy of
Sciences;
Kangas et al.
(2001)

31
Finnish Forest
Research
Institute
MAUT
Improvement of
habitat suitability
measurements
Finnish Forest
Research
Institute
Store and
Kangas (2001)
AHP
Environmental
vulnerability
assessment for
mid-Atlantic
region
USEPA/USDOE Tran et al.
(2002)
Weighting
Management of
marine protected
areas in Tobago
U.K.
Department of
International
Development
Brown et al.
(2001)
MAUT
Fisheries
management:
select among
alternative
commercial
fishery opening
days
Fisheries and
Ocean, Canada
McDaniels
(1995)
AHP,
MAUT, and
outranking
Fisheries
management
Mardle and
Pascoe (1999)
A PROMETHEE = Preference Ranking Organization Method for
Enrichment Evaluations; ELECTRE = Elimination Et Choix Traduisant la
Realite; AHP = analytical hierarchy process; GIS = geographic information
system; MAUT = multi-attribute utility theory; MCDA = multicriteria
decision analysis; EIA = environmental impact assessment; USDA = U.S.
Department of Agriculture; USDOE = U.S. Department of Energy;
SMART = simple multi-attribute rating technique.

32
Methods of MCDA have been extensively applied to a wide range of
projects in forest management; AHP was applied for a project-scale forest
management problem by Rauscher et al. (2000), and MAUT analysis was
applied to identify policy alternatives to manage a budworm outbreak in a
local site in Canada (Levy et al. 2000). Kangas et al. (2001) tested the
application of several MAUT and outranking methods for large-scale forest
policy planning in Finland. Store and Kangas (2001) used MAUT-based
methods to conduct a habitat suitability evaluation over large forested
areas. Finally, Tran et al. (2002) used AHP to assess the environmental
vulnerability of forests across the mid-Atlantic region in the United States.
The MCDA has also been applied to manage aquatic resources. Simon and
Pascoe (1999) reviewed applications of MCDA in fisheries management.
Brown et al. (2001) used weighting-based trade-off analysis to select a
management option for Buccoo Reef Marine Park in Tobago; criteria
evaluated included ecological, social, and economic factors. McDaniels
(1995) used a MAUT approach to select among alternative commercial
fishery openings involving conflicting long-term objectives for salmon
management.
2.1.4.2 Application to Stakeholder Involvement
Most of the examples presented here attempt to represent the value
judgments of a single decision maker and incorporate these value
judgments into the overall decision-making process. Stakeholder values are
often considered as 1 attribute, along with others, such as costs or risk
reduction. The MCDA can also be used as a framework that permits

33
stakeholders to structure their views about the pros and cons of different
environmental and remedial management options. Applications of MCDA
for group decision making in other areas have been reviewed by Bose et al.
(1997) and Matsatsinis and Samaras (2001).
Arvai and Gregory (2003) was the only study identified that addressed the
application of decision-analytic tools to include stakeholder involvement at
contaminated sites. Arvai and Gregory (2003) compared 2 approaches for
involving stakeholders in identifying radioactive waste cleanup priorities at
USDOE sites, (1) a traditional approach that involved communication of
scientific information that is currently in use in many USDOE, USEPA,
and other U.S. federal programs and (2) a values-oriented communication
approach that helped stakeholders make difficult trade-offs across technical
and social concerns. The 2nd approach has strong affinity to the MAUT-
based trade-offs discussed earlier in this paper. Arvai and Gregory (2003)
concluded that the incorporation of value-based trade-offs information
leads stakeholders to making more informed choices.
Several studies propose the use of MCDA tools for consensus building and
advocate the utility of this application or illustrate the value-oriented
approaches that are based on MAUT. In general, applications may include
individual surveys and workshops designed to elicit value judgment and
construct decision alternatives. Specific applications include water resource
management (McDaniels et al. 1999; Gregory et al. 2001), mining
(Gregory and Keeny 1994), wilderness preservation (McDaniels and
Roessler 1998), and estuary management (Gregory and Wellman 2001).

34
The McDaniels et al. (1999) study concludes that value-based approaches
result in a higher level of comfort for participants and are useful in
developing consensus-based management decisions. The MAUT-based
applications appear to be used in stakeholder value elicitation for regional
forest planning (Ananda and Herath 2003), air quality valuation (Kwak et
al. 2001), and agricultural applications (Gomez-Limon et al. 2003). In
addition, Schmoldt and Peterson (2001a) advocated the use of AHP as a
decision support tool in workshop settings for forest resource management.
The examples presented previously used MCDA to facilitate consensus
building. An alternative application of MCDA is in the organization of
diverse interests instead of seeking consensus-based middle ground.
Gregory and Failing (2002) argue that a clear expression of difference
facilitates development and acceptance of management plans. Another
approach to ranking risk involves soliciting the views of participants both
as individuals and in a group setting (Morgan et al. 2000; Florig et al.
2001). In this manner, decision makers can obtain information on the
rankings of options that involve multiple objectives by weighing the
attributes identified by individuals and groups developed from the 2
methods.
Mental modeling (Morgan et al. 2002) may be a promising tool for
assessing individual judgments. It involves individual, 1-on-1 interviews,
leading participants through a jointly determined agenda of topics. The
method allows free expression and encourages elaboration on topics in
order to reveal individual perspectives at considerable depth. When

35
effectively done, analysts can identify what people believe and why they
believe it. They are also able to compare analyses over time and provide
insights into why beliefs change. Environmental applications of mental
modeling include management of the Illinois River basin in eastern
Oklahoma, USA, (Focht et al. 1999; Whitaker and Focht 2001) and in
energy policy development (Gregory et al. 2003).
2.1.4.3 Application to Management of Contaminated Lands
Most applications of MCDA have been conducted by USDOE to develop
decision models to evaluate specific criteria for the selection of remediation
technologies. Grelk (1997), Grelk et al. (1998), and Parnell et al. (2001)
have developed a decision analysis value model that is based on the process
required by the legislation in the United States supporting the Superfund
program. The USDOE has also sponsored a series of studies designed to
develop decision models used to perform analysis of remedial alternatives
for a mixed-waste subsurface disposal site at Idaho National Environmental
Engineering Laboratory, USA. Ralston et al. (1996) developed a generic
model that incorporates life cycle cost and technological risk assessment
for landfill waste site remediation. Timmerman et al. (1996) proposed the
use of MAUT by USDOE for selecting technology judged to pose the
lowest level of failure or development risks. Deschaine et al. (1998) used a
MCDA simulation model based on AHP to select the most promising
remediation projects from a 114 radiological site remediation portfolio at
the USDOE Savannah River Site. Accorsi et al. (1999a, 1999b), Bonano et
al. (2000), and Apostolakis (2001) developed a methodology that uses

36
AHP, influence diagrams, MAUT, and risk assessment techniques to
integrate the results of advanced impact evaluation techniques with
stakeholder preferences.
2.2 Sanitation Sector in Palestinian Territories
2.2.1 Introduction
In 1999 the Palestinian Environmental Strategy was adopted. Its time span
was until 2010. The strategy has paid special attention to the sanitation
sector. However, a year later of the strategy adoption, the political situation
was deteriorated and the consequences were damaging the Palestinian
environmental plans and the environment as well. As a result, the
sustainable projects changed to be emergency projects that deal with the
moment situation. Although efforts have been undertaken to establish a
regional Strategy for wastewater collection, treatment and disposal, these
concepts have not been followed up on a more precise level. Such studies
have been presented municipality-wise without coordinating efforts on a
regional level.
In 1997, UNDP has sponsored a Conceptual Strategy for the sewage
disposal in the West bank Region. As a result in 1998 the Regional Plan for
West Bank Governorates Water and Wastewater has been elaborated.
The preliminary objective of this master plan was to define the existing
types of sewerage facilities and their locations; to make recommendations
for the phasing of the required works and to identify the institutional set-
ups needed to ensure efficient operation and maintenance and financial
viability of the system, with particular attention to the option of

37
transforming the Jerusalem Water Undertaking (JWU) into a regional water
and sewerage service provider.
The conceptual plan has been prepared as an integral part of necessary
measures to remedy and improve these unsatisfactory conditions included:
Physical planning for implementation of sewerage systems
Institutional plan to comparatively evaluate potentially applicable
institutional types, and to determine the most visible and efficient
institutional arrangement.
Financial and economical plans to comparatively evaluate potentially
applicable utility organizational models, and to determine the most
feasible and economically efficient model.
The Palestinian census in 2007 has revealed that only 28% of the West
Bank communities are connected to a sanitation system. In addition, only
8% of the collected wastewater is being treated. The wastewater mostly
disposed through cesspits or flow in the wadies, and though, there are
serious risks of percolation of contaminants to the groundwater which is the
main source of fresh water in the West Bank.
The uncontrolled discharge of the untreated raw wastewater to the
subsurface poses potential risks to human health and contributed to the
degradation of the environment. This ongoing practice has been responsible
for contaminating and adversely impacting the scare water resources,
particularly springs and shallow water bearing units.
During the past years, the Palestinian Water Policy and Strategy, and other
legislative regulations were not effectively enforced reflected by actual

38
facts and figures, few of them are mentioned above. Thus the Palestinian
Water Authority (PWA) recognizes that in terms of providing sustainable
Wastewater treatment facilities, it is facing a continuous battle in keeping
pace with the impacts of disengagement, unilateral actions of the Israeli
government and unfair Israeli Water Law. As the responsibility of
regulation, formulation, promotion and monitoring of sanitation services
are vested with the PA Government, Town and Village Councils and Local
Authorities, all this calls for an urgent development of a unified Palestinian
Wastewater Policy.
Nowadays, there is an increasing interest in rehabilitating and developing
the sanitation sector in the Palestinian territories.
2.2.2 Regulatory Framework
Historically, the current water legal framework has been impacted by
several administrative and political regimes. Between 1952 and 1967
Jordanian water legislations were enacted within the West Bank while the
British system found application in the Gaza Strip, which was under the
Egyptian administration. Stemmed within the Israeli Water Law of 1959,
an Israeli Military Order No. 2 of 1967 affirmed that all water resources in
the occupied Palestinian Territories as state owned by Israel. However, in
the Oslo II Accord Israel recognizes Palestinian water rights in the West
Bank and these are to be transferred once agreed in the final status
negotiations. Currently, the Article 40, the water treaty signed by the Israeli
and Palestinian sides governs the wastewater management within the West
Bank and Gaza strip. Also, the memorandum of Understanding (MoU,

39
2003), inserted updates and further rules and guidelines pertaining to
establishment of wastewater treatment facilities and reuse schemes.
The Palestinian Water Authority (PWA) was established in April 1995 by
the Palestinian Authority (PA) through Decree no. 90/1995. The PWA
derives its authority from By-law No. 2 of 1996 and Water Law No. 3 of
2002. The Water Law established the National Water Council (NWC)
consisting of representatives of the most important stakeholders in the
water sector. The Palestinian National Authority (PNA) has formulated
both a Water Policy and a Water Strategy to tackle the increased water
scarcity and to manage, protect and conserve the limited water resources
available. The strategy entailed major high politics as the Palestinian water
rights and low politics like promotion of national water regulations, build
institutional capacity, improve data, increase capital investment in water
and wastewater sectors, enforce pollution control, and promote public
participation. In addition, the Environmental Quality Authority (EQA;
formerly Ministry of Environmental Affairs, MEnA) developed a
Palestinian Environment Strategy (PES), where the overexploitation of
water resources and the degradation of water quality were identified as the
issues of highest priority. Also, an Environmental Impact Assessment
(EIA) policy was endorsed by the Legislative Council, where new
wastewater treatment facilities shall obtain an official permit for
establishment through an environmental impact assessment study.
The key regulatory documents regarding wastewater treatment and reuse in
the West Bank and Gaza are the Water Law No. (3) of year 2002; the

40
Agreements with Israel, particularly the MOU of December 2003; and the
Environmental Law No. (7) of 1999.
2.2.2.1 Water Law No. 3, 2002
Water Law No. (3) of year 2002 which stresses the overall need to secure
sustainable development of water resources in a equitable way, makes the
following key provisions with regards to the disposal, treatment and reuse
of wastewater:
Property: All water resources are considered public property (article
3);
Regulation: A license must be obtained to set up or operate a facility
for water or wastewater (article 4) in order to ensure that effluent
discharges met standards that will not pollute existing resources;
Finance: A unified water tariff system should be set (article 20) in a
fair and equitable manner in order to promote the best use of water
resources;
Institutions: The Water Authority has the juridical personality and
full responsibility for managing the water resources and wastewater
in WBG; Water utilities will be established to provide water and
wastewater services (article 25); Regional utilities and water users
associations shall set the prices of water for different usage, in
accordance with the approved tariff system (article 26);
Protection of the Environment : Special guidelines for the
Environmental Impact Assessment for any activity related to water
resources should be prepared (article 29); Anyone who causes

41
pollution in any water resource or its supply system must remove the
pollution to that source or system at his own expense (article 32).
2.2.2.2 Joint Water Committee
There are two agreements with Israel with relevance to waste water
treatment and re-use:
The Memorandum of Understanding on Guidelines and Technical
Criteria for Sewerage Projects, signed 31st December 2003, Israeli –
Palestinian Joint Water Committee; and
The Palestinian-Israeli Interim Agreement On The West Bank & The
Gaza Strip, Washington, D.C., September 28, 1995; Annex III,
Protocol Concerning Civil Affairs, ARTICLE 40: Water and
Sewerage.
The MOU is the most recent document that governs treatment and reuse
standards and will consequently drive the treatment technology and reuse
strategies that will be used in WBG. The MOU sets out agreements for the
collection systems, wastewater treatment, sludge treatment, effluent reuse
and disposal, sludge reuse and disposal and cooperation between the two
sides. The MOU’s very high standards will make implementation costly
and very difficult even though a phased implementation approach to
meeting requirements has been agreed.
The implications and requirements of the MOU of December 2003 signed
by the Israeli and Palestinian Joint Water Committee include the following
elements:

42
All sewerage projects must be complete systems – i.e. collection
systems from source, conveyance to treatment plant, treatment plant,
a plan for reuse or safe disposal, conveyance to point of reuse or
discharge, and safe reuse or disposal of sludge;
Treatment plants must be modular to allow for future expansion: In
the first phase secondary treatment must be achieved; In the second
expansion phase tertiary treatment must be achieved;
Agricultural reuse is to be the primary focus for reuse. This must
include sufficient seasonal effluent storage;
Other forms of reuse must gain mutual agreement from both parties;
Industrial wastewater must be treated separately in a pre-treatment
facility; and
Alternatives for the location of treatment plants must be presented to
both parties and the selection will be agreed in the Joint Water
Committee.
2.2.2.3 Environment Law No. (7) of 1999
The environmental law No. (7) of 1999 provides for the protection of water
resources related to treatment and reuse. The implications of the
Environment Law and effluent standards include:
The requirement to set standards and norms for collecting, treating,
reusing and disposing wastewater and storm water in a sound manner
which comply with the preservation of the environment and public
health;

43
The requirement that any solid, liquid or other substance conforms to
the conditions and standards that the competent agencies determine.
2.2.2.4 National Water Plan
It is stated in the principles of water resources management in this plan that
we should utilize all technically and economically viable alternative
sources including wastewater re-use, brackish water and rainwater
harvesting wherever, and to the extent, practical to supplement overall
supply including artificial recharge to the groundwater aquifers by
infiltration. It is stated also in this plan that farmers and relevant institutions
should plan for maximum use of wastewater re-use in future including
provision for necessary storage, health precautions and crop patterns.
The use of treated wastewater and lower quality water must form a critical
component of future agricultural strategy. The long term target is that only
minimal fresh water will be provided for soil flushing and high value crops.
Other low quality water and conservation practices, including brackish
water, storm water harvesting, blending of water and conjunctive use of
saline and non-saline water, utilized to optimal economic and practical
effect in accordance with specific targets such as utilizing of 40 million
cubic meter per year in the West Bank and 63 in Gaza of treated effluent.
2.2.3 Waste Water Management Plan report (PWA Wastewater
Policies)
These section is explain the main point contained in the Waste Water
Management Plan report was prepared to PWA by Technical Directorate

44
Research And Development Department in august 2003 which is the last
report in this field.
Management of wastewater, storm water and reuse should be administered
through regional utilities for large systems wherever possible, and through
other appropriate structures for smaller and remote areas, integrated with
other sectors in national plans, and should result in a safe, healthy, and
protected environment.
All staff must be trained according to regulations, by donor organisation for
the first phase and based on Palestinian organisations on long term basis.
As a part of all new major developments focus must be given to the
development of a Palestinian wastewater industry. Hence representatives
for consultants, manufacturers, agents, universities and the relevant
authorities must be included in the projects from the earliest preparation
stage.
According to the report some policies that have to follow the Palestinian
Water Authority:
2.2.3.1 Wastewater Collection Policies
For all projects, all elements must be included, as least taken into
consideration. The relevant elements of collection systems, like storm
water harvesting, industrial connection, rainwater collection and upgrading
of poor quality network must be addressed in any wastewater treatment
plant development. PWA must make sure these elements are discussed and
addressed in any big development project. If this is not done, the ambition
levels described in the policy and the stated goals will not be reached.

45
The starting point is to establish clear regulations, specifications and
standards for the wastewater handling, and to make sure that collection
constructions fully comply.
The collection system for wastewater from domestic use within a defined
drainage area should be collected and managed separately from storm
water, and every wastewater source within this area should be connected to
the system. Sewerage system design should be based on gravity wherever
appropriate and must include solutions for existing or potential flooding
problems.
Storm water should be collected and used as a supplementary water source.
Where direct use of storm water is not feasible, effective recharge projects
should be planned and implemented.
More rainwater must be collected directly into cistern and water tanks. The
preliminary goal for year 2010 is to triple the existing collection volume in
Palestine compared to year 2000.
Infiltration rates must be increased in areas where they are low today.
These areas should within year 2010, recharge 3 % more of the
precipitation than today (preliminary goal until more information is
collected that makes it possible to establish goals with better basics).
Flooding problems connected to storm water runoff must be identified in
detail within the year 2001, and all major ones, solved within the year
2010.
Building codes of practice must encourage collection of precipitation and
reuse in an optimum way according to the water quality.

46
For every project that involves construction of new sewerage systems or
rehabilitation of existing system, storm water must be considered in order
to separate systems, include storm water solutions in the plan and
construction in accordance with policy and goals.
Areas with low infiltration rates must be identified and studies planned
which aims to increase the rates.
Within mid 2003 the goals must be quantified for short and long terms and
divided into areas.
The sewerage system, including pumping stations, storage systems,
overflows, etc. should have a minimum negative impact on the
environment.
As long as the performances of the major treatment plants are uncertain,
septic tanks, cess- pits and local other acceptable local treatment can be
kept, as a pre-treatment or not connected. The detailed solutions will be
decided in dialogue between PWA and the plant owners.
2.2.3.2 Industrial Wastewater Policies
For all relevant development projects, industrial connections and treatment
must be addressed. PWA must, through a permit process make sure this
element is taken care of. Ministry of Industry must be involved according
to agreed procedures.
All industries should be regulated through discharge permits from PWA
and comply with other PNA regulations (municipal by-laws, Ministry of
Environmental Affairs, Ministry of Local Governance, etc). The discharge
permits should include assurances that industrial effluents must have an

47
acceptable quality and flow before being discharged into water bodies or
domestic wastewater systems, and should not be discharged with contents
of heavy metals or micro pollutants above given limits.
In approving and issuing a discharge permit, emphasis should be given to
minimising the impacts from industrial effluents through internal measures
such as recycling, clean industrial processes and pre-treatment by using the
best available technology (taking economy into consideration).
2.2.3.3 Wastewater Treatment Policies
PWA must make sure its policy and goals are implemented through the
development. Through discussions with donor countries and beneficiaries
this must be assured. Ministry of Agriculture must be involved in the
process from the beginning in order to achieve successful reuse.
All treatment and/or reuse systems will be regulated through permits from
PWA. The permit should ensure that the system design
Is planned and implemented according to approved regulations,
specifications, standards, and guidelines
Allow treatment of calculated loads and meet stated effluent quality
for the designed period
Solves identified and potential environmental and health problems
Smaller treatment plants must be of types or classes accepted by PWA
regulations and operated accordingly.
The standard treatment demands for bigger plants are described in
documents from Palestinian Standard Institution.
Low cost technology is encouraged wherever it is most feasible.

48
All wastewater treatment processes should be chosen and designed to
consume as little energy as feasible and potential energy in wastewater and
sludge must be utilised whenever appropriate. In addition, independent
alternative energy sources should be installed, if appropriate (e.g., solar
systems, battery, heating exchange pumps, etc.). Farmers should be
involved in energy recovery projects thereby benefiting from wastewater
sludge utilisation.
PWA emphasises that sludge and treated wastewater are valuable resources
that must be utilised in an optimal way. In this regard agriculture is given
priority for reuse and 65% of treated wastewater should be utilised in this
sector.
Organising reuse of treated wastewater involves many stakeholders, and
should be co-ordinated on a national level and carried out on the
appropriate local level. The Wastewater Reuse Technical coordination
committee (between PWA and MoA) will the focal point for regulation of
reuse activities.
Public participation in wastewater reuse should be ensured and carried out
according to international practice for involvement.
For the optimal use of the treated effluent, incentives need to be established
and implemented in order to encourage and promote the use of treated
wastewater in different sectors, including industry.
2.2.3.4 Awareness and Stakeholders participation
PWA must ensure that needed awareness and stakeholder involvement,
through the Department of Consumer Affairs. This must be addressed at an

49
early stage of any process. It is very important for a smooth implementation
and especially for successfully implementation of reuse schemes.
PWA recognises that accessibility for environmentally safe wastewater
services must be assured in order to achieve better social equality. In this
respect wastewater treatment and reuse policies must include stakeholders'
involvement throughout the policy and strategy formulation by awarding
and informing them, in order to create a sense of ownership and
understanding. This approach will result in transparency and build-up
credibility among the parties and facilitate a smooth implementation of the
strategies and action plans.
Vital elements of the policy can only be possible in close cooperation with
stakeholders like farmers and other affected people. Especially awareness
must be established for the utilisation of sludge and treated wastewater as
important resources and to achieve acceptance of the principle of recycling
of resources.
2.2.3.5 Tariff Policy
Through the Tariff Department, PWA must make sure all development
understand the tariff model and are capable of implementing this. This is
needed as early as possible in any project. Partly this will be achieved
through general information and communication and partly through
implementation of bigger projects.
PWA has developed a tariff model, based on parts of the general policy. It
will be very important to, monitor the experiences regarding affordability,
and including of depreciation and O&M costs to adjust the ambition levels.

50
General tariff policies are,
Make sure the projects are affordable and feasible
Overall fees for storm water handling, wastewater collection, and
treatment, storage and reuse should be calculated in order to achieve
full cost recovery of the system(s) taking overall goals into
consideration
The elements of these fees should be distributed using the Polluter
Pays Principle (PPP)
Households cannot be charged more than the defined affordability
and the government should cover the gap between full cost recovery
and affordability
The farmers must contribute for making treated wastewater available
for irrigation
To facilitate enforcement of regulations and to sustain development of the
sector, PWA will use economic incentives for polluting industries to abate
and control pollution.
2.2.3.6 Legal and Administration Policy
The established licensing system for wastewater project must be used as
soon as possible for all relevant projects. PWA must also invite other
relevant authorities to participate in these processes.
PWA is considered according to By Law No. 3 (2002) and the Water Law
of 17.07.2002, as the responsible Palestinian authority for

51
Licensing and approving all water and wastewater projects and
activities including wastewater and storm water collection, treatment,
reuse, and/or disposal
Ensuring and overseeing the efficiency and compliance of these
activities and projects initially and during operation, according to
approved regulations, specifications and standards.
Administering the construction, operation, and maintenance of wastewater
and reuse systems will be done by municipalities or regional utilities with
various levels of co-ordination and involvement of other PNA organs, such
as the Ministry of Environmental Ministry of Industry, Ministry of
Education, Ministry of Agriculture, Ministry of Local Government, and the
Palestinian Water Authority.

52
Chapter 3
Current situation of institutional wastewater management
agencies in palestine
Several institutions including mainly the National Water Council,
Palestinian Water Authority (PWA), local committees and village councils,
local and international NGO’s and institutions, work in the wastewater
sector in the Palestinian areas, the Figure 3.1 is showing the Water Sector
Framework and Figure 3.2 is showing the main stakeholders in water and
waste water sector and the relationship between it.
Figure 3.1: Water Sector Framework

53
Figure 3.2: Main stakeholders in water and sanitation sector
3.1 National Water Council
National water council is highest body responsible of water and waste
water sector; Figure 3.3 is showing national water council framework.

54
Figure 3.3: National Water Council framework
Duties and prerogatives of the National Water Council:
Sanction the general water policy;
Sanction the policy for development and utilization of water
resources and the different usage;
Ratify plans and programs aimed at organizing the usage of water,
the preventing wastage, and directing consumption;
Ratify the tariff policy;
Confirming the allocation of funds for investment in the water
sector;
Approving the periodic reports concerning the activities of the
Authority and its work;
55
3.2 The Palestinian Water Authority
Since 1996, the PWA is responsible for regulation of the Palestinian
wastewater policy, including collection, treatment, sludge handling and
reuse. It is the Palestinian legal body that is responsible of:
Licensing and approving all wastewater projects and activities
including wastewater and storm water collection, treatment, reuse,
and/or disposal
Ensuring and overseeing the efficiency and compliance of these
activities and projects initially and during operation, according to
approved regulations, specifications and standards. However, and
due to the existing complicated political circumstances in the West
Bank and the insufficient wastewater management expertise staff, the
PWA faces great challenges in enforcing its regulations.
Coordinating with relevant wastewater sector development agencies
like the NGO’s and donors is still poor. The main issues concerning
the management of wastewater such as the collection systems,
treatment plants, regulations, standards, and regulations are not
available yet.
The Palestinian Water Authority (PWA) is by its by-laws a governmental
institution with an independent status with its own budget and follows the
President of the Palestinian National Authority and has a commissioner
who is appointed by its President. PWA is responsible for the management
of the most scare and vital sources for sustaining life, for promoting

56
development, and for maintaining the environmental in Palestine. Water is
in focus of the attention in the general public and the medic.
3.3 Other Government Institutions
Several other government agencies bear or will bear responsibilities
directly related to water resources and water and wastewater services.
The Joint Water Committee (JWC) was established under the Oslo accords
as a means to share information about water issues affecting both Israel and
Palestine. As a member of the Joint Water Committee, the PWA is the
primary Palestinian contact with Israeli authorities.
The Ministry of Agriculture (MOA) is responsible for planning and policy
concerning the use of water for agriculture, including reuse of treated
wastewater. As facilities for the treatment and distribution of treated
wastewater are implemented and brought into service, the responsibility for
the conversion of farmers to more efficient irrigation and more value added
cropping will fall heavily on MOA.
The Ministry of Environmental Affairs (MEnA) is concerned with
protecting the Gaza Strip’s natural environment. This includes setting
standards related to the conservation and protection of the environment,
such as:
Minimum water requirement to preserve the environment
Disposal of treated sewage in wadis, streams, rivers, lakes and seas
Disposal of treated sewage in environments, which affects the bio-
diversity

57
Regulation of the industrial wastewater which is not treated by the
utility
Disposal of brine from the desalination plants
The Ministry of Local Government (MOLG) is responsible for the
coordination of all Gaza Strip municipalities and other forms of local
government. As such they have considerable influence in the absorption of
municipal resources into the CWMU and in the continuing provision of
water and sewer services to the population.
The Ministry of Planning (MOP) is responsible for policy development,
coordination, and planning for the overall development of Palestinian areas,
including both the water resources and agriculture sectors. Every three
years, MOP prepares a Palestinian Development Plan (PDP), comprising
sections submitted by Palestinian institutions from various sectors. PWA
prepares the section on water and wastewater.
Ministry of Health (MOH) is responsible for the protection of public health
and safety. This includes setting the standards that are related to the public
health such as:
Drinking water quality.
Disposal of treated wastewater in bathing waters.
Disposal of treated wastewater in environment which affects the
quality of some products such as fish.
Treated wastewater reuse for irrigation which may affect the
agricultural products
Disinfection and drinking water storage.

58
3.4 Local Committees, Municipalities, and Village Councils
The local bodies are managed and develop public services in the cities and
village including the supply of sanitary services. Local committees are
formed wherever a village council does not exist and in refugee camp. The
councils and committees are generally unqualified from technical,
administrative and financial viewpoints, which lead to inefficient
management.
3.5 Local NGO’s and International Organizations
Many non-governmental organizations (NGOs), scientific and technical
groups, professional and other associations working on wastewater
management in Palestine such as Palestinian Hydrology Group (PHG),
Palestinian Agricultural Relief Committee (PARC), Applied Research
Institute Jerusalem (ARIJ), House of Water and Environment (HWE),
Water and Environmental Studies Institute at An-Najah National
University (WESI), Centre for Environmental and Occupational Health
Sciences (CEOHS) and Water and Soil Environmental Research Unit
(WSERU) at Bethlehem University, Institute of Environmental and Water
Studies (IEWS) at Birzeit University, and the United Nations Relief and
Works Agency for the Palestinian Refugees in the Near East (UNRWA).
International organizations of various statuses such as United Nations
Development Program (UNDP), World Bank (WB), and German Agency
for Technical Co-operation (GTZ), US Agency for International
Development (USAID), Save the Children Federation (SCF), America

59
Near East Refugee Aid (ANERA), and (CARE) conducted some
wastewater infrastructure projects.
The aforementioned organizations and institutions operate under severe
constraints: poor capacities, high political instability and uncertainty, and
inadequate sources of funding.
Moreover, co-ordination among the institutions is poor, which result in
vagueness in their roles in the management process of the wastewater
services. Consequently, a new institutional management approach with a
clear legal framework for optimizing wastewater management in Palestine
should be developed.

60
Chapter 4
Situation of sanitation in palestine and future plans
During the occupation period, sanitation sector to be a much neglected
issue, there are collection networks in the main cities and refugee camp
(served 28-32% of population) remaining population uses cesspits.
The situation for wastewater system in Palestine (WW Departments in
PWA, 2012):
During the occupation period, wastewater sector used to be a very
neglected issue
There are collection networks in the main cities and refugee camps
(served 28-32% of population) remaining population uses cesspits
Many of these networks are old and poorly designed established before
1967 through Jordanian Administration and stayed without development
The majority of the population uses individual or communal cesspits for
temporary storage of wastewater.
Ιn refugee camps sewage flows through open drains originally
constructed to convey rainwater.
Most villages have no sewerage system and wastewater is discharged
into absorption pits.
The existing wastewater treatment plants in the West Bank are
inadequate to serve the volume of wastewater produced
The situation of the sewerage system is extremely critical. Both the
West Bank and Gaza are facing a series of wastewater and sanitation
related problems:

61
large scale discharge of untreated wastewater
leaking of collected wastewater from sewer systems and cesspits
water treatment plants that are badly functioning
uncontrolled reuse of untreated wastewater by the irrigation sector
Total production of wastewater is around 70 MCM
Only 42% of 70 MCM (30 MCM) is collected in networks
Around half of the collected (15 MCM) is discharged into wadi and
treated inside the Green Line: Jenin, Tulkarm, Nablus west, Qalqilya,
Ramallah, Hebron and Beit Jala
Only 2 MCM is treated in Al Bireh WWTP
Around 13 MCM WW is discharged into Wadis (Salfit, Bethlehem,
Nablus East)
4.1 Situation of Wastewater in the Urban Area (1996-2012)
There are collection networks in the main cities (ranges from 57% in Salfit
to 98.7% in Qalqilya) remaining population uses cesspits and septics, the
Table 4.4 is show the wastewater status in Main Cities and Table 4.2 shows
existing wastewater treatment plants in urban area.
Table 4.1: Wastewater status in WB-Main Cities (WW Departments in
PWA, 2012)
No. Main
cities
% of ww
services Treatment services
1 Jenin
City 66.5
Treatment plant Under
Rehabilitation, then treated inside
GL
2 Tulkarem
City 73.7
Primarily treatment (lagoons), then
treated inside GL
3 Qalqilya
City 98.7
No WWTP (Treated inside GL)

62
4 Nablus
City 97.2
To start construction (Nablus West
WWTP
5 Salfit
City 57.1
No WWTP (discharged into Wadi
Matwi)
6 Ramallah
City 74.6
Overload WWTP, then treated
inside GL
7 El Bireh
City 85.8
Treated in Al-Bireh TP, not reused
8 Jerusalem
City 95
Under Israeli control
9 Bethelem
(WSSA) 92.7
No WWTP (discharged into Wadi
Al-Nar)
10 Hebron
City 82.1
No WWTP (Treated inside GL)
11 Jericho Zero No WWTP (using Cesspits) –
Under construction
Table 4.2 : Existing WW Treatment Plants -urban area (WW Departments
in PWA, 2012)
No. Project Name Status
1 Existing Jenin TP Under Rehabilitation (Funded by KFW)
2 Existing Al-Bireh TP Function at 2000 (Funded by KFW)
3 Existing Ramallah City Constructed 1973, overload
4 Existing Tulkarem City Primarily treatment (lagoons)
4.2 Situation of Wastewater in the Refugee Camps (1996-2012)
Most of the refugee Camps served with Wastewater Networks
The service exceeds more than 95% of the population.
Only Jericho Camps (Aqbat Jaber and Al-Sultan) has no
Wastewater Networks)
Most WW generated from the refugee camps are connected to the
Adjacent City wastewater Network or discharged into Wadi
(Qalandia, Al Jalazon, Al-Far’a and Al’Aroob)

63
The table below is show the wastewater status in Refugee Camps.
Table 4.3: Wastewater status in WB -Refugee Camps (WW Departments
in PWA, 2012)
No. Main cities % of ww
services Treatment services
1 Jenin Refugee
Camp 97.5 Connected to Jenin
2 Tulkarem Refugee
Camp 99.9 Connected to Tulkarm
3 Nor Shams
Refugee Camp 99.5 Connected to Tulkarm
4 Askar Refugee
Camp 99.8 Connected to Nablus
5 Balata Refugee
Camp 99.9 Connected to Nablus
6 Ein Bei El-Ma
Refugee Camp 99.6 Connected to Nablus
7 Al Jalazon 93.6 Discharged into Wadi
8 Al’Amari Refugee
Camp 98.1 Connected to Al-Bireh
9 Qalandia Refugee
Camp 97.5 Connected to Ramallah
10 Qadoura Refugee
Camp 90.0 Connected to Ramallah
11 Al Sultan Zero (using Cesspits)
12 Aqbat Jaber 0 (using Cesspits)
13 Ayda Refugee
Camp 99.4
Connected to Bethlehem
14 Al’Aza Refugee
Camp 97.5
Connected to
Bethlehem
15 Al Duheisha
Refugee Camp 94.0
Connected to
Bethlehem
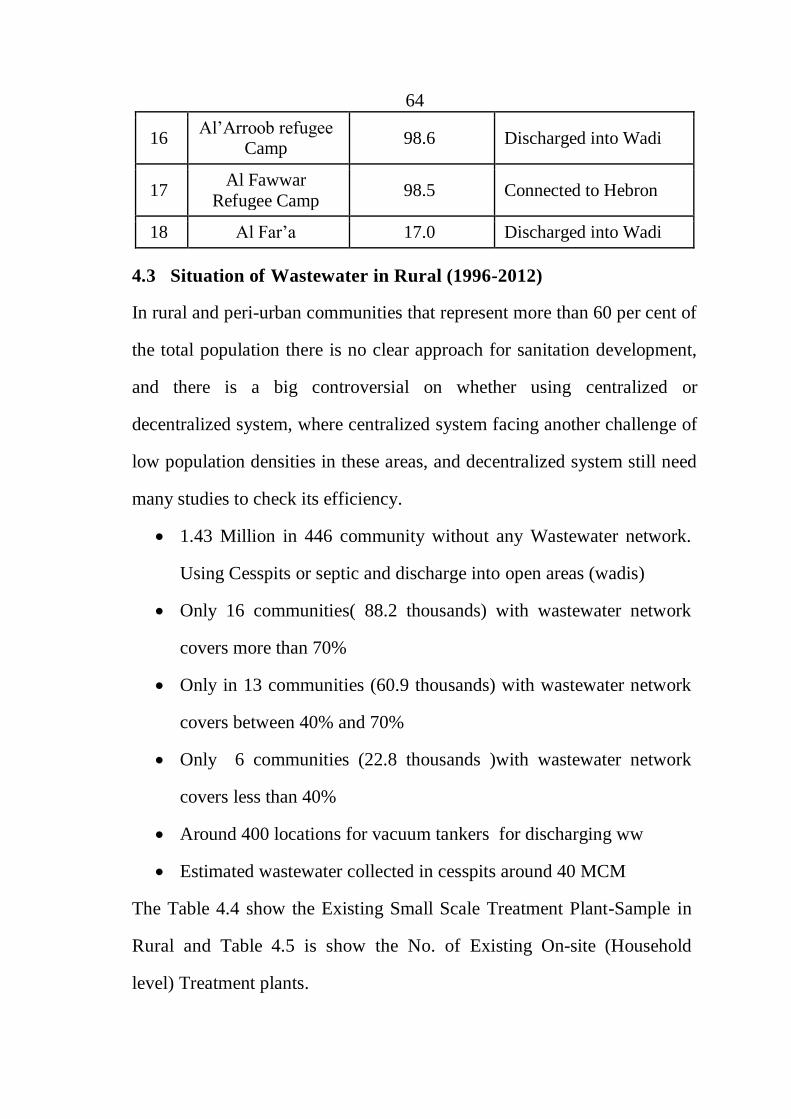
64
16 Al’Arroob refugee
Camp 98.6 Discharged into Wadi
17 Al Fawwar
Refugee Camp 98.5 Connected to Hebron
18 Al Far’a 17.0 Discharged into Wadi
4.3 Situation of Wastewater in Rural (1996-2012)
In rural and peri-urban communities that represent more than 60 per cent of
the total population there is no clear approach for sanitation development,
and there is a big controversial on whether using centralized or
decentralized system, where centralized system facing another challenge of
low population densities in these areas, and decentralized system still need
many studies to check its efficiency.
1.43 Million in 446 community without any Wastewater network.
Using Cesspits or septic and discharge into open areas (wadis)
Only 16 communities( 88.2 thousands) with wastewater network
covers more than 70%
Only in 13 communities (60.9 thousands) with wastewater network
covers between 40% and 70%
Only 6 communities (22.8 thousands )with wastewater network
covers less than 40%
Around 400 locations for vacuum tankers for discharging ww
Estimated wastewater collected in cesspits around 40 MCM
The Table 4.4 show the Existing Small Scale Treatment Plant-Sample in
Rural and Table 4.5 is show the No. of Existing On-site (Household
level) Treatment plants.

65
Table 4.4: Existing Small Scale Treatment Plant-Sample
No. Village /
Town Load (m
3/day) Status
1 Nuba
(Hebron) 15
2002 (Not functioning)
2 Kharas
(Hebron)
120
(40 household)
2002 (Not functioning)
3 Beit Dukko
(Jerusalem) 16
2000 (Not functioning)
4 Deir Samit
(Hebron)
15
(40 household)
2000 (Not functioning)
5 Bidya (
Salfit) 11
2007
6 Sir
(Qalqilya) 14
2006
7 Bani Zeid (
Ramallah) 50
2005 (Not functioning)
8 Zeita
(Tulkarm) 14
2008
9 Attil
(Tulkarm) 14
2007
10
Izbet
Shofeh
(Tulkarm)
15
2001 ( Not functioning)
Table 4.5: Existing On-site (Household level) Treatment plants
No. Governorate Total On-Site
1 Hebron 222
2 Bethlehem 97
3 Ramallah and Jerusalem 146
4 Salfit 10
5 Nablus 6

66
6 Jenin and Tubas 151
7 Tulkarm 6
On Going survey (through the EU & Austrian Project) to
evaluate these TPs (at least 70 % are not functioning as planned)
The Occupied Palestinian Territories are facing a rapid population growth
against a context of limited water-resources and poor wastewater
management. Most Palestinian households are internally equipped with
proper sanitation facilities (plumbed toilets, sinks, drains, etc.), but lack
means for proper collection and discharge. Only around 25 percent of
Palestinian households (35 per cent of the total population) are served by
central sewerage systems, and a further 17 per cent of the collected
municipal wastewater (from 6 per cent of the population) is partially
treated. The high percentage of unserved areas and lack of treatment plants
cause an over-reliance on traditional on-site systems for wastewater
disposal, mainly cesspits and septic tanks.
Traditionally, each household has a cesspit for the collection of excreta,
which often percolates into the surrounding soil. This is a disposal system
fraught with disadvantages, since it jeopardizes groundwater and the. In
addition, when the surrounding soil becomes saturated, cesspits require
frequent emptying using expensive private vacuum tanks, where the tanker
operators who empty the cesspits often do not follow rules and regulations
and discharge the emptied seepage within the surroundings of the
communities, especially in agricultural areas and open fields.

67
4.4 Investments and Progress in Sanitation Sector
The PWA is working to development the sanitation sector in Palestine by
construction and rehabilitation the sewer network and sewer pump station,
and by construction the WWTP. Table is showing the currently work in
wastewater projects
Table 4.6: On-going WW Projects (WW Departments in PWA, 2012)
No. Project Name Status
1 Baqa, Bart’a, Hable To start Implementation
(UNDP-Japan)
2 Misslye (collection System+TP) Funded by AFD (Under
Design)
3 Artas Collection System Funded by BTC
4 azmut and Rujib Collection
systems
Funded by MoF ( licensing
procedures)
5 Al-Tireh Collection system and
TP
Funded by moF
(Tendering Process )
6 West Bethlehem Rural
Collection system and TP
Submitted to World Bank
7 Jenin Industrial Estate Tp Funded by KFW
8 Bethlehem Industrial Estate TP Funded by AFD (need
approval JWC)
9 EU food Security (Rural Area) Call for proposal
In the WWTP project we can see the PWA is focusing to construct the
WWTP to service the main cities, Figure 4.1 and Table 4.7 show the
WWTP proposed and existing.

68
Figure 4.1:: Existing and future WWTP Projects (WW Departments in PWA, 2012)
Table 4.7 Proposed and Ongoing WW Treatment Plants (urban area)
(WW Departments in PWA, 2013)
No. Project Name Status
1 Jenin Regional TP Needs Feasibility Study
2 Tubas TP (Tayasir) Funded by AFD ( feasibility study)
3 Nablus East TP Approved and Feasibility study
finished (funded by KFW)
4 Tulkarm regional TP Funded by KFW ( Design phase)
5
Salfit TP Approved from JWC (No Fund (the
fund was reallocated to other
project by KFW

69
6 Ramallah Regional (Ein
Jaruit)
Approved and Feasibility study
finished (funded by KFW)
7 Jericho TP Under construction ( Submitted to
JICA)
8 Wadi Al-Nar (Ubeideiye)
TP
Needs Feasibility Study
9 Hebron TP Approved by JWC ( was funded by
USAID and canceled)
The following is a simple explanation for the most important projects
(WW Departments in PWA, 2012):
A. Regional Sewerage Project Jenin:
Project: Regional Sewerage Jenin
Total Investment: 40 Million USD
Donor: Germany KFW
Start Implementation: not yet
Status: TOR prepared needs approval from JWC
Obstacles: Feasibility study could not be tendered before approval
B. Regional WW Disposal Tulkarm:
Project: Regional Sewerage Tulkarm
Total Investment: 45 Million USD
Donor: Germany-KFW
Start Implementation: 2008
Period of Implementation: 3 years
Status: Feasibility Study ready
C. Sewerage Nablus West:
Project: Sewerage Nablus-west (investment/Infrastructure
restoration Measures)

70
Donor: Germany -KFW
Start Implemntation:1998
Period of Implementation: 37.8 Million USD
Status: Final Design ready
D. Ramallah Sewerage Treatment Project:
Project: Ramallah Sewerage Treatment
Donor: Germany KFW
Start Implementation: Not yet
Status: Feasibility study Ready
Obstacles: TP Location
E. Al-Bireh Wastewater Treatment Plant:
Project: Sewerage Al-Bireh
Total Investment: 12 Million USD
Donor: Germany - KFW
Start Implemntation:1998
Period of Implementation: 2.5 Years
Status: Functional TP
F. Salfeet Sewerage:
Project: Sewerage Salfeet (investment/Infrastructure restoration
Measures)
Total Investment: 11 Million USD
Donor: Germany KFW
Start Implementation: 1995
Status: postponed

71
Obstacles: JWU approval
G. Hebron WWTP:
Total Investment: 45 Million USD
Donor: USAID
Start Implementation: Not Yet
Status: Postponed
Obstacles: Regulation of USAID
H. Jericho WW collection System:
Donor: JICA
Start Implementation: Not Yet
Period of Implementation: 3 years
Status: Feasibility Study is Ready
Obstacles: Location of WWTP, JWC approval
I. Abu-Dis WW collection System:
Project: Abu-Dis, Al-Izarita & Az-Zaim WW
Total Investment: (25) Million USD
Donor: Submitted to AFD
Start Implementation: Not Yet
Status: Obstacles: Not Funded yet
Despite all what have been done, still huge efforts are needed to properly
manage the wastewater in Palestine.
4.5 Deficiencies and Problems
Palestinian Water Authority (PWA) is the main responsible for developing
the sanitation sector; PWA has an approach to provide urban areas by

72
centralized systems, but this face some challenges which are:
Challenges 1: Water Supply Priorities
Providing drinking water systems takes the priority where still more
than 220 thousands in around 220 communities without networks.
Challenges 2: Fund
Limited funding which is a major obstacle for the development and
maintenance of wastewater services. Current wastewater treatment
facilities are heavily overloaded, have inadequate maintenance and are of
low cost recovery.
Raising huge amount of fund to improve WW sector services more
than billion US Dollar are needed.
Donor regulations.
Limitation of fund and donor regulations and requirements.
Unsustainability & stability of External Donation: Donor funds only
to have sustainable & sanitation infrastructures, PWA policy and
strategies should carefully considers the affordability of
beneficiaries to pay for this service.
Challenges 3: Occupation
Some side effects of the Israeli occupation hinder the construction of
wastewater projects by Palestinians. The last 10 years, The Palestinians
allocated 250Millin USD for WWT projects but the Israelis stopped us by
one way or another.
Israeli conditions through JWC and Civil administration that
affect, postpones, stop projects for unreasonable aspects.

73
Connection of illegal Israeli Settlement effluent to Palestinian
Sewerage Systems.
Specifications and standers of effluents and treated WW imposed by
Israelis.
Security aspects.
Israeli Colonies effects on the Environment:
Israel is controlling the Palestinians for 40 years but they did
nothing to protect the environment.
Israel moved most of internationally forbidden industries to the
West Bank and disposes all toxic effluents into Palestinian land
without treatment.
95% of the industry in the Israeli settlements is considered toxic
& dangerous industries.
Total effluent sewage discharged to the Wadis by Israeli
Settlements is around 50 MCM.
Palestinian Agricultural lands around the settlements were
destroyed by untreated effluent.
Challenges 4: Selection of appropriate treatment systems and
technologies
That leads to WW management driving forces and treatment
technologies that achieve specific criteria by utilizing all type of
technologies that help to minimize the running cost, example:
produce gas CH4, incineration of sludge and available solid waste.

74
Challenge 5: Upgrading of the West Bank old urban sewage works
Odor nuisance:
Overloaded pond systems.
Misconception in design.
Land availability:
No space for extension.
Challenge 6: Final effluent disposal:
Reuse in agriculture: where, this was one of the main target of
Master Plan started in 1996.
Treated WW recycling and reuse is considered a very important
option for generating additional water resources to replace fresh
water used for agricultural and industrial purposes.
Artificial Recharge through Disposal final effluent in Wads:
environmental impact; compliance with political agreements.
Final effluent Reuse (selecting the appropriate crops and encourage
farmers to reuse the effluent).
Challenge 7: Enforcement of policy and laws:
PWA policy: Based on ―Polluter Pays Principle‖ and envisages a
full cost recovery based on affordability basis, water-tariff models
should be developed to assure cost recovery.
Palestinian Water Law: Set of regulations and rules entailing
pollution fees for environmental pollution handlings.
Challenge 8: Capacity building:
Building and maintaining a core staff for managing and regulating

75
the wastewater projects: review of documents and formulation of
future plans.
Prepare for all training and capacity building program that required
to support sustainable operation of the WWTP, and to achieve value
from reuse of the treated wastewater.
Challenge 9: On the technical and Institutional levels, still some
obstacles
Lack of technical Experience in Design, operate and maintain
WWTP
Un-defined Wastewater Reuse Strategy
Weakness of the institutions to run WW project due to:
Lack of qualified staff
Lack of financial resources
Lack of practical experience
Lack of Institutional management body and cost recovery
(affordability and sustainability).
Challenge 10: Absence of Public & Educational Awareness Strategy
Institutional level
Operators level
Farmers level
4.6 Driving Forces for WW Management
Public health risks: waterborne diseases
Environmental protection: water resources and soil
National and regional policies: standards and guidelines

76
Adequate sanitation services: life quality standards
Economical benefits: reuse and recreation
Political issues: regional stability
4.7 Opportunities
Master Plan for Water& WW is Available
Location of WWTP’s is Approximately Defined
Availability of the land for construction WWTP
Willingness of the beneficiaries to participate in implementing the
project
Availability of extended irrigable land for WW reuse
Availability of fund to start implementing the project
4.8 Existing and Future Plans:
PWA work on several plans, including (WW Departments in PWA, 2012):
4.8.1 To Stop Flowing Wastewater Toward the Green LINE to be
Treated and Reused in Palestine
Value of treated wastewater as resource
Stop deducting money by the Israeli to treat and upgrade the
treatment plant inside the green line
Centralized WWTP (>15000 m3/day) (Jenin regional, Nablus East,
and Wadi-Alnar)
Semi-Centralized WWTP (5000 – 15000 m3/day), (Tulkarm,
Nablus West, Hebron, Jericho
De-centralized (local WWTP), (Intensive with electro-mechanical
equipments-small space

77
Onsite WWTP ( extensive without electro-mechanical equipments-
large space
4.8.2 Criteria for WWT Selection
Satisfactory treatment efficiency towards: COD/BOD, suspended
solids, N, P, etc.
Robust technology: high stability towards power cut, peak loads,
toxicants, etc.
Flexible with respect to future amendments (extensions,
improvement)
Simple in operation maintenance and control and low running cost
Limited number of treatment steps
Absence of disposal problems (e.g. sludge)
No malodor nuisance
Availability of local experience
Designed for (by) product recovery
Availability of required land
Avoid of side effect problems (e.g. odour)
Availability of required spare parts
4.8.3 Look into the Future Sustainable Planning of WWTP
WW treatment facilities
Realistic planning and management?
Affordable CAPEX and OPEX?
Political issues
Sovereignty?

78
Political power?
Commitment?
Financial Resources
Effective financial management
Socio-cultural aspects
Public awareness and cleaner production tools
Institutional issues
Establishment of wastewater associations?
Private sector involvement in sanitation services
Pollution control & reuse guidelines?
Water quality & public health protection?
4.8.4 Centralized WWTP (>15000 m3/day or 200,000 PE)
The centralization can be implemented if all the following fulfilled
Adequate financial investment (at least 100 million USD)
High potential for wastewater reuse (availability of irrigable lands)
Availability of land to construct the treatment plant, to expand in the
future and to construct larges earth reservoir (at least 500,000 cubic
meter capacity or 21 days) or harvesting water dam (to store the
effluent in winter)
High well prepared institution and technically trained staff to
operate and maintain the plant adequately
Emergency plans to deal with influent in case of technical failure
Stability of financial resources

79
4.8.5 Look into the Future Sustainable Operation Small WWTP
Financial Resources
Effective financial management
Socio-cultural aspects
Public awareness and cleaner production tools
Institutional issues
Establishment of wastewater associations?
Private sector involvement in sanitation services
Pollution control & reuse guidelines?
Water quality & public health protection?
4.8.6 Main Cities and Urban Areas
Treatment Plants to serve all population within the city and adjacent
camps or communities
Network to cover 100% of the population in the city either by
gravity or by booster pumping stations.
Forbid any construction for individual sanitation ( cesspits, septic
tank or on-site treatment)
Secondary or Tertiary Treatment (BOD<20, TSS<30, N<50)
Adequate pre-treatment for industrial wastewater before dumping
into WW networks
Reuse the treated effluent in suitable crops or for artificial recharge
in Winter
To Construct Effluent reservoirs to collect the treated wastewater
for at least 30 days for sustainable reuse

80
4.8.7 Priorities for Selecting Wastewater Projects (Main Cities
&Urban Areas)
Not served cities like Jericho and adjacent camps
To follow up to implement the funded Projects ( Tulkarm, Tubas,
Nablus West and Ramalla-Beitunia)
To allocate fund to construct the approved treatment plants ( Hebron
and Salfit)
To prepare necessary feasibility studies and EIA for (Nablus-East ,
Al’UBeidiye, Abu Dis and Jenin Regional)
4.8.8 Semi Urban (Population 5000-10000) and Rural Areas
(Population 2000-5000)
To construct secondary treatment plant to serve at least the whole
community or different communities with design period 25 years
to construct wastewater networks to serve at least 80% of the
population either by gravity or by pumping stations
To construct individual sanitation (group septic tank, individual
septic tank or on-site treatment) to serve not connected population to
the collection system
Forbid using cesspits and free discharge in wadi or surroundings
Locally reuse the treated effluent in suitable crops according the
Palestinian Standards for WW reuse
4.8.9 Priorities for Selecting Wastewater Projects (Semi Urban and
Rural Areas)
Public health risks: waterborne diseases

81
Environmental protection: water resources and soil
Quantity of generated Wastewater
Availability of the land to construct treatment plant
Cropping areas for irrigation and suitable crops
Willingness of the local authority to operate and maintain the
system
Strong will to develop a sanitation project (financial and non
financial contribution)
Ability to recover water and wastewater bills
Commitment to set up a sanitation fee covering operation and
maintenance costs)
4.8.10 Rural Areas and Small Communities (De-Centralized (Local
WWTP))
Construct low cost WWTP to serve at least the whole community or
adjacent communities when topography allows.
Construct wastewater network/s to serve most of the population by
gravity and avoiding pumping station.
Construct individual sanitation (collective septic tank, individual
septic tank or household treatment (grey water) to scattered houses
that not connected to wastewater network/s
Provide vacuum tankers for evacuating the cesspits and for safe
disposal in nearby treatment plant
Forbid construct new cesspits and replace them with concrete septic
tanks

82
Forbid free discharge in wadi or surroundings
Encouraging Locally reuse the treated effluent in suitable crops
according the Palestinian Standards for WW reuse
4.8.11 Reuse & Recycling
Reuse in agriculture: where, this was one of the main targets of
Master Plan started in 1996
Treated WW recycling and reuse is considered a very important
option for generating additional water resources to replace fresh
water used for agricultural and industrial purposes
4.8.12 PWA with Cooperation and Coordination with all
Stakeholders and Beneficiaries will do Strongly and Effectively
For appropriate and realistic management and planning
For the promotion of the sustainable practices
Enforcement of policy and laws
Training and capacity building program that required to support
sustainable operation of the WWTP

83
Chapter 5
Criteria Idntification
This chapter aims to define criteria that affect the sanitation sector, which
will be done through the following:
A. Identify the criteria used in some countries.
B. Stakeholder Consultation such as institutions; organizations;
ministries; universities and municipalities.
C. Identify the criteria established by the laws and strategy in Palestine;
these criteria are shown in 0 and 0.
D. Questionnaire for citizens.
E. EQA Terms of Reference (TOR) on sanitation projects.
F. Determine the criteria followed by donors in the projects.
5.1 Criteria Used in Some Countries
5.1.1 Egypt
National Rural Sanitation Strategy was released in September 2008 is
talking about unserved areas has developed a program called (Diversion
Program).
The Diversion Program concept makes pollution abatement the first
priority in this strategy. Therefore all the municipal sewage, seepage flows,
and solid wastes of each Sanitation Service Cluster (SSC) should be
directed to a central Integrated Treatment Facility (ITF), thus eliminating
(―diverting‖) unsanitary habits of discharging liquid and solid wastes to
canals and drains in the service area. SSC treatment and conveyance
facilities are planned on the basis of an SSC’s flow composition.

84
The Diversion Program would be implemented in two stages. The first
stage would involve three types of investments:
a) Construction of a ―first-stage‖ fecal sludge/seepage treatment facility
(plus a solid waste management "SWM" facility) in each SSC
b) Reorganization (and where necessary, purchase or contracting) of SSC
seepage evacuation truck services, ensuring conveyance of all septic wastes
to the treatment facility
c) Construction of pumping stations and force mains to convey wastewater
from existing gravity sewered areas (and selected on-site systems) to the
SSC.
Ministry of Housing, Utilities, and Urban Development (MHUUD) would
undertake, through Holding Company for Water and Wastewater (HCWW)
and its affiliated companies and National Organization for Potable Water
and Sanitary Drainage (NOPWASD), all responsibilities of liquid wastes;
while Ministry of Local Development (MLD) would undertake all
responsibilities of solid wastes, through governorates and rural local units.
The second stage of the Diversion Program involves the completion of full
wastewater treatment trains in SSCs and planning and implementation of
appropriate sewerage interventions in unsewered villages or clusters of
villages. Criteria for village and community prioritization might include:
Subsurface water level
Population size and density
Water consumption levels
Ability and willingness to participate.

85
This prioritization scheme recognizes that high water table poses a serious
public health and building risk in many villages. But the treatment facilities
have the absolute priority and must be set in place first, and when funds
become available, some sewerage projects can be introduced in parallel
with ITF construction.
5.1.2 Iraq
Through my work in (Samawa Al-Soub Al-Saghir Sewerage and
Stormwater Systems Design in Iraq) there are lists of possible
environmental impacts will be analyzed selected from General directorate
of Sewage in Ministry of Municipalities &Public Works (MMPW):
The topography of the study area and flat plains.
The selected site for the planned STP and its relation with the flood
plan.
The geological formations of the project area.
The surface runoff and storm water runoff originating from urban
and rural areas.
Land use classifications within the study area and long-term planning
policies envisaged. The present main land uses within the study area
are residential, agricultural and commercial with no large industrial
enterprises.
Rain-fed and irrigated agricultural practices in the area with
prevailing crop patterns (vegetables, fruit trees and field crops).
The current main roads in the study area within the urban and rural
areas.

86
Soil investigations will be made. The natural biotic life of the study
area shows no sensitive habitats with insignificant biodiversity
relevance. A detailed EIA study shall investigate the soil type, flora
and fauna dominating in the study area.
Site Identification: The sites shall be studied carefully based on the
following site selection criteria:
Distance from the Urban Area Limits and the surrounding residential
areas.
Distance between effluent discharge point and reuse option.
Prevailing wind directions.
Topography of the project area.
Effluent discharge.
Sites accessibility.
5.1.3 Libya
The criteria presented in the following sections are provided as the standard
basis for all projects prepared for the Libya Housing and Infrastructure
Board (HIB). These criteria are mention in Guidance Document, Revision
No. 01 in 21 August 2008, Libya Housing and Infrastructure Board (HIB).
These criteria are:
Population and growth projections.
Sewage flow generation.
Sewage loadings.
Reusing wastewater.
Ground water.

87
Solve an immediate environmental problem.
Solve the problem of the dumping of waste water into the sea
(coastal areas).
5.1.4 South Africa
There are a lot of factors shared between Palestine and South Africa, the
most important of the scarcity of water and lack of sanitation systems only
in major cities.
In 1994 approved to (NATIONAL SANITATION POLICY). The most
important reportedly in the National Sanitation Policy in to identifying the
priorities of sanitation sector is:
The proposed system affordable to the user, the service supplier and
the government.
Number of people will be served compared to the cost of the project
The risks to the environment
Acceptable to people (bearing in mind the cost to them)
Water supply, Is it adequate? Can it support the proposed sanitation
system?
Also the National Sanitation Policy stipulates the following:
The design of sanitation improvement projects will ensure that the
environmental consequences are adequately considered during the
planning process. The risk of pollution through different sanitation
approaches will be assessed in order to use the option which will
minimise impacts on the environment in the most cost effective way.
The Integrated Environmental Management (IEM) Guidelines have

88
been prepared on what level of impact assessment to use for different
types of projects.
Where it is envisaged that a significant environmental change may
result, public awareness and participation is essential. Information
must be presented in an even handed manner in order to convey the
potential costs and trade-offs. For example, comparison of the costs
of avoiding pollution with those of treating the pollution after it has
happened should be accompanied by an explanation of the receiving
water quality objectives.
Environmental Impact Assessment (EIA) procedures should be
followed during the design and sitting of waste water treatment
works and waste disposal sites. As the degree of complexity may
vary according to the anticipated risk, appropriate risk assessment
procedures need to be developed.
5.2 Stakeholder Consultation
Several consultative interviews were conducted with stakeholders in the
sanitation sector such as institutions; organizations; ministries; universities
and municipalities to identify the issues and concerns to be taken into
consideration during the criteria-setting. The consulted parties, and
feedback, comments, and concerns are listed below.
5.2.1 Consultation with Palestinian Ministries
Several consultative interviews were conducted with the Palestinian
Ministries and Authorities. These included Ministry of Agriculture (MoA),
Palestinian Water Authority (PWA), Ministry of Tourism and Antiquities

89
(MoTA), Environmental Quality Authority (EQA) ), Ministry of Local
Governments (MoLG), and Ministry of Labor (MoL).
5.2.1.1 Ministry of Agriculture (MoA)
On November 22, 2012, Eng. Thaer Al- Rabi from MoA was interviewed
and he indicated the following:
• The Ministry supports the establishment of a sewage networks and
treatment plants in the west bank and they have no objection about
any projects unless inconsistent with the requirements of the
Ministry.
• MoA supports of the re-use of treated wastewater to irrigate crops
only if the farmers will follow the instructions of the ministry, also
they have some concerns about this matter because of the lack of
staff to control this process.
• The Agricultural Sector Strategy within the Palestinian National
Strategy (PNP) 2011-2013 emphasizes finding alternative sources for
water (treated wastewater). However, there are regulatory
instructions for using treated wastewater for agricultural purposes.
• The Palestinian Standard, PS 742, of Palestinian Standards Institute
(PSI) regulates and permits use of treated wastewater on fodder and
tree crops only.
• The ministry opposes cutting down fully protected trees, while for
the rest of the trees if there is no alternative site for the station they
will have no objection of removing and re-planting them to another
land, but only under the competent authorities supervision.

90
• Application must be submitted to the Ministry of Agriculture for the
use of agricultural lands for other purposes to be reviewed by a
specialized committee at MoA.
• He mentioned that the sewage projects are expected to contribute to
increase the agricultural production.
• He emphasized that the awareness level must be raised among the
citizens through the distribution of booklets and conducting seminars
about precautions and concerns of dealing with treated waste water.
• For crops irrigated with treated wastewater there is no problem in
changing patterns of agriculture in the region but only according to
the nature of the land and within the instruction of the ministry
taking into consideration that the farmer always seeks to increase his
agricultural production with higher benefit.
• There are mandatory instructions from the Ministry of Agriculture
about re-using the treated wastewater for all beneficiaries.
• Regarding using treated sludge as compost in agriculture,
Palestinians have no such experience. Sludge should preferably be
transferred to sanitary landfills. Main problem of sludge is the
accumulated heavy metals and chemicals rather than the organic
matter.
He mentioned that the select criteria should be sensitive to the following:
capability to re-use of treated wastewater, nature of the agricultural lands
and patterns of agriculture in the region, agricultural production.

91
5.2.1.2 Palestinian Water Authority (PWA)
On November 26, 2012, Eng. Adel Yaseen was interviewed from PWA and
he indicated the following:
• He expressed his concerns about the need for permits from the Israeli
side and difficulties to obtain them and also about farmers to accept
the possibility of reusing of treated wastewater. Also how to dispose
the treated wastewater at the time of emergency and in case of
problems in the operation.
• He emphasized the point that the PWA rejects to link settlements
with any treatment plant.
• Treated water will help to reduce the demand of drinking water used
in agriculture, and will provide additional water to increase
agricultural production.
• PWA does not mind the use of treated wastewater in groundwater
recharge in the event of the treated wastewater reached to the level of
quality permitted for use in the recharge of groundwater.
• Mechanism for addressing contingencies and emergencies must be
clarified, especially in regards to potential contamination to
groundwater resources.
• Odors and proximity to residential areas are concerns, especially in
an area that is relatively very warm in summer. Wind direction with
regard to the WWTP location from residential areas must also be
considered.

92
He mentioned that the select criteria should be sensitive to the following:
Water consumption, hydrogeological profile as well as water slopes and
vulnerability.
5.2.1.3 Ministry of Tourism and Antiquities (MoTA)
On November 14, 2012, Mr. Awni Shawamre was interviewed and
indicated the following:
• Must protect archaeological and historical sites
• It is the responsibility of the MoTA to scan the area and conduct a
field survey and facilitate in the assessment activities.
5.2.1.4 Environmental Quality Authority (EQA)
On October 30, 2012, Eng. Amjad Al Kharraz from EQA was interviewed
and he indicated the following;
• EQA supports such projects if they were built on scientific and
environmental basis.
• EQA started to support projects of sewage networks and treatment
plants in general in the West Bank because it is environmental
friendly.
• EQA has no objection of re-using treated water to irrigate crops, but
after following the Palestinian standard of water treatment in
irrigation some crops but not all of them can be irrigated by treated
wastewater, and also forest trees of various types within the
instructions of the Ministry of Agriculture.
• Regarding to solid waste that result from the process water treatment
solids (sludge) he has pointed out that at present there is only one

93
solution to the EQA which is to send the sludge to certified landfill
after treatment because there is no of a Palestinian standard for re-
using it.
• Awareness programs should be conducted for the farmers with
emphasis on limited use of treated water for irrigation certain and the
types of crops that to be irrigated by the treated wastewater
according Ministry of Agriculture.
• MoA opposes changing agricultural patterns in the Palestinian areas
randomly without a sustainable strategy in this regard.
• Alternatives should be studied in detail whether the site or the
technology used in the station and there must be an integrated plan
for the reuse of treated water.
• Several actions must be considered during the excavation and
construction process to preserve the environment during the
establishment of the sewer network in coordination with the targeted
municipalities.
He mentioned that the selected criteria should be sensitive to the
environmental issues.
5.2.1.5 Ministry of Local Governments (MoLG)
Based on previous conversations with Mr. Suleiman Abu Mfarreh, he
emphasizes the following points:
• Wastewater treatment and reuse is becoming a national priority.
• MoLG maintained that the project must be compatible with the
existing and future land uses. In addition, it should take into account

94
the political land classifications: Areas A, B, and C (Area A: Under
full Palestinian civil and military control. Area B: Under Palestinian
civil control and Israeli military control. Area C: Under full Israeli
civil and military control).
5.2.1.6 Ministry of Labor (MoL)
Based on previous conversations with Mr. Iyham Nsoor, he emphasizes the
following points:
• The sanitation projects would result in job creation at different levels
through construction and operation.
• The projects should comply with the Palestinian Labor Law No. 7
adopted in 2000. The Law provides regulations for workers' health
and safety measures, safe and healthy work conditions, life
insurance, accident insurance, working hours, and wage rates.
• Safety measures should be provided.
5.2.2 Consultation with Universities
Consultative interviews were conducted to Water and Environmental
Studies Institute (WESI) at An-Najah National University (ANU). The
Water and Environmental Studies Institute (WESI) at An-Najah National
University (ANU) was established in June 2001, as a result of upgrading
Water and Environmental Studies Center founded in 1994. The main
objective of WESI is to serve the Palestinian community's needs in terms of
studying, monitoring, describing, controlling, and following up all issues
and aspects related to the present and future state of water and environment
in Palestine.

95
Through multiple meetings with Dr. Prof. Marwan Haddad as my thesis
supervisor, and Associate Professor and Director, Water & Environmental
Studies Institute (WESI), he indicated to we should look at the following
criteria: Ground water, Amount of water consumption, Availability of
agricultural land, Collection rate for electricity and water bills, Pricing of
water, Reuse, Geographical location, Agricultural pattern, Citizens to
accept the use of treated water in agriculture, Water availability, The
existence and condition of water networks and coverage ratio, Political
Constrains, Environmental sensitivity, Social problems, Service Provider
(Municipality, Village Council, the Council of shared services, ....) and
preparations for such a project, Religious, tourist, and archaeological areas,
Water Resources, an Industrial activities and olive presses.
5.2.3 Consultation with NGOs
Consultative interviews were conducted with the House of Water and
Environment (HWE). The House of Water and Environment (HWE) is a
Palestinian not-for-profit NGO that was established in the year 2004. HWE
aims to promote practical research into the current and future state of water
resources and the environment in Palestine and across the region.
On January 26, 2013, Eng. Abdelhamid Alshami (Research Associate -
Water and Environmental engineer) was interviewed from HWE and he
indicated the following:
According to HWE experience in wastewater sector, to identify the area we
should look at the following (start from the most important factor):

96
1- In general, the areas that has open wastewater streams must have the
most priority because they have highly significant negative impact
on environment in addition to health and social impacts if these
streams flow through or near the built-up area (like salfeet
wastewater and Wadi Al zomar).
2- Vulnerability or Sensitivity of ground water.
3- Existing of agricultural lands that suffer from water shortage.
4- Existing of notable health problems due to the cesspits (if there are
reports assure that).
5- Population number.
For selecting the location of the WWTP, we should look at the following
criteria (start from the most important factor):
1- Distance to built-up area and future extension, which reflect on
residents health and their satisfaction.
2- Vulnerability or Sensitivity of ground water.
3- Existing of suitable reuse site.
4- Political Constrains, A, B, C.
5- Suitability of land (flat land or suitable slope).
6- Flood Risk.
7- Land ownership.
5.2.4 Consultation with Private sector
Consultative interviews were conducted to private sector (Companies that
have worked in the field of consulting, studies, designs and supervision in

97
the sanitation sector) like Universal Group for Engineering & Consulting
(UG) and Center for Engineering and Planning (CEP).
5.2.4.1 Universal Group for Engineering & Consulting (UG)
Universal Group for Engineering and Consulting (UG) was established in
1993 as a unique Palestinian firm with the intention to face the challenges
for the reconstruction and development of the Palestinian territories after
more than 28 years of occupation and the resulting deterioration of the
infrastructure, through offering its state-of-the art engineering and technical
services. UG is currently developing a 21st century consulting business on
the basis of a decade of engineering excellence.
UG has committed itself to high quality engineering and consulting
services with the contribution of its experienced professionals and highly
qualified and specialized experts. Since 1993, UG has grown into a
recognized leader in the consulting business in the Palestinian territories.
During this period, Universal Group for Engineering and Consulting has
become a leading multi disciplined firm known and respected for its work
and services in the planning, design, supervision, and management in the
various fields of architecture, engineering, and infrastructure.
Universal Group for Engineering and Consulting is registered as a first
grade consulting firm with the Engineers Association in the West Bank and
Gaza Strip. The Universal Group for Engineering and Consulting co-
operates with a number of leading regional and international consulting
firms.

98
On February 28, 2013, Dr. Hafez Shaheen (Associate Professor in An-
Najah National University and Water and Environmental Expert
(Backstopping) in UG) was interviewed and he indicated that the following
factors must be taken into account: demography, wastewater production,
environmental factor, Socio-economic factor, geographical factor
(topography, catchment), investment factor.
5.2.4.2 Center for Engineering and Planning (CEP)
Since its establishment in 1984, CEP has been involved in a large number
of projects both in Palestine’s Inland Region (West Bank) and Coastal
Region (Gaza Strip) and in other countries such as Iraq, United Arab
Emirates (UAE) and Libya, in the areas of town and regional planning,
socio-economic studies, housing, architecture and building engineering,
road and traffic engineering, water supply and distribution, sewage
collection, treatment and reuse, stormwater collection and drainage
systems, irrigation systems, industrial development projects and the
development of teaching and laboratory programs for academic and
technical institutions.
The professional services offered by CEP in these areas include
preliminary investigations and comprehensive research, field studies and
reports, performance evaluation studies, engineering and economic
feasibility studies, master planning, preliminary and detailed engineering
designs for buildings and infrastructure projects, the preparation of tender
documentation and the provision of construction management/quality
assurance services during project construction and operation.

99
In the area of infrastructure development, CEP has been actively involved
in the preparation of assessment and feasibility studies, master plans for
roads, water supply and distribution, sewage collection, treatment and
reuse, storm water drainage and environmental impact assessments. In the
course of these activities CEP’s staff has become very familiar with the
operational modalities of Palestinian municipalities and village councils
and has accumulated a wealth of information and data relating to the
physical, institutional, regulatory and legal aspects of infrastructure
planning and development.
On February 20, 2013, Eng. Shireen Shelleh (Manager, Design and
Studies) and Eng. Bassam Abu-Zahra (Environmental, Water, and
Wastewater Engineer) were interviewed and he indicated that the following
criteria must be taken into account: population forecast, wastewater
generation, vulnerability of ground water, reuse and agricultural lands, and
political constrains (A, B, C).
5.2.5 Consultation with Municipalities
Consultative interviews were conducted to municipalities (Specifically
large municipalities where there are sewer systems and has extensive
experience in the sanitation sector) like Nablus and Ramallah municipality.
5.2.5.1 Nablus Municipality
Nablus Municipality is a public institution with specific by-laws and
systems enacted in order to render the best quality of municipal services to
its local citizens. Nablus (177,000 inhabitants including 4 refugee camps) is
the biggest urban centre of the northern West Bank. Nablus Municipality is

100
currently implementing a western WWTP where serve around 150,000
people in 2020, and municipality is finish of the preparation of a feasibility
study for the establishment of eastern WWTP.
On January 02, 2013, Eng. Emad El Masri (Director of water and sanitation
department in the municipality) was interviewed and he indicated that the
requirements of implementing sanitation projects must be taken into
account the following: Land for the WWTP, Fund for the capital cost,
Agricultural land for reuse, Operation body, Approvals and permits,
Population density, Wastewater production.
5.2.5.2 Ramallah Municipality
Ramallah Municipality is a public institution with specific by-laws and
systems enacted in order to render the best quality of municipal services to
its local citizens. Ramallah (36,000 inhabitants) It currently serves as the de
facto administrative capital of the Palestinian National Authority. The
existing sewerage situation in Ramallah is:
Only around 65% of the urban area is connected to the sewerage
system.
Many cesspits cause flooding with related odour and hygiene
problems in developed but unconnected areas (especially Al Tireh).
Sewerage system should be a separate system, but some illegal
connections of roof gutters increase flows during rainfalls.
Industrial wastewater is not pre-treated and thus affects the
functionality of the WWTP (especially textile industries using
colorants) and sludge & treated wastewater re-use.

101
Overload of the existing WWTP, both in quantities and pollution
loads.
Effluents do not meet the Palestinian discharge standards.
Very limited extension possibilities for the existing WWTP.
WWTP very close to the city (in close vicinity to the industrial area).
Network likely to be undersized: DN 100 house connections at an
estimated rate of 80%, and maximum diameter in the network being
DN 300 (12‖).
Ramallah Municipality is currently seeking to establish a treatment
plant in Ein Jariot area funded by KFW.
On January 29, 2013, Eng. Khaled Ghazal (Director of sanitation
department in the municipality) was interviewed and he indicated that the
requirements of implementing sanitation projects must be taken into
account the following:
Demography (Population, No of Buildings, Average income).
Environmental risk (water borne disease, no of polluted springs, no
of polluted wells, No of Cesspits).
Land availability (Land for TP, Land for Future Expansion, Location
of TP, and Price of the land).
Technical implementation (Topography (Connection by Gravity),
Needs for pumping, coverage of wastewater in the first phase).
Risk of industrial Waste (No. of Olive press, No. of Stone cutting
(Quarries)).

102
Institutional Management (No. of employees, No. of technical staff,
financial stability, collection rate, cost of evacuation, cost of water,
coverage of water networks)
Reuse (Available lands for reuse, Type of crops, location for lands
downstream, availability of fresh water for irrigation, quantity of
produced ww)
5.3 Citizens Questionnaire
A questionnaire was developed for citizens in their capacity as the affected
side of the sanitation. By conducting an interview with citizens, one can
deduce a number of criteria that must be taken into account.
The questionnaire was well-developed to cover all aspects in relation to the
water sector and wastewater sector. The questionnaire and sample size
were audited by Dr. Numan Mizyed (Associate Professor, An-Najah
National University (ANU)).
The questionnaire consisted of a number of topics; these are: water
situation, current status of sanitation and citizens' satisfaction, impact of
wastewater on citizens, economic and social aspects, institutional issues,
and decision-making. See citizen’s questionnaire in Annex A.
5.3.1 Sample Size
Respondents for the questionnaire were selected randomly. The sample size
included different certain categories, e.g. gender, income level, educational
level, etc.
The alpha level used in determining sample size in most educational
research studies was either 0.05 or 0.01 (Ary, Jacobs, & Razavieh, 1996).

103
The alpha level was taken as 0.05 for sample size above 120 and as 0.01
for smaller populations less than 120 (Bartlett, Kotrlik, & Higgins, 2001).
T-value for alpha level of 0.05 was 1.96, so confidence level was 90%.
The sample was chosen to give a 90% confidence level with a confidence
interval of 5%. The required sample size was calculated according to the
Kachigan formula:
Where:
SS: Sample Size.
Z: value (1.69 for 9AYo confidence level) proportion of area under the
normal curve above the indicated values of Z.
P: Percentage of picking a choice expressed as decimal (0.5)
E: Confidence interval, expressed as decimal or maximum effort for a
given confidence level (0.05)
By substituting in the above equation:
The above equation is for an infinite population.
For a finite population, a correction factor was applied according to the
following.
Where:
Pop. is the population. Here, the number of families was used as a
population, since each questionnaire represented one family.

104
The number of families in the selected communities (see CHAPTER 7) is
shown in Table 5.1.
Table 5.1: Number of families in the selected communities
No. Community No. of
families* No. Community
No. of
families*
1 Silat al
Harithiya 1,970 33
Ar Ram &
Dahiyat al
Bareed
4,370
2 Al Yamun 3,546 34 Biddu 1,446
3 Kafr Dan 1,194 35 Hizma 1,261
4 Deir Abu
Da'if 1,151 36 'Anata 2,971
5 Birqin 1,310 37 Al 'Eizariya 4,195
6 Ya'bad 2,881 38 Abu Dis 2,476
7 Qabatiya 4,126 39 As Sawahira
ash Sharqiya 1,382
8 Arraba 2,121 40 Al 'Ubeidiya 2,075
9 Kafr Ra'i 1,610 41 Husan 1,227
10 Meithalun 1,513 42 Nahhalin 1,510
11 Jaba' 1,764 43 Za'tara 1,297
12 El Far'a
Camp 1,258 44 Jannatah 1,094
13 Tammun 2,434 45 Tuqu' 1,701
14 Qaffin 1,854 46 Beit Fajjar 2,201
15 'Attil 1,883 47 Surif 2,821
16 Deir al
Ghusun 1,753 48 Beit Ummar 2,777
17 Bal'a 1,359 49 Kharas 1,220
18 'Asira ash
Shamaliya 1,750 50 Beit Ula 2,116
19 'Awarta 1,161 51 Sa'ir 3,253
20 Huwwara 1,145 52 Halhul 4,863
21 Beita 1,917 53 Ash Shuyukh 1,821
22 Jamma'in 1,260 54 Tarqumiya 2,759
23 Aqraba 1,696 55 Beit Kahil 1,239
24 Qabalan 1,487 56 Idhna 3,814
25 'Azzun 1,561 57 Taffuh 2,253
26 Biddya 1,754 58 Deir Samit 1,356
27 Sinjil 1,160 59 Bani Na'im 3,931

105
28 Shuqba 1,000 60 Beit 'Awwa 1,565
29 Qibya 993 61 Dura 6,126
30 Al Jalazun
Camp 1,624 62 Yatta 8,797
31 Kharbatha
al Misbah 1,006 63
Adh
Dhahiriya 5,521
32 Beit Liqya 1,577 64 As Samu' 3,594
* No. of families = (Projected Population 2013 / Average Size of
Household in 2007) according to the PCBS
The total numbers of family are 143,851
By substituting in the above equation
The samples were taken for each community as a proportion and fit for the
number of families as shown in Table 5.2.
Table 5.2: Number of samples for each community
No. Community No. of
samples No. Community
No. of
samples
1 Silat al
Harithiya 4 33
Ar Ram &
Dahiyat al
Bareed
8
2 Al Yamun 7 34 Biddu 3
3 Kafr Dan 2 35 Hizma 3
4 Deir Abu Da'if 2 36 'Anata 6
5 Birqin 3 37 Al 'Eizariya 8
6 Ya'bad 5 38 Abu Dis 5
7 Qabatiya 8 39 As Sawahira
ash Sharqiya 3
8 Arraba 4 40 Al 'Ubeidiya 4
9 Kafr Ra'i 3 41 Husan 2
10 Meithalun 3 42 Nahhalin 3
11 Jaba' 3 43 Za'tara 3
12 El Far'a Camp 2 44 Jannatah 2
13 Tammun 5 45 Tuqu' 3
14 Qaffin 3 46 Beit Fajjar 4

106
15 'Attil 4 47 Surif 5
16 Deir al Ghusun 3 48 Beit Ummar 5
17 Bal'a 3 49 Kharas 2
18 'Asira ash
Shamaliya 3 50 Beit Ula 4
19 'Awarta 2 51 Sa'ir 6
20 Huwwara 2 52 Halhul 9
21 Beita 4 53 Ash Shuyukh 3
22 Jamma'in 2 54 Tarqumiya 5
23 Aqraba 3 55 Beit Kahil 2
24 Qabalan 3 56 Idhna 7
25 'Azzun 3 57 Taffuh 4
26 Biddya 3 58 Deir Samit 3
27 Sinjil 2 59 Bani Na'im 7
28 Shuqba 2 60 Beit 'Awwa 3
29 Qibya 2 61 Dura 11
30 Al Jalazun
Camp 3 62 Yatta 16
31 Kharbatha al
Misbah 2 63 Adh Dhahiriya 10
32 Beit Liqya 3 64 As Samu' 7
5.3.2 Analysis of the Questionnaire
This section presents the results of the questionnaire and the main findings
of its analysis. The results were analyzed as per the different parts of the
questionnaire as follows:
1. Water Situation
2. Current status of sanitation and citizens' satisfaction
3. Impact of wastewater on citizens
4. Economic and social aspects
5. Citizens' awareness, and awareness campaigns
6. Institutional issues
7. Decision-making

107
5.3.2.1 First Topic: Water Situation
The amount of water consumption in the summer is 80 liters for each
person per day and 73 per day in the winter. The questionnaire showed
about 65% of people think the amount of water available for all uses is not
sufficient while only 45% think it is sufficient. According to the views of
respondents, there is a large deficit in the amount of water needed for
agriculture more than the amount of water needed for Industrial and
Commercial sectors, while there is no significant shortfall in domestic
water.
The questionnaire also showed that there is a small number of people
satisfied with the water services provided to them with a rate not exceeding
15%.
5.3.2.2 Second Topic: Current status of sanitation and citizens'
satisfaction
All respondents explained that they use cesspits for the disposal of
wastewater rather than using sewage systems, and they are not provided
with any services related to sanitation issues. The Figure 5.1 shows the
kind of censorship of wastewater disposal based on the opinion of the
interviewees.

108
Figure 5.1: Censorship of wastewater disposal
5.3.2.3 Third Topic: Impact of wastewater on citizens
The Figure 5.2 shows the answers of respondents to the question "Are you
already affected by the wastewater directly?". Less than 5% of respondents
said that they suffered from wastewater coming from Israeli settlements.
Figure 5.2: The impact of wastewater on citizens directly
Also, 84% of the respondents indicated that the processes of getting rid of
waste water after emptying cesspits or sewage systems are not proper. A
2%
4% 5%
8%
81%
Strongly Agree
Agree
No Opinion
Opposed
Strongly Opposed
8%
17%
6%
21%
48%
Strongly Agree
Agree
No Opinion
Opposed
Strongly Opposed

109
rate of 37% of the respondents said that the vacuum car for wastewater is
get rid near pastures while 68% reported that get rid of wastewater near the
trees and plants.
The following Figure 5.3 illustrates the problems faced by citizens because
of wastewater:
Figure 5.3: Illustrates the problems faced by citizens because of wastewater
5.3.2.4 Fourth Topic: Economic and social aspects
As far as economic and social aspects are concerned, 97% of the
respondents explained that there are no debts they accumulated as a result
of providing them with water and wastewater disposal services. 52%
indicated that they were satisfied with the price of water, compared to 46%
in addition to 2% who did not answer the question.
About 78% believed that sanitation projects would ease the financial
burden resulting from the disposal of wastewater. Moreover, 68% of the
respondents believed that the wastewater and wastewater disposal cause
social problems among citizens.
5
9
63
32
12
54
22
0 10 20 30 40 50 60 70
Contamination of drinking water
Diseases
Unpleasant odors
Harmful insects
Rats and mice
Wastewater flooding and run at in the streets
There are no problems

110
5.3.2.5 Fifth Topic: citizens' awareness, and awareness campaigns
Almost 4% of the respondents said that they attended seminars or lectures
on wastewater while the rate of respondents who attended documentary
films or TV ads on wastewater problems and methods of treatment was
about 73%, and the rate of respondents to whom leaflets or posters about
wastewater and wastewater problems were distributed was about 22%.
5.3.2.6 Sixth Topic: Institutional issues
A survey showed lack of knowledge on the part of citizens of whether or
not there is an overlap in functions and positions in government institutions
as almost 78% did not answer the question while the rate rose to reach 86%
of our questions that were answered regarding whether or not there is an
overlap in the tasks and functions between government institutions and
civil society organizations (NGO's). Figure 5.4 shows the opinion of
citizens in attention to the wastewater sector by government institutions
and civil society organizations (NGO's).

111
Figure 5.4: Attention to the wastewater sector by government institutions and civil
society organizations (NGO's)
5.3.2.7 Seventh Topic: Decision-making
The survey indicated that citizens prefer to use sewage networks to
discharge wastewater and they are willing to contribute to the creation of
sewage systems at a reasonable cost , and as demonstrated by the
questionnaire, 8% of citizens support the use of treated wastewater in
agriculture compared to 37% and 48% who agree but with some
preventive measures.
Figure 5.5 and Figure 5.6 illustrate the opinion of respondents who prefer
to carry out the management of the sanitation sector and provide
wastewater disposal services.
4
15
20
16
45
3
12
16
14
55
0 20 40 60
Strongly Agree
Agree
No Opinion
Opposed
Strongly Opposed
Attention to the wastewatersector by civil societyorganizations (NGO's)
Attention to the wastewatersector by governmentinstitutions

112
Figure 5.5 : Management of the sanitation sector
Figure 5.6 : Provides wastewater disposal services
5.4 EQA Terms of Reference (TOR)
Terms of reference (TOR) prepared by EQA were taken into account in
order to be considered during the work of environmental impact
assessment. This EIA is subject to the review and approval by several local
agencies, such as the EQA, PWA, and MoLG in order to ensure
15%
12%
9%
13% 30%
21%
PWA
MoLG
MoH
EQA
A joint committee of theministries
No Opinion
51%
22%
15%
1%
2% 1% 4%
4%
Village councils andmunicipalities
Joint services councils
Private sector
PWA
MoLG
EQA
Local committee
No Opinion

113
environmental compliance prior to project commencement and during
project implementation.
The EQA has determined that a detailed EIA study is required for all
wastewater collection and treatment systems. The EQA provides guidance
on the content and preparation of the EIA (We take Al-Yamun project for
example) as specified in the Terms of Reference (TOR) presented in Annex B
5.5 Selected Criteria Used in the Sanitation Projects (donors criteria)
The aim of this section is to review the selected criteria used in the
sanitation projects. Criteria used in the projects are normally within the
orientations of the donors and the approval of relevant government
ministries.
The methods for determining the priorities in sanitation sector in the
ministries and relevant institutions are according to the donors’ police.
There is no clear vision of how to identify priorities in sanitation sector in
the government ministries.
The following section shows the criteria used in the various projects funded
by United States Agency for International Development (USAID),
European Union (EU), German Bank for Reconstruction (KFW), Ministry
of Foreign Affairs (MFA) Republic of Finland and Local finance
investment projects.
5.5.1 Wastewater Projects for USAID Funding
The United States Agency for International Development (USAID) West
Bank and Gaza is considering wastewater sector investments in the West
Bank. USAID wishes to understand the feasibility of funding wastewater

114
sector projects by identifying potential projects and evaluating their
associated scopes, sustainability, permitting requirements, beneficiaries,
costs, implementation schedules, and other aspects. Inc. (MWH) was
selected by USAID to Assessment of Potential West Bank Water Projects
for USAID Funding, dated July 15, 2010 (Assessment). USAID has
selected Black & Veatch Company to confirming the findings of the
assessment and obtaining additional data in order to establish a
recommendation for the immediate engagement of design efforts on two of
the ten wastewater systems through the preparation of site selection report,
dated February 15, 2011.
5.5.1.1 Assessment of Potential West Bank Water Projects for USAID
Funding
The methodology developed to proceed with this investigation consisted of
the following steps:
1. Initial identification of potential projects
2. Establishment of project selection criteria
3. Development of a shortlist of projects to evaluate
4. Evaluation of shortlisted projects
5. Recommended criteria for prioritizing projects
5.5.1.1.1 Identification of Potential Projects
The initial identification of potential projects began with an examination of
documents produced by the Palestinian Water Authority (PWA) including
their Recommended Project Lists, which is updated monthly, and the
document entitled The Palestinian Water and Wastewater Sectors: Basic

115
Needs and Development Ongoing and Proposed Projects by Governorates
(October, 2009). Meetings were held with both USAID and PWA to further
discuss these documents.
Additionally, to obtain a better understanding of wastewater projects in the
West Bank, meetings were held with other organizations involved in the
West Bank wastewater sector work including:
Ministry of Local Government – Eng. Walid Halayqa
Al Bireh Municipality – Eng. Lamia Hamayel
Bir Zeit University - Dr. Omar Zimmo
KFW (German Donor Organization) – Dr. Hisham Sharabati and
Eng. Waddah Hamadalla
JICA (Japanese Donor Organization) – Dr. Abed Al-Naser
5.5.1.1.2 Establishment of project selection criteria
Establish project selection criteria based on USAID’s objectives and goals
for this effort. The identified project selection criteria included:
Project costs in the range of $10M to $15M USD
Projects that have a high likelihood of being successfully operated in
the future
Projects that have a high likelihood of being approved and permitted
Projects that solve an immediate environmental problem
Projects where the treated effluent can be used as reuse water
Projects that can be coupled with USAID water projects
Projects that are aligned with PWA’s wastewater sector goals
Projects that are not being funded by other donor agencies

116
Projects that are spread around different areas of the West Bank
The ceiling on project costs eliminated large wastewater projects, such as
Wadi Nar and Hebron City, and instead focused the search on medium-
sized projects serving communities with 2010 populations of
approximately 10,000 to 20,000 people.
5.5.1.1.3 Evaluation of Shortlisted Projects
The shortlisted projects were evaluated with the goal of providing USAID
the information needed to prioritize projects if funding becomes available.
The first step in the evaluation process was to set up meetings with the
authorities that would be involved in the potential projects. Meetings were
setup with each municipality or joint village council and were typically
attended by the mayor of the town and his key engineering and utilities
staff, as well as MWH and PWA representatives. At some meetings,
representatives from nearby towns also attended the meeting. The
authorities were provided with a list of questions prior to the meeting so
that they could be properly prepared. The information requested at each
meeting included:
1. Topographic and road maps of the area
2. Population of the town, number of households, and number of
buildings
3. Description of the municipality including number of employees,
engineers, and technicians
4. Water resources in the town, supplied quantities, and water usage
rates

117
5. Internal water network situation and its coverage area
6. Cost of water supplied to citizens
7. Percentage of water bills paid and the billing mechanism
8. Number of cesspits in town
9. Cost of emptying cesspits by vacuum tankers
10. Wastewater disposal sites
11. Social and environmental problems resulting from lack of
wastewater collection and treatment
12. Industrial activities in town especially stone cutting workshops and
olive presses
13. Disposal mechanism of stone cutting workshops and olive pressers
remnants
14. Previous studies or designs for wastewater systems
15. Status of any existing collection pipes or treatment facilities
16. Percentage of the town that could be served by a gravity collection
system
17. Availability of land to construct a wastewater treatment plant
18. Types of crops grown locally and locations where reuse water could
be utilized
19. Political areas that the system would be located in (Area A, B, or C
or a combination)
20. Potential initial service areas and future phasing opportunities
As a result of the meetings, it became very evident that all of the
municipalities and joint village councils are extremely aware of the

118
social and environmental problems caused by uncollected and
untreated wastewater and are desperate for funding for wastewater
projects. Key social and environmental issues that came up at all the
meetings included:
1. Health risks to citizens, especially children, from raw sewage
running in the streets and wadis
2. Contamination of springs and groundwater, formerly used for
water supplies, as a result of overflowing cesspits and illegal
dumping of raw sewage from tanker trucks
3. Contamination of water network piping due to overflowing
cesspits
4. Structural damage to roads and building foundations as a result
of overflowing cesspits
5. Conflicts between neighbors caused by overflowing cesspits
6. Waste of a valuable resource that could be used for irrigation or
other purposes
5.5.1.1.4 Recommended Criteria for Prioritizing Projects
The criteria listed below, are proposed for prioritizing the projects. These
criteria are based on a scoring system of 1 to 3 points. It is also
recommended that a weighting system be employed to differentiate criteria
deemed to be critical to the implementation and long-term success of the
project including those related to unit costs, existing water consumption,
sustainability, and permitting.

119
1. Demographics:
a. Initial and Ultimate Service Area Populations
1 point: <20,000
2 points: 20,000 - 30,000
3 points: >30,000
1 point: <40,000
2 points: 40,000 - 60,000
3 points: >60,000
b. Existing Water Consumption
1 point: < 50L/day/cap
2 points: 50 - 75L/day/cap
3 points: > 75 L/day/cap
c. Industries
1 point: > 10 stonecutters + olive presses
2 points: Between 5 and 10 stonecutters + olive presses
3 points: < 5 stonecutters + olive presses
2. Institutional Management (Sustainability):
a. Current Collection Rate
1 point: <50%
2 points: 50% - 75%
3 points: >75%
b. Financial Structure

120
1 point: Not tied to other utilities
2 points: Tied to other utilities - post pay system
3 points: Tied to other utilities - pre pay system
c. Management Structure
1 point: Need to form management structure
2 points: JVC
3 points: Municipality only
d. O&M Structure
1 point: Need to form O&M structure
2 points: Structure but no water staff
3 points: Structure with staff
3. Environmental Issues:
1 point: Minor
2 points: Major
3 points: Severe
4. Approvals and Permitting:
1 point: Trunk lines and/or WWTP in Area C
2 points: Project in Area A and B except road crossings in Area C
3 points: Entire project in Areas A and B
5. Technical Implementation:
a. Collection System
1 point: <50% by gravity flow
2 points: 50% to 75% by gravity flow
3 points: >75% by gravity flow

121
b. WWTP Site
1 points: Poor site
2 points: Average site
3 points: Great site (large, clear, power, no neighbors, good reuse)
c. Reuse
1 point: Minimal reuse potential near WWTP
2 points: Medium potential
3 points: Great potential
6. Project Cost per Capita:
1 point: Project Cost per capita > $600
2 points: $500 to $600
3 points: < $500
5.5.1.2 Site selection report
USAID is to design ten sewage collection and treatment systems in
medium sized communities (average current population 20,000) throughout
the West Bank. Ten municipal entities in the West Bank were previously
identified in a study entitled Assessment of Potential West Bank Water
Projects for USAID Funding. Prior to engaging in detailed design efforts,
B&V is tasked with confirming the findings of the Assessment and
obtaining additional data in order to establish a recommendation for the
immediate engagement of design efforts on two of the ten wastewater
systems.
B&V and local sub-consultants worked with Palestinian Water Authority
(PWA) staff, Ministry of Agriculture staff, the Israeli Civil Administration,

122
and the mayors and engineers of the ten municipalities to analyze the
circumstances of each proposed system. Comparisons of factors affecting
project implementation were made, some of which relied on information
presented by the municipalities themselves, others drawn from observations
and investigations made directly by B&V professionals and sub-
consultants. Where possible, the information reported by each of the ten
municipalities was cross checked with data from other sources such as
Palestinian Authority 2007 Population Census Data and PWA well
production data.
The purpose of this report is to prioritize two wastewater systems for
immediate design. A criteria based ranking system was used to score all ten
systems with recommendations for immediate design implementation going
to the top two. The evaluation and scoring is only intended for the purpose
of identifying two systems for immediate design implementation. The
evaluation and scoring is not intended as a prioritization list for all ten
projects. Nor are the criteria or ranking applicable to identifying the next
stage of construction prioritization after the first one is designed and
constructed.
Four criteria were developed for the evaluation. Where appropriate, the
criteria were further divided into sub‐criteria. A numerical scoring system
was developed to determine the overall ranking and identification of the top
two projects for immediate implementation. Each of the four criteria were
weighted and combined into a final qualitative scoring. The four criteria, in
no particular order, are:

123
1. Ease of Civil Administration Approval
2. Operational simplicity
3. Environmental and Health Impacts
4. Municipal readiness
Each criterion was given a weight of 25 percent.
5.5.1.2.1 Criteria 1: Civil Administration Permitting
The duration of the Civil Administration’s permit approval process will
drive the schedule of project implementation for those systems that impact
Area C. This can have an overriding impact on the selection of the
wastewater system that is slated for immediate implementation. At a
minimum, each project consists of the following geographical elements
which will be located in two or more of the security/administrative areas
(A, B, or C):
The geographical location of each of these permanent features will affect
the relative ease of implementation by the impact they have on Area C. In
coordination meetings with B&V, the Civil Administration has indicated
that projects that impact Area A and B only can get implemented much
faster than those that impact Area C. The Civil Administration also
distinguishes between types of construction in Area C. According to the

124
Civil Administration, approval for construction of buried pipelines in Area
C is significantly shorter (approximately six months) and a less
complicated than permanent, above‐ground structures (approximately three
years). Some Area C approvals may take a shorter time than anticipated.
Other Area C approvals may take significantly longer. In any case, the
exact duration is unknowable in advance and projects that impact Area C
are relatively risky for immediate project implementation.
However, it should be recognized that site specific issues affecting Israeli
interests are expected to have an impact on the duration of the permit
approval process. For example, the proposed wastewater systems may be
impacted by the proximity of Area C settlements. Environmental
improvements resulting from the implementation of proposed projects may
also factor into the duration of permit approvals. One example of this is the
proposed Ein Sinya wastewater treatment plant. The Civil Administration
has reportedly encouraged the development of this project by offering
financial incentives to the Palestinians to build a wastewater plant. The
existence of such a plant would improve the environmental conditions of
nearby Israeli settlements.
For the purposes of this analysis, the following numerical scoring system
was applied:

125
Table 5.3: Numerical Scoring Description for Criteria 1 ‐ Ease of Civil
Administration Approval
Score Description
10
trunks, or wastewater plants;
the catchment area;
8
trunks, or wastewater plants;
6
wastewater plants;
sewer (buried pipeline) crosses Area C;
4
wastewater plants;
pipeline) crosses Area C;
2 Permanent above grade structures (wastewater plant or
storage reservoirs) in Area C
Inadequate Area A & B land for application of reuse water;
No Israeli settlements in the catchment area
0
5.5.1.2.2 Criteria 2: Operational Simplicity
In general, service areas with full gravity collection systems are expected to
have lower operational and maintenance obligations than those requiring
lift stations. The more lift stations required for a given service area, the
greater the operational cost and complexity.
Another operational consideration is the wastewater generation per capita.
The design parameters established in the Assessment were based on the
notion that water supply and wastewater generated per capita would

126
significantly increase in the future. There is no guarantee that will be the
case in the future. Moreover, the per capita generation has significant
impacts on the wastewater treatment process selection. In general, the
lower the wastewater per capita the more concentrated the waste and the
more difficult it is to achieve reductions in effluent Nitrogen, which is
currently set at 50 mg/l in the Palestinian Standards. This is also related to
the operational costs of lime addition, which would be required to boost the
alkalinity of the wastewater in order for the required
nitrification/denitrification process to function at all.
Greater operational complexity accompanies the treatment of higher
concentrated wastes (low wastewater generation per capita). This
operational complexity results in a lower score for immediate
implementation where there is obviously a greater humanitarian need.
However, this would also suggest that efforts for the municipalities with
the lowest water consumption per capita (highest concentration wastes)
should be prioritized on increasing their water supply and distribution prior
to implementing sewage collection and treatment. In any case, for the
purposes of this evaluation, the municipalities with the lowest wastewater
generation per capita received lower scores on these subcriteria. For the
purposes of this evaluation, both subcriteria were assumed to have equal
weight. Each subcriteria carried a 12.5% impact on the final weighted
score.

127
Table 5.4: Numerical Scoring Description for Subcriteria 2A –
Operational Simplicity – Gravity Collection
Score Description
5 100% of the municipality’s service area potentially served by
a gravity collection system;
4 80% of the municipality’s service area potentially served by a
gravity collection system;
3 60% of the municipality’s service area potentially served by a
gravity collection system;
2 40% of the municipality’s service area potentially served by a
gravity collection system;
1 20% of the municipality’s service area potentially served by a
gravity collection system;
0 0% of the municipality’s service area potentially served by a
gravity collection system;
Table 5.5: Numerical Scoring Description for Subcriteria 2B –
Operational Simplicity – Wastewater Generation
Score Description
5 Estimated wastewater generation of 100 liters/per capita per day;
4 Estimated wastewater generation of 80 liters/per capita per day;
3 Estimated wastewater generation of 60 liters/per capita per day;
2 Estimated wastewater generation of 40 liters/per capita per day;
1 Estimated wastewater generation of 20 liters/per capita per day;
0 Estimated wastewater generation of 0 liters/per capita per day;
5.5.1.2.3 Criteria 3: Environmental and Health Impacts
None of the ten municipalities have usable collection systems, with the
exception of Dura. Dura has a partial collection system that was built ten
years ago. However, Dura’s partial collection system is not connected to an
outfall and has no house connections. The use of cesspits (and in some
cases, septic tanks) is widespread with some households using more than
one cesspit. Overflow and seepage problems are common to all ten
municipalities, with little distinguishable relative differences. Infiltration
and groundwater contamination from the cesspits, which are unlined, is

128
also a problem common to all ten municipalities. The installation of
collection systems and centralized treatment will have a direct benefit to
the environment from the discontinuation of unrestricted dumping of raw
sewage and the cessation of cesspit leakage.
The comparative magnitude of the resulting environmental and health
improvements can be estimated by the relative hydrologic vulnerability of
the wastewater system locations. Projects in municipalities located in
aquifer recharge areas with high infiltration rates would produce a higher
benefit than those that are located in less vulnerable areas. To make this
determination, B&V used hydrological vulnerability maps published by the
United Nations Environment Programme (UNEP) in cooperation with the
Palestinian Environmental Quality Authority from a study entitled Desk
Study on the Environment in the Occupied Palestinian Territories (2003).
The scoring system is showing in Table 5.6 below.
Table 5.6: Numerical Scoring Description for Criteria 3 – Environmental
and Health Impacts
Score Description
10 Greatest relative benefit realized by construction of collection
and centralized treatment ‐ Municipal area located in a
region of high hydrological vulnerability to groundwater
pollution as defined by UNEP.
5 Moderate relative benefit realized by construction of
collection and centralized treatment ‐ Municipal area located
in a region of medium hydrological vulnerability to
groundwater pollution as defined by UNEP.
0 Low relative benefit realized by construction of collection
and centralized treatment
‐ Municipal area located in a region of low hydrological
vulnerability to groundwater pollution as defined by UNEP.

129
Industrial waste contribution was considered as a possible sub‐criteria.
However, the amount of liquid waste generated by existing industrial
operations (stone cutting, olive press, textiles, etc) for all municipalities
appears to be low. It is assumed that direct connection of these wastes to
the collection system will not be allowed without pre‐treatment in
accordance with soon‐to‐be ratified By Laws regarding sewer discharge.
For this reason, the relative amounts of industrial wastes and their impact
on the environment and health was not considered a differentiator in the
prioritization effort.
5.5.1.2.4 Criteria 4: Municipal Readiness
All municipal mayors, council members, and staff expressed a strong desire
to have a wastewater collection, treatment, and reuse system. The residents
of these municipalities all experience similar hardships that accompany the
lack of such infrastructure. The expense of cesspit pumping, structural
issues with building foundations, contamination of cistern and groundwater
supplies from existing cesspits, and social conflicts resulting from the
spillage of wastes from cesspits, were common to all of the municipalities
visited. The problems associated with the existing situation are clear.
However, measuring the preparedness of a municipality to implement and
operate a wastewater system is less clear. Developing a scoring system and
ranking the ten municipal entities from one or two introductory meetings is
a subjective exercise. Municipal readiness is difficult to accurately
determine without having direct observation over the course of several
weeks or months.

130
Nevertheless, it is clear that as things stand today, none of the
municipalities is institutionally prepared to directly manage a new
wastewater treatment plant and reuse scheme. There is a noticeable lack of
experience and understanding of the issues associated with collection, and
treatment operations in particular.
To create a scoring system for these criteria, several indicators were
considered, including:
• The percentage of water fees collected from residents;
• The willingness of municipal leaders to combine utility bills (water
and sewer, and even electricity),
• The revenue currently generated between buying bulk water and
sales to metered users,
• The implementation of pre‐paid utility bill programs,
• Measures taken to reduce non‐payment and address water
distribution losses,
• The existence and willingness of agricultural associations to take part
in water reuse contracts,
• The ability of municipal leaders to cooperate with one another in a
regional scheme (this applies mostly to the two regional projects: Ein
Sinya and Northeast Jenin),
• The experience and capacity of the municipality to operate and
maintain its existing water infrastructure.
• The existing numbers and skill sets of the municipal operators and
engineers.

131
The scoring system is shown in Table 5.7.below.
Table 5.7: Numerical Scoring Description for Criteria 3 – Municipal
Readiness
Score Description
10 Municipality has established an independently funded
water/wastewater authority;
100% fee collection on existing water service;
Losses in the existing water distribution system are
measureable and less than 10% of the water is unaccounted for;
Municipal personnel are capable and experienced in
wastewater operations and maintenance
There is an existing, mandated agricultural association that
has produced a written commitment to purchase the treated
effluent
5 Municipality has more than 80% of consumer water fee
collection;
Municipality has already implemented a combined bill for
water/sewer on a prepaid use basis;
An agricultural association exists with or without a mandate
0 Municipality will attempt to manage the wastewater system
through the efforts of a fractioned joint service council without
a clear leader;
Municipality has less than 70% of consumer water fee
collection;
No existence of any significant agricultural associations
5.5.2 Wastewater Projects for European Union (EU) Funding
To review the EU selected criteria used in the sanitation projects we
studied last study submitted to the EU for sanitation projects, a project is
(Feasibility study and ESIA for wastewater management in Tubas, Tayasir,
'Aqqaba and Al 'Aqaba), dated January 10, 2012.
The project is divided to five components and evaluated each component
separately by various criteria. These components and criteria are:
A. Wastewater collection and conveyance networks:

132
• Investment cost
• Operation and Maintenance cost
B. Wastewater reuse
• Land suitability for irrigation and Potential areas
• Cropping patterns
• Water storage
• Investment cost
• Operation and Maintenance cost
• Irrigated area
• Irrigated water request
C. Ability to Groundwater recharge
D. WWTP sites:
• Distance to closest house
• Distance to limit of future urban area
• Nuisance to surrounding residential areas
• Potential aquifer impacts
• Location in area A, B or C
• Platform elevation
• Excavation required
• Access road
• Flooding risk
• Electrical energy supply
• Land ownership
• Reuse potential

133
E. Process selection:
• Pollution reduction
• Disinfection of treated water
• Upgradability of the process
• Footprint of the structures
• Qualification of operating staff
• Investment and operating costs
• Sludge quality
• Land requirement
5.5.3 Wastewater Projects for German Bank for Reconstruction
(KFW) Funding
To review the KFW selected criteria used in the sanitation projects we
studied last study submitted to the KFW for sanitation projects, a project is
(Consultancy Services for the Elaboration of a Feasibility Study for the
Project ―Wastewater Treatment Plant Ramallah‖), dated March 2010.
The project ―Wastewater Treatment Plant Ramallah – Feasibility Study‖
was launched by the German Government as part of the efforts undergoing
to improve the living conditions of Palestinian people. This project is
funded in the frame of the bilateral German-Palestinian Co-operation.
The Consortium of Gauff Ingenieure with ERM and Universal Group was
awarded the project; signature of the related contract was made on 19
January 2009.

134
5.5.3.1 Multi-Criteria Screening of Options
Due to the sensitivity of the project area, option comparison cannot take
into account economical items only. In addition, socio-economical and
environmental impacts have to be roughly assessed.
5.5.3.2 Environmental Issues
Environmental criteria have been introduced to compare the different
locations for the WWTP. Into account has been taken:
• Land size required for 2030;
• Availability of land for further extensions beyond 2030;
• The distance to the closest residential area;
• The connected PE until 2030;
• The requirements of having main pumping stations
• The groundwater vulnerability at the proposed sites;
• Groundwater vulnerability of the main collector routings.
5.5.3.2.1 Socio-Economic Impact
• Full Cost Recovery
• O&M Cost Recovery
5.5.3.2.2 Institutional Criteria
• Inter-Communal Co-operation
• Joint Service Council;
• Improvements in Billing

135
5.5.4 Wastewater Projects for Ministry of Foreign Affairs (MFA)
Republic of Finland Funding
The last study submitted to the MFA for sanitation projects, a project is
(Sanitation Study for Northwest Jerusalem Villages), dated March 2011.
5.5.4.1 Selection Criteria and Screening
Initial selection criteria have been applied to the proposed options. The
sorts of criteria that have been used for the initial screening process
include:
Type of Area including Oslo classification as A, B, or C
Israeli Closure Wall
Adjacent settlements
Israeli permits
Size of site (sufficient area available for extension?)
Access to site
Present land use
Distance to developed areas, wind direction and effects of odor
Approvals of Owners, PWA, JSCs and residents
-use
Facilities for storage of treated wastewater
Available agricultural area for irrigation
Options for re-use of treated wastewater
of the WWTP and Treatment method

136
Flexibility of options for future modifications
Required performance to meet the required effluent standards
Strength of sewage
Effluent quality requirements
Ambient conditions in the project area
Sewage flows and infiltration/flows
5.5.5 Wastewater Projects for Local Finance Investment Projects
Bayti real estate investment company is construction the Rawabi city,
Rawabi is new city in west bank and Rawabi is the biggest local finance
investment projects in west bank.
The criteria cover a range of technical factors that consider site and land
use issues, and community impacts including health and safety,
environmental impacts, and economic impacts. Numerical ranking was
applied to the selection criteria. These criteria were ranked by using a
scoring range of 1 to 10, with 1 equal to the least favorable rating and 10
equal to the most favorable. These criteria are briefly described below:
5.5.5.1 Suitability of Land
This criterion relates to the suitability of the site in terms of sufficient flat
area available for treatment and reuse facilities (including area for future
expansion); ease of construction in terms of site access, topography and
slope; and the cost of the land.
5.5.5.2 Political Constraints
This criterion relates to the relative ease of obtaining project approval and
permits by the Joint Water Committee. If the project site is located in

137
administrative division Area A or B as defined by the Oslo Accords,
project approval is typically much easier to accomplish than if the site is in
Area C.
5.5.5.3 Potential Aquifer Impacts
Groundwater aquifers would be impacted negatively, resulting in a threat to
public health and safety, if raw sewage were to be disposed of as a result of
a failure at the wastewater treatment (e.g., either from a spill of raw
sewage/seepage or from a treatment malfunction resulting in partially
treated effluent discharge). This criterion was evaluated based on a
vulnerability analysis. These vulnerability analyses were ranked by using a
scoring range of 1 to 10 are briefly described below:
0 the negative impact on the groundwater system is EXTREME
2.5 the negative impact on the groundwater system is HIGH
5 the negative impact on the groundwater system is MODERATE
7.5 the negative impact on the groundwater system is LOW
10 the negative impact on the groundwater system is VERY LOW
Vulnerability analysis ranked depending on:
Groundwater Divide
Springs
Wells
Wadis
Recharge Zones
Pollution by advection: Advection is the process of the movement of
pollutants with the influence of groundwater velocity in the saturated

138
zone. This is an important mechanism in the assessment of the
impact of pollution on aquifers. The mechanism is also influenced
with the direction of groundwater movement.
Karst Groundwater System
Vertical movement and travel time of pollutants
5.5.5.4 Proximity of Reuse Sites
This criterion relates to the availability of reuse sites within the proximity
to effluent discharge at minimum pumping cost, and to the suitability of the
soil for crop production.
5.5.5.5 Proximity to Existing and/or Planned Utilities
This criterion relates to the relative ease of bringing in utilities, such as
electricity and water, necessary for construction and operation of a
treatment plant.
5.5.5.6 Flood Plain Elevation
This criterion relates to potential flooding of the site during storm events.
Wastewater treatment plants are usually located in low areas that could be
subject to flooding. At sites within the flood plain, flood prevention
measures such as realignment of the wadi channel or conveyance of flood
water in a closed conduit would be necessary, significantly increasing
costs. The differentiation among sites for this criterion was based on the
relative difference in the width of the wadi where the proposed site is
located: the narrower the site width, the higher the flooding potential.

139
5.5.5.7 Proximity to Landfill
Residuals generated at wastewater treatment plants such as screenings, grit
and sludge are anticipated to be disposed of in a sanitary landfill. The
proximity of the wastewater treatment plant to a landfill site will affect the
hauling costs.
5.5.5.8 Nuisance to Surrounding Urban Areas
This criterion relates to the suitability of the site in terms of being remote
from existing and future urban areas. It is preferable to locate wastewater
treatment plants in non-urban areas, away from residences. Potential
impacts include visibility of treatment plant facilities, obstruction of natural
views, noise, odor, increased vehicular traffic, and public health and safety
concerns.
5.5.5.9 Population Served
This criterion relates to the number of residences and communities that can
be served. The site that can serve the relatively largest number of
population with reasonable length of trunk lines is preferred, as these
results in the greatest benefits versus costs.
5.6 Criteria Identification
The criteria were identified so that they are easy to measure and easy to
evaluate and based on the above, the following criteria were selected:
Demography.
Water consumption / Wastewater production.
Reusing wastewater.
Environmental factor.

140
Operation body.
Risk for Industrial Waste.
Socio-economic factor.
Geographical factor (topography, catchment).
Political Issues.

141
Chapter 6
Mcda Tools Development
6.1 Normalize the Weights of Criteria
Weights of the criteria were identified through the intergovernmental
agencies that form the Environmental Assessment Committee (see Annex A):
EQA (acting as chair of the Committee)
Ministry of National Economy (MNE)
Ministry of Local Government (MoLG)
Ministry of Transport (MoT)
Ministry of Agriculture (MoA)
Ministry of Health (MoH)
Ministry of Tourism and Antiquities (MTA)
Ministry of Planning and Administrative Development (MoPAD)
Palestinian Water Authority (PWA)
Palestinian Energy Authority (PEA)
Ministry of Public Works and Housing (MPWH)
Ministry of Labour (MoL)
Palestinian Civil Defence's (PCD)
Petroleum Authority
The EA Committee reviews the EA study and makes recommendations for
approval or denial of the project.
The weight of a criterion also comes based on the importance of 10 where
0 is not important, 5 is average importance, and 10 is very important. Each
criterion weight is given a score, and then all the scores are added up. The

142
score of each attribute is divided by the total score.
and equation below.

143
Table 6.1: Calculate normalize weights to each criteria
No. Criteria
Environmental Assessment Committee
Weights
(Wm)
Normalize
weight (from
100%) (Wm
×100/∑W)
EQ
A
MN
E
Mo
LG
Mo
T
Mo
A
Mo
H
MT
A
Mo
PA
D
PW
A
PE
A
MP
WH
Mo
L
PC
D
Petroleum
Authority
1 Demography 5 8 8 8 9 10 8 9 9 7 10 9 8 7 8.2 12.5
2
Water
consumption /
Wastewater
production
7 6 8 6 9 7 6 9 9 4 5 6 7 6 6.8 10.37
3 Reusing
wastewater 5 4 5 3 8 2 5 5 8 6 4 5 6 4 5 7.62
4 Environmental
factor 10 9 8 10 10 10 9 10 10 8 10 10 10 9 9.5 14.48
5 Operation body 10 8 8 8 9 8 8 10 9 8 9 9 8 8 8.6 13.11
6 Risk for Industrial
Waste 7 6 6 5 7 7 5 10 7 7 5 6 4 8 6.4 9.76
7 Socio-economic
factor 10 8 10 8 9 10 8 8 9 7 9 8 8 8 8.6 13.11
8 Geographical
factor 7 4 6 6 7 5 5 6 8 5 4 5 4 5 5.5 8.38
9 Political Issues 6 7 8 7 8 7 7 7 9 7 6 7 6 6 7 10.67
Total 65.60 100

144
6.2 Carries a Value Rating for Each Criteria
Each alternative carries a value rating for each attribute. The rating of each
alternative for each attribute indicates how well the alternative will perform
as each attribute is considered. The criteria listed below, are proposed for
prioritizing the projects. These criteria are based on a scoring system of 1
to 5 points.
6.2.1 Demography
If the population grows, the priority of the establishment of a sewer project
increases. Based on that, the highest number of projected population in
2030 between communities (Ph) is given the maximum demography score
(Ds) of 5. The formula for determining the demography scores (Ds) of all
other communities is calculated as follows: Ds = 5 x P/ Ph, in which ―Ds‖
is the demography score, ―Ph‖ is the highest population, and ―P‖ is the
projected population in 2030 of the community under consideration.
6.2.2 Water Consumption / Wastewater Production
There is a positive relationship between water consumption (wastewater
production) and priority of a sewer project. Scores are distributed according
to water consumption as follows:
1 point: < 45L/day/cap
2 points: 45 - 55L/day/cap
3 points: 56 - 65L/day/cap
4 points: 66 - 90L/day/cap
5 points: > 90 L/day/cap

145
6.2.3 Reusing Wastewater
This criterion relates to the suitability of the soil for crop production. To
make this determination, we used value agricultural land map. See Figure
6.1 published by MoA. Scores are distributed as follows:
1 points: Low-value agricultural land
3 points: Medium -value agricultural land
5 points: High-value agricultural land
Figure 6.1: Value agricultural land

146
6.2.4 Environmental Factor
Two specific impacts were taken on environmental issues. The first is
hydrogeological vulnerability of groundwater to which we gave three
points while the second is the presence of springs and wells in the region to
which we gave two points.
The installation of collection systems and centralized treatment will have a
direct benefit to the environment from the discontinuation of unrestricted
dumping of raw sewage and the cessation of cesspit leakage.
The comparative magnitude of the resulting environmental and health
improvements can be estimated by the relative hydrologic vulnerability of
the wastewater system locations. Projects in communities located in aquifer
recharge areas with high infiltration rates would produce a higher benefit
than those that are located in less vulnerable areas. To make this
determination, we used hydrological vulnerability map. See Figure 6.2
published by the United Nations Environment Programme (UNEP) in
cooperation with the Palestinian Environmental Quality Authority from a
study entitled Desk Study on the Environment in the Occupied Palestinian
Territories (2002).

147
Figure 6.2: Hydrogeological vulnerability of groundwater to pollution in the West
Bank
Scores are distributed as follows:
1 point: No springs and wells in the region.
2 points: One or more springs or wells in the region.
1 point: Community located in a region of low hydrological
vulnerability to groundwater pollution as defined by UNEP.
2 points: Community located in a region of medium hydrological
vulnerability to groundwater pollution as defined by UNEP.
3 points: Community located in a region of high hydrological
vulnerability to groundwater pollution as defined by UNEP.

148
6.2.5 Operation Body
We used MoLG and Municipal Development & Lending Fund (MDLF)
ranked communities. MoLG ranked communities depend on various
standards such as the size of the community and the strength of the
operation body. MDLF ranked communities accept ―good management‖
practices according to 12 basics. Funds are allocated based on rank;
municipalities with higher rankings will be eligible for more funding than
those with lower rankings. The rankings are from A to F, with A
constituting the highest possible rank. They are based on 12 criteria
encompassing planning, management and financial accountability as shown
in Table 6.2.
Table 6.2: Municipal ranking on the basis of performance for the
municipal development program (MDP) in MDLF
Rank Performance Indicator
A
Current Account Surplus (for 2 consecutive years)
Unqualified External Audit
Integrated Financial Management System
B
Operational Account Surplus
Fixed Assets Register
Maintenance Plan in place
C
Municipal Development/Investment Plan
Financial Accounting Policies & Procedures in place
External Audit
D Capital Budget (approved and executed, properly submitted t
o MoLG)
E Recurrent Budget (approved and properly submitted to MoL
G)
F No Budgetary Information
Scores are distributed as follows:

149
MoLG
0.5 point: Village Council or Projects Committee
1 point: Rank of municipality is D.
1.5 point: Rank of municipality is C.
2 point: Rank of municipality is B.
2.5 point: Rank of municipality is A.
MDLF
0.5 point: Rank of municipality is F.
1 point: Rank of municipality is E.
1.5 point: Rank of municipality is D.
2 point: Rank of municipality is C.
2.5 point: Rank of municipality is A,B.
6.2.6 Risk for Industrial Waste
There is an impact of effluents from industrial operations (stone cutting,
olive press, textiles, etc) on the effectiveness of the treatment plants. It is
assumed that direct connection of these wastes to the collection system will
not be allowed without pre-treatment, and it is something difficult to do by
the municipalities. Scores are distributed as follows:
1 point: > 15 stonecutters + olive presses + textiles
2 points: Between 10 and 15 stonecutters + olive presses + textiles
3 points: Between 5 and 10 stonecutters + olive presses + textiles
4 points: < 5 stonecutters + olive presses + textiles
5 points: No stonecutters + olive presses + textiles
6.2.7 Socio-Economic Factor
The socio-economic factor assessment process will be on the basis of, first,
education which gives an indication of the community acceptance of the

150
project, and secondly how economically active the citizens are which gives
an indication of the ability of citizens to pay and contribute to the costs of
construction, operation and maintenance costs. Scores are distributed as
follows:
0.5 point: <= 5% of the population hold a bachelor degree or higher
of the total population aged 10 years and over.
1.5 points: 5% to 10% of the population hold a bachelor degree or
higher of the total population aged 10 years and over.
2.5 point: > 10% of the population hold a bachelor degree or higher
of the total population aged 10 years and over.
0.5 points: <= 30% of the population economically active of the
total population aged 10 years and over.
1.5 points: 30% to 35% of the population is economically active of
the total population aged 10 years and over.
2.5 points: > 35% of the population economically active of the total
population aged 10 years and over.
6.2.8 Geographical Factor (topography, catchment)
The geographical factors affect the construction of sewer systems and the
capital cost of sewer systems and if we need pumping station or not. Scores
are distributed as follows:
0.5 point: <50% by gravity flow.
1 points: 50% to 75% by gravity flow.
1.5 points: 75% to 95% by gravity flow.
2 points: > 95% by gravity flow.

151
1 point: > 2 catchment areas.
2 points: 2 catchment areas.
3 points: 1 catchment areas.
6.2.9 Political Issues
The political issues of each of these permanent features will affect the
relative ease of implementation by the impact they have on Area C. The
joint water committee (JWC) in PWA has indicated that projects that
impact Area A and B only can get implemented much faster than those that
impact Area C as it is near settlements which would delay obtaining a
license. Scores
are distributed to two points according to whether or not there are Israeli
settlements in the catchment area and according to the political land
classifications. Areas A, B, and C can be seen as follows:
1 point: One or more Israeli settlements in the catchment area
2 points: No Israeli settlements in the catchment area.
1 points: Trunk lines and/or WWTP in Area C
2 points: Entire project in Areas A and/or B
3 points: Entire project in Areas A

152
Chapter 7
Priorities Settings
7.1 Identify Communities
We will take the towns whose population is over 10 thousand people in
accordance with the directives of the PWA to resolve the problem of
sanitation in the towns and villages with the population of over 10 thousand
people by 2030. Based on the PCBS, we indicate the population numbers
for all Palestinian communities (see Annex C Annex C ) according to the
census of 1997 and 2007. Communities that are expected to have a
population of more than 10,000 people in 2030 are show in Table 7.1.
From the Table 7.1, it can be seen that there are 97 communities expected
to have a population of more than 10,000 people in 2030. We except 33
communities because they contain sewage systems or in the design or
implementation stages. According to PWA Strategy a sanitation sector will
have been developed in 33 communities, and sanitation systems for 64
communities will have been found by 2030. The total current population of
64 communities is 846,705 and is expected to be 1,483,779 person in 2030.
The following communities are classified by governorates:

153
Jenin governorate (11 communities): Silat al Harithiya, Al Yamun, Kafr
Dan, Deir Abu Da'if, Birqin, Ya'bad, Qabatiya, Arraba, Kafr Ra'I,
Meithalun, and Jaba'
Tubas governorate (2 communities): El Far'a Camp, and Tammun
Tulkarem governorate (4 communities): Qaffin, 'Attil, Deir al Ghusun,
Bal'a Nablus governorate (7 communities): 'Asira ash Shamaliya, 'Awarta,
Huwwara, Beita, Jamma'in, Aqraba, and Qabalan
Qalqiliya governorate (1 community): 'Azzun
Salfit governorate (1 community): Biddya
Ramallah & Al-Bireh governorate (6 communities): Sinjil, Shuqba, Qibya,
Al Jalazun Camp, Kharbatha al Misbah, and Beit Liqya
Jericho governorate (no communities)
Jerusalem governorate (7 communities): Ar Ram & Dahiyat al Bareed, Al
Biddu, Hizma, 'Anata, Al 'Eizariya, Abu Dis, and As Sawahira ash
Sharqiya.
Bethlehem governorate (7 communities): Al 'Ubeidiya, Husan, Nahhalin,
Za'tara, Jannatah, Tuqu', and Beit Fajjar.
Hebron governorate (18 communities):Surif, Beit Ummar, Kharas, Beit
Ula, Sa'ir, Halhul, Ash Shuyukh, Tarqumiya, Beit Kahil, Idhna, Taffuh,

154
Deir Samit, Bani Na'im, Beit 'Awwa, Dura, Yatta, Adh Dhahiriya, and As
Samu'.

155
No. Locality Name
Locality code
ازجغاؿ
Actual Population
2007
Actual Populatio
n 1997
Actual Growth-
Rate (2007-1997)
Projected
Population 2010
Projected
Population 2020
Projected
Population
2030
Note
Jenin Gov.
1 Silat al Harithiya
10035 ؿ١خ
اذبعص١خ9,422 7,246 2.66 10,194 13,256 17,236 Cesspits
2 Al Yamun 10080 Cesspits 31,943 23,894 17,874 2.95 12,255 16,383 ا١ب
3 Kafr Dan 10095 10,565 7,729 5,654 3.18 3,766 5,148 وفغ صا Cesspits
4 Barta'a ash Sharqiya
10120 ثغطؼخ
الغل١خ4,176 2,814 4.03 4,701 6,976 10,353
Treated inside GL
5 Jenin 10180 85,164 60,646 43,186 3.45 27,775 39,004 ج١ Jenin TP
6 Jenin Camp
14,403 12,486 10,825 1.44 8,991 10,371 ش١ ج١ 10185Connected
to Jenin
7 Deir Abu Da'if
10215 ص٠غ أث
ضؼ١ف5,572 3,897 3.64 6,203 8,869 12,681 Cesspits
8 Birqin 10220 10,555 8,065 6,163 2.73 4,344 5,685 ثغل١ Cesspits
9 Ya'bad 10265 24,229 18,873 14,701 2.53 10,625 13,640 ٠ؼجض Cesspits
10 Qabatiya 10340 36,465 27,588 20,873 2.83 14,524 19,197 لجبط١خ Cesspits
11 Arraba 10370 18,452 14,088 10,756 2.74 7,574 9,920 ػغاثخ Cesspits
12 Kafr Ra'i 10465 12,967 10,139 7,928 2.49 5,758 7,364 وفغ عاػ Cesspits
13 Meithalu Cesspits 13,825 10,255 7,607 3.03 5,159 6,955 ١ض 10520
Table 7.1 Communities that are expected to have a population of more than 10,000 people in 2030

156
n
14 Jaba' 10605 16,222 12,243 9,240 2.85 6,409 8,492 ججغ Cesspits
Tubas Gov. 15 'Aqqaba 50535 16,468 11,028 7,385 4.09 4,385 6,548 ػمبث Tubas TP
(Tayasir) Funded by
AFD 16 Tubas 50610 34,483 24,798 17,833 3.35 11,617 16,154 طثبؽ
17 El Far'a Camp
50700 ش١
افبعػخ5,712 4,152 3.24 6,286 8,647 11,896
Collection systm-
Discharged into Wadi
18 Tammun 50755 24,642 17,212 12,022 3.65 7,540 10,795 ط Cesspits
Tulkarem Gov. 19 Qaffin 100290 15,398 11,823 9,079 2.68 6,440 8,387 لف١ Cesspits
20 'Attil 100480 13,218 11,205 9,497 1.67 7,661 9,038 ػز١ Cesspits
21 Deir al Ghusun
100530 ص٠غ
اغو8,242 6,969 1.69 8,667 10,251 12,123 Cesspits
22 Bal'a 100570 10,614 8,635 7,026 2.08 5,373 6,604 ثؼب Cesspits
23 Iktaba 100595 10,704 5,848 3,195 6.23 1,456 2,665 إوزبثب Tulkarm
regional TP (Funded by
KFW )
24 Tulkarm Camp
100635 ش١
طىغ10,641 9,948 0.68 10,858 11,615 12,424
25 Tulkarm 100645 91,038 70,944 55,285 2.53 39,977 51,300 طىغ
26 Anabta 100665 11,471 9,441 7,770 1.97 6,032 7,329 ػجزب
Nablus Gov.

157
27 'Asira ash Shamaliya
150820 ػو١غح
الب١خ7,556 5,724 2.82 8,212 10,841 14,310 Cesspits
28 Nablus 150920 219,132 172,350 135,555 2.43 99,204 126,132 بثؾ Nalus west TP (Funded
by KFW (Implement
ation process),
Nablus East TP
(Feasibility study,
Funded by KFW)
29 'Askar Camp
150930 ش١
ػـىغ11,607 9,372 2.16 12,376 15,328 18,983
30 Salim 150955 10,099 7,479 5,539 3.05 3,749 5,062 ؿب
31 Balata Camp
150960 ش١
ثالطخ15,247 13,014 1.60 15,989 18,732 21,946
32 Beit Furik 151090 20,535 15,238 11,307 3.03 7,672 10,339 ث١ذ فع٠ه
33 'Awarta 151135 10,500 8,003 6,100 2.75 4,286 5,623 ػعرب Cesspits
34 Huwwara 151185 10,237 7,857 6,030 2.68 4,275 5,570 داعح Cesspits
35 Beita 151215 19,734 14,080 10,047 3.43 6,478 9,079 ث١زب Cesspits 36 Jamma'in 151245 14,870 10,183 6,974 3.86 4,263 6,225 جبػ١ Cesspits
37 Aqraba 151270 17,693 12,651 9,046 3.41 5,849 8,180 ػمغثب Cesspits
38 Qabalan 151335 13,827 10,367 7,773 2.92 5,346 7,130 لجال Cesspits
Qalqiliya Gov.
39 Qalqiliya 201040 80,584 60,538 45,479 2.90 31,356 41,739 لم١١خ Treated
inside GL
40 'Azzun 201100 15,592 11,551 8,558 3.05 5,794 7,821 ػؼ Cesspits

158
41 Habla 201125 12,927 9,270 6,647 3.38 4,314 6,016 دجخ Implementa
tion (fund UNDP)
Salfit Gov.
42 Biddya 251305 16,028 11,890 8,820 3.03 5,982 8,064 ثض٠ب Cesspits
43 Salfit 251370 14,825 11,815 9,416 2.30 7,010 8,796 ؿف١ذ Salfit TP
(Fund KFW)
Ramallah & Al-Bireh Gov.
44 Sinjil 301500 10,414 7,723 5,727 3.03 3,883 5,236 ؿج Cesspits
45 Shuqba 301595 11,177 7,523 5,064 4.04 3,027 4,497 كمجب Cesspits
46 Qibya 301605 11,055 7,762 5,450 3.60 3,441 4,901 لج١ Cesspits
47 Al Jalazun Camp
301700 ش١
اجؼ7,813 6,064 2.57 8,430 10,862 13,994
Collection systm-
Discharged into Wadi
48 Al Bireh 301790 80,645 58,277 42,112 3.30 27,606 38,202 اج١غح Al-Bireh TP
49 Ramallah 301810 74,613 48,313 31,284 4.44 17,781 27,460 عا هللا Ramallah Regional
(Ein Jaruit) - Approved (funded by
KFW)
50 Beituniya 301825 112,050 52,694 24,780 7.84 9,293 19,761 ث١ز١ب
51 Kharbatha al
301855 سغثضب
اوجبح5,211 3,662 3.59 5,793 8,243 11,730 Cesspits

159
Misbah
52 Beit Liqya 301895 15,864 11,592 8,471 3.19 5,634 7,710 ث١ذ م١ب Cesspits
Jericho Gov.
53 'Ein as Sultan Camp
351865 ش١ ػ١
اـطب3,160 1,451 8.09 3,991 8,692 18,929
Jericho TP - Implementation ( fund
JICA)
54 Jericho (Ariha)
28,095 23,343 19,395 1.87 15,243 18,346 أع٠ذب 351920
55 Aqbat Jaber Camp
351975 ش١ ػمجخ
ججغ7,176 4,521 4.73 8,243 13,084 20,767
Jerusalem Gov.
56 Qalandiya Camp
17,081 12,822 9,625 2.91 6,629 8,831 ش١ لض٠ب 401900Connected
to Ramallah
57 Ar Ram & Dahiyat al Bareed
401945 اغا
ضبد١خ
اجغ٠ض20,359 18,719 0.84 20,878 22,708 24,697
51% Collection
systm-Discharged into Wadi
58 Biddu 401995 16,226 11,116 7,615 3.86 4,657 6,798 ثض Cesspits
59 Hizma 402005 13,739 9,769 6,947 3.47 4,459 6,271 دؼب Cesspits
60 'Anata 402040 41,509 24,243 14,159 5.53 7,037 12,049 ػبرب Cesspits
61 Al 'Eizariya
Cesspits 37,157 26,854 19,408 3.30 12,724 17,606 اؼ١ؼع٠خ 402100

160
62 Abu Dis 402120 16,945 13,921 11,437 1.99 8,858 10,782 أث ص٠ؾ Cesspits
63
As Sawahira ash Sharqiya
402145 اـادغح
الغل١خ5,800 3,810 4.29 6,579 10,016 15,247 Cesspits
Bethlehem Gov.
64 Al 'Ubeidiya
22,736 16,419 11,856 3.31 7,765 10,753 اؼج١ض٠خ 452180
Collection systm-
Discharged into Wadi
65 Beit Jala 452210 13,187 12,546 11,935 0.27- 12,079 11,758 ث١ذ جبال ww
collection system
66 Husan 452230 10,952 8,150 6,065 3.00 4,131 5,551 دؿب Cesspits
67 Bethlehem (Beit Lahm)
36,004 30,866 26,461 1.55 21,660 25,266 ث١ذ ذ 452240Bethlehem TP (Fund
AFD)
68 Beit Sahur
452255 ث١ذ
ؿبدع12,367 11,137 1.05 12,762 14,171 15,736
ww collection
system
69 Ad Doha 452265 42,726 22,478 11,825 6.63 5,131 9,753 اضدخ ww
collection system
70 Al Khadr 452270 23,136 15,907 10,937 3.82 6,720 9,774 اشضغ ww
collection
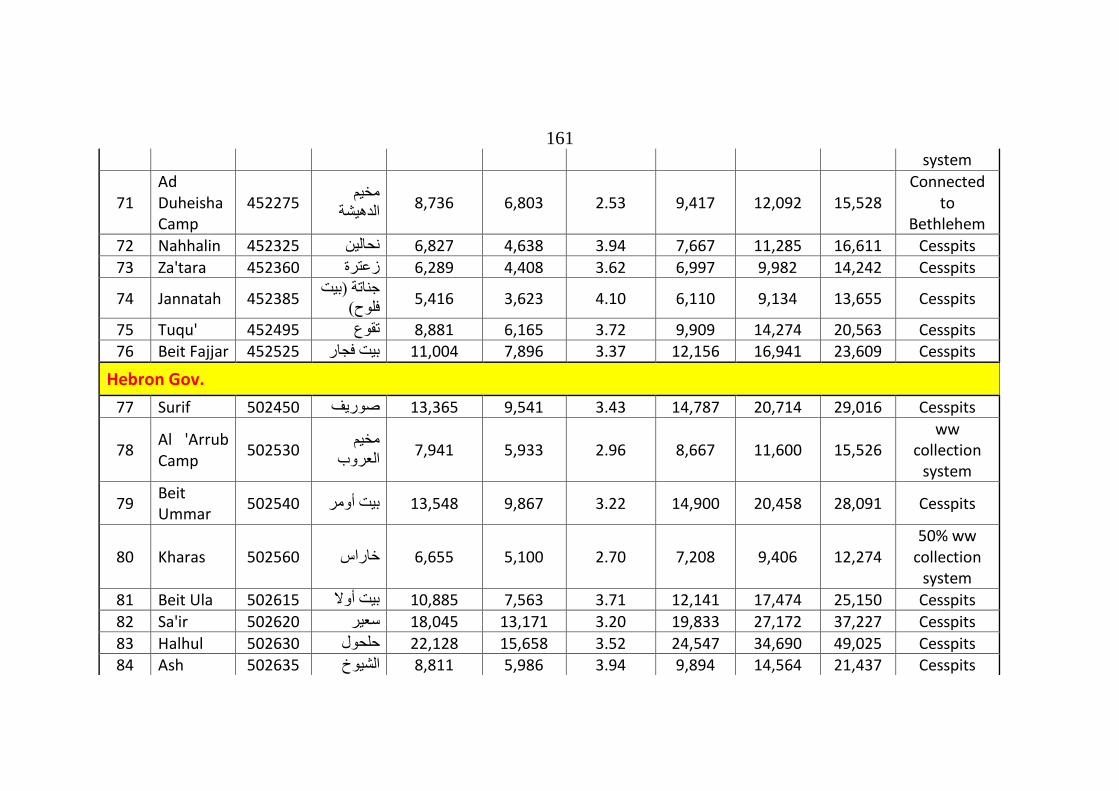
161
system
71 Ad Duheisha Camp
452275 ش١
اض١لخ8,736 6,803 2.53 9,417 12,092 15,528
Connected to
Bethlehem
72 Nahhalin 452325 16,611 11,285 7,667 3.94 4,638 6,827 ذب١ Cesspits
73 Za'tara 452360 14,242 9,982 6,997 3.62 4,408 6,289 ػػزغح Cesspits
74 Jannatah 452385 جبرخ )ث١ذ
فح(5,416 3,623 4.10 6,110 9,134 13,655 Cesspits
75 Tuqu' 452495 20,563 14,274 9,909 3.72 6,165 8,881 رمع Cesspits 76 Beit Fajjar 452525 23,609 16,941 12,156 3.37 7,896 11,004 ث١ذ فجبع Cesspits
Hebron Gov.
77 Surif 502450 29,016 20,714 14,787 3.43 9,541 13,365 هع٠ف Cesspits
78 Al 'Arrub Camp
502530 ش١
اؼغة7,941 5,933 2.96 8,667 11,600 15,526
ww collection
system
79 Beit Ummar
Cesspits 28,091 20,458 14,900 3.22 9,867 13,548 ث١ذ أغ 502540
80 Kharas 502560 12,274 9,406 7,208 2.70 5,100 6,655 سبعاؽ 50% ww
collection system
81 Beit Ula 502615 25,150 17,474 12,141 3.71 7,563 10,885 ث١ذ أال Cesspits
82 Sa'ir 502620 37,227 27,172 19,833 3.20 13,171 18,045 ؿؼ١غ Cesspits
83 Halhul 502630 49,025 34,690 24,547 3.52 15,658 22,128 دذي Cesspits 84 Ash 502635 21,437 14,564 9,894 3.94 5,986 8,811 ال١ر Cesspits

162
Shuyukh
85 Tarqumiya
Cesspits 29,868 21,721 15,796 3.24 10,441 14,357 رغل١ب 502640
86 Beit Kahil 502655 18,393 11,722 7,470 4.61 4,159 6,526 ث١ذ وبد Cesspits 87 Idhna 502685 41,207 29,438 21,030 3.42 13,582 19,012 إطب Cesspits
88 Taffuh 502750 26,924 17,950 11,968 4.14 7,065 10,597 رفح Cesspits
89 Hebron (Al Khalil)
343,950 248,692 179,815 3.30 117,962 163,146 اش١ 502780Approved by JWC (
fund USAID)
90 Deir Samit
Cesspits 16,205 10,699 7,064 4.24 4,118 6,237 ص٠غ ؿبذ 502810
91 Bani Na'im
Cesspits 50,523 33,830 22,652 4.09 13,448 20,084 ث ؼ١ 502815
92 Beit 'Awwa
Cesspits 16,391 12,041 8,846 3.13 5,924 8,064 ث١ذ ػا 502835
93 Dura 502840 72,521 48,147 31,964 4.18 18,767 28,268 صعا Cesspits
94 Al Fawwar Camp
502905 ش١
افاع6,544 4,784 3.18 7,189 9,834 13,451
Connected to Hebron
95 Yatta 503120 113,456 78,528 54,353 3.75 33,688 48,672 ٠طب Cesspits
96 Adh Dhahiriya
Cesspits 63,239 44,907 31,888 3.48 20,434 28,776 اظبغ٠خ 503245
97 As Samu' 503320 42,855 30,532 21,753 3.45 13,999 19,649 اـع Cesspits

163
7.2 Application of MCDA Tools
MCDA tools will be applied to the communities that have been selected.
First, we score for each criterion to the selected communities. Secondly, we
normalize the weights of criteria and give the score for each community.
7.2.1 Carries a Value Rating for Each Criteria
By reference to the section 6.2 we score for each community as follows:
7.2.1.1 Demography
According to (PCBS, 2007) the population and score of each community
are as shown in Table 7.2.
Table 7.2: Demography score of each community
No. Locality
Name
Projected
Population
2030
score No. Locality
Name
Projected
Population
2030
score
1 Silat al
Harithiya 17,236 0.76 33
Ar Ram &
Dahiyat al
Bareed
24,697 1.09
2 Al Yamun 31,943 1.41 34 Biddu 16,226 0.72
3 Kafr Dan 10,565 0.47 35 Hizma 13,739 0.61
4 Deir Abu
Da'if 12,681 0.56 36 'Anata 41,509 1.83
5 Birqin 10,555 0.47 37 Al
'Eizariya 37,157 1.64
6 Ya'bad 24,229 1.07 38 Abu Dis 16,945 0.75
7 Qabatiya 36,465 1.61 39
As
Sawahira
ash
Sharqiya
15,247 0.67
8 Arraba 18,452 0.81 40 Al
'Ubeidiya 22,736 1.00
9 Kafr Ra'i 12,967 0.57 41 Husan 10,952 0.48
10 Meithalun 13,825 0.61 42 Nahhalin 16,611 0.73
11 Jaba' 16,222 0.71 43 Za'tara 14,242 0.63
12 El Far'a
Camp 11,896 0.52 44 Jannatah 13,655 0.60
13 Tammun 24,642 1.09 45 Tuqu' 20,563 0.91
14 Qaffin 15,398 0.68 46 Beit Fajjar 23,609 1.04

164
15 'Attil 13,218 0.58 47 Surif 29,016 1.28
16 Deir al
Ghusun 12,123 0.53 48
Beit
Ummar 28,091 1.24
17 Bal'a 10,614 0.47 49 Kharas 12,274 0.54
18 'Asira ash
Shamaliya 14,310 0.63 50 Beit Ula 25,150 1.11
19 'Awarta 10,500 0.46 51 Sa'ir 37,227 1.64
20 Huwwara 10,237 0.45 52 Halhul 49,025 2.16
21 Beita 19,734 0.87 53 Ash
Shuyukh 21,437 0.94
22 Jamma'in 14,870 0.66 54 Tarqumiya 29,868 1.32
23 Aqraba 17,693 0.78 55 Beit Kahil 18,393 0.81
24 Qabalan 13,827 0.61 56 Idhna 41,207 1.82
25 'Azzun 15,592 0.69 57 Taffuh 26,924 1.19
26 Biddya 16,028 0.71 58 Deir Samit 16,205 0.71
27 Sinjil 10,414 0.46 59 Bani
Na'im 50,523 2.23
28 Shuqba 11,177 0.49 60 Beit
'Awwa 16,391 0.72
29 Qibya 11,055 0.49 61 Dura 72,521 3.20
30 Al Jalazun
Camp 13,994 0.62 62 Yatta 113,456 5.00
31 Kharbatha
al Misbah 11,730 0.52 63
Adh
Dhahiriya 63,239 2.79
32 Beit Liqya 15,864 0.70 64 As Samu' 42,855 1.89
7.2.1.2 Water Consumption / Wastewater Production
Scores of communities are distributed according to water consumption
(PWA, 2005) as follows in Table 7.3.
Table 7.3: Water consumption score of each community
No. Locality
Name
Water
consumption
(L/day/c
ap)
score No. Locality
Name
Water consumption
(L/day/cap)
scor
e
1 Silat al
Harithiya 111 5 33
Ar Ram
&
Dahiyat
al Bareed
55 2
2 Al Yamun 77 4 34 Biddu 68 4
3 Kafr Dan 57 3 35 Hizma 67 4

165
4 Deir Abu
Da'if 66 4 36 'Anata 88 4
5 Birqin 78 4 37 Al
'Eizariya 108 5
6 Ya'bad 54 2 38 Abu Dis 98 5
7 Qabatiya 68 4 39
As
Sawahira
ash
Sharqiya
102 5
8 Arraba 64 3 40 Al
'Ubeidiya 45 2
9 Kafr Ra'i 72 4 41 Husan 45 2
10 Meithalun 58 3 42 Nahhalin 55 2
11 Jaba' 64 3 43 Za'tara 40 1
12 El Far'a
Camp 45 2 44 Jannatah 45 2
13 Tammun 82 4 45 Tuqu' 50 2
14 Qaffin 85 4 46 Beit
Fajjar 60 3
15 'Attil 90 4 47 Surif 30 1
16 Deir al
Ghusun 96 5 48
Beit
Ummar 50 2
17 Bal'a 76 4 49 Kharas 42 1
18 'Asira ash
Shamaliya 65 3 50 Beit Ula 35 1
19 'Awarta 83 4 51 Sa'ir 30 1
20 Huwwara 66 4 52 Halhul 35 1
21 Beita 56 3 53 Ash
Shuyukh 45 2
22 Jamma'in 62 3 54 Tarqumiy
a 40 1
23 Aqraba 106 5 55 Beit
Kahil 50 2
24 Qabalan 33 1 56 Idhna 45 2
25 'Azzun 140 5 57 Taffuh 30 1
26 Biddya 53 2 58 Deir
Samit 55 2
27 Sinjil 46 2 59 Bani
Na'im 42 1
28 Shuqba 24 1 60 Beit
'Awwa 25 1
29 Qibya 56 3 61 Dura 50 2
30 Al Jalazun
Camp 94 5 62 Yatta 30 1

166
31 Kharbatha
al Misbah 57 3 63
Adh
Dhahiriya 55 2
32 Beit Liqya 52 2 64 As Samu' 60 3
7.2.1.3 Reusing Wastewater
Scores of communities are distributed by using value agricultural land map
as follows in Table 7.4. (See Figure 6.1 published by MoA).
Table 7.4: Wastewater reuse score of each community
No. Locality
Name
Agricultural
land value score No.
Locality
Name
Agricultural
land value score
1 Silat al
Harithiya High 5 33
Ar Ram &
Dahiyat al
Bareed
Low 1
2 Al Yamun High 5 34 Biddu Medium 3
3 Kafr Dan High 5 35 Hizma Low 1
4 Deir Abu
Da'if High 5 36 'Anata Low 1
5 Birqin Medium 3 37 Al
'Eizariya Low 1
6 Ya'bad Medium 3 38 Abu Dis Low 1
7 Qabatiya High +
Medium 4 39
As
Sawahira
ash
Sharqiya
Low 1
8 Arraba High +
Medium 4 40
Al
'Ubeidiya Low 1
9 Kafr Ra'i Low +
Medium 2 41 Husan Medium 3
10 Meithalun
Low +
Medium +
High
3 42 Nahhalin Medium 3
11 Jaba' Medium 3 43 Za'tara Low +
Medium 2
12 El Far'a
Camp High 5 44 Jannatah
Low +
Medium 2
13 Tammun Low 1 45 Tuqu' Low +
Medium 2
14 Qaffin Medium 3 46 Beit Fajjar Low +
Medium 2
15 'Attil High 5 47 Surif Low 1

167
16 Deir al
Ghusun High 5 48
Beit
Ummar
Low +
Medium 2
17 Bal'a Low +
Medium 2 49 Kharas Low 1
18 'Asira ash
Shamaliya Low 1 50 Beit Ula Low 1
19 'Awarta
Low +
Medium +
High
3 51 Sa'ir Low +
Medium 2
20 Huwwara Low +
Medium 2 52 Halhul
Low +
Medium 2
21 Beita Low +
Medium 2 53
Ash
Shuyukh Low 1
22 Jamma'in Low +
Medium 2 54 Tarqumiya Low 1
23 Aqraba Low +
Medium 2 55 Beit Kahil
Low +
Medium 2
24 Qabalan Low +
Medium 2 56 Idhna Low 1
25 'Azzun Low +
Medium 2 57 Taffuh
Low +
Medium 2
26 Biddya Low +
Medium 2 58 Deir Samit
Low +
Medium 2
27 Sinjil Low +
Medium 2 59
Bani
Na'im Low 1
28 Shuqba Low +
Medium 2 60
Beit
'Awwa
Low +
Medium 2
29 Qibya Low +
Medium 2 61 Dura Low 1
30
Al
Jalazun
Camp
Low + High 3 62 Yatta Low 1
31 Kharbatha
al Misbah Medium 3 63
Adh
Dhahiriya
Low +
Medium +
High
3
32 Beit
Liqya
High +
Medium 4 64 As Samu' Low 1
7.2.1.4 Environmental Factor Scores of communities are distributed as follows in Table 7.5.
Table .

168
Table 7.5: Environmental factor score of each community
No
. Locality Name
Springs or
wells in the
region
Hydrological
vulnerability to
Groundwater
score No
. Locality Name
Springs or wells
in the region
Hydrological
vulnerability to
Groundwater
score
1 Silat al
Harithiya No High 4 33
Ar Ram &
Dahiyat al
Bareed
High No 4
2 Al Yamun Yes Low 3 34 Biddu High No 4
3 Kafr Dan Yes Medium 4 35 Hizma High Yes 5
4 Deir Abu Da'if No High 4 36 'Anata High No 4
5 Birqin Yes Low 3 37 Al 'Eizariya Low Yes 3
6 Ya'bad Yes Medium 4 38 Abu Dis Low No 2
7 Qabatiya Yes High 5 39 As Sawahira
ash Sharqiya Low Yes 3
8 Arraba Yes Low 3 40 Al 'Ubeidiya Low No 2
9 Kafr Ra'i No Medium 3 41 Husan High Yes 5
10 Meithalun No High 4 42 Nahhalin High Yes 5
11 Jaba' Yes High 5 43 Za'tara Low Yes 3
12 El Far'a Camp Yes High 5 44 Jannatah Medium No 3
13 Tammun Yes Low 3 45 Tuqu' High Yes 5
14 Qaffin Yes Low 3 46 Beit Fajjar High Yes 5
15 'Attil Yes Medium 4 47 Surif High No 4
16 Deir al Ghusun Yes Low 3 48 Beit Ummar High Yes 5
17 Bal'a Yes Medium 4 49 Kharas High No 4
18 'Asira ash
Shamaliya No High 4 50 Beit Ula Medium No 3

169
19 'Awarta Yes Low 3 51 Sa'ir High Yes 5
20 Huwwara Yes Low 3 52 Halhul High Yes 5
21 Beita No Medium 3 53 Ash Shuyukh High Yes 5
22 Jamma'in No High 4 54 Tarqumiya High No 4
23 Aqraba Yes High 5 55 Beit Kahil High Yes 5
24 Qabalan No High 4 56 Idhna Low Yes 3
25 'Azzun Yes Medium 4 57 Taffuh High Yes 5
26 Biddya No High 4 58 Deir Samit Low No 2
27 Sinjil Yes High 5 59 Bani Na'im Low Yes 3
28 Shuqba Yes High 5 60 Beit 'Awwa Low No 2
29 Qibya No High 4 61 Dura High Yes 5
30 Al Jalazun
Camp No High 4 62 Yatta Medium Yes 4
31 Kharbatha al
Misbah No Low 2 63 Adh Dhahiriya Low No 2
32 Beit Liqya Yes Medium 4 64 As Samu' Low Yes 3

170
7.2.1.5 Operation Body
Scores of communities are distributed according to MoLG and MDLF
ranking as follows in Table 7.6.
Table 7.6: Operation body score of each community
No.
Locality
Nam
e
Ran
k
(MoL
G)
Ran
k
(MD
LF
)
score
No.
Locality
Nam
e
Ran
k
(MoL
G)
Ran
k
(MD
LF
)
score
1
Silat al
Harithi
ya
C C 3.5 33
Ar Ram &
Dahiyat al
Bareed
C C 3.5
2 Al
Yamun B C 4.0 34 Biddu C C 3.5
3 Kafr
Dan
Village
Council C 2.5 35 Hizma
Village
Council C 2.5
4
Deir
Abu
Da'if
Village
Council C 2.5 36 'Anata C E 2.5
5 Birqin C C 3.5 37 Al 'Eizariya C C 3.5
6 Ya'bad B C 4.0 38 Abu Dis C C 3.5
7 Qabati
ya B C 4.0 39
As Sawahira
ash Sharqiya C C 3.5
8 Arraba B C 4.0 40 Al 'Ubeidiya C C 3.5
9 Kafr
Ra'i C C 3.5 41 Husan
Village
Council C 2.5
10 Meithal
un C C 3.5 42 Nahhalin
Village
Council C 2.5
11 Jaba' C C 3.5 43 Za'tara C C 3.5
12 El Far'a
Camp
Projects
Commi
ttee
C 2.5 44 Jannatah D C 2.0
13 Tammu
n C C 3.5 45 Tuqu' C C 3.5
14 Qaffin C C 3.5 46 Beit Fajjar C C 3.5
15 'Attil C C 3.5 47 Surif C C 3.5
16 Deir al
Ghusun C C 3.5 48 Beit Ummar C C 3.5
17 Bal'a C C 3.5 49 Kharas C C 3.5
18
'Asira
ash
Shamal
iya
C C 3.5 50 Beit Ula C C 3.5
19 'Awarta Village
Council C 2.5 51 Sa'ir B C 4.0

171
20 Huwwa
ra C C 3.5 52 Halhul B C 4.0
21 Beita C C 3.5 53 Ash Shuyukh C C 3.5
22 Jamma'
in C C 3.5 54 Tarqumiya C C 3.5
23 Aqraba C C 3.5 55 Beit Kahil Village
Council C 2.5
24 Qabala
n C C 3.5 56 Idhna B B 4.5
25 'Azzun C C 3.5 57 Taffuh C C 3.5
26 Biddya C C 3.5 58 Deir Samit C C 3.5
27 Sinjil C E 2.5 59 Bani Na'im B C 4.0
28 Shuqba Village
Council C 2.5 60 Beit 'Awwa C C 3.5
29 Qibya Village
Council C 2.5 61 Dura B B 4.5
30
Al
Jalazun
Camp
Projects
Commi
ttee
C 2.5 62 Yatta B C 4.0
31
Kharba
tha al
Misbah
Village
Council C 2.5 63
Adh
Dhahiriya B C 4.0
32 Beit
Liqya C C 3.5 64 As Samu' B C 4.0
7.2.1.6 Risk for Industrial Waste
Scores of communities are distributed according to the number of industrial
operations (stone cutting, olive press, textiles, etc) (PCBS, 2007) as follows
in Table 7.7.

172
Table 7.7: Risk for Industrial Waste score of each community
No. Locality
Name
Olive
presses
Stonecutt
ers Textiles
Tot
al Score No.
Locality
Name
Olive
presses Stonecutters
Texti
les Total Score
1 Silat al
Harithiya 1 2 0 3 4 33
Ar Ram &
Dahiyat al
Bareed
1 4 0 5 3
2 Al
Yamun 4 3 0 7 3 34 Biddu 2 3 0 5 3
3 Kafr Dan 1 0 0 1 4 35 Hizma 0 5 0 5 3
4 Deir Abu
Da'if 1 0 0 1 4 36 'Anata 0 11 0 11 2
5 Birqin 3 0 0 3 4 37 Al
'Eizariya 0 0 1 1 4
6 Ya'bad 2 0 0 2 4 38 Abu Dis 0 0 0 0 5
7 Qabatiya 4 64 0 68 1 39
As
Sawahira
ash
Sharqiya
0 0 0 0 5
8 Arraba 5 3 0 8 3 40 Al
'Ubeidiya 0 0 0 0 5
9 Kafr Ra'i 5 1 0 6 3 41 Husan 0 0 0 0 5
10 Meithalu
n 2 2 0 4 4 42 Nahhalin 0 0 0 0 5
11 Jaba' 2 1 0 3 4 43 Za'tara 0 0 0 0 5

173
12 El Far'a
Camp 0 0 0 0 5 44 Jannatah 0 0 0 0 5
13 Tammun 0 5 0 5 3 45 Tuqu' 0 1 0 1 4
14 Qaffin 3 2 0 5 3 46 Beit Fajjar 0 182 0 182 1
15 'Attil 2 3 0 5 3 47 Surif 2 2 0 4 4
16 Deir al
Ghusun 4 1 0 5 3 48
Beit
Ummar 0 15 0 15 2
17 Bal'a 2 1 0 3 4 49 Kharas 2 2 0 4 4
18
'Asira
ash
Shamaliy
a
3 2 0 5 3 50 Beit Ula 1 0 0 1 4
19 'Awarta 2 0 0 2 4 51 Sa'ir 2 12 0 14 2
20 Huwwar
a 0 2 0 2 4 52 Halhul 0 9 0 9 3
21 Beita 5 0 0 5 3 53 Ash
Shuyukh 0 15 0 15 2
22 Jamma'in 2 30 0 32 1 54 Tarqumiy
a 1 5 0 6 3
23 Aqraba 2 2 0 4 4 55 Beit Kahil 0 0 0 0 5
24 Qabalan 3 1 0 4 4 56 Idhna 3 6 0 9 3
25 'Azzun 2 0 0 2 4 57 Taffuh 0 0 0 0 5
26 Biddya 5 0 0 5 3 58 Deir
Samit 1 0 0 1 4
27 Sinjil 0 0 0 0 5 59 Bani
Na'im 1 4 0 5 3

174
28 Shuqba 1 1 0 2 4 60 Beit
'Awwa 0 13 0 13 2
29 Qibya 0 1 0 1 4 61 Dura 1 0 0 1 4
30
Al
Jalazun
Camp
0 0 0 0 5 62 Yatta 2 9 0 11 2
31
Kharbath
a al
Misbah
2 2 0 4 4 63 Adh
Dhahiriya 2 8 0 10 2
32 Beit
Liqya 1 2 0 3 4 64 As Samu' 0 0 0 0 5
7.2.1.7 Socio-Economic Factor
Scores of communities are distributed according to percentages of the population holding a bachelor degree or a higher
degree and the percentages of the economically active citizens of the total population aged 10 years and over (PCBS, 2007)
as follows in Table 7.8.
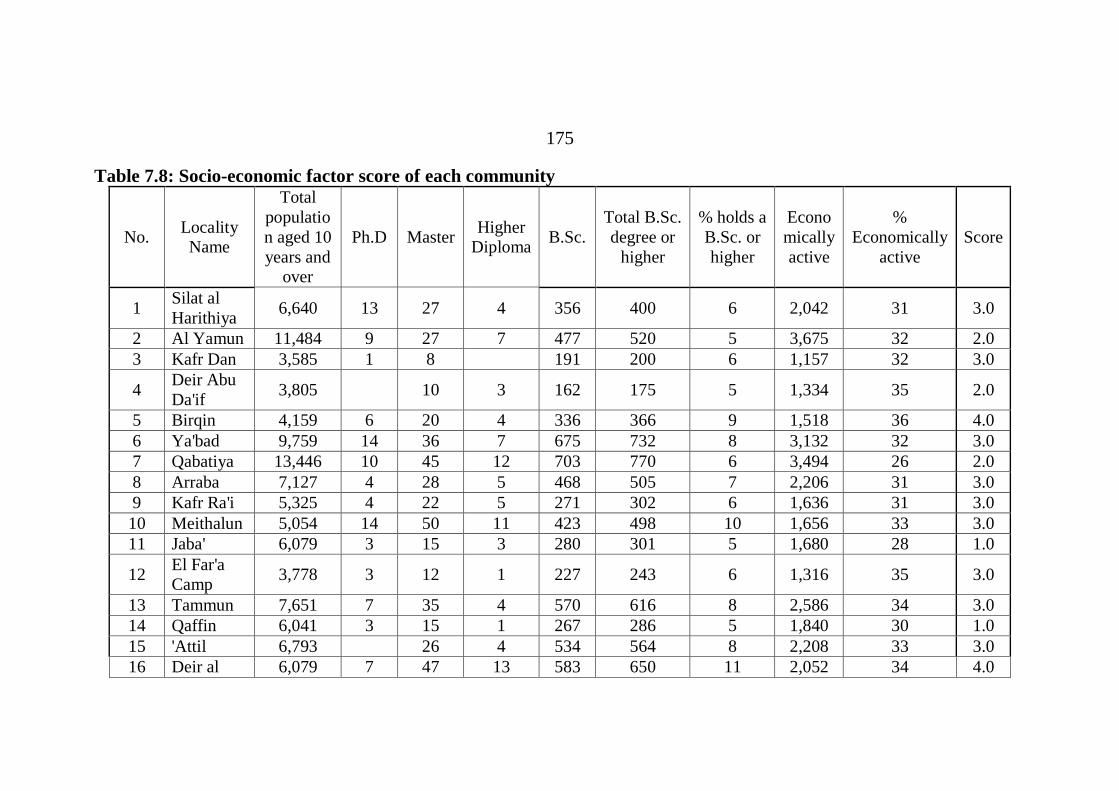
175
Table 7.8: Socio-economic factor score of each community
No. Locality
Name
Total
populatio
n aged 10
years and
over
Ph.D Master Higher
Diploma B.Sc.
Total B.Sc.
degree or
higher
% holds a
B.Sc. or
higher
Econo
mically
active
%
Economically
active
Score
1 Silat al
Harithiya 6,640 13 27 4 356 400 6 2,042 31 3.0
2 Al Yamun 11,484 9 27 7 477 520 5 3,675 32 2.0
3 Kafr Dan 3,585 1 8
191 200 6 1,157 32 3.0
4 Deir Abu
Da'if 3,805 10 3 162 175 5 1,334 35 2.0
5 Birqin 4,159 6 20 4 336 366 9 1,518 36 4.0
6 Ya'bad 9,759 14 36 7 675 732 8 3,132 32 3.0
7 Qabatiya 13,446 10 45 12 703 770 6 3,494 26 2.0
8 Arraba 7,127 4 28 5 468 505 7 2,206 31 3.0
9 Kafr Ra'i 5,325 4 22 5 271 302 6 1,636 31 3.0
10 Meithalun 5,054 14 50 11 423 498 10 1,656 33 3.0
11 Jaba' 6,079 3 15 3 280 301 5 1,680 28 1.0
12 El Far'a
Camp 3,778 3 12 1 227 243 6 1,316 35 3.0
13 Tammun 7,651 7 35 4 570 616 8 2,586 34 3.0
14 Qaffin 6,041 3 15 1 267 286 5 1,840 30 1.0
15 'Attil 6,793 26 4 534 564 8 2,208 33 3.0
16 Deir al 6,079 7 47 13 583 650 11 2,052 34 4.0

176
Ghusun
17 Bal'a 4,756 3 15 2 225 245 5 1,474 31 2.0
18 'Asira ash
Shamaliya 5,557 12 52 11 649 724 13 2,023 36 5.0
19 'Awarta 3,982 8 1 193 202 5 1,292 32 2.0
20 Huwwara 3,948 3 20 3 221 247 6 1,201 30 2.0
21 Beita 6,198 6 33 2 383 424 7 1,902 31 3.0
22 Jamma'in 4,206 4 21 1 263 289 7 1,261 30 2.0
23 Aqraba 5,625 1 6
145 152 3 1,713 30 1.0
24 Qabalan 5,030 1 11 1 164 177 4 1,551 31 2.0
25 'Azzun 5,414 3 21 7 390 421 8 1,765 33 3.0
26 Biddya 5,563 5 41 2 377 425 8 1,791 32 3.0
27 Sinjil 3,459 5 12 4 139 160 5 1,129 33 2.0
28 Shuqba 2,929 1 6 1 105 113 4 1,014 35 2.0
29 Qibya 3,253 3
101 104 3 1,163 36 3.0
30 Al Jalazun
Camp 5,158 2 15
162 179 3 1,773 34 2.0
31 Kharbatha
al Misbah 3,478 1 7 1 106 115 3 1,091 31 2.0
32 Beit Liqya 5,226 16 1 260 277 5 1,692 32 2.0
33
Ar Ram &
Dahiyat al
Bareed
9,589 16 101 12 698 827 9 3,520 37 4.0
34 Biddu 4,303 2 10 2 193 207 5 1,420 33 2.0
35 Hizma 3,962 9 28 5 329 371 9 1,286 32 3.0
36 'Anata 6,067 9 32 12 331 384 6 2,064 34 3.0

177
37 Al
'Eizariya 8,703 18 53 10 464 545 6 2,873 33 3.0
38 Abu Dis 6,141 28 119 22 647 816 13 2,307 38 5.0
39
As
Sawahira
ash
Sharqiya
3,282 15 24 3 189 231 7 1,088 33 3.0
40 Al
'Ubeidiya 7,142 3 10 1 287 301 4 2,205 31 2.0
41 Husan 3,872 4 9 10 138 161 4 1,295 33 2.0
42 Nahhalin 4,542 11 21 12 314 358 8 1,442 32 3.0
43 Za'tara 4,209 5 17 9 305 336 8 1,316 31 3.0
44 Jannatah 3,572 2 2 98 102 3 1,023 29 1.0
45 Tuqu' 6,047 1 11 1 267 280 5 1,727 29 1.0
46 Beit Fajjar 7,517 2 17 3 264 286 4 2,387 32 2.0
47 Surif 9,381 8 31 13 789 841 9 2,198 23 2.0
48 Beit
Ummar 9,331 25 55 12 799 891 10 3,066 33 3.0
49 Kharas 4,526 3 17 4 254 278 6 1,298 29 2.0
50 Beit Ula 7,160 3 9 3 343 358 5 2,180 30 1.0
51 Sa'ir 12,046 9 24 17 540 590 5 3,608 30 1.0
52 Halhul 15,475 32 93 33 1290 1448 9 5,215 34 3.0
53 Ash
Shuyukh 5,956 2 25 5 325 357 6 1,747 29 2.0
54 Tarqumiy
a 9,978 9 31 4 651 695 7 3,089 31 3.0

178
55 Beit Kahil 4,169 1 14 6 327 348 8 1,154 28 2.0
56 Idhna 13,062 18 47 8 759 832 6 4,045 31 3.0
57 Taffuh 6,877 1 15 1 245 262 4 2,014 29 1.0
58 Deir Samit 3,999 3 5 147 155 4 1,074 27 1.0
59 Bani
Na'im 13,194 15 36 3 579 633 5 4,151 31 2.0
60 Beit
'Awwa 5,557 3 4 4 194 205 4 1,684 30 1.0
61 Dura 19,514 53 156 31 1914 2154 11 6,355 33 4.0
62 Yatta 31,541 21 60 11 1267 1359 4 9,083 29 1.0
63 Adh
Dhahiriya 19,245 14 41 25 793 873 5 6,152 32 2.0
64 As Samu' 13,116 9 33 6 734 782 6 3,447 26 2.0

179
7.2.1.8 Geographical Factor (topography, catchment)
Scores of communities are distributed according to geographical factors as
follows in Table 7.9.
Table 7.9: Geographical factor score of each community
No
.
Lo
cality N
ame
% g
ravity
flow
No
. of catch
men
ts
Sco
re
No
.
Lo
cality N
ame
% g
ravity
flow
No
. of catch
men
ts
Sco
re
1 Silat al
Harithiya
50% to
75% 2 3.0 33
Ar Ram &
Dahiyat al
Bareed
<50% > 2 1.5
2 Al
Yamun
75% to
95% 2 3.5 34 Biddu
50% to
75% 2 3.0
3 Kafr Dan > 95% 2 4.0 35 Hizma 75% to
95% 2 3.5
4 Deir Abu
Da'if > 95% 1 5.0 36 'Anata
75% to
95% 2 3.5
5 Birqin 75% to
95% 2 3.5 37
Al
'Eizariya <50% > 2 1.5
6 Ya'bad 50% to
75% 2 3.0 38 Abu Dis <50% > 2 1.5
7 Qabatiya > 95% 1 5.0 39
As
Sawahira
ash
Sharqiya
50% to
75% 2 3.0
8 Arraba <50% > 2 1.5 40 Al
'Ubeidiya <50% > 2 1.5
9 Kafr Ra'i 50% to
75% > 2 2.0 41 Husan <50% > 2 1.5
10 Meithalu
n > 95% 1 5.0 42 Nahhalin <50% > 2 1.5
11 Jaba' 75% to
95% 2 3.5 43 Za'tara
50% to
75% 2 3.0
12 El Far'a
Camp > 95% 1 5.0 44 Jannatah <50% > 2 1.5
13 Tammun 50% to
75% 2 3.0 45 Tuqu' > 95% 2 4.0

180
14 Qaffin > 95% 2 4.0 46 Beit Fajjar 50% to
75% 2 3.0
15 'Attil > 95% 2 4.0 47 Surif 50% to
75% 2 3.0
16 Deir al
Ghusun
50% to
75% 2 3.0 48
Beit
Ummar <50% > 2 1.5
17 Bal'a 75% to
95% > 2 2.5 49 Kharas > 95% 1 5.0
18
'Asira ash
Shamaliy
a
50% to
75% 2 3.0 50 Beit Ula
50% to
75% > 2 2.0
19 'Awarta 50% to
75% 2 3.0 51 Sa'ir <50% > 2 1.5
20 Huwwara > 95% 1 5.0 52 Halhul 75% to
95% > 2 2.5
21 Beita > 95% 2 4.0 53 Ash
Shuyukh
75% to
95% 2 3.5
22 Jamma'in 50% to
75% 2 3.0 54 Tarqumiya <50% > 2 1.5
23 Aqraba 50% to
75% 2 3.0 55 Beit Kahil
50% to
75% 2 3.0
24 Qabalan > 95% 2 4.0 56 Idhna <50% > 2 1.5
25 'Azzun > 95% 2 4.0 57 Taffuh 50% to
75% 2 3.0
26 Biddya 50% to
75% 2 3.0 58 Deir Samit
75% to
95% > 2 2.5
27 Sinjil > 95% 2 4.0 59 Bani Na'im <50% > 2 1.5
28 Shuqba 50% to
75% > 2 2.0 60
Beit
'Awwa
50% to
75% > 2 2.0
29 Qibya <50% > 2 1.5 61 Dura 75% to
95% > 2 2.5
30
Al
Jalazun
Camp
75% to
95% 2 3.5 62 Yatta
50% to
75% > 2 2.0
31
Kharbath
a al
Misbah
50% to
75% 2 3.0 63
Adh
Dhahiriya <50% > 2 1.5
32 Beit
Liqya > 95% 1 5.0 64 As Samu'
75% to
95% 2 3.5

182
7.2.1.9 Political Issues
Scores of communities are distributed according to political issues as
follows in Table 7.10.
Table 7.10: political issues score of each community
No
.
Lo
cality
Nam
e
Settlem
ent
in
the catch
men
t
area
Po
litical lan
d
classification
s
Sco
re
No
.
Lo
cality
Nam
e
Settlem
ent
in
the catch
men
t
area
Po
litical lan
d
classification
s
Sco
re
1 Silat al
Harithiya NO A+B 4.0 33
Ar Ram &
Dahiyat al
Bareed
YES B+C 2.0
2 Al Yamun NO A+B 4.0 34 Biddu YES B+C 2.0
3 Kafr Dan NO A+B 4.0 35 Hizma YES B+C 2.0
4 Deir Abu
Da'if NO A+B 4.0 36 'Anata YES B+C 2.0
5 Birqin NO B 4.0 37 Al
'Eizariya YES B+C 2.0
6 Ya'bad YES B+C 2.0 38 Abu Dis YES B+C 2.0
7 Qabatiya NO B 4.0 39
As
Sawahira
ash
Sharqiya
YES B+C 2.0
8 Arraba NO A+B
+C 3.0 40
Al
'Ubeidiya NO A+C 3.0
9 Kafr Ra'i NO A 5.0 41 Husan NO B+C 3.0
10 Meithalun NO A 5.0 42 Nahhalin YES B+C 2.0
11 Jaba' NO B 4.0 43 Za'tara NO A+B
+C 3.0
12 El Far'a
Camp NO A 5.0 44 Jannatah NO B+C 3.0
13 Tammun NO A+B 4.0 45 Tuqu' YES B+C 2.0
14 Qaffin NO B+C 3.0 46 Beit Fajjar NO B 4.0
15 'Attil NO B+C 3.0 47 Surif NO B+C 3.0
16 Deir al
Ghusun NO B+C 3.0 48
Beit
Ummar YES B+C 2.0
17 Bal'a NO A+B
+C 3.0 49 Kharas NO B 4.0
18 'Asira ash
Shamaliya NO A+B 4.0 50 Beit Ula NO B 4.0

182
19 'Awarta YES B+C 2.0 51 Sa'ir NO B+C 3.0
20 Huwwara NO B+C 3.0 52 Halhul NO B+C 3.0
21 Beita NO B+C 3.0 53 Ash
Shuyukh NO B+C 3.0
22 Jamma'in NO B+C 3.0 54 Tarqumiy
a YES B+C 2.0
23 Aqraba NO B+C 3.0 55 Beit Kahil NO B+C 3.0
24 Qabalan NO B 4.0 56 Idhna NO B+C 3.0
25 'Azzun YES B+C 2.0 57 Taffuh NO A+B 4.0
26 Biddya YES B+C 2.0 58 Deir
Samit NO B+C 3.0
27 Sinjil NO A+B
+C 3.0 59
Bani
Na'im NO
A+B
+C 3.0
28 Shuqba NO B+C 3.0 60 Beit
'Awwa YES B+C 2.0
29 Qibya NO B+C 3.0 61 Dura NO A+B 4.0
30 Al Jalazun
Camp YES B+C 2.0 62 Yatta NO A+B 4.0
31 Kharbatha
al Misbah NO B+C 3.0 63
Adh
Dhahiriya NO A+B 4.0
32 Beit Liqya NO B+C 3.0 64 As Samu' NO A+B 4.0
7.2.2 Evaluation Measure for Each Community
According to the previous section and normalized weight in section 6.1 we
calculate the evaluation measure for each community as shown in Table
7.11.

183
Table 7.11: Calculate evaluation measure for each community
No.
Locality Name
Criteria Score for each community
Criteria Score × Normalize
weight (500)
Score for each
community (100)
Dem
ograp
hy
Water
con
sum
ptio
n/
Wastew
ater
pro
du
ction
Reu
sing
waste
water
Enviro
nm
enta
l factor
Op
eration
b
od
y
Risk fo
r In
du
strial
Waste
Socio
-
econ
om
ic facto
r
Geo
graph
ical facto
r
Po
litical
Issues
Normalize weight 12.5 10.37 7.62 14.48 13.11 9.76 13.11 8.38 10.67
1 Silat al
Harithiya 0.76 5 5 4 3.5 4 3.0 3 4.0 349.5 69.9
2 Al Yamun 1.41 4 5 3 4 3 2.0 4 4.0 320.5 64.1
3 Kafr Dan 0.47 3 5 4 2.5 4 3.0 4 4.0 320.5 64.1
4 Deir Abu Da'if 0.56 4 5 4 2.5 4 2.0 5 4.0 323.5 64.7
5 Birqin 0.47 4 3 3 3.5 4 4.0 4 4.0 323 64.6 6 Ya'bad 1.07 2 3 4 4 4 3.0 3 2.0 292 58.4
7 Qabatiya 1.61 4 4 5 4 1 2.0 5 4.0 320.5 64.1
8 Arraba 0.81 3 4 3 4 3 3.0 2 3.0 297.5 59.5
9 Kafr Ra'i 0.57 4 2 3 3.5 3 3.0 2 5.0 308.5 61.7
10 Meithalun 0.61 3 3 4 3.5 4 3.0 5 5.0 322.5 64.5
11 Jaba' 0.71 3 3 5 3.5 4 1.0 4 4.0 305.5 61.1 12 El Far'a Camp 0.52 2 5 5 2.5 5 3.0 5 5.0 337 67.4
13 Tammun 1.09 4 1 3 3.5 3 3.0 3 4.0 288.5 57.7
14 Qaffin 0.68 4 3 3 3.5 3 1.0 4 3.0 283 56.6
15 'Attil 0.58 4 5 4 3.5 3 3.0 4 3.0 325 65

184
16 Deir al Ghusun 0.53 5 5 3 3.5 3 4.0 3 3.0 325 65
17 Bal'a 0.47 4 2 4 3.5 4 2.0 3 3.0 314.5 62.9
18 'Asira ash Shamaliya
0.63 3 1 4 3.5 3 5.0 3 4.0 313 62.6
19 'Awarta 0.46 4 3 3 2.5 4 2.0 3 2.0 271 54.2
20 Huwwara 0.45 4 2 3 3.5 4 2.0 5 3.0 287 57.4
21 Beita 0.87 3 2 3 3.5 3 3.0 4 3.0 280.5 56.1 22 Jamma'in 0.66 3 2 4 3.5 1 2.0 3 3.0 251.5 50.3
23 Aqraba 0.78 5 2 5 3.5 4 1.0 3 3.0 317.5 63.5
24 Qabalan 0.61 1 2 4 3.5 4 2.0 4 4.0 278.5 55.7
25 'Azzun 0.69 5 2 4 3.5 4 3.0 4 2.0 312.5 62.5
26 Biddya 0.71 2 2 4 3.5 3 3.0 3 2.0 263.5 52.7
27 Sinjil 0.46 2 2 5 2.5 5 2.0 4 3.0 287.5 57.5 28 Shuqba 0.49 1 2 5 2.5 4 2.0 2 3.0 267.5 53.5
29 Qibya 0.49 3 2 4 2.5 4 3.0 2 3.0 283 56.6
30 Al Jalazun
Camp 0.62 5 3 4 2.5 5 2.0 4 2.0 299 59.8
31 Kharbatha al
Misbah 0.52 3 3 2 2.5 4 2.0 3 3.0 244.5 48.9
32 Beit Liqya 0.70 2 4 4 3.5 4 2.0 5 3.0 299.5 59.9
33 Ar Ram & Dahiyat al
Bareed 1.09 2.00 1.00 4.00 3.50 3.00 4.00 1.50 2.00 278 55.6
34 Biddu 0.72 4.00 3.00 4.00 3.50 3.00 2.00 3.00 2.00 279 55.8
35 Hizma 0.61 4.00 1.00 5.00 2.50 3.00 3.00 3.50 2.00 281 56.2

185
36 'Anata 1.83 4.00 1.00 4.00 2.50 2.00 3.00 3.50 2.00 272 54.4
37 Al 'Eizariya 1.64 5.00 1.00 3.00 3.50 4.00 3.00 1.50 2.00 298.5 59.7
38 Abu Dis 0.75 5.00 1.00 2.00 3.50 5.00 5.00 1.50 2.00 308.5 61.7
39 As Sawahira ash Sharqiya
0.67 5.00 1.00 3.00 3.50 5.00 3.00 3.00 2.00 292 58.4
40 Al 'Ubeidiya 1.00 2.00 1.00 2.00 3.50 5.00 2.00 1.50 3.00 252 50.4
41 Husan 0.48 2.00 3.00 5.00 2.50 5.00 2.00 1.50 3.00 291 58.2 42 Nahhalin 0.73 2.00 3.00 5.00 2.50 5.00 3.00 1.50 2.00 296.5 59.3
43 Za'tara 0.63 1.00 2.00 3.00 3.50 5.00 3.00 3.00 3.00 268 53.6
44 Jannatah 0.60 2.00 2.00 3.00 2.00 5.00 1.00 1.50 3.00 249.5 49.9
45 Tuqu' 0.91 2.00 2.00 5.00 3.50 4.00 1.00 4.00 2.00 272.5 54.5
46 Beit Fajjar 1.04 3.00 2.00 5.00 3.50 1.00 2.00 3.00 4.00 281.5 56.3
47 Surif 1.28 1.00 1.00 4.00 3.50 4.00 2.00 3.00 3.00 260 52 48 Beit Ummar 1.24 2.00 2.00 5.00 3.50 2.00 3.00 1.50 2.00 279.5 55.9
49 Kharas 0.54 1.00 1.00 4.00 3.50 4.00 2.00 5.00 4.00 261.5 52.3
50 Beit Ula 1.11 1.00 1.00 3.00 3.50 4.00 1.00 2.00 4.00 275.5 55.1
51 Sa'ir 1.64 1.00 2.00 5.00 4.00 2.00 1.00 1.50 3.00 265 53
52 Halhul 2.16 1.00 2.00 5.00 4.00 3.00 3.00 2.50 3.00 316 63.2
53 Ash Shuyukh 0.94 2.00 1.00 5.00 3.50 2.00 2.00 3.50 3.00 265.5 53.1
54 Tarqumiya 1.32 1.00 1.00 4.00 3.50 3.00 3.00 1.50 2.00 257.5 51.5 55 Beit Kahil 0.81 2.00 2.00 5.00 2.50 5.00 2.00 3.00 3.00 283.5 56.7
56 Idhna 1.82 2.00 1.00 3.00 4.50 3.00 3.00 1.50 3.00 283.5 56.7
57 Taffuh 1.19 1.00 2.00 5.00 3.50 5.00 1.00 3.00 4.00 288.5 57.7
58 Deir Samit 0.71 2.00 2.00 2.00 3.50 4.00 1.00 2.50 3.00 241.5 48.3
59 Bani Na'im 2.23 1.00 1.00 3.00 4.00 3.00 2.00 1.50 3.00 258.5 51.7

186
60 Beit 'Awwa 0.72 1.00 2.00 2.00 3.50 2.00 1.00 2.00 2.00 210 42
61 Dura 3.20 2.00 1.00 5.00 4.50 4.00 4.00 2.50 4.00 371.5 74.3
62 Yatta 5.00 1.00 1.00 4.00 4.00 2.00 1.00 2.00 4.00 299.5 59.9
63 Adh Dhahiriya 2.79 2.00 3.00 2.00 4.00 2.00 2.00 1.50 4.00 277.5 55.5 64 As Samu' 1.89 3.00 1.00 3.00 4.00 5.00 2.00 3.50 4.00 305 61

187
7.3 Setting Priorities
Communities were arranged based on the score of each community as
shown in Table 7.12.
Table 7.12: Setting priorities for communities
No
.
Lo
calit
y
Nam
e
Sco
re
No
.
Lo
calit
y
Nam
e
Sco
re
No
.
Lo
calit
y
Nam
e
Sco
re
1 Dura 74.3 23 Al Jalazun
Camp 59.8 45
Adh
Dhahiriya 55.5
2 Silat al
Harithiya 69.9 24 Al 'Eizariya 59.7 46 Beit Ula 55.1
3 El Far'a
Camp 67.4 25 Arraba 59.5 47 Tuqu' 54.5
4 'Attil 65 26 Nahhalin 59.3 48 'Anata 54.4
5 Deir al
Ghusun 65 27 Ya'bad 58.4 49 'Awarta 54.2
6 Deir Abu
Da'if 64.7 28
As Sawahira
ash Sharqiya 58.4 50 Za'tara 53.6
7 Birqin 64.6 29 Husan 58.2 51 Shuqba 53.5
8 Meithalun 64.5 30 Tammun 57.7 52 Ash
Shuyukh 53.1
9 Al Yamun 64.1 31 Taffuh 57.7 53 Sa'ir 53
10 Kafr Dan 64.1 32 Sinjil 57.5 54 Biddya 52.7
11 Qabatiya 64.1 33 Huwwara 57.4 55 Kharas 52.3
12 Aqraba 63.5 34 Beit Kahil 56.7 56 Surif 52
13 Halhul 63.2 35 Idhna 56.7 57 Bani Na'im 51.7
14 Bal'a 62.9 36 Qaffin 56.6 58 Tarqumiya 51.5
15 'Asira ash
Shamaliya 62.6 37 Qibya 56.6 59 Al 'Ubeidiya 50.4
16 'Azzun 62.5 38 Beit Fajjar 56.3 60 Jamma'in 50.3
17 Kafr Ra'i 61.7 39 Hizma 56.2 61 Jannatah 49.9
18 Abu Dis 61.7 40 Beita 56.1 62 Kharbatha al
Misbah 48.9
19 Jaba' 61.1 41 Beit Ummar 55.9 63 Deir Samit 48.3
20 As Samu' 61 42 Biddu 55.8 64 Beit 'Awwa 42
21 Beit Liqya 59.9 43 Qabalan 55.7
22 Yatta 59.9 44
Ar Ram &
Dahiyat al
Bareed
55.6

188
7.4 Sensitivity and Certainty Analysis
Weights of the criteria in this research work were identified through
qualitative interview with the intergovernmental agencies that form what so
called the Environmental Assessment Committee. These weights were
subjected to change of time and space due to various socio-economic
political and developmental changes and conditions. In order to conduct
sensitivity and certainty analysis of data related, a specific case, an excel
program relating the assigned criteria, and priorities were developed.
Program output would rearrange priorities according to the changes
occurred in the assigned criteria. Figure 7.1 shows the program structure.
Figure 7.1: Program Structure (Excel Program)
The program consists of four sheets, first rating for each criteria, second
normalized weights sheet which is input data for the program and it is an
adjustable sheet, the third and the fourth sheets are output data of the
program which represent the results.
Rating each
criteria Sheet
Program Structure
(Excel Program)
Normalized weights
Sheet
Evaluation measure
Sheet
Setting
up
priorities
Show the
rating for
each criterion
Adjustable
Show the
normalized
weights
Adjustable
Evaluation
measures for
each
community
based on
rating for each
Arranging
the
communiti
es based
on the

189
7.4.1 Program Implementation (Case Study):
For the sensitivity analysis a fewer alternatives were assumed, with four
main assumptions as follow:
A. Political Solution Occurred: The political conflict will affect the ease
of implementation of sanitation projects. Projects in areas which are
classified as (A and B only can get relatively faster implementation process
than those areas which classified as (C) since they are near settlements
which would delay obtaining permits from the Israeli side. Occurrence of a
political solution thus becomes a political factor without significance.
B. An Increase in Water Consumption: There is a positive relationship
between water consumption (therefore wastewater production) and the
priority of a sewer project. In this alternative the assumption of an increase
in water consumption was taken, by finding new water sources (wells,
additional quantities from Mekerot, seawater desalination plants, brackish
water desalination in Jordan Valley, etc.) then equitable distribution of
water quantities between the localities, thus the water consumption
/wastewater production becomes as a factor without significance.
C. Capacity Building: Sanitation projects need a strong and effective
operation body to manage such projects, due to the sensitivity of sanitation
projects and, high capital cost, operation and maintenance costs and efforts.
In this alternative the assumption that PWA, stakeholders and donors will
conduct capacity building for the municipalities benefiting from projects
and find qualified staffs in municipalities to manage sanitation projects was
taken. Thus this factor of operation body becomes without significance.

190
D. Control of Industrial Wastes: There is an impact of effluents from
industrial operations (stone cutting, olive press, textiles, etc) on the
effectiveness of the sanitation projects specifically on treatment plants. It is
assumed that direct connection of these wastes to the collection system will
not be allowed without a pre-treatment. In this alternative the assumption
that a control of industrial wastes was obtained by enactment of laws and
find mitigation measures to reduce the negative effect of industrial waste to
sanitation projects. Thus this factor of risk from industrial wastes becomes
without significance.
The sensitivity program was run for the selected alternative criteria as listed
in Annex B.
Table 7.13.below shows the setting of priorities for the top ten
communities.
Table 7.13: Setting priorities for the top ten communities according to
four various alternatives
No. of
Setting
priorities for
communities
Alternatives
A B C D
1 Dura Dura Dura Dura
2 Silat al
Harithiya El Far'a Camp El Far'a Camp Qabatiya
3 'Attil Halhul Silat al
Harithiya
Silat al
Harithiya
4 Deir al
Ghusun
Silat al
Harithiya
Deir Abu
Da'if 'Attil
5 'Azzun Meithalun Kafr Dan Deir al Ghusun
6 Abu Dis Yatta 'Attil Al Yamun
7 Aqraba Kafr Dan Deir al
Ghusun El Far'a Camp
8 El Far'a
Camp 'Attil Birqin Halhul
9 Halhul Deir Abu Da'if Meithalun Deir Abu Da'if
10 Bal'a 'Asira ash Aqraba Birqin
191
Shamaliya
The sensitivity program results shows that the setting priorities for
communities are changed when we changed the alternative criteria
(political solution occurred, increase in water consumption, capacity
building, and control of industrial wastes). Therefore PWA and
interested/related stakeholders need to expect future changes in identified
priorities depending on changes in alternative criteria (See Table ).

192
Chapter 8
Conclusione and Recommendayions
8.1 Conclusions
In light of the results, observations and outcomes from research, the
following are the main conclusions:
The current way they are selecting target areas to sanitation projects
are either based on the policies of the donor or on a non-scientific
method. So they do not take all the right criteria to make the right
decision.
Research shows that almost 56% of the population suffers from
problems of wastewater. The 78% believed that sanitation projects
would ease the financial burden resulting from the disposal of
wastewater.
As evidenced by the research, citizens prefer to use sewage networks
to discharge wastewater and they are willing to contribute to the
costs of creating sewage systems at a reasonable cost. Also, as
demonstrated in the research, 8% of citizens support the use of
treated wastewater in agriculture compared to 37% and 48% who
agree but with some preventive measures.
Communities that are expected to have a population of more than
10,000 people in 2030 are 97 communities. There are 33 community
containing sewage systems or in the design or implementation stage.
According to PWA Strategy, a sanitation sector will have been

193
developed in 33 communities and sanitation systems to 64
communities will have been found by 2030.
Multi-criteria decision analysis is an important tool in environmental
decision-making for formalizing and addressing the problem of
competing decision objectives. Characterized the MCDA
undemanding and accuracy method.
The criteria that affect the decision-making process in the sanitation
sector the most are: Demography, Water consumption / Wastewater
production, Reusing wastewater, Environmental factor, Operation
body, Risk of Industrial Waste, Socio-economic factor, Geographical
factor, and Political Issues.
The top ten communities which most need to solve the problem of
sewage, ordered according to importance, are: Dura, Silat al
Harithiya, El Far'a Camp, 'Attil, Deir al Ghusun, Deir Abu Da'if,
Birqin, Meithalun, Al Yamun, Kafr Dan, and Qabatiya
8.2 Recommendations
The recommendations listed herein support the future studies and address
the following issues regarding the management of the sanitation sector:
The Palestinian Water Authority should start to identify target areas
to sanitation projects by taking all the right criteria to make right
decision and oblige donors on it.
We recommend the Palestinian Water Authority use the MCDA
method to Identify the Setting Priorities of the Sanitation Sector in
the West Bank

194
The Palestinian Water Authority should benefit from the
mathematical relationships and MCDA that have been working in
this research in order to set priorities of the sanitation sector.
The Palestinian Water Authority should start to plan to develop
sanitation sectors in 33 communities and find sanitation systems to
64 communities by 2030.
The Palestinian Water Authority should start putting a long-term
plan and a five-year plan that would include serving 20 communities
whose population is of more than 10 thousand people every 5 years.
The Palestinian Water Authority should start preparing feasibility
studies and master plans that contain estimated costs to the
communities whose population is more than 10 thousand people and
do not contain sewage systems.

195
Referances
– Accorsi R, Apostolakis GE, Zio E. 1999a. Prioritizing stakeholder
concerns in environmental risk management. Journal of Risk
Research 2:11–29.
– Accorsi R, Zio E, Apostolakis GE. 1999b. Developing utility
functions for environmental decision-making. Prog Nucl Energy
34:387–411.
– Alawneh, M. and Al-Sa’ed, R. M. (1997). Review on water quality in
Palestine. Groundwater and surface water. Proceedings of the 2nd
Conference on Energy and Environment, An-Najah University,
Nablus, Palestine.
– Al-Rashdan D, Al-Kloub B, Dean A, Al-Shemmeri T. 1999. Theory
and methodology environmental impact assessment and ranking the
environmental projects in Jordan. European Journal of Operational
Research 118:30–45.
– Ananda J, Herath G. 2003. Incorporating stakeholder values into
regional forest planning: A value function approach. Ecological
Economics 45:75–90.
– Apostolakis GE. 2001. Assessment and management of
environmental risks. In: Linkov I, Palma-Oliveira J, editors.
Assessment and management of environmental risks. Boston (MA),
USA: Kluwer. p 211–220.
– Arvai J, Gregory R. 2003. Testing alternative decision approaches for
identifying cleanup priorities at contaminated sites. Environ Sci

196
Technol 37:1469–1476.
– Ary, D., Jacobs, L. C., & Razavieh, A., 1996, Introduction to research
in education. Fort Worth, TX: Harcourt Brace College Publishers.
– Baker D, Bridges D, Hunter R, Johnson G, Krupa J, Murphy J,
Sorenson K. 2001.
– Bardos P, Lewis A, Nortcliff S, Matiotti C, Marot F, Sullivan T. 2002.
CLARINET report: Review of decision support tools for
contaminated land management, and their use in Europe. Vienna:
Austrian Federal Environment Agency.
– Bartlett, J., Kotrlik, J., & Higgins, C., Information Technology,
Learning, and Performance Journal, Vol. 19, No. 1, Spring 2001.
– Bell M, Hobbs BF, Ellis H. 2003. The use of multi-criteria decision-
making methods in the integrated assessment of climate change:
Implications for IA practitioners. Socio-Economic Planning Sciences
37:289–316.
– Belton V, Steward T. 2002. Multiple criteria decision analysis: An
integrated approach. Boston (MA), USA: Kluwer.
– Belton, V. and Stewart, T., 2002. Multiple Criteria Decision
Analysis: An Integrated Approach. Boston, MA: Kluwer Academic
Publishers, Boston/Dordrecht/London.
– Bonano EJ, Apostolakis GE, Salter PF, Ghassemi A, Jennings S. 2000.
Application of risk assessment and decision analysis to the
evaluation, ranking and selection of environmental remediation
alternatives. J Hazard Mater 71:35–57.

197
– Bose U, Davey AM, Olson DL. 1997. Multi-attribute utility methods
in group decision-making: Past applications and potential for
inclusion in GDSS.
– Brown B, Neil-Adger W, Tompkins E, Bacon P, Shim D, Young K.
2001. Trade-off analysis for marine protected area management.
Ecological Economics 37:417–434.
– Consortium for Risk Evaluation with Stakeholder Participation
(CRESP). 1999. Peer review of the U.S. Department of Energy use of
risk in its prioritization process.
– Corporate Project 7 Team. 2003. Assessment report. Corporate project
7: A cleanup program driven by risk-based end states. Washington
DC: U.S. Department of Energy.
– Deschaine LM, Breslau B, Ades MJ, Selg RA, Saaty TL. 1998.
Decision support software to optimize resource allocation: Theory
and case history. Society for Computer Simulation, Simulators
International XV. Boston (MA), USA: Society for Modeling
Simulations. p 139–144.
– Dodgson, John, Michael Spackman Alan Pearman, and Lawrence
Phillips, 2000. Department of Transport, Local Government and the
Regions, (DTLR). ―Multicriteria Analysis Manual.‖ National
Economic Research Associates, London. December, 2000. Available
on line at http://www.communities.gov.uk/index.asp?id=1142253.
Viewed November 18, 2006.
– Doumpos, Michael, 2002. Multicriteria Decision Aid Classification

198
Methods. Kluwer Academic Publishers, Secaucus, NJ.
– Edwards W. 1977. How to use multi-attribute utility measurement
for social decision-making. IEEE (Inst Electr Electron Eng) Trans
Biomed Eng 7:326–340.
– Ehrhardt J, Shershakov VM. 1996. Real-time on-line decision
support systems (RODOS) for off-site emergency management
following a nuclear accident.
– Final Report. Luxemburg: European Commission.
– Florig HK, Morgan MG, Morgan KM, Jenni KE, Fischoff B,
Fischbeck PS, DeKay ML. 2001. A deliberative method for ranking
risks (I): Overview and test bed development. Risk Analysis 21:913–
922.
– Focht W, DeShong T, Wood J, Whitaker K. 1999. A protocol for the
elicitation of stakeholders’ concerns and preferences for
incorporation into policy dialogue.
– Gijzen H.J. (2001a). Aerobes, anaerobes and phototrophs: a winning
team for wastewater management. Water Science and Technology,
44(8): 123-132.
– Gomez-Limon JA, Arriaza M, Riesgo L. 2003. An MCDM analysis of
agricultural risk aversion. European Journal of Operational
Research 151:569–585.
– Gregory R, Failing L. 2002. Using decision analysis to encourage
sound deliberation: Water use planning in British Columbia, Canada.
Journal of Policy Analysis and Management 21:492–499.

199
– Gregory R, Fischhoff B, Thorne S, Butte G. 2003. A multi-channel
stakeholder consultation process for transmissionderegulation.
Energy Policy 31:1291–1299.
– Gregory R, Keeney RL. 1994. Creating policy alternatives using
stakeholder values. Management Science 40:1035–1048.
– Gregory R, McDaniels T, Fields D. 2001. Decision aiding, not dispute
resolution: Creating insights through structured environmental
decisions. Journal of Policy Analysis and Management 20:415–432.
– Gregory R, Wellman K. 2001. Bringing stakeholder values into
environmental policy choices: A community-based estuary case
study. Ecological Economics 39:37–52.
– Grelk B, Kloeber JM, Jackson JA, Deckro RF, Parnell GS. 1998.
Quantifying CERCLA using site decision maker values. Remediation
8:87–105.
– Grelk BJ. 1997. A CERCLA-based decision support system for
environmental remediation strategy selection [thesis]. Colorado
Springs (CO): U.S. Department of the Air Force, Air University, Air
Force Institute of Technology.
– Guidebook to decision-making methods. Washington DC: U.S.
Department of Energy. WSRC-IM-2002-00002.
– Haimes, Yacov Y., 2005. Risk Modeling, Assessment, and
Management. John Wiley & Sons Incorporated, Hoboken, NJ.
– Hamalainen RP, Kettunen E, Ehtamo H. 2001. Evaluating a
framework for multistakeholder decision support in water resources

200
management. Group Decision and Negotiation 10:331–353.
– Hamalainen RP, Lindstedt M, Sinkko K. 2000. Multi-attribute risk
analysis in nuclear emergency management. Risk Analysis 20:455–
468.
– Hartman DH, Goltz MN. 2001. Application of the analytic hierarchy
process to select characterization and risk-based decision-making
and management methods for hazardous waste sites. Environmental
Engineering and Policy 3:1–7.
– Hayashi K. 2000. Multi-criteria analysis for agricultural resource
management: A critical survey and future perspectives. European
Journal of Operational Research 122:486–500.
– Hobbs BF, Meier P. 2000. Energy decisions and the environment: A
guide to the use of multi-criteria methods. Boston (MA), USA:
Kluwer.
– In: Proceedings of the third workshop in the environmental policy and
economics workshop series: Economic research and policy concerning
water use and watershed management.Washington DC:
Environmental Law Institute. p 1–24.
– International Journal of Management Sciences 25:691–706.
– Janssen R. 2001. On the use of multi-criteria analysis in
environmental impact assessment in the Netherlands. Journal of
Multi-Criteria Decision Analysis 10:101–109.
– Janssen, R. (1992). Multiobjective Decision Support for

201
Environmental Management. Dordrecht, Kluwer Academic
Publishers.
– Jenni KE, Merkhofer MW, Williams C. 1995. The rise and fall of a
risk-based priority system: Lessons from DOE’s environmental
restoration priority system. Risk Analysis 15:397–410.
– Joerin F, Musy A. 2000. Land management with GIS and multi-
criteria analysis. International Transactions in Operational Research
7:67–78.
– Kane Driscoll SB, Wickwire WT, Cura JJ, Vorhees DJ, Butler CL,
Moore DW, Bridges TS. 2002. A comparative screening-level
ecological and human health risk assessment for dredged material
management alternatives in New York /New Jersey Harbor.
International Journal of Human and Ecological Risk Assessment
8:603–626.
– Kangas J, Kangas A, Leskinen P, Pykalainen J. 2001. MCDM methods
in strategic planning of forestry on state-owned lands in Finland:
Applications and experiences. Journal of Multi-Criteria Decision
Analysis 10:257–271.
– Keefer D, Kirkwood CW, Corner JL. 2002a. Perspective on decision
analysis applications, 1990–2001. Decision Analysis 1: (online
supplement).
– Keefer D, KirkwoodCW, Corner JL. 2002b. Summary of decision
analysis applications in the operations research literature, 1990–
2001. Tucson (AZ), USA: Technical Report Department of Supply

202
Chain Management, Arizona State University.
– Keisler JM, Sundell RC. 1997. Combining multi-attribute utility and
geographic information for boundary decisions: An application to
park planning. Journal of Geographic Information and Decision
Analysis 1:101–118.
– Kwak SJ, Yoo SH, Kim TY. 2001. A constructive approach to air-
quality valuation in Korea. Ecological Economics 38:327–344.
– Lahdelma, R., P. Salminen, et al. (2000). "Using Multicriteria
Methods in Environmental Planning and Management."
Environmental Management 26(6): 595–605.
– Larichev OI, Olson DI. 2001. Multiple criteria analysis in strategic
siting problems. Boston (MA), USA: Kluwer. Levy J, Hipel K,
Kilgour DM. 2000. Using environmental indicators to quantify the
robustness of policy alternatives to uncertainty. Ecol Model 130:79–
86.
– Linkov I, Sahay S, Seager TP, Kiker G, Bridges T. 2005. Multi-
criteria decision analysis: Framework for applications in remedial
planning for contaminated sediments. In: Proth JM, Levner E,
Linkov I, editors. Strategic management of marine ecosystems.
Amsterdam, The Netherlands: Kluwer.
– Linkov I, Varghese A, Jamil S, Seager TP, Kiker GA, Bridges TS.
2004. Multi-criteria decision analysis: Framework for applications
in remedial planning for contaminated sites. In: Linkov I, Ramadan

203
A, editors. Comparative risk assessment and environmental decision
making. Amsterdam, The Netherlands: Kluwer. p 15–54.
– Linkov, I., F. K. Satterstrom, et al. (2006). "From comparative risk
assessment to multi criteria decision analysis and adaptive
management: Recent developments and applications." Environment
International 32: 1072–1093.
– Linkov, I., Satterstrom, F.K., Kiker, G., Seager, T.P., Bridges. T.,
Gardner, K.H., Rogers, S.H., Belluck, D.A., Meyer, A., 2006.
“Multicriteria Decision Analysis: A Comprehensive Decision
Approach for Management of Contaminated Sediments.” Risk
Analysis, Vol. 26, No. 1.
– Mahmoud N, Zimmo O., Zeeman G., Lettinga G. and Gijzen H (2004).
Perspectives for Integrated Sewage Management in Palestine/ the
Middle East. Water 21.
– Mahmoud N. (2002). Anaerobic pre-treatment of sewage under low
temperature (15oC) conditions in an integrated UASB-digester
system. PhD. Thesis, Wageningen University, The Netherlands.
– Mahmoud N., Amarneh M., Al-Sa’ed R., Zeeman G., Gijzen H. And
Lettinga G. (2003). Sewage characterization as a tool for the
application of anaerobic treatment in Palestine. Environmental
Pollution, 126(1): 115-122.

204
– Males RM. 2002. Beyond expected value: Making decisions under risk
and uncertainty. RMM Technical Services, under contract to
Planning and Management Consultants Ltd. Prepared for U.S. Army
Corps of Engineers, Institute for Water Resources. IWR Report 02-R-
4. www.iwr.usace.army.mil/ iwr/pdf/02r4bey_exp_val.pdf. Accessed
24 December 2012.
– Marttunen M, Hamalainen RP. 1995. Decision analysis interviews in
environmental impact assessment. European Journal of Operational
Research 87:551–563.
– Matsatsinis NF, Samaras AP. 2001. MCDA and preference
disaggregation in group decision support systems. European Journal
of Operational Research 130:414–429.
– McDaniels TL, Gregory RS, Fields D. 1999. Democratizing risk
management: Successful public involvement in local water
management decisions. Risk Analysis 19:497–510.
– McDaniels TL, Roessler C. 1998. Multi-attribute elicitation of
wilderness preservation benefits: A constructive approach.
Ecological Economics 27:299–312.
– McDaniels TL. 1995. Using judgment in resource management: A
multiple objective analysis of a fisheries management decision.
Operations Research 43:415–426.
– Mendoza GA, Anderson AB, Gertner GZ. 2002. Integrating multi-
criteria analysis and GIS for land condition assessment: Part 2—
Allocation of military training areas. Journal of Geographic

205
Information and Decision Analysis 6:17–30.
– Miettinen P, Hamalainen RP. 1997. How to benefit from decision
analysis in environmental life cycle assessment (LCA). European
Journal of Operational Research 102:279–294.
– Morgan MG, Fischhoff B, Bostrom A, Atman C J. 2002. Risk
communication. Boston (MA), USA: Cambridge University Press.
– Morgan MG, Florig HK, DeKay ML, Fischbeck PS. 2000.
Categorizing risks for risk ranking. Risk Analysis 20:49–58.
– National Research Council [NRC]. 1999. New directions in water
resources planning for the U.S. Army Corps of Engineers.
Washington DC: National Academy Press.
– New Brunswick (NJ), USA: CRESP.
– Niemczynowics J. (1997). The water profession and agenda 21. Wat.
Qual. Int. 2: 9-11.
– Palestinian Environmental Law (7), (1999).
– Palestinian National Authority (1999) Environmental Law Number 7.
Palestine Liberation Organization, PNA, Albireh, Palestine.
– Palestinian Water Authority (2003), WasteWater Management Plan.
– Palestinian Water Law (3), 2002.
– Palestinian-Israeli Agreements (2003).
– Parnell GS, Frimpon M, Barnes J, Kloeber JM Jr, Deckro RF, Jackson
JA. 2001.
– Pavlikakis GE, Tsihrintzis VA. 2003. A quantitative method for

206
accounting human opinion, preferences, and perceptions in
ecosystem management. J Environ Manag 68:193–205.
– PCBS, Palestinian Central Bureau for Statistics (2007). Population
census for Palestine, Albireh, West Bank, Palestine
– PECDAR, (2001) Palestinian Water Strategic Planning Study.
– Pereira AG, Quintana SC. 2002. From technocratic to participatory
decision support systems: Responding to the new governance
initiatives. Journal of Geographic Information and Decision Analysis
6:95–107.
– Peterson D, Silsbee D, Schmoldt D. 1994. A case study of resources
management planning with multiple objectives and projects.
Environ Manag 18:729–742.
– Prato T. 2003. Multiple-attribute evaluation of ecosystem
management for the Missouri River system. Ecological Economics
45:297–309.
– PWA data, 2012
– PWA, (2000) National Water Plan.
– Ralston BE, Jackson JA, Kloeber JM Jr, Deckro RF. 1996.
Development of a decision support system for the Department of
Energy selection of waste remediation technologies. Wright Patterson
Air Force Base, USA: Center for Modeling, Simulation, and Analysis.
Technical report 96-02:1–123.
– Ramanathan R. 2001. A note on the use of the analytical hierarchy
process for environmental impact assessment. J Environ Manag

207
63:27–35.
– Rauscher HM, Lloyd FT, Loftis DL, Twery MJ. 2000. A practical
decision-analysis process for forest ecosystem management. Comput
Electron Agric 27:195–226.
– Regan, H. M., F. W. Davis, et al. (2007). "Comprehensive criteria for
biodiversity evaluation in conservation planning." Biodiversity
Conservation 16: 2715–2728.
– Rogers M, Bruen M. 1998. Choosing realistic values of indifference,
preference and veto thresholds for use with environmental criteria
within ELECTRE. European Journal of Operational Research
107:542–551.
– Saaty, & Thomas L. (1996). Mathematics and Multicriteria Decision
Making. Mathematics Awareness week. University of Pittsburgh.
– Safety risk analysis of an innovative environmental technology. Risk
Analysis 21:143–155.
– Schmoldt D, Peterson D, Silsbee D. 1994. Developing inventory and
monitoring programs based on multiple objectives. Environ Manag
18:707–727.
– Schmoldt D, Peterson D. 2001b. Strategic and tactical planning for
managing national park resources. In: Name, editors. The analytical
hierarchy process in natural resource and environmental decision-
making. Amsterdam, The Netherlands: Kluwer. p 67–79.
– Schmoldt DL, Kangas J, Mendoza GA, Pesonen M. 2001. The
analytic hierarchy process in natural resource and environmental

208
decision making. Amsterdam, The Netherlands: Kluwer.
– Schmoldt DL, Peterson DL. 2001a. Efficient group decision making
in workshop settings. In: Name, editors. The analytical hierarchy
process in natural resource and environmental decision-making.
Amsterdam, The Netherlands: Kluwer. P 97–114.
– Seppala J, Basson L, Norris GA. 2002. Decision analysis frameworks
for life-cycle impact assessment. J Ind Ecol 5:45–68.
– Sharifi MA, van den Toorn W, Rico A, Emmanuel M. 2003.
Application of GIS and multicriteria evaluation in locating
sustainable boundary between Tunari National Park and
Cochabamba City (Bolivia). Journal of Multi-Criteria Decision
Analysis 11:151–164.
– Siddiqui M, Everett J, Vieux B. 1996. Landfill siting using
geographic information systems: A demonstration. Journal of
Environmental Engineering 122:515–523.
– Simon M, Pascoe S. 1999. A review of applications of multiple
criteria decisionmaking techniques to fisheries. Marine Resource
Economics 14:41–63.
– Stahl CH, Cimorelli AJ, Chow AH. 2002. A new approach to
environmental decision analysis: Multi-criteria integrated resource
assessment (MIRA). Bulletin of Science, Technology and Society
22:443–459.

209
– Stahl CH. 2003. Multi-criteria integrated resource assessment
(MIRA): A new decision analytic approach to inform
environmental policy analysis [thesis]. Wilmington (DE), USA:
University of Delaware.
– Steiguer JE, Liberti L, Schuler A, Hansen B. 2003. Multi-criteria
decision models for forestry and natural resources management:
An annotated bibliography.
– Store R, Kangas J. 2001. Integrating spatial multi-criteria evaluation
and expert knowledge for GIS-based habitat suitability modeling.
Landsc Urban Plann 55:79–93.
– Timmerman TJ, Kloeber JM Jr, Jackson JA, Deckro RF. 1996.
Selecting remediation technologies through a technical risk index:
An application of multi-attribute utility theory. Wright Patterson Air
Force Base, USA: Center for Modeling, Simulation, and Analysis.
Technical report 96–01.
– Tran L, Knight CG, O’Neill R, Smith E, Ritters K, Wickham J. 2002.
Environmental assessment fuzzy decision analysis for integrated
environmental vulnerability assessment of the mid-atlantic region.
Environ Manag 29:845–859.
– U.S. Army Corps of Engineers (USACE). 1983. The economic and
environmental principles and guidelines for water and related land
resources implementation. Engineering Regulation (ER) 105-2-100.

210
– U.S. Army Corps of Engineers (USACE). 2003a. Environmental
operating principles and implementation guidance. www.hq.usace.
army.mil/CEPA/7%20Environ%20Prin%20web%20site/Page1.html.
Accessed 20 December 2012.
– U.S. Army Corps of Engineers (USACE). 2003b. Planning civil
works projects under the environmental operating principles.
Circular 1105-2-404. www.usace.army.mil/inet/usace-docs/eng-
circulars/ec1105-2-404/entire.pdf. Accessed 18 December 2012.
– U.S. Department of Energy (USDOE). 1998. Guidelines for risk-
based prioritization of DOE Activities. Washington, DC: USDOE.
DOE-DP-STD-3023–98.
– U.S. Department of Energy (USDOE). 2003. Washington, DC:
USDOE-RESRAD Environmental Assessment Division.
http://web.ead.anl.gov/resrad/home2. Accessed 14 December 2012.
– U.S. Environmental Protection Agency (USEPA). 2000. Framework
for responsible environmental decision-making (FRED): Using life
cycle assessment to evaluate preferability of products. Washington,
DC: USEPA. EPA/600/R-00/095.
– U.S. Environmental Protection Agency (USEPA). 2002. Consistency
and transparency in determination of USEPA anticipated ozone
designations. Special Review. Washington, DC: USEPA, Office of
Inspector General. Report 2002-S-00016.
– UNEP/GPA (2000). Strategy options for sewage management to
protect the marine environment. Report produced by IHE-Delft for

211
UNEP/GPA, November 2000. pp102.
– Vaillancourt K, Waaub JP. 2002. Environmental site evaluation of
waste management facilities embedded into EUGENE model: A
multi-criteria approach. European Journal of Operational Research
139:436–448.
– Voogd, H. (1983). Multicriteria Evaluation for Urban Regional
Planning. Great Britain, London.
– Wakeman JS. 2003. Milltown reservoir sediment/Clark Fork River
superfund sitefocused feasibility study.
ww.epa.gov/region8/superfund/sites/mt/milltowncfr/home.html.
Accessed 24 December 2012.
– Washington, DC: U.S. Department of Agriculture, Forest Service.
General technical report NE-307.
– Wastewater Departments in PWA data, 2012
– Whitaker K, Focht W. 2001. Expert modeling of environmental
impacts. OPS Special Issue: Environmental Policy in Oklahoma
10:179–186.
– WHO (1996). Water supply and sanitation sector monitoring. Report
1996: ―Sector status as of 31 December 1994‖. In WHO/EOS/96.15.
Geneva, Switzerland.
– WHO, (2006). Guideline for drinking-water quality. World Health
Organization, Geneva, Switzerland, 1: 52-53.
– Yatsalo, B., G. A. Kiker, et al. (2007). "Application of Multicriteria
Decision Analysis Tools to Two Contaminated Sediment Case

212
Studies." Integrated Environmental Assessment and Management 3(2):
223–233.
– Yoe C. 2002. Trade-off analysis planning and procedures guidebook.
http://www.iwr.usace.army.mil/iwr/pdf/tradeoff.pdf. Accessed 24
December 2012.

213
ANNEX

214
ANNEX A
CITIZENS QUESTIONNAIRE

215
الرحيمبسم هللا الرحمن
اؿزج١ب ػ اط١ دي ضع ا١ب اؼبصخ اوغف اوذ ف اضفخ اغغث١خ
ف ضؿخ ا١ب اج١ئخ جبؼخ اجبح ثؼ عؿبخ بجـز١غ ذوي ػ كبصح ابجـز١غ( ثغاء جغاعػ)٠م اجبدش
زذض٠ض ( MCDA)رذ١ امغاعاد زؼضصح اؼب١٠غ )بخ اط١خ ثبزؼب غ ؿطخ ا١ب افـط١١خ، د١ش رزض اغؿ
ثئكغاف اضوزع غا دضاص، ػ أ أ رـب ظا اغؿبخ ف ( أ٠بد ضغ لطبع اوغف اوذ ف اضفخ اغغث١خ
١ب ثى صلخ د رشف١ف لبو ا١ب اؼبصخ ف فـط١، ظا ز اإلجبثخ ػ ج١غ األؿئخ از ؿزطغح ف ظا االؿزج
.ى جؼ٠ الىغ
طوغ : اجؾ. 3........................... ىب اـى . 2:.............. اؼغ. 1
أض
: ػضص أفغاص األؿغح از رؼ١ق ف١ب. 5أسغ زؼط أػؼة : اذبخ االجزبػ١خ. 4
......................
كبصاد و١خ أ جبؼخ إػضاص صب رؼ١ اثزضائ أ :اذبخ ازؼ١١خ. 6
ػ١ب
عثخ ث١ذ ظف اؼعاػخ اوبػخ اذغف ط ػ اؼ ػب : اؼ. 7
غ١غ طه
ج١ض زؿظ ؿ١ئ :اضغ االلزوبص ؼبئخ. 8
ؼبعى ال عأ افك افك جضا األؿئخ اغلؼبعى
ثلضح
انحور األول: انوضغ انائي
1.1 ا١ب همضاع ا١ب ازبدخ
ىوبف١خ ىبفخ اؿزشضابر
1.2
مضاع ا١ب اشووخ أج
اإلؿزشضا اؼ وبف١خ رـض
برىدبج
1.3 مضاع ا١ب اشووخ أج
اؼعاػخ وبف١خ
1.4
مضاع ا١ب اشووخ أج
اإلؿزشضابد اوبػ١خ ازجبع٠خ
وبف١خ
1.5 أذ عاى ػ سضبد ا١ب امضخ
ه
3 ---------------ف الزبء 3 ---------------١ب ف او١ف ثلى رمغ٠ج مضاع إؿزالن 1.6

216
.)ى كغ(
1.7
ا١ب ازبدخ ه وبصعب الدظبرى ػ
.......................................................................................................:.دب١ب
...........................................................................................................................
.................................................
رضا انواطنينو انحور انثاني: انوضغ انحاني نهياه انؼادية
2.1 رم ثزوغ٠ف ا١ب اؼبصخ ف
كجىبد اوغف اوذ
2.2 أذ عاى ػ سضبد اوغف
اوذ امضخ ه
2.3 ف ج١ض اوغف اوذ لطبع
طمزه
2.4 رشضغ ػ١بد ازشن ا١ب
اؼبصخ أل ع اغلبثخ
2.5
اؼبصخ از رم ا١بب الدظبرى ػ ػ١بد روغ٠ف
............................................................................ثبؿزشضاب:.
...........................................................................................................................
.................................................
آثر انياه انؼادية ػهى انواطنين: انحور انثانث
3.1 اؼبصخ ؿجك أ رضغعد ا١ب
ثلى جبكغ
3.2 رؼب ا١ب اؼبصخ امبصخ
اـزطبد اإلؿغائ١١خ
3.3
رؼزمض أ ػ١خ ازشن ا١ب
اؼبصخ ثؼض رفغ٠غ اذفغ االزوبه١خ
أ كجىبد اوغف اوذ رز
ثلى هذ١خ
3.4 ٠ز ازشن ا١ب اؼبصخ ثبمغة
ف طمزه اغاػ
3.5 ٠ز ازشن ا١ب اؼبصخ ثبمغة
ف طمزه األكجبع اجبربد
3.6
رس ١ب الغة. : اجبع() رؼب ب ثـجت ا١ب اؼبصخأ البو ازب١خ
. دلغاد ضبعح . عائخ وغ٠خ ازلبع األغاى سوهب اؼ٠خ ب.
غ١غ . ال ٠جض لبو ف١ضب ا١ب اؼبصخ جغ٠بب ف الاعع. . فئغا جغطا
طه: ..................................
3.7
و١ف رغ ضغ طمزى اوذ بد١خ لىخ ا١ب
..........................................................................................:.اؼبصخ
...........................................................................................................................
.................................................
اننواحي االقتصادية واالجتاػية: انحور انرابغ
4.1 رىفخ ازغ اىؼت ا١ب ف
ج١ض طمزه
4.2 ٠جض ص٠ زغاوخ ػ١ه ز١جخ
رؼ٠ضن ثب١ب
4.3 رىفخ رشوه ا١ب اؼبصخ ف
ج١ضح طمزه
4.4 ٠جض ص٠ زغاوخ ػ١ه ز١جخ
رشوه ا١ب اؼبصخ
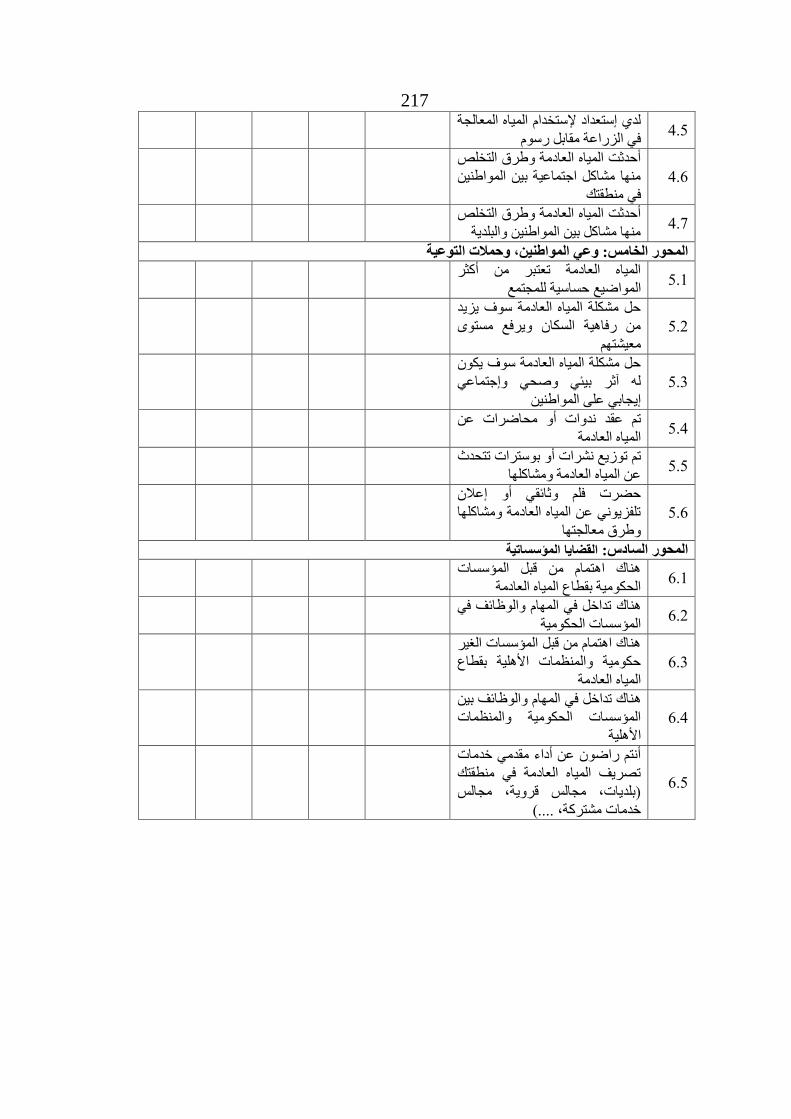
217
4.5 ض إؿزؼضاص إلؿزشضا ا١ب اؼبجخ
ف اؼعاػخ مبث عؿ
4.6
أدضصذ ا١ب اؼبصخ طغق ازشن
ب لبو اجزبػ١خ ث١ ااط١
ف طمزه
4.7 أدضصذ ا١ب اؼبصخ طغق ازشن
ب لبو ث١ ااط١ اجض٠خ
وػي انواطنين، وحالت انتوػية: انحور انخايس
5.1 ا١ب اؼبصخ رؼزجغ أوضغ
دـبؿ١خ جزغااض١غ
5.2
د لىخ ا١ب اؼبصخ ؿف ٠ؼ٠ض
عفب١خ اـىب ٠غفغ ـز
ؼ١لز
5.3
د لىخ ا١ب اؼبصخ ؿف ٠ى
آصغ ث١ئ هذ إجزبػ
إ٠جبث ػ ااط١
5.4 ضاد أ ذبضغاد ػ ر ػمض
ا١ب اؼبصخ
5.5 رزذضس ادأ ثؿزغ ادلغر رػ٠غ
ػ ا١ب اؼبصخ لبوب
5.6
دضغد ف صبئم أ إػال
رفؼ٠ ػ ا١ب اؼبصخ لبوب
طغق ؼبجزب
القضايا المؤسساتية: انحور انسادس
6.1 بن ازب لج اؤؿـبد
اذى١خ ثمطبع ا١ب اؼبصخ
6.2 رضاس ف اب اظبئف ف بن
اؤؿـبد اذى١خ
6.3
بن ازب لج اؤؿـبد اغ١غ
دى١خ اظبد األ١خ ثمطبع
ا١ب اؼبصخ
6.4
بن رضاس ف اب اظبئف ث١
اؤؿـبد اذى١خ اظبد
األ١خ
6.5
أز عاض ػ أصاء مض سضبد
روغ٠ف ا١ب اؼبصخ ف طمزه
)ثض٠بد، جبؾ لغ٠خ، جبؾ
سضبد لزغوخ، ....(

218
المحور السابع: المشاركة باتخاذ القرارات
طرق تصريف المياه العادمة ومعالجتها وإعادة استخدامها: ( أ
دفغ ازوبه١خ كجىبد هغف هذ فض ذ لىخ ا١ب اؼبصخ: رأ األع ازب١خ
غ١غ طه: بجخ ؼ١خ ذطبد ؼ
..............................................................................................................................
أ كجىبد ـزمخ زوغ٠فب. غ كجىبد اوغف اوذ. :بع رؤ٠ض روغ٠ف ١ب األط
ال أػ. ال ٠ز روغ٠فب.
:أافك أافك ثلضح ب عأ٠ه ف ػ١خ إػبصح اؿزشضا ا١ب اؼبصخ ف اؼعاػخ ثؼض ؼبجزب
طه أػبعى
.......................................................................................................................................
...........................
التكاليف: ( ب
اؼبئخ ـزؼضح ـبخ ف د لىخ ا١ب اؼبصخ )رىفخ إلبء كجىبد هغف هذ ذطبد
ال، طه ثـجت ؼ، مضاع اـبخ: ................... ؼبجخ(
.................................................................
:اؼبئخ ـزؼضح ـبخ ف صفغ وفخ او١بخ ازلغ١ لجىبد اوغف اوذ ذطبد اؼبجخ
ال، طه ثـجت ؼ، مضاع اـبخ: ........................ / كغ
.................................................................
أفض اطغق از ٠ى إرجبػب أج رغط١خ رىب١ف رلغ١ كجىبد ذطبد اوغف اوذ: ب
...............................
.......................................................................................................................................
...........................

219
إدارة قطاع المياه العادمة: ( ج
:ؿطخ جصح اج١ئخ ؿطخ ا١ب أ ا٢ر رفض أ ٠م ثئصاعح لطبع اوغف اوذ
خ اػاعاد، بطا:جخ لزغو ػاعح اوذخ ػاعح اذى اذ
......................................................................................
.......................................................................................................................................
...........................
اجبؾ امغ٠خ اجض٠بد سضبد روغ٠ف ا١ب اؼبصخ: ٠مضثزأ ا٢ر رفض أ ٠م
ؿطخ جصح اج١ئخ ؿطخ ا١ب كغوبد امطبع اشبم جبؾ سضبد لزغوخ
جخ ذ١خ، بطا: ..... ػاعح اذى اذ
.......................................................................................................................................
...........................
ألع اإلجغاءاد از رفض إرجبػب ػض إصاعح ا١ب اؼبصخ: ب ا
.........................................................................
.......................................................................................................................................
...........................
اقتراحات: ( د
بد١خ إصاع٠خ رظ١١خ الزغادبد رذج أ رؤسظ ثؼ١ االػزجبع ذ لىخ ا١ب اؼبصخ
...............................................
.......................................................................................................................................
...........................
الزغادبد رذج أ رؤسظ ثؼ١ االػزجبع ذ لىخ ا١ب اؼبصخ ف فـط١ ثلى ػب
....................................................
.......................................................................................................................................
...........................

220
ANNEX B
EQA TERMS OF REFERENCE (TOR)

221

222

223

224

225

226

227

228

229

230

231
ANNEX C
POPULATION PROJECTION

232
Locality
Nam
e
Locality
code
Male
Fem
ale
Total
No. o
f Housin
g
Units
No. o
f Build
ings
No. o
f
Estab
lishm
ents
Averag
e Size
of H
ouseh
old
No. o
f
Househ
old
s
جغؿ از
ا
Actu
al
Populatio
n 2
007
Actu
al
Populatio
n 1
997
Com
men
t No.*
Actu
al Gro
wth
-Rate
(2007-1
997)
Actu
al Gro
wth
-Rate
(2007-1
997)
Pro
jected
Populatio
n 2
010
Pro
jected
Populatio
n 2
020
Pro
jected
Populatio
n 2
030
Jenin Gov.
Zububa 10005 958 976 1,93
4 1,564 1,934 ػثث 359 5.4 62 406 425
2.15 2.15 2,061 2,549 3,152
Rumma
na 10010
1,61
2
1,52
8
3,14
0 بخ 596 5.3 68 579 642 2,483 3,140 ع
2.38 2.38 3,369 4,261 5,388
Ti'innik 10015 477 523 1,00
0 806 1,000 رؼه 178 5.6 23 192 216
2.18 2.18 1,067 1,324 1,642
At
Tayba 10020
1,11
1
1,04
4
2,15
5 1,757 2,155 اط١جخ 416 5.2 72 477 487
2.06 2.06 2,291 2,810 3,447
Arabbu
na خ 160 5.1 40 168 186 810 400 410 10025 630 810 ػغث
2.54 2.54 873 1,123 1,444
Al
Jalama 10030
1,03
4
1,02
6
2,06
0 خ 413 5 84 402 490 1,697 2,060 اج
1.96 1.96 2,183 2,650 3,217
Silat al
Harithi
ya
10035 4,87
7
4,54
5
9,42
2
1,86
7 1,600 244 5.6 1,669
ؿ١خ
اذبعص١خ9,422 7,246
2.66 2.66 10,194 13,256 17,236
As
Sa'aida ؼب٠ضح 13 5.4 5 21 14 70 38 32 10040 ـ 94 70 ا
-2.90 0.50 71 75 79
'Anin 10045 1,93
4
1,75
7
3,69
1 2,739 3,691 ػب١ 658 5.6 93 565 793
3.03 3.03 4,037 5,440 7,330

233
'Arrana 10050 1,03
7 959
1,99
6 اخ 367 5.4 70 397 415 1,579 1,996 ػغ
2.37 2.37 2,141 2,707 3,422
Deir
Ghazal
a
10055 456 439 895 203 175 51 5.1 177 ص٠غ
غؼاخ895 629
3.59 3.59 995 1,416 2,014
Faqqu'a 10060 1,77
2
1,69
5
3,46
7 ػخ 689 5 145 716 753 6,517 4,953 3,764 2.78 2.78 1 2,635 3,467 فم
Khirbet
Suruj 10070 32 24 56 9 19 9 6.2 9
سغثخ
ؿغط56 35
4.81 4.81 64 103 165
Al
Yamun 10080
8,30
2
8,08
1
16,3
83
3,50
1 2,672 485 5.5 2,965 ا١ب
16,38
3
12,25
5 2.95 2.95 17,874 23,894 31,943
Umm
ar
Rihan
10085 197 173 370 76 66 3 5.7 65 أ
اغ٠ذب370 275
3.01 3.01 404 544 732
Kafr
Dan 10095
2,65
1
2,49
7
5,14
8
1,08
7 3,766 5,148 وفغ صا 981 5.2 188 1,048
3.18 3.18 5,654 7,729 10,565
Khirbet
'Abdall
ah al
Yunis
10105 84 54 138 32 40 1 4.2 33
سغثخ
ػجض هللا
ا١ؾ
138 104
2.87 2.87 150 199 264
Dhaher
al
Malih
10115 115 83 198 40 45 14 5 40 ظغ
ابخ198 160
2.15 2.15 211 261 323
Barta'a
ash
Sharqiy
a
10120 2,19
7
1,97
9
4,17
6 873 894 440 5.1 817
ثغطؼخ
الغل١خ4,176 2,814 2 4.03 4.03 4,701 6,976 10,353
Al
'Araqa 10125
1,12
9
1,03
2
2,16
1 1,564 2,161 اؼغلخ 367 5.9 70 387 431
3.29 3.29 2,381 3,290 4,546
Al 10135 18 14 32 5 3 0 6.4 5 اج١ال 32 27
1.71 1.71 34 40 47

234
Jameela
t
د
Beit
Qad 10140 731 716
1,44
7 3,424 2,355 1,619 3.82 3.82 3 995 1,447 ث١ذ لبص 265 5.5 71 308 296
Tura al
Gharbi
ya
10145 491 427 918 245 272 60 4.7 197 طعح
اغغث١خ918 817
1.17 1.17 951 1,068 1,200
Tura
ash
Sharqiy
a
10150 84 90 174 37 43 14 5 35 طعح
الغل١خ174 133
2.72 2.72 189 247 323
Al
Hashim
iya
10155 519 532 1,05
1 696 1,051 ابك١خ 186 5.7 17 202 205
4.21 4.21 1,189 1,796 2,712
Nazlat
ash
Sheikh
Zeid
10165 371 333 704 164 135 24 5.9 119
ؼخ
ال١ز
ػ٠ض
704 537
2.74 2.74 764 1,001 1,312
At
Tarem 293 369 اطغ 70 5.3 10 78 83 369 185 184 10170
2.33 2.33 395 498 627
Khirbet
al
Muntar
al
Gharbi
ya
10175 11 11 22 6 6 2 3.7 6
سغثخ
اطبع
اغغث١خ
22 25
-1.27 0.50 22 23 25
Jenin 10180 19,7
66
19,2
38
39,0
04
9,21
5 5,392
3,1
00 ج١ 7,609 5.1
39,00
4
27,77
5 4 3.45 3.45 43,186 60,646 85,164
Jenin
Camp 10185
5,10
4
5,26
7
10,3
71
2,31
8 1,196 262 5.1 2,039
ش١
ج١
10,37
1 8,991
1.44 1.44 10,825 12,486 14,403

235
Jalbun 10190 1,22
5
1,16
5
2,39
0 1,836 2,390 جج 463 5.2 157 500 523
2.67 2.67 2,587 3,367 4,383
'Aba 10195 105 99 204 37 36 7 5.7 36 122 204 ػبثب
5.28 5.28 238 398 666
Khirbet
Mas'ud 10200 26 21 47 14 11 0 4.3 11
سغثخ
ـؼص
)ػغاق
اضاع(
47 46
0.22 0.22 47 48 49
Khirbet
al
Muntar
ash
Sharqiy
a
10205 3 4 7 9 5 2 3.5 2
سغثخ
اطبع
الغل١خ
7 13
-6.00 0.50 7 7 8
Kafr
Qud 10210 531 612
1,14
3 2,712 1,863 1,279 3.83 3.83 5 785 1,143 وفغ لص 215 5.3 49 211 239
Deir
Abu
Da'if
10215 2,77
7
2,79
5
5,57
2
1,05
0 1,101 338 6 935
ص٠غ أث
ضؼ١ف5,572 3,897
3.64 3.64 6,203 8,869 12,681
Birqin 10220 2,86
3
2,82
2
5,68
5
1,25
9 4,344 5,685 ثغل١ 1,115 5.1 271 1,001
2.73 2.73 6,163 8,065 10,555
Umm
Dar 429 557 أ صاع 108 5.2 41 138 115 557 280 277 10225
2.65 2.65 602 782 1,015
Al
Khuljan 358 509 اشجب 88 5.8 45 113 99 509 250 259 10230
3.58 3.58 566 804 1,144
Wad ad
Dabi' 10235 213 198 411 72 71 3 6 69
اص
اضجغ411 272
4.21 4.21 465 703 1,062
Dhaher
al
'Abed
10240 189 174 363 67 71 5 5.6 65 ظغ
اؼجض363 273
2.89 2.89 395 526 699
Zabda 10245 487 457 944 194 174 14 5.1 184 1,812 1,365 1,028 2.88 2.88 6 711 944 ػثضح

236
Ya'bad 10265 6,86
1
6,77
9
13,6
40
3,01
7 ٠ؼجض 2,486 5.5 499 2,284
13,64
0
10,62
5 2.53 2.53 14,701 18,873 24,229
Kufeirit 10275 1,24
8
1,15
8
2,40
6 1,801 2,406 وف١غد 433 5.6 84 409 528
2.94 2.94 2,624 3,506 4,684
Imreiha 10285 199 224 423 87 94 13 5 85 314 423 إغ٠ذخ
3.02 3.02 463 623 839
Umm
at Tut 738 989 أ ازد 169 5.9 35 182 195 989 494 495 10295
2.97 2.97 1,080 1,447 1,939
Ash
Shuhad
a
10300 865 883 1,74
8 1,280 1,748 الضاء 319 5.5 92 344 363
3.17 3.17 1,919 2,621 3,579
Jalqam
us 10305
1,00
1 991
1,99
2 1,375 1,992 جمؽ 343 5.8 74 362 391
3.78 3.78 2,226 3,225 4,673
Al
Mugha
yyir
10310 1,23
0
1,19
0
2,42
0 1,649 2,420 اغ١غ 404 6 58 393 478
3.91 3.91 2,715 3,985 5,848
Al
Mutilla 193 295 اطخ 57 5.2 12 57 57 295 147 148 10315
4.33 4.33 335 512 783
Bir al
Basha 10320 692 615
1,30
7 260 232 14 6 217
ث١غ
اجبكب1,307 962
3.11 3.11 1,433 1,947 2,645
Al
Hafira 10335 30 28 58 15 13 0 4.5 13
اذف١غح
)دف١غح
ػغاث(
58 57
0.17 0.17 58 59 60
Qabatiy
a 10340
9,73
9
9,45
8
19,1
97
3,90
5 لجبط١خ 3,495 5.5 679 3,393
19,19
7
14,52
4 7 2.83 2.83 20,873 27,588 36,465
Arraba 10370 4,96
6
4,95
4
9,92
0
2,06
6 18,452 14,088 10,756 2.74 2.74 8 7,574 9,920 ػغاثخ 1,811 5.5 407 1,669
Telfit 10385 119 119 238 74 41 32 4.1 58 1,128 573 292 7.00 7.00 9 121 238 رف١ذ
Mirka 10395 825 786 1,61
1 1,145 1,611 غوخ 284 5.7 52 251 288
3.47 3.47 1,785 2,511 3,533
Wadi 10400 63 60 123 21 26 2 7.2 17 اص 123 87
3.52 3.52 136 193 273

237
Du'oq صػق
Fahma
al
Jadida
10401 179 190 369 71 77 8 5.7 65 فذخ
اجض٠ضح369 258
3.64 3.64 411 588 840
Raba 10405 1,57
9
1,56
6
3,14
5 2,270 3,145 عاثب 548 5.7 140 558 598
1
0 3.31 3.31 3,468 4,805 6,657
Al
Mansur
a
10410 94 79 173 31 36 1 6 29 او
عح173 111
4.54 4.54 198 308 480
Misliya 10415 1,23
2
1,15
6
2,38
8 1,658 2,388 ـ١خ 440 5.4 79 429 491
3.72 3.72 2,664 3,837 5,527
Al
Jarba 54 63 اجغثب 13 4.8 10 19 15 63 30 33 10430
1.55 1.55 66 77 90
Az
Zababi
da
10435 1,89
1
1,77
4
3,66
5
1,31
0 2,844 3,665 اؼثبثضح 826 4.4 268 844
2.57 2.57 3,955 5,096 6,568
Fahma 10445 1,28
5
1,20
1
2,48
6 1,796 2,486 فذخ 432 5.8 66 451 440
3.30 3.30 2,741 3,794 5,251
Az
Zawiya 517 770 اؼا٠خ 111 6.9 15 140 136 770 366 404 10460
4.06 4.06 868 1,292 1,925
Kafr
Ra'i 10465
3,70
4
3,66
0
7,36
4
1,55
9 1,296 228 5.3 1,385
وفغ
عاػ7,364 5,758
2.49 2.49 7,928 10,139 12,967
Al
Kufeir 48 43 اىف١غ 8 5.4 2 22 20 43 22 21 10485
-1.09 0.50 44 46 48
Sir 10495 377 367 744 179 192 22 5.4 137 585 744 ه١غ 1
1 2.43 2.43 800 1,017 1,293
'Ajja 10500 2,58
3
2,47
2
5,05
5 3,790 5,055 ػجخ 897 5.6 178 875 998
2.92 2.92 5,511 7,351 9,804
'Anza 10505 941 932 1,87
3 1,477 1,873 ػؼح 395 4.7 53 476 499
2.40 2.40 2,011 2,551 3,234

238
Sanur 10510 2,07
4
1,99
3
4,06
7 3,139 4,067 هبع 698 5.8 119 735 832
2.62 2.62 4,396 5,695 7,379
Ar
Rama 664 964 اغاخ 172 5.6 14 181 206 964 468 496 10515
3.80 3.80 1,078 1,565 2,272
Meithal
un 10520
3,59
6
3,35
9
6,95
5
1,43
2 5,159 6,955 ١ض 1,258 5.5 249 1,258
3.03 3.03 7,607 10,255 13,825
Al
Judeida 10565
2,37
7
2,36
1
4,73
8
1,01
7 3,592 4,738 اجض٠ضح 923 5.1 157 953
2.81 2.81 5,148 6,791 8,958
al
'Asa'asa 10585 232 232 464 62 57 7 7.3 64
اؼوبػ
هخ464 343
3.07 3.07 508 687 930
Al
'Attara 10590 608 551
1,15
9 790 1,159 اؼطبعح 199 5.8 36 228 228
3.91 3.91 1,300 1,908 2,799
Siris 10600 2,49
3
2,39
3
4,88
6 3,714 4,886 ؿ١غ٠ؾ 812 6 123 800 939
2.78 2.78 5,305 6,979 9,181
Jaba' 10605 4,31
1
4,18
1
8,49
2
1,76
4 6,409 8,492 ججغ 1,498 5.7 293 1,485
2.85 2.85 9,240 12,243 16,222
Al
Fandaq
umiya
10615 1,74
9
1,65
2
3,40
1 689 556 88 5.7 596
افضل
٠خ3,401 2,476
3.23 3.23 3,741 5,138 7,058
Silat
adh
Dhahr
10625 2,93
7
2,85
7
5,79
4
1,22
3 996 265 6.1 946
ؿ١خ
اظغ5,794 4,609
2.31 2.31 6,206 7,801 9,807
Total
Jenin
Gov.
130,
328
126,
291
256,
619
55,2
76
44,35
0
11,
133 5
47,43
7
يجوع
يحافظة
جنين
256,6
19
192,7
13 3.01 279,832 374,234 502,050
Tubas Gov.
Bardala 50420 816 821 1,63
7 1,139 1,637 ثغصخ 271 6 17 261 286
3.69 3.69 1,825 2,623 3,770
'Ein el
Beida 50450 599 564
1,16
3 205 185 17 5.9 197
ػ١
اج١ضب1,163 781
4.06 4.06 1,311 1,952 2,906

239
Kardala 50455 166 141 307 52 39 3 6.3 49 210 307 وغصخ 1
2 3.87 3.87 344 503 735
Ibziq 50490 108 103 211 37 36 1 6.6 32 43 211 إثؼ٠ك
17.2
4
17.2
4 340 1,669 8,188
Salhab 50525 24 21 45 8 8 6 9 5 53 45 ؿذت
-1.62 0.50 46 48 50
'Aqqab
a 50535
3,42
6
3,12
2
6,54
8
1,20
7 4,385 6,548 ػمبث 1,127 5.8 193 1,033
4.09 4.09 7,385 11,028 16,468
Tayasir 50550 1,30
0
1,18
9
2,48
9 1,731 2,489 ر١بؿ١غ 467 5.3 49 420 496
3.70 3.70 2,776 3,991 5,739
Al
Farisiya 154 151 افبعؿ١خ 29 5.2 0 28 28 151 70 81 50551
-0.20 0.50 153 161 169
Al
'Aqaba 85 104 اؼمجخ 23 4.5 5 27 20 104 50 54 50560
2.04 2.04 110 135 165
Ath
Thaghr
a
187 546 اضغغح 100 5.5 16 121 126 546 261 285 50575
11.3
1
11.3
1 753 2,199 6,419
Al
Malih 149 370 ابخ 58 6.4 0 57 57 370 180 190 50580
9.52 9.52 486 1,207 2,997
Tubas 50610 8,13
5
8,01
9
16,1
54
3,50
8 طثبؽ 2,933 5.5 699 2,657
16,15
4
11,61
7 3.35 3.35 17,833 24,798 34,483
Kashda 50650 34 37 71 10 12 5 8.9 8 29 71 ولضح
9.37 9.37 93 227 557
Khirbet
Yarza 50656 22 17 39 13 13 5 4.9 8
سغثخ
٠غػح39 23
5.42 5.42 46 77 131
Ras al
Far'a 50670 360 346 706 140 109 24 5.6 125
عاؽ
افبعػخ706 506
3.39 3.39 780 1,089 1,519
El Far'a
Camp 50700
2,85
6
2,85
6
5,71
2
1,14
8 706 162 5.5 1,048
ش١
افبعػخ5,712 4,152
3.24 3.24 6,286 8,647 11,896
Khirbet
ar Ras
al
50720 110 69 179 30 30 0 5.1 35
سغثخ
اغاؽ
األدغ
179 62
11.1
8
11.1
8 246 710 2,051

240
Ahmar
Wadi al
Far'a 50740
1,41
0
1,32
0
2,73
0 516 553 119 5.8 474
اص
افبعػخ2,730 1,691
4.91 4.91 3,152 5,088 8,215
Tammu
n 50755
5,40
2
5,39
3
10,7
95
2,23
5 ط 1,965 5.5 329 1,911
10,79
5 7,540
3.65 3.65 12,022 17,212 24,642
Khirbet
'Atuf 50790 91 80 171 34 37 20 6.1 28
سغثخ
ػبطف171 76
8.45 8.45 218 491 1,104
Khirbet
Humsa 50871 64 69 133 22 22 0 6 22
سغثخ
دوخ133 149
1
3 -1.13 0.50 135 142 149
Total
Tubas
Gov.
25,5
33
24,7
28
50,2
61
10,1
78 8,265
1,6
70 5.6 9,004
يجوع
يحافظة
طوباس
50,26
1
34,76
2 3.76 6.25 56,340 83,997 132,355
Tulkarem Gov.
Akkaba 10025
0 192 254 ػىبثخ 41 6.2 18 69 46 254 131 123
2.84 2.84 276 365 483
Qaffin 10029
0
4,34
5
4,04
2
8,38
7
1,78
3 6,440 8,387 لف١ 1,587 5.3 236 1,474
2.68 2.68 9,079 11,823 15,398
Nazlat
'Isa
10033
0
1,20
8
1,12
6
2,33
4 482 431 50 5.3 440
ؼخ
ػ١ـ2,334 1,844
2.38 2.38 2,505 3,171 4,013
An
Nazla
ash
Sharqiy
a
10034
5 803 711
1,51
4 313 263 23 5.5 277
اؼخ
الغل١خ1,514 1,214
2.23 2.23 1,618 2,017 2,516
Baqa
ash
Sharqiy
a
10035
0
2,10
3
1,99
8
4,10
1 923 768 144 5.4 762
ثبلخ
الغل١خ4,101 3,159
1
4 2.64 2.64 4,435 5,757 7,474
An
Nazla
10035
5 174 166 340 81 82 12 4.6 74
اؼخ
اؿط340 306
1.06 1.06 351 390 433

241
al
Wusta
An
Nazla
al
Gharbi
ya
10038
0 484 453 937 177 187 17 6 156
اؼخ
اغغث١خ937 652
3.69 3.69 1,045 1,501 2,158
Zeita 10042
5
1,38
2
1,47
0
2,85
2 2,315 2,852 ػ٠زب 560 5.1 86 506 630
2.11 2.11 3,036 3,740 4,608
Seida 10044
0
1,52
3
1,40
6
2,92
9 2,267 2,929 ه١ضا 568 5.2 79 601 624
2.60 2.60 3,163 4,087 5,280
'Illar 10047
5
3,15
5
3,03
5
6,19
0
1,36
2 5,068 6,190 ػالع 1,142 5.4 173 1,198
2.02 2.02 6,573 8,028 9,805
'Attil 10048
0
4,58
7
4,45
1
9,03
8
2,00
8 7,661 9,038 ػز١ 1,720 5.3 373 1,672
1.67 1.67 9,497 11,205 13,218
Deir al
Ghusun
10053
0
4,19
8
4,04
4
8,24
2
1,77
2 1,313 237 5.2 1,578
ص٠غ
اغو8,242 6,969
1.69 1.69 8,667 10,251 12,123
Al
Jarushi
ya
10054
5 462 470 932 213 191 33 5.1 183
اجبع
ك١خ932 668
3.39 3.39 1,030 1,437 2,005
Al
Masquf
a
10055
5 124 136 260 52 50 5 5.5 47
اـم
فخ260 156
5.24 5.24 303 505 842
Bal'a 10057
0
3,35
2
3,25
2
6,60
4
1,40
4 5,373 6,604 ثؼب 1,202 5.5 262 1,375
2.08 2.08 7,026 8,635 10,614
Iktaba 10059
5
1,38
9
1,27
6
2,66
5 1,456 2,665 إوزبثب 463 5.8 49 551 490
6.23 6.23 3,195 5,848 10,704
Nur
Shams
Camp
10062
0
3,28
2
3,19
7
6,47
9
1,33
6 761 179 5.3 1,216
ش١
ع
كؾ
6,479 5,814
1.09 1.09 6,693 7,458 8,312

242
Tulkar
m
Camp
10063
5
5,28
5
5,35
6
10,6
41
2,09
7 1,146 245 5.4 1,962
ش١
طىغ
10,64
1 9,948
0.68 0.68 10,858 11,615 12,424
Tulkar
m
10064
5
25,8
17
25,4
83
51,3
00
12,2
37 7,143
2,9
21 طىغ 9,877 5.2
51,30
0
39,97
7
1
5 2.53 2.53 55,285 70,944 91,038
Anabta 10066
5
3,62
5
3,70
4
7,32
9
1,78
8 6,032 7,329 ػجزب 1,440 5.1 274 1,460
1
6 1.97 1.97 7,770 9,441 11,471
Kafr al
Labad
10069
0
2,06
3
2,01
1
4,07
4 3,076 4,074 وفغ اجض 693 5.9 99 747 757
1
7 2.85 2.85 4,432 5,870 7,775
Kafa 10071
0 257 404 وفب 75 5.4 7 77 87 404 186 218
4.63 4.63 463 727 1,143
Al
Haffasi
10071
5 76 81 157 31 32 3 5.8 27
اذفبه
157 118
2.90 2.90 171 228 303
Ramin 10073
0 889 917
1,80
6 1,547 1,806 عا١ 353 5.1 42 369 390
1.56 1.56 1,892 2,209 2,578
Far'un 10073
5
1,54
9
1,55
1
3,10
0 2,351 3,100 فغػ 633 4.9 83 507 752
2.80 2.80 3,368 4,441 5,856
Shufa 10076
0
1,14
1
1,05
3
2,19
4 1,650 2,194 كفخ 400 5.5 97 465 475
1
8 2.89 2.89 2,390 3,178 4,225
Khirbet
Jubara
10078
0 143 150 293 67 64 12 4.7 63
سغثخ
ججبعح293 241
1.97 1.97 311 378 459
Saffarin 10079
5 764 760 ؿفبع٠ 136 5.6 16 149 153 760 383 377
-0.05 0.50 771 811 852
Beit
Lid
10080
0
2,49
6
2,49
8
4,99
4
1,01
1 4,354 4,994 ث١ذ ١ض 947 5.3 150 954
1.38 1.38 5,204 5,969 6,846
Ar Ras 10081
5 373 540 اغاؽ 96 5.6 9 106 111 540 265 275
3.77 3.77 603 874 1,265
Kafr
Sur
10084
5 565 552
1,11
7 263 262 63 5 222
وفغ
هع1,117 924
1.92 1.92 1,182 1,429 1,728
Kur 10087 239 262 وع 54 4.9 8 72 69 262 139 123
0.92 0.92 269 295 324

243
0
Kafr
Zibad
10089
5 522 556
1,07
8 261 251 34 5.2 208
وفغ
ػ٠جبص1,078 962
1.14 1.14 1,115 1,250 1,401
Kafr
Jammal
10090
0
1,22
7
1,19
7
2,42
4 510 441 68 5.3 455
وفغ
جبي2,424 1,882
2.56 2.56 2,615 3,368 4,338
Kafr
'Abbus
h
10091
5 721 736
1,45
7 346 355 43 5.2 281
وفغ
ػجف1,457 1,096
2.89 2.89 1,587 2,110 2,804
Total
Tulkar
em
Gov.
79,8
06
78,1
82
157,
988
35,1
01
26,09
2
6,1
50 5.3
29,93
8
يجوع
يحافظة
طونكرو
157,9
88
127,3
45 2.50 168,779 211,355 266,817
Nablus Gov.
Bizzari
ya
15066
0
1,18
0
1,07
2
2,25
2 1,587 2,252 ثؼاع٠خ 380 5.9 84 442 413
3.56 3.56 2,501 3,549 5,037
Burqa 15068
0
1,87
4
1,79
6
3,67
0 2,987 3,670 ثغلخ 733 5 134 792 925
1
9 2.08 2.08 3,904 4,797 5,893
Yasid 15069
5
1,06
1
1,02
3
2,08
4 1,690 2,084 ٠به١ض 349 6 56 391 430
2.12 2.12 2,219 2,737 3,375
Beit
Imrin
15070
5
1,40
3
1,41
8
2,82
1 616 471 101 5.3 528
ث١ذ
إغ٠2,821 2,121
2.89 2.89 3,073 4,087 5,436
Nisf
Jubeil
15074
5 195 199 394 104 90 17 4.7 83
وف
جج١394 373
0.55 0.55 401 423 447
Sabasti
ya
15076
5
1,30
6
1,30
8
2,61
4 2,143 2,614 ؿجـط١خ 515 5.1 95 523 615
2.01 2.01 2,775 3,384 4,128
Ijnisiny
a
15077
0 413 505 إجـ١ب 106 4.8 15 140 135 505 252 253
2.03 2.03 536 656 802
Talluza 15077
5
1,20
6
1,16
9
2,37
5 1,977 2,375 طػح 429 5.5 72 440 507
1.85 1.85 2,509 3,015 3,621
An 15078 800 745 1,54 1,223 1,545 ابلعح 290 5.3 44 278 327
2.36 2.36 1,657 2,094 2,645

244
Naqura 5 5
Al
Badhan
15080
5
1,27
3
1,21
2
2,48
5 1,786 2,485 اجبطا 447 5.6 87 441 514
3.36 3.36 2,744 3,818 5,312
Deir
Sharaf
15081
0
1,22
2
1,23
8
2,46
0 578 446 85 5.3 464
ص٠غ
كغف2,460 2,035
1.91 1.91 2,604 3,148 3,805
'Asira
ash
Shamal
iya
15082
0
3,82
7
3,72
9
7,55
6
1,84
5 1,367 276 5.1 1,490
ػو١غح
الب١خ7,556 5,724
2.82 2.82 8,212 10,841 14,310
An
Nassari
ya
15082
5 785 800
1,58
5 304 286 60 6.1 259
اوبع
٠خ1,585 999
4.72 4.72 1,820 2,888 4,582
Zawata 15083
5 953 922
1,87
5 1,401 1,875 ػارب 360 5.2 59 317 459
2.96 2.96 2,046 2,739 3,665
Al
'Aqraba
niya
15084
0 494 507
1,00
1 196 204 28 6.4 157
اؼمغثب
٠خ1,001 703
2
0 3.60 3.60 1,113 1,585 2,256
Qusin 15085
5 866 843
1,70
9 1,279 1,709 له١ 300 5.7 60 319 339
2.94 2.94 1,864 2,491 3,328
Beit Iba 15086
0
1,59
0
1,56
0
3,15
0 2,410 3,150 ث١ذ إ٠جب 628 5 134 626 847
2.71 2.71 3,413 4,462 5,832
Beit
Hasan
15086
5 563 558
1,12
1 206 174 42 5.9 190
ث١ذ
دـ1,121 879
2.46 2.46 1,206 1,538 1,961
Beit
Wazan
15087
5 518 539
1,05
7 267 199 27 5.1 207
ث١ذ
ػ1,057 826
2.50 2.50 1,138 1,456 1,864
'Ein
Beit el
Ma
Camp
15088
0
2,03
2
1,94
7
3,97
9 810 404 72 5.2 769
ش١
ػ١ ث١ذ
ابء
3,979 3,715
0.69 0.69 4,062 4,350 4,660
'Ein 15088 ػ١ 57 5.9 16 75 76 335 171 164 335 146
8.66 8.66 430 986 2,263

245
Shibli 5 كج
'Azmut 15091
0
1,31
8
1,33
2
2,65
0 2,009 2,650 ػؼط 449 5.9 61 453 553
2.81 2.81 2,880 3,798 5,010
Nablus 15092
0
63,6
88
62,4
44
126,
132
32,0
18
10,41
5
7,7
87 5
25,10
4 بثؾ
126,1
32
99,20
4
2
1 2.43 2.43 135,555 172,350 219,132
'Askar
Camp
15093
0
5,80
8
5,79
9
11,6
07
2,32
7 1,096 268 5.5 2,114
ش١
ػـىغ
11,60
7 9,372
2.16 2.16 12,376 15,328 18,983
Deir al
Hatab
15093
5
1,09
3
1,12
0
2,21
3 430 329 30 6 368
ص٠غ
اذطت2,213 1,665
2.89 2.89 2,410 3,203 4,258
Sarra 15095
0
1,31
4
1,24
8
2,56
2 2,133 2,562 هغح 463 5.5 82 422 499
1.85 1.85 2,707 3,251 3,905
Salim 15095
5
2,48
8
2,57
4
5,06
2 3,749 5,062 ؿب 841 6 117 779 923
3.05 3.05 5,539 7,479 10,099
Balata
Camp
15096
0
7,48
9
7,75
8
15,2
47
3,17
3 1,512 416 5.5 2,759
ش١
ثالطخ
15,24
7
13,01
4 1.60 1.60 15,989 18,732 21,946
'Iraq
Burin
15097
5 401 367 768 161 170 13 5.2 147
ػغاق
ثع٠768 568
3.06 3.06 841 1,137 1,537
Tell 15099
0
2,18
7
2,15
7
4,34
4 3,496 4,344 ر 778 5.6 152 770 869
2.20 2.20 4,636 5,761 7,159
Beit
Dajan
15100
0
1,75
3
1,73
2
3,48
5 740 613 98 5.4 640
ث١ذ
صج3,485 2,647
2.79 2.79 3,785 4,983 6,560
Rujeib 15101
0
2,17
1
2,03
1
4,20
2 2,888 4,202 عج١ت 770 5.5 120 631 869
3.82 3.82 4,702 6,842 9,955
Kafr
Qallil
15102
5
1,23
5
1,21
6
2,45
1 1,838 2,451 وفغ ل١ 423 5.8 16 338 475
2.92 2.92 2,672 3,563 4,752
Furush
Beit
Dajan
15103
0 417 352 769 177 167 50 6.4 121
فغف
ث١ذ
صج
769 855
-1.05 0.50 781 821 862
Madam
a
15105
0 872 882
1,75
4 1,223 1,754 بصب 325 5.4 41 289 387
3.67 3.67 1,954 2,803 4,020

246
Burin 15108
0
1,15
5
1,15
4
2,30
9 1,898 2,309 ثع٠ 429 5.4 70 472 539
1.98 1.98 2,449 2,979 3,624
Beit
Furik
15109
0
5,24
7
5,09
2
10,3
39
2,22
9 1,982 384 5.2 1,999
ث١ذ
فع٠ه
10,33
9 7,672
3.03 3.03 11,307 15,238 20,535
'Asira
al
Qibliya
15109
5
1,19
7
1,16
9
2,36
6 476 391 99 6 392
ػو١غح
امج١خ2,366 1,686
3.45 3.45 2,619 3,676 5,158
'Awarta 15113
5
2,89
5
2,72
8
5,62
3
1,11
8 4,286 5,623 ػعرب 992 5.7 105 890
2.75 2.75 6,100 8,003 10,500
'Urif 15116
0
1,53
0
1,39
1
2,92
1 2,094 2,921 ػع٠ف 493 5.9 73 512 552
3.38 3.38 3,228 4,502 6,281
Odala 15118
0 567 568
1,13
5 798 1,135 أصال 173 6.6 35 196 194
3.59 3.59 1,262 1,794 2,552
Huwwa
ra
15118
5
2,78
3
2,78
7
5,57
0
1,13
0 4,275 5,570 داعح 971 5.7 284 888
2.68 2.68 6,030 7,857 10,237
'Einabu
s
15119
5
1,21
2
1,12
8
2,34
0 1,637 2,340 ػ١جؽ 421 5.6 65 428 479
3.64 3.64 2,605 3,723 5,322
Yanun 15120
0 113 102 ٠ب 19 5.4 9 36 28 102 48 54
-1.02 0.50 104 109 114
Beita 15121
5
4,71
5
4,36
4
9,07
9
1,72
4 6,478 9,079 ث١زب 1,566 5.8 290 1,599
3.43 3.43 10,047 14,080 19,734
Ar
Rajman
15122
0 29 15 اغجب 4 3.8 0 16 14 15 7 8
2
2 -6.38 0.50 15 16 17
Zeita
Jamma'
in
15123
0
1,11
0
1,00
5
2,11
5 351 375 46 6.8 309
ػ٠زب
جبػ١2,115 1,447
3.87 3.87 2,370 3,464 5,063
Jamma'
in
15124
5
3,16
9
3,05
6
6,22
5
1,17
0 4,263 6,225 جبػ١ 1,010 6.2 283 1,112
3.86 3.86 6,974 10,183 14,870
Osarin 15126
5 818 794
1,61
2 1,201 1,612 أهغ٠ 288 5.6 31 330 319
2.99 2.99 1,761 2,363 3,172

247
Aqraba 15127
0
4,19
8
3,98
2
8,18
0
1,75
7 5,849 8,180 ػمغثب 1,389 5.9 293 1,573
3.41 3.41 9,046 12,651 17,693
Za'tara 15128
5 43 44 ػػزغح 10 4.4 0 10 15 44 22 22
0.23 0.23 44 45 46
Tall al
Khasha
ba
15131
1 13 13 26 16 15 0 5.2 5
ر
اشلجخ26 3
24.1
0 2.86 28 38 50
Yatma 15132
5
1,42
5
1,42
8
2,85
3 2,199 2,853 ٠زب 517 5.5 79 491 563
2.64 2.64 3,085 4,002 5,193
Qabala
n
15133
5
3,66
5
3,46
5
7,13
0
1,52
6 5,346 7,130 لجال 1,250 5.7 308 1,481
2.92 2.92 7,773 10,367 13,827
Jurish 15134
5 710 690
1,40
0 1,020 1,400 جع٠ق 222 6.3 36 253 267
3.22 3.22 1,540 2,113 2,900
Qusra 15136
5
2,23
1
2,14
6
4,37
7 3,276 4,377 لوغح 674 6.5 169 803 777
2.94 2.94 4,774 6,379 8,523
Talfit 15137
5
1,42
6
1,39
8
2,82
4 2,206 2,824 رف١ذ 420 6.7 65 448 481
2.50 2.50 3,041 3,893 4,984
As
Sawiya
15138
0
1,22
8
1,16
5
2,39
3 1,697 2,393 اـب٠خ 383 6.2 52 447 478
3.50 3.50 2,653 3,741 5,275
Majdal
Bani
Fadil
15138
5
1,23
3
1,14
9
2,38
2 457 394 68 5.9 404
جضي
ث
فبض
2,382 1,611
3.99 3.99 2,679 3,960 5,856
Al
Lubban
ash
Sharqiy
a
15140
5
1,24
3
1,22
2
2,46
5 453 390 57 6 410
اج
الغل١خ2,465 1,844
2.95 2.95 2,689 3,595 4,806
Qaryut 15141
0
1,16
7
1,15
4
2,32
1 1,846 2,321 لغ٠د 396 5.9 61 387 431
2
3 2.32 2.32 2,486 3,126 3,930
Jalud 15142 334 464 جبص 85 5.5 5 91 94 464 235 229
3.34 3.34 512 711 988

248
0
'Ammu
riya
15143
5 231 302 ػع٠خ 48 6.3 5 62 58 302 151 151
2.72 2.72 327 428 559
Duma 15144
5
1,04
1
1,05
8
2,09
9 1,643 2,099 صب 341 6.2 80 403 389
2
4 2.48 2.48 2,259 2,886 3,687
Total
Nablus
Gov.
162,
241
158,
589
320,
830
72,1
99
42,88
4
13,
867 5.4
59,66
3
يجوع
يحافظة
نابهس
320,8
30
248,1
03 2.60 2.86 346,862 451,018 588,897
Qalqiliya Gov.
Falamy
a
20090
5 495 633 فال١خ 114 5.6 20 133 122 633 325 308
2.49 2.49 681 871 1,114
Kafr
Qaddu
m
20092
5
1,48
9
1,41
9
2,90
8 564 520 64 5.9 490
وفغ
لض2,908 2,450
1.73 1.73 3,061 3,634 4,313
Jit 20094
5
1,11
2
1,08
5
2,19
7 1,627 2,197 ج١ذ 375 5.9 52 306 409
3.05 3.05 2,404 3,246 4,384
Baqat
al
Hatab
20096
5 891 753
1,64
4 331 348 80 5.5 297
ثبلخ
اذطت1,644 1,226
2.98 2.98 1,795 2,407 3,228
Hajja 20097
0
1,10
1
1,04
7
2,14
8 1,773 2,148 دجخ 389 5.5 89 450 472
1.94 1.94 2,275 2,756 3,340
Jayyus 20098
5
1,47
3
1,42
1
2,89
4 2,319 2,894 ج١ؽ 538 5.4 105 515 555
2.24 2.24 3,093 3,860 4,817
Khirbet
Sir
20099
5 232 215 447 120 117 24 4.9 92
سغثخ
ه١غ447 380
2
5 1.64 1.64 469 552 649
'Arab ar
Ramadi
n ash
Shamal
i
20100
5 44 37 81 18 37 19 5.1 16
ػغة
اغبض
٠
الب
81 51
4.73 4.73 93 148 235

249
Far'ata 20101
5 461 642 فغػزب 101 6.4 15 120 112 642 301 341
3.37 3.37 709 987 1,375
Immati
n
20102
0
1,22
1
1,16
7
2,38
8 1,718 2,388 إبر١ 433 5.5 71 448 479
3.35 3.35 2,636 3,664 5,093
Al
Funduq
20103
5 462 756 افضق 149 5.1 91 160 165 756 357 399
5.05 5.05 876 1,434 2,347
Qalqili
ya
20104
0
21,2
55
20,4
84
41,7
39
8,68
0 5,219
1,9
25 لم١١خ 7,844 5.3
41,73
9
31,35
6 2.90 2.90 45,479 60,538 80,584
An
Nabi
Elyas
20105
5 600 571
1,17
1 226 185 94 5.4 216
اج
إ١بؽ1,171 852
3.23 3.23 1,288 1,771 2,433
Kafr
Laqif
20106
5 427 429 856 187 170 42 5.5 157
وفغ
اللف856 690
2.18 2.18 913 1,133 1,405
'Arab
Abu
Farda
20107
0 56 60 116 24 37 1 4.8 24
ػغة
أث فغصح116 77
4.18 4.18 131 198 298
'Izbat at
Tabib
20107
5 114 117 231 46 62 29 5.8 40
ػؼثخ
اطج١ت231 167
2
6 3.30 3.30 255 352 487
Jinsafut 20108
5
1,07
6
1,04
3
2,11
9 384 348 90 6 351
جوبف
ط2,119 1,599
2.86 2.86 2,306 3,056 4,049
'Azzun 20110
0
4,02
7
3,79
4
7,82
1
1,43
4 5,794 7,821 ػؼ 1,309 6 339 1,225
3.05 3.05 8,558 11,551 15,592
'Arab ar
Ramadi
n al
Janubi
20110
5 118 104 222 40 54 9 5.6 40
ػغة
اغبض
٠
اجث
222 136
5.02 5.02 257 420 685
'Isla 20111
5 622 855 ػـخ 137 6.2 27 124 141 855 394 461
3.23 3.23 941 1,293 1,777
Arab
Al-
20111
6 14 11 25 9 10 1 4.2 6
ػغة
اشخ25 4,314
-
40.20.50 25 27 28

250
Khoule
h
5
Wadi ar
Rasha
20112
0 85 70 155 23 18 4 6.7 23
اص
اغكب155 76
7.39 7.39 192 391 798
Habla 20112
5
3,09
4
2,92
2
6,01
6
1,13
9 4,314 6,016 دجخ 1,062 5.7 215 707
3.38 3.38 6,647 9,270 12,927
Ras at
Tira
20113
0 210 184 394 70 74 9 6.7 59
عاؽ
اط١غح394 278
3.55 3.55 437 620 879
Ras
'Atiya
20115
5 781 741
1,52
2 292 244 71 5.7 269
عاؽ
ػط١خ1,522 1,121
3.11 3.11 1,668 2,265 3,075
Ad
Dab'a
20117
0 189 335 اضجؼخ 57 5.9 8 57 59 335 165 170
5.89 5.89 398 705 1,250
Kafr
Thulth
20117
5
1,96
6
1,95
5
3,92
1 3,060 3,921 وفغ صش 696 5.6 172 669 747
2.51 2.51 4,224 5,412 6,935
'Izbat
Jal'ud
20119
0 64 48 112 22 27 4 5.1 22
ػؼثخ
جؼص112 100
1.14 1.14 116 130 145
Al
Mudaw
war
20120
5 155 271 اضع 43 6.3 15 53 44 271 130 141
5.75 5.75 320 560 980
'Izbat
Salman
20121
0 373 349 722 138 114 30 5.6 130
ػؼثخ
ؿب722 451
4.82 4.82 831 1,331 2,131
'Izbat al
Ashqar
20122
5 169 146 315 61 67 13 6.3 50
ػؼثخ
األكمغ315 293
0.73 0.73 322 346 372
Beit
Amin
20125
5 534 476
1,01
0 174 169 18 6 168
ث١ذ
أ١1,010 804
2.31 2.31 1,082 1,359 1,707
Sanniri
ya
20126
0
1,48
5
1,29
5
2,78
0 2,095 2,780 ؿ١غ٠ب 476 5.8 68 493 532
2.87 2.87 3,026 4,016 5,329
'Azzun
'Atma
20128
0 933 838
1,77
1 309 311 65 5.7 310
ػؼ
ػزخ1,771 1,171
4.22 4.22 2,005 3,032 4,586
Total
46,7 44,4 91,2 18,1 13,59 3,8 5.5 16,48 يجوع 91,21 72,67
3.34 99,515 133,336 179,348

251
Qalqili
ya
Gov.
يحافظة 3 79 1 28 17 53 64
قهقيهية
7 6
Salfit Gov.
Deir
Istiya
25125
0
1,58
2
1,56
4
3,14
6 707 618 105 5.3 592
ص٠غ
إؿز١ب3,146 2,818
2
7 1.11 1.11 3,252 3,630 4,053
Qarawa
t Bani
Hassan
25127
5
2,00
5
1,79
6
3,80
1 732 792 134 5.7 669
لغاح
ث
دـب
3,801 2,668
3.60 3.60 4,227 6,022 8,579
Qira 25129
0 575 568
1,14
3 743 1,143 ل١غح 176 6.5 31 167 206
4.40 4.40 1,301 2,001 3,078
Kifl
Haris
25129
5
1,61
3
1,63
5
3,24
8 704 630 122 5.4 599
وف
دبعؽ3,248 2,323
3.41 3.41 3,592 5,022 7,021
Marda 25130
0 991
1,00
1
1,99
2 1,589 1,992 غصا 348 5.7 36 318 382
2.29 2.29 2,132 2,672 3,350
Biddya 25130
5
4,13
4
3,93
0
8,06
4
1,66
8 5,982 8,064 ثض٠ب 1,471 5.5 404 1,577
3.03 3.03 8,820 11,890 16,028
Haris 25131
0
1,54
5
1,56
7
3,11
2 2,205 3,112 دبعؽ 534 5.8 81 445 614
2
8 3.51 3.51 3,451 4,870 6,874
Yasuf 25131
5 829 792
1,62
1 1,265 1,621 ٠بؿف 312 5.2 53 311 374
2.51 2.51 1,746 2,238 2,867
Mas-ha 25132
0
1,00
5 998
2,00
3 1,423 2,003 ـذخ 384 5.2 181 508 544
3.48 3.48 2,219 3,124 4,397
Iskaka 25133
0 789 912 إؿىبوب 155 5.9 34 161 193 912 420 492
1.46 1.46 953 1,101 1,273
Sarta 25134
0
1,33
9
1,19
1
2,53
0 1,875 2,530 هغطخ 466 5.4 64 513 515
3.04 3.04 2,768 3,735 5,040
'Izbat
Abu
Adam
25135
5 8 3 11 2 2 0 11 1
ػؼثخ
أث آص11 35
-
10.9
3
0.50 11 12 12

252
Az
Zawiya
25136
0
2,39
2
2,36
2
4,75
4 3,647 4,754 اؼا٠خ 888 5.4 136 938 992
2.69 2.69 5,147 6,710 8,747
Salfit 25137
0
4,40
2
4,39
4
8,79
6
2,11
1 7,010 8,796 ؿف١ذ 1,840 4.8 436 1,590
2.30 2.30 9,416 11,815 14,825
Rafat 25139
5 975 886
1,86
1 1,448 1,861 عافبد 344 5.4 38 361 363
2.54 2.54 2,007 2,579 3,314
Bruqin 25140
0
1,66
5
1,57
1
3,23
6 2,624 3,236 ثغل١ 564 5.7 85 604 627
2.12 2.12 3,446 4,250 5,241
Farkha 25141
5 693 673
1,36
6 1,100 1,366 فغسخ 222 6.2 27 247 265
2.19 2.19 1,458 1,810 2,248
Kafr ad
Dik
25142
5
2,28
9
2,26
4
4,55
3 990 830 132 5.2 884
وفغ
اض٠ه4,553 3,708
2
9 2.07 2.07 4,842 5,946 7,301
Deir
Ballut
25143
0
1,62
1
1,57
4
3,19
5 703 592 66 5.2 609
ص٠غ
ثط3,195 2,645
1.91 1.91 3,381 4,084 4,934
Khirbet
Qeis
25144
0 120 106 226 54 53 3 5 45
سغثخ
ل١ؾ226 182
2.19 2.19 241 299 372
Total
Salfit
Gov.
30,2
75
29,2
95
59,5
70
12,7
46
11,25
7
2,1
68 5.4
11,10
3
يجوع
يحافظة
سهفيث
59,57
0
46,07
9 2.62 64,409 83,809 109,553
Ramallah & Al-Bireh Gov.
Qarawa
t Bani
Zeid
30145
5
1,50
3
1,41
2
2,91
5 530 444 73 5.8 504
لغاح
ث ػ٠ض2,915 1,932
4.20 4.20 3,298 4,976 7,507
Bani
Zeid
ash
Sharqiy
a
30146
0
2,60
6
2,47
7
5,08
3 962 887 140 5.7 888
ث ػ٠ض
الغل١خ5,083 3,825
3
0 2.88 2.88 5,536 7,356 9,776
Kafr
'Ein
30147
0 875 868
1,74
3 1,272 1,743 وفغ ػ١ 341 5.1 36 329 379
3.20 3.20 1,916 2,625 3,597

253
Bani
Zeid
30148
0
2,81
1
2,70
4
5,51
5
1,17
6 4,298 5,515 ث ػ٠ض 1,094 5 133 937
2.52 2.52 5,943 7,626 9,786
'Abwei
n
30148
5
1,55
2
1,56
7
3,11
9 2,399 3,119 ػج٠ 572 5.5 81 572 574
2.66 2.66 3,375 4,387 5,704
Turmus
'ayya
30149
0
1,82
0
1,91
6
3,73
6 3,106 3,736 رغـؼ١ب 625 6 127 840 935
1.86 1.86 3,949 4,750 5,713
Al
Lubban
al
Gharbi
30149
5 709 767
1,47
6 261 202 42 6 248
اج
اغغث1,476 1,054
3.42 3.42 1,633 2,287 3,202
Sinjil 30150
0
2,56
8
2,66
8
5,23
6
1,02
9 3,883 5,236 ؿج 965 5.4 127 806
3.03 3.03 5,727 7,723 10,414
Deir as
Sudan
30150
5
1,00
8 983
1,99
1 347 288 20 6.1 326
ص٠غ
اـصا1,991 1,521
2.73 2.73 2,159 2,826 3,699
Rantis 30151
5
1,36
7
1,16
7
2,53
4 2,020 2,534 عز١ؾ 421 6 60 385 446
2.29 2.29 2,712 3,403 4,268
Jilijliya 30152
0 714 741 جج١١ب 154 4.8 9 225 222 741 390 351
0.37 0.37 749 778 807
'Ajjul 30152
5 636 601
1,23
7 1,013 1,237 ػجي 220 5.6 16 206 227
2.02 2.02 1,313 1,604 1,958
Al
Mugha
yyir
30153
0
1,22
0
1,14
8
2,36
8 1,683 2,368 اغ١غ 376 6.3 61 439 414
3.47 3.47 2,623 3,691 5,194
'Abud 30153
5
1,06
5
1,01
9
2,08
4 1,716 2,084 ػبثص 419 5 55 353 452
1.96 1.96 2,209 2,683 3,258
An
Nabi
Salih
30154
0 286 248 534 101 96 11 5.9 91
اج
هبخ534 366
3.85 3.85 598 873 1,273
Khirbet
Abu
30154
5
2,03
6
1,96
0
3,99
6 718 612 98 6.4 620
سغثخ
أث فالح3,996 2,863
3.39 3.39 4,416 6,164 8,603

254
Falah
Umm
Safa
30155
0 503 612 أ هفب 114 5.4 19 100 119 612 298 314
1.98 1.98 649 790 961
Al
Mazra'a
ash
Sharqiy
a
30155
5
2,22
8
2,26
7
4,49
5
1,06
6 958 140 5.7 792
اؼعػخ
الغل١خ4,495 3,612
2.21 2.21 4,800 5,973 7,433
Deir
Nidham
30156
0 635 879 ص٠غ ظب 139 6.3 8 105 136 879 412 467
3.31 3.31 969 1,341 1,857
'Atara 30156
5
1,13
1
1,13
9
2,27
0 1,640 2,270 ػطبعح 413 5.5 39 421 495
3.30 3.30 2,503 3,464 4,795
Deir
Abu
Mash'al
30157
0
1,79
4
1,72
8
3,52
2 703 613 97 5.2 672
ص٠غ أث
لؼ3,522 2,402
3.90 3.90 3,951 5,793 8,494
Jibiya 30157
5 112 148 ج١ج١ب 26 5.7 4 28 33 148 77 71
2.83 2.83 161 213 281
Burham 30158
5 395 616 ثغب 120 5.1 5 99 130 616 310 306
4.54 4.54 704 1,098 1,712
Kafr
Malik
30159
0
1,36
6
1,42
1
2,78
7 664 631 127 5 561
وفغ
به2,787 2,220
3
1 2.30 2.30 2,984 3,746 4,703
Shuqba 30159
5
2,30
2
2,19
5
4,49
7 3,027 4,497 كمجب 793 5.7 164 684 883
4.04 4.04 5,064 7,523 11,177
Kobar 30160
0
1,88
5
1,79
2
3,67
7 2,563 3,677 وثغ 668 5.5 72 630 707
3.68 3.68 4,097 5,878 8,433
Qibya 30160
5
2,54
5
2,35
6
4,90
1 3,441 4,901 لج١ 803 6.1 126 776 838
3.60 3.60 5,450 7,762 11,055
Silwad 30161
0
3,07
2
3,05
1
6,12
3
1,68
3 5,064 6,123 ؿاص 1,237 4.9 191 1,197
1.92 1.92 6,482 7,837 9,476
Yabrud 30161 481 644 ٠جغص 111 5.8 9 102 136 644 307 337
2.96 2.96 703 941 1,260

255
5
AL-
Itihad
30162
0
3,52
1
3,28
2
6,80
3
1,10
1 4,853 6,803 االرذبص 1,055 6.4 115 887
3
2 3.44 3.44 7,528 10,554 14,794
Shabtin 30162
5 610 844 كجز١ 149 5.7 8 108 157 844 395 449
3.30 3.30 930 1,287 1,781
Bir Zeit 30163
5
2,26
1
2,26
8
4,52
9
1,77
2 4,625 4,529 ث١غػ٠ذ 1,005 4.5 262 841
-0.21 0.50 4,597 4,832 5,080
AL-
Doha
30163
6 40 50 اضدخ 10 5 0 52 29 50 19 31
2.26 2.26 53 67 84
'Ein
Siniya
30164
0 349 362 711 169 190 19 5.2 136
ػ١
ؿ١١ب711 526
3.06 3.06 778 1,052 1,422
Silwad
Camp
30164
5 215 167 382 71 61 14 5.6 68
ش١
ؿاص382 296
2.58 2.58 412 532 687
Deir
Jarir
30165
0
1,97
7
2,00
9
3,98
6 838 487 95 5.3 750
ص٠غ
جغ٠غ3,986 3,004
2.87 2.87 4,339 5,757 7,639
Deir
'Amma
r Camp
30166
0 931 903
1,83
4 359 252 55 5.9 311
ش١
ص٠غ
ػبع
1,834 1,556
1.66 1.66 1,927 2,271 2,677
Budrus 30166
5 690 709
1,39
9 1,056 1,399 ثضعؽ 236 5.9 23 225 273
2.85 2.85 1,522 2,017 2,672
AL-
Zaytou
neh
30167
0
3,20
5
2,98
5
6,19
0
1,19
8 4,263 6,190 اؼ٠زخ 1,027 6 103 1,084
3
3 3.80 3.80 6,923 10,052 14,596
Jifna 30167
5 860 856
1,71
6 948 1,716 جفب 378 4.5 48 366 470
6.11 6.11 2,050 3,711 6,718
Dura al
Qar'
30168
0
1,42
8
1,46
9
2,89
7 640 360 47 5.4 541
صعا
امغع2,897 1,913
4.24 4.24 3,281 4,969 7,525
At
Tayba
30168
5 692 760
1,45
2 1,484 1,452 اط١جخ 333 4.4 87 376 442
-0.22 0.50 1,474 1,549 1,628
Al 30170 3,94 3,87 7,81 1,54 ش١ 1,401 5.6 197 908 7,813 6,064
2.57 2.57 8,430 10,862 13,994

256
Jalazun
Camp
اجؼ 5 3 1 2 0
Abu
Qash
30170
5 707 697
1,40
4 1,092 1,404 أث لق 273 5.1 66 290 401
2.54 2.54 1,514 1,947 2,503
Deir
Qaddis
30171
0
1,00
6 936
1,94
2 397 290 50 5.6 345
ص٠غ
لض٠ؾ1,942 1,374
3.52 3.52 2,154 3,045 4,304
Ni'lin 30171
5
2,31
9
2,25
4
4,57
3 3,317 4,573 ؼ١ 869 5.3 217 686 979
3.26 3.26 5,035 6,942 9,571
'Ein
Yabrud
30172
0
1,42
7
1,57
2
2,99
9 852 629 103 5.2 577
ػ١
٠جغص2,999 2,483
1.91 1.91 3,174 3,833 4,630
Kharbat
ha Bani
Harith
30172
5
1,47
7
1,36
9
2,84
6 519 453 88 5.8 487
سغثضب
ث
دبعس
2,846 2,029
3.44 3.44 3,150 4,418 6,198
Ras
Karkar
30173
0 850 813
1,66
3 308 219 30 5.8 288
عاؽ
وغوغ1,663 1,325
2.30 2.30 1,780 2,234 2,804
Surda 30173
5 507 524
1,03
1 993 1,031 هغصا 214 4.8 17 204 288
0.38 0.38 1,043 1,083 1,124
Al
Janiya
30174
0 581 582
1,16
3 817 1,163 اجب١خ 180 6.5 14 142 209
3.59 3.59 1,293 1,841 2,620
Al
Midya
30174
5 666 635
1,30
1 911 1,301 اض٠خ 216 6 16 153 224
3.63 3.63 1,448 2,068 2,953
Rammu
n
30175
0
1,28
8
1,33
8
2,62
6 2,241 2,626 ع 468 5.6 67 470 594
1.60 1.60 2,754 3,227 3,781
Kafr
Ni'ma
30175
5
1,88
8
1,86
2
3,75
0 770 690 91 5.3 709
وفغ
ؼخ3,750 2,704
3.32 3.32 4,137 5,737 7,956
Bil'in 30176
0 889 812
1,70
1 1,226 1,701 ثؼ١ 307 5.5 51 350 350
3.33 3.33 1,877 2,604 3,612
Beitin 30176
5
1,01
5
1,12
8
2,14
3 2,131 2,143 ث١ز١ 440 4.9 70 410 717
0.06 0.06 2,147 2,159 2,171
'Ein 30177 ػ١ 130 6.2 6 108 137 812 399 413 812 564
3.71 3.71 906 1,304 1,878

257
Qiniya 0 ل١١ب
Badiw
al
Mu'arra
jat
30177
5 407 346 753 110 108 5 6.7 112
ثض
اؼغجب
د
753 558
3.04 3.04 824 1,112 1,500
Deir
Ibzi'
30178
0
1,05
5
1,01
4
2,06
9 362 335 41 5.8 354
ص٠غ
إثؼ٠غ2,069 1,452
3.60 3.60 2,301 3,279 4,672
Deir
Dibwan
30178
5
2,41
3
2,83
9
5,25
2
1,34
3 1,233 201 5.3 990
ص٠غ
صثا5,252 4,837
0.83 0.83 5,383 5,845 6,347
Al
Bireh
30179
0
19,1
34
19,0
68
38,2
02
12,0
87 3,781
2,2
45 اج١غح 7,917 4.8
38,20
2
27,60
6 3.30 3.30 42,112 58,277 80,645
'Ein
'Arik
30180
0 772 795
1,56
7 307 228 48 5.5 287
ػ١
ػغ٠ه1,567 1,190
2.79 2.79 1,702 2,241 2,951
Saffa 30180
5
1,90
4
1,89
8
3,80
2 2,822 3,802 هفب 651 5.8 152 620 759
3.03 3.03 4,158 5,601 7,547
Ramall
ah
30181
0
13,6
14
13,8
46
27,4
60
8,47
7 3,046
3,0
86 عا هللا 6,083 4.5
27,46
0
17,78
1 4.44 4.44 31,284 48,313 74,613
Burqa 30181
5 995
1,09
5
2,09
0 1,618 2,090 ثغلخ 314 6.7 40 278 375
2.59 2.59 2,257 2,915 3,766
Beit 'Ur
at
Tahta
30182
0
2,24
3
2,12
9
4,37
2 882 715 122 5.4 804
ث١ذ
ػع
ازذزب
4,372 3,081
3.56 3.56 4,856 6,891 9,778
Beituni
ya
30182
5
10,0
47
9,71
4
19,7
61
5,05
3 ث١ز١ب 3,901 5.1 480 1,588
19,76
1 9,293
3
4 7.84 7.84 24,780 52,694 112,050
Al
Am'ari
Camp
30183
0
2,58
3
2,43
1
5,01
4
1,02
9 554 93 5.5 906
ش١
األؼغ5,014 3,993
2.30 2.30 5,368 6,741 8,465
Qaddur
a Camp
30183
5 604 604
1,20
8 289 119 70 5.2 233
ش١
لضعح1,208 1,088
1.05 1.05 1,247 1,384 1,537
Beit 30185 1,43 1,31 2,74 ث١ذ 493 5.6 61 381 564 2,749 1,984
3.31 3.31 3,032 4,200 5,820

258
Sira 0 4 5 9 ؿ١غا
Kharbat
ha al
Misbah
30185
5
2,66
3
2,54
8
5,21
1 924 669 110 6.4 815
سغثضب
اوجبح5,211 3,662
3.59 3.59 5,793 8,243 11,730
Beit 'Ur
al
Fauqa
30186
0 438 426 864 185 179 26 4.9 178
ث١ذ
ػع
افلب
864 647
2.93 2.93 942 1,258 1,680
At Tira 30189
0 661 697
1,35
8 1,148 1,358 اط١غح 246 5.5 22 231 282
1.69 1.69 1,428 1,689 1,998
Beit
Liqya
30189
5
3,91
1
3,79
9
7,71
0
1,47
0 5,634 7,710 ث١ذ م١ب 1,302 5.9 230 1,224
3.19 3.19 8,471 11,592 15,864
Beit
Nuba
30192
5 134 115 249 31 23 4 7.8 32
ث١ذ
ثب249 204
2.01 2.01 264 323 394
Total
Ramall
ah &
Al-
Bireh
Gov.
140,
827
138,
903
279,
730
66,7
04
40,56
8
11,
085 5.3
52,83
4
يجوع
يحافظة
راو هللا
279,7
30
202,8
03 2.94 309,532 440,661 645,152
Jericho Gov.
Marj
Na'ja
35104
5 359 356 715 145 136 10 6.2 116
غط
ؼجخ715 547
2.71 2.71 775 1,013 1,324
Az
Zubeid
at
35111
0 729 692
1,42
1 955 1,421 اؼث١ضاد 199 7.1 13 140 199
4.05 4.05 1,601 2,382 3,544
Marj al
Ghazal
35111
6 97 106 203 50 68 5 4.7 43
غط
اغؼاي203 274
-2.95 0.50 206 217 228
Al
Jiftlik
35114
0
1,85
7
1,85
7
3,71
4 3,136 3,714 اجفزه 578 6.4 129 716 692
1.71 1.71 3,907 4,628 5,480
Fasayil 35151 541 537 1,07 641 1,078 فوب٠ 190 5.7 8 214 202
5.34 5.34 1,260 2,119 3,563

259
0 8
Al
'Auja
35169
0
2,05
8
2,06
2
4,12
0 2,858 4,120 اؼجب 674 6.1 112 711 721
3.73 3.73 4,598 6,628 9,555
An
Nuwei'
ma
35184
0 593 652
1,24
5 830 1,245 ا٠ؼخ 213 5.8 21 274 243
4.14 4.14 1,406 2,109 3,164
'Ein ad
Duyuk
al
Fauqa
35184
5 409 412 821 156 175 21 6 137
ػ١
اض٠ن
افلب
821 580
3.54 3.54 911 1,290 1,826
'Ein as
Sultan
Camp
35186
5
1,59
2
1,56
8
3,16
0 653 707 67 5.4 589
ش١
ػ١
اـطب
3,160 1,451
8.09 8.09 3,991 8,692 18,929
Jericho
(Ariha)
35192
0
9,14
5
9,20
1
18,3
46
4,54
9 أع٠ذب 3,510 5.2 668 3,386
18,34
6
15,24
3
3
5 1.87 1.87 19,395 23,343 28,095
Deir al
Qilt
35197
0 4 0 4 1 1 0 4 1
ص٠غ
امظ4 2
7.18 7.18 5 10 20
Aqbat
Jaber
Camp
35197
5
3,63
0
3,54
6
7,17
6
1,36
9 1,420 151 5.5 1,298
ش١
ػمجخ
ججغ
7,176 4,521
4.73 4.73 8,243 13,084 20,767
Deir
Hajla
35202
1 6 2 8 1 1 0 8 1
ص٠غ
دجخ8 5
4.81 4.81 9 15 24
An
Nabi
Musa
35207
5 167 142 309 65 91 22 4.7 66
اج
ؿ309 45
21.2
5
21.2
5 551 3,782 25,970
Total
Jericho
Gov.
21,1
87
21,1
33
42,3
20
9,04
6 8,040
1,2
27 5.6 7,615
يجوع
يحافظة
أريحا
42,32
0
31,08
8 5.63 46,858 69,310 122,488
Jerusalem Gov.
Rafat 4018 1,20 1,17 2,37 1,553 2,374 عافبد 420 5.7 49 319 455
4.34 4.34 2,696 4,122 6,301

260
70 3 1 4
Mikhmas 4018
85 677 770
1,44
7 1,374 1,447 شبؽ 312 4.6 39 404 503
0.52 0.52 1,470 1,548 1,630
Qalandiy
a Camp
4019
00
4,57
4
4,25
7
8,83
1
1,70
3 934 160 5.4 1,625
ش١
لض٠ب8,831 6,629
2.91 2.91 9,625 12,822 17,081
Jaba'
(Tajamm
u'
Badawi)
4019
10 35 37 72 19 31 15 4.5 16
ججغ
)رجغ
ثض(
72 46
4.58 4.58 82 129 202
Qalandiy
a
4019
15 573 606
1,17
9 844 1,179 لض٠ب 214 5.5 8 150 220
3.40 3.40 1,303 1,821 2,543
Beit
Duqqu
4019
30 830 791
1,62
1 1,170 1,621 ث١ذ صل 308 5.3 21 268 370
3.31 3.31 1,788 2,477 3,431
Jaba' 4019
35
1,65
5
1,52
8
3,18
3 2,369 3,183 ججغ 462 6.9 41 399 557
3.00 3.00 3,478 4,673 6,279
Al
Judeira
4019
40
1,13
8
1,13
8
2,27
6 1,551 2,276 اجض٠غح 410 5.6 46 255 482
3.91 3.91 2,554 3,747 5,499
Ar Ram
&
Dahiyat
al Bareed
4019
45
10,4
81
9,87
8
20,3
59
7,53
0 2,285 921 4.9 4,149
اغا
ضبد١خ
اجغ٠ض
20,35
9
18,71
9 0.84 0.84 20,878 22,708 24,697
Beit
'Anan
4019
50
1,98
5
1,99
5
3,98
0 843 604 79 5.2 764
ث١ذ
ػب3,980 3,119
2.47 2.47 4,282 5,464 6,972
Al Jib 4019
55
2,13
7
2,08
3
4,22
0
1,01
5 3,395 4,220 اج١ت 719 5.9 68 544
2.20 2.20 4,505 5,599 6,960
Bir
Nabala
4019
60
2,40
2
2,41
5
4,81
7
2,05
5 4,454 4,817 ث١غ جبال 944 5.1 170 792
0.79 0.79 4,932 5,333 5,768
Beit Ijza 4019
65 383 315 698 146 104 11 5.8 120
ث١ذ
إجؼا698 490
3.60 3.60 776 1,106 1,575
Al 4019 1,61 1,55 3,17 1,513 3,172 امج١جخ 555 5.7 132 491 628
7.68 7.68 3,961 8,304 17,409

261
Qubeiba 80 6 6 2
Kharayib
Umm al
Lahim
4019
85 177 186 363 55 44 3 6.8 53
سغائت
أ اذ363 272
2.93 2.93 396 528 705
Biddu 4019
95
3,51
4
3,28
4
6,79
8
1,17
9 4,657 6,798 ثض 1,157 5.9 267 760
3.86 3.86 7,615 11,116 16,226
An Nabi
Samwil
4020
00 136 122 258 41 27 2 6 43
اج
هئ١258 160
4.89 4.89 298 480 774
Hizma 4020
05
3,11
0
3,16
1
6,27
1
1,28
4 4,459 6,271 دؼب 1,027 6.1 152 730
3.47 3.47 6,947 9,769 13,739
Beit
Hanina
al Balad
4020
10 550 521
1,07
1 409 233 19 5.9 181
ث١ذ
د١ب
اجض
1,071 1,014
0.55 0.55 1,089 1,150 1,215
Qatanna 4020
15
3,24
2
3,21
6
6,45
8
1,15
7 5,482 6,458 لطخ 1,069 6 64 894
1.65 1.65 6,783 7,991 9,414
Beit
Surik
4020
20
1,94
6
1,94
1
3,88
7 649 415 59 6.2 629
ث١ذ
ؿع٠ه3,887 2,792
3.36 3.36 4,293 5,976 8,320
Beit Iksa 4020
25 963 932
1,89
5 424 326 29 5.2 362
ث١ذ
إوـب1,895 1,148
5.14 5.14 2,202 3,636 6,001
'Anata 4020
40
6,09
1
5,95
8
12,0
49
2,65
0 ػبرب 2,168 5.6 288 1,250
12,04
9 7,037
5.53 5.53 14,159 24,243 41,509
Al
Ka'abina
(Tajamm
u'
Badawi)
4020
45 339 355 694 171 171 36 5.7 122
اىؼبث
)رجغ
ثض(
694 714
-0.28 0.50 704 740 778
Az
Za'ayye
m
4020
65
1,76
3
1,63
9
3,40
2
1,06
1 1,798 3,402 اؼػ١ 695 4.9 73 368
6.58 6.58 4,119 7,794 14,747
Al 4021 8,89 8,70 17,6 5,20 17,60 اؼ١ؼع٠خ 3,429 5.1 971 2,430 12,72
3.30 3.30 19,408 26,854 37,157

262
'Eizariya 00 7 9 06 7 6 4
Abu Dis 4021
20
5,57
9
5,20
3
10,7
82
2,87
8 أث ص٠ؾ 2,215 4.9 297 1,518
10,78
2 8,858
1.99 1.99 11,437 13,921 16,945
'Arab al
Jahalin
4021
25 364 357 721 96 114 3 7.1 101
ػغة
اجب١721 881
-1.98 0.50 732 769 809
As
Sawahira
ash
Sharqiya
4021
45
2,92
6
2,87
4
5,80
0
1,28
8 914 78 5.4 1,077
اـادغ
ح
الغل١خ
5,800 3,810
4.29 4.29 6,579 10,016 15,247
Ash
Sheikh
Sa'd
4021
60 941
1,00
8
1,94
9 518 437 16 5.1 385
ال١ز
ؿؼض1,949 1,760
1.03 1.03 2,010 2,225 2,464
Total
Jerusale
m J2
70,2
27
68,0
06
138,
233
35,5
93
18,21
1
4,1
28 5.4
25,73
1
يجوع
انقذس
j2
138,2
33
Total
Jerusale
m J1
114,
743
110,
673
225,
416 - - - 5
44,70
3
يجوع
انقذس
j1
225,4
16
Total
Jerusale
m Gov.
184,
970
178,
679
363,
649
35,5
93
18,21
1
4,1
28 5.2
70,43
4
يجوع
يحافظة
انقذس
363,6
49
104,7
92 3.29 151,098 207,060 292,398
Bethlehem Gov.
Al
Walaja
45217
0
1,04
1
1,00
0
2,04
1 1,227 2,041 اجخ 390 5.2 24 280 388
5.22 5.22 2,378 3,955 6,579
Battir 45217
5
1,99
2
1,97
5
3,96
7 3,054 3,967 ثز١غ 798 5 85 663 981
2.65 2.65 4,291 5,574 7,240
Al
'Ubeidi
ya
45218
0
5,45
6
5,29
7
10,7
53
1,86
5 اؼج١ض٠خ 1,703 6.3 131 1,257
10,75
3 7,765
3
6 3.31 3.31 11,856 16,419 22,736
'Ayda 45218 1,31 1,31 2,63 ش١ 509 5.2 43 288 564 2,631 2,360
1.09 1.09 2,718 3,030 3,378

263
Camp 5 8 3 1 ػب٠ضح
Khallet
an
Nu'man
45219
0 80 93 173 35 30 1 6 29
سخ
اؼب173 143
1.92 1.92 183 222 268
Al 'Aza
Camp
45219
5 786 743
1,52
9 275 142 38 5.2 292
ش١
اؼؼح1,529 1,262
1.94 1.94 1,620 1,962 2,377
Al
Khas
45220
0 250 394 اشبم 77 5.1 5 84 91 394 194 200
4.65 4.65 452 712 1,122
Al
Haddad
iya
45220
5 49 54 اذضاص٠خ 10 5.4 0 12 13 54 24 30
0.98 0.98 56 61 68
Khallet
Hamam
eh
45220
8 694 721
1,41
5 335 167 16 5 285
سخ
دبخ1,415 1,150
2.10 2.10 1,506 1,853 2,280
Bir
Onah
45220
9 331 341 672 149 102 5 4.7 144
ثئغ
ػ672 472
3.60 3.60 747 1,064 1,514
Beit
Jala
45221
0
5,83
4
5,92
4
11,7
58
3,43
3 ث١ذ جبال 2,664 4.4 571 1,911
11,75
8
12,07
9 -0.27 0.50 11,935 12,546 13,187
Dar
Salah
45222
5
1,71
5
1,65
8
3,37
3 685 656 68 5.4 625
صاع
هالح3,373 2,183
3
7 4.45 4.45 3,843 5,938 9,176
Husan 45223
0
2,94
2
2,60
9
5,55
1
1,19
5 4,131 5,551 دؿب 1,028 5.4 168 928
3.00 3.00 6,065 8,150 10,952
Wadi
Fukin
45223
5 588 580
1,16
8 244 180 12 5.4 217
اص
فو١1,168 869
3.00 3.00 1,276 1,716 2,306
Bethleh
em
(Beit
Lahm)
45224
0
12,7
53
12,5
13
25,2
66
6,70
9 3,107
1,8
60 ث١ذ ذ 5,211 4.8
25,26
6
21,66
0 1.55 1.55 26,461 30,866 36,004
Beit
Sahur
45225
5
6,20
2
6,16
5
12,3
67
3,51
7 2,145 656 4.5 2,775
ث١ذ
ؿبدع
12,36
7
11,13
7 1.05 1.05 12,762 14,171 15,736

264
Ad
Doha
45226
5
4,95
0
4,80
3
9,75
3
2,22
0 5,131 9,753 اضدخ 1,849 5.3 429 1,002
6.63 6.63 11,825 22,478 42,726
Al
Khadr
45227
0
5,05
6
4,71
8
9,77
4
1,90
1 6,720 9,774 اشضغ 1,722 5.7 255 1,106
3.82 3.82 10,937 15,907 23,136
Ad
Duheis
ha
Camp
45227
5
4,42
6
4,31
0
8,73
6
1,90
5 1,170 253 5.1 1,698
ش١
اض١لخ8,736 6,803
2.53 2.53 9,417 12,092 15,528
Hindaz
a
45228
0
2,41
6
2,38
3
4,79
9 2,621 4,799 ضاػح 794 6 56 805 899
3
8 6.24 6.24 5,754 10,535 19,290
Ash
Shawa
wra
45228
5
1,91
5
1,82
2
3,73
7 771 760 56 5.4 694
الاع
ح3,737 2,715
3
9 3.25 3.25 4,113 5,661 7,792
Artas 45230
0
1,87
7
1,78
6
3,66
3 2,651 3,663 إعطبؽ 603 6.1 40 535 755
3.29 3.29 4,036 5,577 7,706
Nahhali
n
45232
5
3,54
2
3,28
5
6,82
7
1,35
2 4,638 6,827 ذب١ 1,204 5.7 182 1,117
3.94 3.94 7,667 11,285 16,611
Beit
Ta'mir
45233
5 654 575
1,22
9 242 200 13 6.1 200
ث١ذ
رؼغ1,229 840
3.88 3.88 1,378 2,016 2,949
Khallet
al
Louza
45234
5 290 288 578 104 191 4 6.2 93
سخ
اػح578 324
5.96 5.96 688 1,227 2,188
Al Jab'a 45235
5 643 896 اججؼخ 140 6.4 11 137 153 896 416 480
3.37 3.37 990 1,379 1,922
Za'tara 45236
0
3,21
5
3,07
4
6,28
9
1,08
0 4,408 6,289 ػػزغح 1,046 6 85 1,049
4
0 3.62 3.62 6,997 9,982 14,242
Jannata
h
45238
5
2,75
4
2,66
2
5,41
6 913 851 52 6.3 860
جبرخ
)ث١ذ
فح(
5,416 3,623 4
1 4.10 4.10 6,110 9,134 13,655
Wadi 45240 764 655 1,41 اص 278 5.1 22 272 301 1,419 872 4 4.99 4.99 1,642 2,672 4,349

265
Rahhal 0 9 2 عدبي
Jubbet
adh
Dhib
45240
5 81 81 162 27 23 5 6 27
ججخ
اظ٠ت162 93
5.71 5.71 191 333 581
Khallet
Sakariy
a
45241
5 97 88 185 36 33 2 5.4 34
سخ
ؿىبع٠ب185 195
4
3 -0.53 0.50 188 197 207
Khallet
al
Haddad
45243
0 220 187 407 79 74 4 5.6 73
سخ
اذضاص407 303
2.99 2.99 445 597 802
Al
Ma'sara
45244
0 429 374 803 136 137 10 6.2 129
اؼوغ
ح803 572
3.45 3.45 889 1,248 1,752
Wadi
an Nis
45244
5 394 378 772 132 103 10 6.5 119
اص
ا١ن772 538
3.68 3.68 860 1,235 1,771
Jurat
ash
Sham'a
45246
0 797 694
1,49
1 269 202 43 6 250
جعح
الؼخ1,491 1,085
3.23 3.23 1,640 2,254 3,097
Khallet
'Afana
45246
5 0 0 0 12 15 4 0 0
سخ
ػفبخ0 4
-
100.
00
0.50 0 0 0
Marah
Ma'alla
45247
0 373 312 685 106 104 14 6.9 99
غاح
ؼال685 446
4.38 4.38 779 1,197 1,838
Umm
Salamu
na
45248
0 475 470 945 144 128 20 6.8 139
أ
ؿخ945 584
4.93 4.93 1,092 1,767 2,859
Al
Manshi
ya
45249
0 263 433 ال١خ 57 7.6 5 45 57 433 221 212
5.11 5.11 503 828 1,363
Tuqu' 45249
5
4,55
5
4,32
6
8,88
1
1,44
4 6,165 8,881 رمع 1,368 6.5 169 1,311
4
4 3.72 3.72 9,909 14,274 20,563

266
Marah
Rabah
45250
0 690 630
1,32
0 177 158 32 7.8 169
غاح
عثبح1,320 822
4.85 4.85 1,522 2,443 3,924
Beit
Fajjar
45252
5
5,63
4
5,37
0
11,0
04
2,04
2 1,561 400 6.1 1,808
ث١ذ
فجبع
11,00
4 7,896
3.37 3.37 12,156 16,941 23,609
Al
Maniya
45253
5 509 503
1,01
2 651 1,012 ا١خ 157 6.4 18 147 153
4
5 4.51 4.51 1,155 1,796 2,792
Kisan 45256
5 288 454 و١ـب 76 6 3 75 77 454 228 226
4.66 4.66 520 820 1,293
'Arab ar
Rashayi
da
45266
0 750 703
1,45
3 291 301 5 6.5 224
ػغة
اغكب٠ضح1,453 947
4
6 4.37 4.37 1,652 2,535 3,889
Total
Bethle
hem
Gov.
89,7
43
86,4
92
176,
235
38,2
57
25,56
4
5,8
85 5.4
32,66
7
يجوع
يحافظة
بيث نحى
176,2
35
132,6
32 2.88 3.69 193,202 266,648 377,357
Hebron Gov.
Khirbet
ad Deir
50243
5 127 137 264 48 50 1 5.6 47
سغثخ
اض٠غ264 212
2.22 2.22 282 351 437
Surif 50245
0
6,74
8
6,61
7
13,3
65
2,35
1 2,242 306 6.2 2,151
هع٠
ف
13,36
5
9,54
1 3.43 3.43 14,787 20,714 29,016
Al
'Arrub
Camp
50253
0
4,02
5
3,91
6
7,94
1
1,42
0 977 184 5.8 1,358
ش١
اؼغة7,941
5,93
3 2.96 2.96 8,667 11,600 15,526
Beit
Ummar
50254
0
6,90
9
6,63
9
13,5
48
2,73
9 2,266 364 5.9 2,306
ث١ذ
أغ
13,54
8
9,86
7 47 3.22 3.22 14,900 20,458 28,091
Jala 50254
5 180 249 جبال 40 6.2 2 64 47 249 138 111
3.30 3.30 274 380 525
Hitta 50255
0 511 891 دزب 114 7.8 16 129 121 891 450 441
5.72 5.72 1,053 1,836 3,201
Shuyuk 50255 822 728 1,55 ك١ر 257 6 41 284 287 1,550 978
4.71 4.71 1,780 2,820 4,470

267
h al
'Arrub
اؼغة 0 5
Kharas 50256
0
3,47
2
3,18
3
6,65
5
1,18
2 6,655 سبعاؽ 1,042 6.4 130 1,091
5,10
0 48 2.70 2.70 7,208 9,406 12,274
Umm
al Butm
50257
5 58 71 أ اجط 11 6.5 0 10 12 71 35 36
2.04 2.04 75 92 113
Hamrus
h
50258
0 39 53 دغف 7 7.6 3 12 8 53 22 31
3.11 3.11 58 79 107
Nuba 50258
5
2,21
8
2,11
8
4,33
6 4,336 ثب 730 5.9 92 757 817
3,17
8 3.16 3.16 4,760 6,494 8,860
Beit
Ula
50261
5
5,55
5
5,33
0
10,8
85
1,94
9 ث١ذ أال 1,712 6.4 271 1,847
10,88
5
7,56
3 49 3.71 3.71 12,141 17,474 25,150
Sa'ir 50262
0
9,12
9
8,91
6
18,0
45
3,05
9 ؿؼ١غ 2,699 6.7 418 3,043
18,04
5
13,1
71 50 3.20 3.20 19,833 27,172 37,227
Halhul 50263
0
11,2
74
10,8
54
22,1
28
4,55
0 دذي 3,961 5.6 638 3,555
22,12
8
15,6
58 51 3.52 3.52 24,547 34,690 49,025
Ash
Shuyuk
h
50263
5
4,50
3
4,30
8
8,81
1
1,75
4 8,811 ال١ر 1,438 6.1 278 1,468
5,98
6 52 3.94 3.94 9,894 14,564 21,437
Tarqum
iya
50264
0
7,39
8
6,95
9
14,3
57
2,49
2 رغل١ب 2,284 6.3 347 2,356
14,35
7
10,4
41 53 3.24 3.24 15,796 21,721 29,868
Beit
Kahil
50265
5
3,36
4
3,16
2
6,52
6
1,08
4 964 120 6.9 948
ث١ذ
وبد6,526
4,15
9 4.61 4.61 7,470 11,722 18,393
Beit
'Einun
50268
0 930 879
1,80
9 360 310 42 6.4 282
ث١ذ
ػ١1,809
1,73
1 0.44 0.44 1,833 1,916 2,002
Qla’a
Zeta
50268
1 456 447 903 194 103 8 5.7 158
لالع
ػ٠زب903 705
2.51 2.51 973 1,246 1,596
Idhna 50268
5
9,72
3
9,28
9
19,0
12
3,46
3 إطب 3,118 6.1 611 3,626
19,01
2
13,5
82 54 3.42 3.42 21,030 29,438 41,207
Taffuh 50275 5,38 5,21 10,5 1,94 10,59 رفح 1,759 6 254 1,432 7,06 55 4.14 4.14 11,968 17,950 26,924

268
0 5 2 97 8 7 5
Beit
Maqdu
m
50276
5
1,26
7
1,30
1
2,56
8 521 484 55 5.9 432
ث١ذ
مض2,568
1,86
7 56 3.24 3.24 2,826 3,887 5,346
Al
Baqa
50277
8 612 606
1,21
8 1,218 اجمؼ 193 6.3 2 155 244
1,05
2 1.48 1.48 1,273 1,474 1,706
Hebron
(Al
Khalil)
50278
0
84,2
23
78,9
23
163,
146
34,1
06
17,59
3
7,3
64 5.7
28,56
3 اش١
163,1
46
117,
962 57 3.30 3.30
179,81
5 248,692 343,950
Al
Bowere
h
(Aqabat
Injeleh)
50278
1 358 336 694 122 117 3 6.5 106
اج٠غ
)ػمجخ
اج١(
694 472
3.93 3.93 779 1,146 1,684
Khallet
Edar
50278
2
1,11
1
1,07
5
2,18
6 366 304 18 6.9 316
سخ
اضاع2,186
1,57
2 3.35 3.35 2,413 3,356 4,667
Deir
Samit
50281
0
3,16
6
3,07
1
6,23
7
1,18
3 1,028 134 5.9 1,057
ص٠غ
ؿبذ6,237
4,11
8 58 4.24 4.24 7,064 10,699 16,205
Bani
Na'im
50281
5
10,0
74
10,0
10
20,0
84
3,45
2 ث ؼ١ 3,067 6.5 429 3,333
20,08
4
13,4
48 59 4.09 4.09 22,652 33,830 50,523
Khallet
Al
Masafe
r
50283
0 96 121 217 38 38 0 5.6 39
سخ
اـبفغ217 166
2.72 2.72 235 307 402
Beit
'Awwa
50283
5
3,99
8
4,06
6
8,06
4
1,35
5 8,064 ث١ذ ػا 1,295 6.2 354 1,390
5,92
4 3.13 3.13 8,846 12,041 16,391
Dura 50284
0
14,3
63
13,9
05
28,2
68
5,57
1 صعا 4,832 5.9 994 4,557
28,26
8
18,7
67 60 4.18 4.18 31,964 48,147 72,521
Qalqas 50285
5 584 565
1,14
9 644 1,149 لمؾ 159 7.2 18 166 172
5.96 5.96 1,367 2,439 4,351

269
Sikka 50286
0 1,468 1,160 917 2.38 2.38 61 676 855 ؿىخ 149 5.7 20 158 162 855 453 402
Khirbet
Salama
50286
5 183 188 371 63 69 3 5.8 64
سغثخ
ؿالخ371 239
4.50 4.50 423 657 1,020
Wadi
'Ubeid
50287
0 64 66 130 20 24 3 6.2 21
اص
ػج١ض130 107
1.97 1.97 138 167 203
Fuqeiqi
s
50287
5 227 271 فم١م١ؾ 42 6.5 7 35 44 271 138 133
1.79 1.79 286 341 407
Khursa 50289
5
1,73
3
1,70
7
3,44
0 3,440 سغؿب 554 6.2 82 567 599
2,43
8 3.50 3.50 3,814 5,382 7,594
Tarram
a
50290
0 399 631 طغاخ 106 6 8 115 121 631 331 300
4.69 4.69 724 1,145 1,811
Al
Fawwar
Camp
50290
5
3,35
4
3,19
0
6,54
4
1,09
2 762 191 6.4 1,029
ش١
افاع6,544
4,78
4 3.18 3.18 7,189 9,834 13,451
Al
Majd
50291
0 970 955
1,92
5 1,925 اجض 315 6.1 57 333 335
1,49
3 62 2.57 2.57 2,078 2,679 3,454
Marah
al
Baqqar
50291
5 101 114 215 50 46 1 5.4 40
غاح
اجمبع215 139
4.46 4.46 245 379 586
Hadab
al
Fawwar
50292
0 964 954
1,91
8 347 262 24 6.2 308
دضة
أفاع1,918
1,31
5 3.85 3.85 2,148 3,133 4,570
Deir al
'Asal at
Tahta
50292
5 266 289 555 111 100 12 6.2 89
ص٠غ
اؼـ
ازذزب
555 433
2.51 2.51 598 766 982
Al
Heila
50293
5 641 636
1,27
7 707 1,277 اذ١خ 169 7.6 3 186 173
6.09 6.09 1,525 2,754 4,975
Wadi
ash
50294
0 361 354 715 122 109 6 5.9 121
اص
البجخ715 451 63 4.72 4.72 821 1,302 2,063

270
Shajina
As Sura 50295
0 975 950
1,92
5 1,925 اوغح 293 6.6 52 299 323
1,26
7 4.27 4.27 2,182 3,316 5,038
Deir
Razih
50295
5 135 133 268 50 47 2 6.2 43
ص٠غ
عاػح268 233
1.41 1.41 279 321 370
Ar
Rihiya
50296
0
2,06
6
1,88
3
3,94
9 3,949 اغ٠ذ١خ 511 7.7 36 472 519
2,47
4 4.79 4.79 4,544 7,253 11,577
Zif 50296
5 648 848 ػ٠ف 98 8.7 4 117 114 848 423 425
2.73 2.73 919 1,203 1,574
Deir al
'Asal al
Fauqa
50297
0 782 816
1,59
8 282 246 19 6.5 244
ص٠غ
اؼـ
افلب
1,598 1,31
3 1.98 1.98 1,695 2,063 2,511
Khallet
al
'Aqed
50297
5 141 131 272 54 62 7 6.5 42
سخ
اؼمض272 148
6.27 6.27 326 600 1,103
Imreish 50298
0 830 835
1,66
5 1,665 إغ٠ق 281 5.9 20 305 298
1,16
1 64 3.67 3.67 1,855 2,661 3,816
Al
Buweib
50300
5 381 607 اج٠ت 76 8 2 159 152 607 316 291
4.77 4.77 698 1,112 1,772
Beit ar
Rush at
Tahta
50301
0 187 186 373 74 74 11 6 62
ث١ذ
اغف
ازذزب
373 352
0.58 0.58 380 402 426
Hadab
al
'Alaqa
50304
0 309 332 641 119 124 20 5.8 111
دضة
اؼمخ641 381
5.34 5.34 749 1,261 2,121
Beit
Mirsim
50307
5 160 158 318 77 85 5 5.5 58
ث١ذ
غؿ318 238 65 2.94 2.94 347 463 619
Beit ar
Rush al
Fauqa
50309
0 519 460 979 158 162 15 6.5 151
ث١ذ
اغف
افلب
979 685
3.64 3.64 1,090 1,557 2,226

271
Karma 50309
5 721 665
1,38
6 966 1,386 وغخ 239 5.8 15 228 255
3.68 3.68 1,545 2,216 3,180
Beit
'Amra
50310
0
1,11
6
1,04
9
2,16
5 293 295 13 7.5 289
ث١ذ
ػغح2,165
1,20
6 6.03 6.03 2,580 4,632 8,316
Om
Adaraj
(Arab
Al
Ka’abn
eh)
50310
5 420 393 813 116 126 0
10.
7 76
أ اضعط
)ػغة
اىؼبث(
813 417
6.90 6.90 993 1,937 3,776
Wadi al
Kilab
50311
0 26 21 47 15 19 1 7.8 6
اص
اىالة47 23
7.41 7.41 58 119 243
Om
Ashoqh
an
50311
1 152 144 296 62 70 1 7.2 41
أ
المذب296 172
5.58 5.58 348 599 1,032
Khallet
al
Maiyya
50311
5 722 690
1,41
2 188 205 10 7.6 187
سخ
ا١خ1,412 900
4.61 4.61 1,616 2,536 3,978
Kheros
hewesh
Wal
Hadede
yah
50311
6 177 202 379 67 90 0 6.5 58
س١غك
٠ف
اذض٠ض
٠خ
379 245
4.46 4.46 432 668 1,034
Om Al
Amad
(Sahel
Wadi
Elma)
50311
7 83 69 152 38 50 2 5.2 29
أ اؼض
)ؿ
اص
ابء(
152 102
4.07 4.07 171 255 380
Yatta 50312
0
24,6
14
24,0
58
48,6
72
7,82
8 ٠طب 7,077 6.9 931 7,455
48,67
2
33,6
88 66 3.75 3.75 54,353 78,528 113,456

272
Ad
Deirat
50312
5 2,207 1,416 908 4.54 4.54 67 510 795 اض٠غاد 98 8.1 10 115 104 795 408 387
Khashe
m
Adaraj
(Al-
Hathale
en)
50312
6 309 297 606 113 112 0 6.5 93
سل
اضعط
)اظا١
)
606 467
2.64 2.64 655 850 1,103
Kurza 50313
5 554 771 وغػح 137 5.6 12 127 138 771 388 383
3.36 3.36 851 1,185 1,649
Rabud 50314
5
1,11
4
1,14
8
2,26
2 2,262 عاثص 372 6.1 18 360 385
1,62
0 68 3.39 3.39 2,500 3,491 4,875
Umm
Lasafa
50315
0 398 853 أ وفب 110 7.8 1 152 142 853 415 438
7.92 7.92 1,072 2,298 4,925
Al Burj 50317
0
1,30
7
1,27
1
2,57
8 2,578 اجغط 418 6.2 49 452 486
1,97
0 69 2.73 2.73 2,795 3,657 4,786
Um Al-
Khair
50321
0 319 516 ا اش١غ 69 7.5 3 100 102 516 260 256
4.93 4.93 596 964 1,560
Al
Karmil
50321
5
1,89
7
1,84
4
3,74
1 3,741 اىغ 552 6.8 36 726 673
2,08
2 6.04 6.04 4,460 8,014 14,400
Khallet
Salih
50322
5 563 530
1,09
3 206 222 2 6.6 166
سخ
هبخ1,093 592 70 6.32 6.32 1,314 2,426 4,478
Adh
Dhahiri
ya
50324
5
14,5
81
14,1
95
28,7
76
4,89
0 4,552 829 6.4 4,469
اظبغ
٠خ
28,77
6
20,4
34 71 3.48 3.48 31,888 44,907 63,239
At
Tuwani
50325
5 1,652 816 403 7.31 7.31 72 161 326 ازا 52 6.3 2 77 76 326 155 171
Ma'in 50326
0 169 459 ؼ١ 58 7.9 1 85 72 459 240 219
10.5
1 7.50 570 1,175 2,422
An 50326 463 441 419 0.50 3.47- 73 588 413 اجبصح 51 8.1 2 96 104 413 196 217

273
Najada 5
'Anab
al
Kabir
50329
5 162 173 335 59 63 0 6.7 50
ػبة
اىج١غ335 218
4.39 4.39 381 586 900
Khirbet
Asafi
50330
5 53 42 95 13 13 0 9.5 10
سغثخ
اهف95 73
2.67 2.67 103 134 174
Mantiq
at Shi'b
al Batin
50331
0 71 66 137 29 29 0 6 23
طمخ
كؼت
اجط
137 33
15.3
0 7.50 170 351 723
As
Samu'
50332
0
9,96
3
9,68
6
19,6
49
3,22
0 اـع 2,950 6.7 372 3,019
19,64
9
13,9
99 74 3.45 3.45 21,753 30,532 42,855
Wadi
Al
Amayer
50332
1 245 236 481 71 73 6 8.3 58
اص
اؼب٠غ481 378
2.44 2.44 517 658 837
Khirbet
Tawil
ash
Shih
50332
5 100 82 182 28 31 0 7.6 24
سغثخ
ط٠
ال١خ
182 133
3.19 3.19 200 274 374
Ar
Ramadi
n
50333
5
1,62
5
1,65
6
3,28
1 561 566 22 6.7 487
اغبض
٠ 3,281
2,17
9 4.18 4.18 3,710 5,586 8,411
Magha
yir al
'Abeed
50334
5 2 2 4 2 2 0 4 1
غب٠غ
اؼج١ض4 27
-
17.3
8
0.50 4 4 4
Khirbet
al
Fakheit
50335
0 114 117 231 57 57 0 5.6 41
سغثخ
افش١ذ231 42 75
18.5
9 7.50 287 591 1,219
Khirbet
Bir al
'Idd
50336
0 65 54 119 40 41 0 5.2 23
سغثخ
ث١غ اؼض119 178 76 -3.95 0.50 121 127 133

274
Khirbet
Zanuta
50337
5 32 28 60 16 16 0 4.6 13
سغثخ
ػرخ60 6
25.8
9 7.50 75 154 317
Imneizi
l
50338
0 190 390 إ١ؼي 49 8 0 55 59 390 186 204
7.46 7.46 484 993 2,039
'Arab al
Fureijat
50340
5 260 312 572 104 100 2 6.7 85
ػغة
افغ٠جب
د
572 338 77 5.40 5.40 670 1,133 1,918
Total
Hebro
n Gov.
281,
570
270,
594
552,
164
103,
086
80,44
8
16,
447 6.1
89,91
9
يجوع
يحافظة
انخهيم
552,1
64
389,
716 3.88
613,53
8 874,304
1,251,9
89
Total
West
Bank
1,19
3,24
4
1,15
7,33
9
2,35
0,58
3
456,
314
319,2
70
77,
639 5.5
427,0
97
يجوع
انضفة
انغربية
2,350
,583
1,58
2,70
9
2,329,
965
3,195,7
33
4,468,4
05

275
* Comment on Community:
Comment No.
Community Code
Community Name
Actual Population 1997
اؿ ازجغ
1
Population of Faqqu'a in 2007 include
10,060 Faqqu'a 2,570 فمػخ
10,065 Khirbet Abu 'Anqar 11 سغثخ أث ػمغ
10,100 Barghasha 54 ثغغلخ
Total 2,635 اجع
2
Population of Barta'a ash Sharqiya in 2007 include
10,120 Barta'a ash Sharqiya
ثغطؼخ الغل١خ 2,653
10,130 Khirbet ash Sheikh Sa'eed
161 سغثخ ال١ز
ؿؼ١ض
Total 2,814 اجع
3
Population of Beit Qad in 2007 include
10,140 Beit Qad 642 ث١ذ لبص
10,160 Umm Qabub 68 أ لبثة
10,110 Mashru' Beit Qad 285 لغع ث١ذ لبص
Total 995 اجع
4
Population of Jenin in 2007 include
10,180 Jenin 26,332 ج١
10,075 Dahiyat Sabah al Kheir
1,073 ضبد١خ هجبح
اش١غ
10,270 'Arab as Suweitat 370 ػغة
اـ٠طبد
Total 27,775 اجع
5
Population of Kafr Qud in 2007 include
10,210 Kafr Qud 668 وفغ لص
10,260 Al Manshiya 117 ال١خ
Total 785 اجع
6
Population of Zabda in 2007 include
10,245 Zabda 612 ػثضح
10,255 Qeiqis 99 ل١من
)اموع(
Total 711 اجع
7
Population of Qabatiya in 2007 include
10,340 Qabatiya 14,502 لجبط١خ
10,280 Khirbet Sab'ein 22 سغثخ ؿجؼ١
Total 14,524 اجع
8
Population of Arraba in 2007 include
10,370 Arraba 7,356 ػغاثخ
10,365 Ad Damayra 218 اضب٠غح
Total 7,574 اجع

276
9
Population of Telfit in 2007 include
10,385 Telfit 82 رف١ذ
10,325 Tannin 39 ر١
Total 121 اجع
10
Population of Raba in 2007 include
10,405 Raba 2,237 عاثب
10,375 Khirbet Marah ar Raha
10 سغثخ غاح
اغ
10,390 Khirbet Kharruba 23 سغثخ سغثخ
Total 2,270 اجع
11
Population of Sir in 2007 include
10,495 Sir 566 ه١غ
10,540 Mantiqat al Heish 19 طمخ ا١ق
Total 585 اجع
12
Population of Kardala in 2007 include
50,455 Kardala 119 وغصخ
50,470 Khirbet Tell el Himma
سغثخ ر اذخ 91
Total 210 اجع
13
Population of Khirbet Humsa in 2007 include
50,871 Khirbet Humsa 17 سغثخ دوخ
50,851 Al Hadidiya 132 اذض٠ضح
Total 149 اجع
14
Population of Baqa ash Sharqiya in 2007 include
100,350 Baqa ash Sharqiya 3,015 ثبلخ الغل١خ
100,360 Nazlat Abu Nar 144 ؼخ أث بع
Total 3,159 اجع
15
Population of Tulkarm in 2007 include
100,645 Tulkarm 33,505 طىغ
100,640 Dhinnaba 6,215 طبثخ
100,675 Khirbet at Tayyah 257 سغثخ اط١بح
Total 39,977 اجع
16
Population of Anabta in 2007 include
100,665 Anabta 5,391 ػجزب
100,630 Kafr Rumman 641 عبوفغ
Total 6,032 اجع
17
Population of Kafr al Labad in 2007 include
100,690 Kafr al Labad 2,970 وفغ اجض
100,655 'Izbat Abu Khameish
37 ػؼثخ أث
س١ق
100,685 'Izbat al Khilal 69 ػؼثخ اشالي
Total 3,076 اجع
18 Population of Shufa in 2007 include
100,760 Shufa 924 كفخ

277
100,725 'Izbat Shufa 726 ػؼثخ كفخ
Total 1,650 اجع
19
Population of Burqa in 2007 include
150,680 Burqa 2,973 ثغلخ
150,750 Al Mas'udiya 14 اـؼص٠خ
Total 2,987 اجع
20
Population of Al 'Aqrabaniya in 2007 include
150,840 Al 'Aqrabaniya 660 اؼمغثب١خ
150,850 Kirbet Tall al Ghar 9 سغثخ ر اغبع
150,940 Shihda wa Hamlan 34 كذض ال
Total 703 اجع
21
Population of Nablus in 2007 include
150,920 Nablus 98,919 بثؾ
150,890 Al Juneid 285 اج١ض
Total 99,204 اجع
22
Population of Al Ar Rajman in 2007 include
151,220 Ar Rajman 1 اغجب
151,176 Khirbet Tana 15 سغثخ طبب
151,235 Jafa an Nun 13 جفب ا
151,240 Ad Dawa 0 اضا
Total 29 اجع
23
Population of Qaryut in 2007 include
151,410 Qaryut 1,821 لغ٠د
151,450 Khirbet Sarra 25 سغثخ هغح
Total 1,846 اجع
24
Population of Duma in 2007 include
151,445 Duma 1,637 صب
151,465 Khirbet al Marajim 6 سغثخ اغاد
Total 1,643 اجع
25
Population of Khirbet Sir in 2007 include
200,995 Khirbet Sir 377 سغثخ ه١غ
200,980 'Izbat Abu Hamada 3 ػؼثخ أث دبصح
Total 380 اجع
26
Population of 'Izbat at Tabib in 2007 include
201,075 Izbat at Tabib 148 ػؼثخ اطج١ت
201,060 Mahattat Tahseen Mansur
19 رذـ١ ذطخ
وع
Total 167 اجع
27
Population of Deir Istiya in 2007 include
251,250 Deir Istiya 2,766 ص٠غ إؿز١ب
251,150 Wadi Qana 52 اص لبب
Total 2,818 اجع
28 Population of Haris in 2007 include
251,310 Haris 2,201 دبعؽ

278
251,350 Dar Abu Basal 4 صاع أث ثو
Total 2,205 اجع
29
Population of Kafr ad Dik in 2007 include
251,425 Kafr ad Dik 3,698 وفغ اض٠ه
251,390 Khirbet Susa 10 سغثخ ؿؿخ
Total 3,708 اجع
30
Population of Bani Zeid ash Sharqiya in 2007 include
301,460 Mazari' an Nubani 1,753 ؼاعع اثب
301,475 'Arura 2,072 ػبععح
Total 3,825 اجع
31
Population of Kafr Malik in 2007 include
301,590 Kafr Malik 2,098 وفغ به
301,580 'Ein Samiya 122 ػ١ ؿب١خ
Total 2,220 اجع
32
Population of AL-Itihad in 2007 include
301,620 Beitillu 2,152 ث١ز
301,630 Jammala 1,015 جبال
301,655 Deir 'Ammar 1,686 ص٠غ ػبع
Total 4,853 اجع
33
Population of AL-Zaytouneh in 2007 include
301,695 Al Mazra'a al Qibliya
اؼعػخ امج١خ 2,964
301,670 Abu Shukheidim 1,299 أث كش١ض
Total 4,263 اجع
34
Population of Beituniya in 2007 include
301,825 Beituniya 9,268 ث١ز١ب
301,795 Khirbet Kafr Sheiyan
سغثخ ومغ ك١ب 25
Total 9,293 اجع
35
Population of Jericho (Ariha) in 2007 include
351,920 Jericho (Ariha) 14,551 أع٠ذب
351,880 Deir Quruntul 3 ص٠غ امغط
351,905 'Ein ad Duyuk at Tahta
689 ػ١ اض٠ن
ازذزب
Total 15,243 اجع
36
Population of Jericho (Ariha) in 2007 include
452,180 Al 'Ubeidiya 6,195 اؼج١ض٠خ
452,215 Wadi al 'Arayis 1,570 اص اؼغا٠ؾ
Total 7,765 اجع
37
Population of Dar Salah in 2007 include
452,225 Dar Salah 721 صاع هالح
452,220 Al Hujeila 74 اذج١١خ
452,245 Juhdum 1,007 جض
452,250 Umm al Qasseis 264 أ امـ١ؾ

279
452,260 Umm 'Asla 117 ػـخ أ
Total 2,183 اجع
38
Population of Hindaza in 2007 include
452,280 Hindaza 1,555 ضاػح
452,315 Khallet Hamad 344 سخ دض
452,320 Bureid'a 240 ثغ٠ضؼخ
452,310 Wadi Umm Qal'a 192 اص أ لؼخ
452,305 Dhahrat an Nada 290 ظغح اض
Total 2,621 اجع
39
Population of Ash Shawawra in 2007 include
452,285 Ash Shawawra 1,912 الاعح
452,290 Ras al Wad 569 عاؽ ااص
452,330 Al Khushna 49 اشلخ
452,295 Fakht al Jul 185 فشذ اجي
Total 2,715 اجع
40
Population of Za'tara in 2007 include
452,360 Za'tara 3,890 ػػزغح
452,375 Al Fureidis 518 فغ٠ضؽ
Total 4,408 اجع
41
Population of Jannatah in 2007 include
452,385 Jannatah
368 جبرخ )ث١ذ
فح(452,350 Rakhme 671 عسخ
452,365 Al 'Asakira 724 اؼـبوغح
452,395 Khallet al Qaranin 101 سخ امغا١
452,410 Al 'Iqab 645 اؼمبة
452,420 Harmala 548 دغخ
452,425 Abu Nujeim 566 أث ج١
Total 3,623 اجع
42
Population of Wadi Rahhal in 2007 include
452,400 Wadi Rahhal 413 اص عدبي
452,380 Al Beida 253 اج١ضب
452,370 Ath Thabra 179 اضجغح
452,340 Khirbet an Nahla 27 سغثخ اذخ
Total 872 اجع
43
Population of Khallet Sakariya in 2007 include
452,415 Khallet Sakariya 72 سخ ؿىبع٠ب
452,390 Khallet al Balluta 123 سخ اجطخ
Total 195 اجع
44
Population of Tuqu' in 2007 include
452,495 Tuqu' 4,827 رمع
452,455 Khirbet ad Deir 1,132 سغثخ اض٠غ
452,475 Al Halqum 130 اذم
452,520 Khirbet Tuqu' 76 سغثخ رمع

280
Total 6,165 اجع
45
Population of Al Maniya in 2007 include
452,535 Al Maniya 564 ا١خ
452,510 Wadi Muhammad 87 اص ذض
Total 651 اجع
46
Population of 'Arab ar Rashayida in 2007 include
452,660 Arab ar Rashayida 777 ػغة اغكب٠ضح
452,670 Al 'Azazima 59 اؼؼاػخ
452,715 Ar Rawa'in 111 اغاػ١
Total 947 اجع
47
Population of Beit Ummar in 2007 include
502,540 Beit Ummar 8,987 ث١ذ أغ
502,485 Safa 785 هبفب
502,505 Khirbet al Mantara 95 سغثخ اطغح
Total 9,867 اجع
48
Population of Kharas in 2007 include
502,560 Kharas 5,056 سبعاؽ
502,515 Khirbet Mushrif 44 سغثخ لغف
)ػظاة(Total 5,100 اجع
49
Population of Beit Ula in 2007 include
502,615 Beit Ula 6,726 ث١ذ أال
502,570 Qila 651 ل١ال
502,600 Ras al Jora 186 عاؽ اجعح
Total 7,563 اجع
50
Population of Sa'ir in 2007 include
502,620 Sa'ir 9,545 ؿؼ١غ
502,590 'Irqan Turad 361 ػغلب طغاص
502,595 Kuziba 338 وػ٠جب
502,610 Shamaliyyat al Hawa
كب١خ ا 67
502,665 Ras at Tawil 470 عاؽ اط٠
502,690 Ad Duwwara 1,196 اضاعح
502,725 Wadi ar Rim 68 اص اغ٠
502,735 Qinan an Namir 80 لب اغ
502,720 Al 'Uddeisa 1,046 اؼض٠ـخ
Total 13,171 اجع
51
Population of Halhul in 2007 include
502,630 Halhul 15,477 دذي
502,605 Al Baqqar 27 اجمبع
502,675 Khirbet al Hasaka 154 سغثخ اذـىخ
Total 15,658 اجع
52 Population of Ash Shuyukh in 2007 include
502,635 Ash Shuyukh 5,063 ال١ر

281
502,650 Qafan al Khamis 923 لفب اش١ؾ
Total 5,986 اجع
53
Population of Tarqumiya in 2007 include
502,640 Tarqumiya 10,429 رغل١ب
502,625 Khirbet Jamrura 12 سغثخ جغعح
Total 10,441 اجع
54
Population of Idhna in 2007 include
502,685 Idhna 13,364 إطب
502,645 Bir Musallam 135 ث١غ ـ
502,730 Suba 83 ؿثب
Total 13,582 اجع
55
Population of Taffuh in 2007 include
502,750 Taffuh 6,962 رفح
502,710 Al Khamajat 103 اشجبد
Total 7,065 اجع
56
Population of Beit Maqdum in 2007 include
502,765 Beit Maqdum 507 ث١ذ مض
502,770 Al Kum 945 اى
502,795 Al Muwarraq 415 اعق
Total 1,867 اجع
57
Population of Hebron (Al Khalil) in 2007 include
502,780 Hebron (Al Khalil) 117,839 اش١
502,880 Birin 123 ث١غ٠
Total 117,962 اجع
58
Population of Idhna in 2007 include
502,810 Deir Samit 4,066 ص٠غ ؿبذ
502,800 Tarusa 39 طبعؿخ
502,785 Humsa 13 دوخ
Total 4,118 اجع
59
Population of Bani Na'im in 2007 include
502,815 Bani Na'im 13,404 ث ؼ١
502,705 Jurun al Louz 44 جغ اػ
Total 13,448 اجع
60
Population of Dura in 2007 include
502,840 Dura 15,300 صعا
502,820 Rafada 303 عفبصح
502,845 Wadih 48 اضخ
502,850 At Tabaqa 1,018 اطجمخ
502,805 Kureise 1,616 وغ٠ـخ
502,885 Al Hijra 482 اجغح
Total 18,767 اجع
61
Population of Sikka in 2007 include
502,860 Sikka 572 ؿىخ
502,890 Tawas 104 طاؽ

282
Total 676 اجع
62
Population of Al Majd in 2007 include
502,910 Al Majd 1,292 اجض
502,930 Khirbet Abu Hamid 83 سغثخ أث دبض
502,985 Iskeik 118 إؿى١ه
Total 1,493 اجع
63
Population of Wadi ash Shajina in 2007 include
502,940 Wadi ash Shajina 404 اص البجخ
503,015 Khirbet Bism 47 سغثخ ثـ
Total 451 اجع
64
Population of Imreish in 2007 include
502,980 Imreish 880 إغ٠ق
503,000 'Abda 126 ػجضح
503,025 Al 'Alaqa al Fauqa 67 اؼمخ افلب
503,050 Al 'Alaqa at Tahta 88 ازذزباؼمخ
Total 1,161 اجع
65
Population of Beit Mirsim in 2007 include
503,075 Beit Mirsim 204 ث١ذ غؿ
503,055 Abu Suhweila 34 أث ؿذ١خ
Total 238 اجع
66
Population of Yatta in 2007 include
503,120 Yatta 30,420 ٠طب
502,995 Biyar al 'Arus 650 ث١بع اؼغؽ
503,020 Ad Duweir 490 اض٠غ
503,060 Qinan an Najma 114 لب اجخ
503,070 Qurnet ar Ras 194 لغخ اغاؽ
503,085 Khurisa 29 سغ٠ـخ
503,175 Al Muntar 283 اطبع
503,190 I'zeiz 507 إػؼ٠ؼ
503,030 Wadi as Sada 156 اـبصحاص
503,035 Khallet 'Arabi 137 سخ اؼغث
502,990 Hureiz 708 دغ٠ؼ
Total 33,688 اجع
67
Population of Ad Deirat in 2007 include
503,125 Ad Deirat 279 اض٠غاد
503,080 Ar Rifa'iyya 231 اغفبػ١خ
Total 510 اجع
68
Population of Rabud in 2007 include
503,145 Rabud 433 عاثص
503,160 Abu al Ghuzlan 402 أث اغؼال
503,155 Abu al 'Asja 443 أث اؼـجب
503,185 Abu al 'Urqan 342 أث اؼغلب
Total 1,620 اجع
69 Population of Al Burj in 2007 include

283
503,170 Al Burj 1,749 اجغط
503,165 Al Bira 221 اج١غح
Total 1,970 اجع
70
Population of Khallet Salih in 2007 include
503,225 Khallet Salih 300 سخ هبخ
503,220 Qinan Jaber 292 لب ججغ
Total 592 اجع
71
Population of Adh Dhahiriya in 2007 include
503,245 Adh Dhahiriya 20,279 اظبغ٠خ
503,270 Khirbet Deir Shams
42 سغثخ ص٠غ
الؾ
503,285 Khirbet Shuweika 86 سغثخ ك٠ىخ
503,195 Juwai & Kafr Jul 0 ج وفغجي
503,235 Somara 27 ؿغح
Total 20,434 اجع
72
Population of At Tuwani in 2007 include
503,255 At Tuwani 76 ازا
503,280 Ar Rakeez 0 اغو١ؼ
503,315 Qawawis 37 لا٠ؾ
503,290 Khirbet Sarura 48 سغثخ هبععح
Total 161 اجع
73
Population of An Najada in 2007 include
503,265 An Najada 168 اجبصح
503,130 Khashem al Karem 420 اىغ سل
Total 588 اجع
74
Population of As Samu' in 2007 include
503,320 As Samu' 12,743 اـع
503,230 As Simiya 1,210 اـ١١ب
503,385 Khirbet al Kharaba 2 سغثخ اشغاثخ
503,395 Khirbet Ghuwein al Fauqa
44 سغثخ ػ٠
افلب
Total 13,999 اجع
75
Population of Khirbet al Fakheit in 2007 include
503,350 Khirbet al Fakheit 20 سغثخ افش١ذ
503,330 Khirbet at Tabban 22 سغثخ ازجب
503,340 Khirbet al Majaz 0 سغثخ اجبػ
Total 42 اجع
76
Population of Khirbet Bir al 'Idd in 2007 include
503,360 Khirbet Bir al 'Idd 104 سغثخ ث١غ اؼض
503,355 Khirbet at Tawamin
سغثخ ازا١ 24
503,365 Haribat an Nabi 50 غ٠جخ اج
Total 178 اجع
77 Population of 'Arab al Fureijat in 2007 include

284
503,405 Arab al Fureijat 302 افغ٠جبدػغة
503,400 Khirbet ar Rahwa 36 سغثخ اغح
Total 338 اجع

285
ANNEX A
MEMBERS OF THE ENVIRONMENTAL ASSESSMENT COMMITTEE

286
ANNEX B
EXCEL PROGRAM RESULTS

287
Rating for each criteria Sheet:
No. Locality Name
Demography Water consumption
Actual Population
2007
Actual Population
1997*
Actual Growth-Rate
(2007-1997)**
Projected Population
2030***
score
Water consumption (L/day/cap)*
score
1 Silat al Harithiya 9,422 7,246 2.66 17,236 0.76 111 5
2 Al Yamun 16,383 12,255 2.95 31,943 1.41 77 4
3 Kafr Dan 5,148 3,766 3.18 10,565 0.47 57 3
4 Deir Abu Da'if 5,572 3,897 3.64 12,681 0.56 66 4
5 Birqin 5,685 4,344 2.73 10,555 0.47 78 4
6 Ya'bad 13,640 10,625 2.53 24,229 1.07 54 2
7 Qabatiya 19,197 14,524 2.83 36,465 1.61 68 4
8 Arraba 9,920 7,574 2.74 18,452 0.81 64 3
9 Kafr Ra'i 7,364 5,758 2.49 12,967 0.57 72 4
10 Meithalun 6,955 5,159 3.03 13,825 0.61 58 3
11 Jaba' 8,492 6,409 2.85 16,222 0.71 64 3
12 El Far'a Camp 5,712 4,152 3.24 11,896 0.52 45 2
13 Tammun 10,795 7,540 3.65 24,642 1.09 82 4
14 Qaffin 8,387 6,440 2.68 15,398 0.68 85 4
15 'Attil 9,038 7,661 1.67 13,218 0.58 90 4
16 Deir al Ghusun 8,242 6,969 1.69 12,123 0.53 96 5
17 Bal'a 6,604 5,373 2.08 10,614 0.47 76 4
18 'Asira ash Shamaliya 7,556 5,724 2.82 14,310 0.63 65 3
19 'Awarta 5,623 4,286 2.75 10,500 0.46 83 4
20 Huwwara 5,570 4,275 2.68 10,237 0.45 66 4

288
21 Beita 9,079 6,478 3.43 19,734 0.87 56 3
22 Jamma'in 6,225 4,263 3.86 14,870 0.66 62 3
23 Aqraba 8,180 5,849 3.41 17,693 0.78 106 5
24 Qabalan 7,130 5,346 2.92 13,827 0.61 33 1
25 'Azzun 7,821 5,794 3.05 15,592 0.69 140 5
26 Biddya 8,064 5,982 3.03 16,028 0.71 53 2
27 Sinjil 5,236 3,883 3.03 10,414 0.46 46 2
28 Shuqba 4,497 3,027 4.04 11,177 0.49 24 1
29 Qibya 4,901 3,441 3.60 11,055 0.49 56 3
30 Al Jalazun Camp 7,813 6,064 2.57 13,994 0.62 94 5
31 Kharbatha al Misbah 5,211 3,662 3.59 11,730 0.52 57 3
32 Beit Liqya 7,710 5,634 3.19 15,864 0.70 52 2
33 Ar Ram & Dahiyat al
Bareed 20,359 18,719 0.84 24,697 1.09
55 2
34 Biddu 6,798 4,657 3.86 16,226 0.72 68 4
35 Hizma 6,271 4,459 3.47 13,739 0.61 67 4
36 'Anata 12,049 7,037 5.53 41,509 1.83 88 4
37 Al 'Eizariya 17,606 12,724 3.30 37,157 1.64 108 5
38 Abu Dis 10,782 8,858 1.99 16,945 0.75 98 5
39 As Sawahira ash
Sharqiya 5,800 3,810 4.29 15,247 0.67
102 5
40 Al 'Ubeidiya 10,753 7,765 3.31 22,736 1.00 45 2
41 Husan 5,551 4,131 3.00 10,952 0.48 45 2
42 Nahhalin 6,827 4,638 3.94 16,611 0.73 55 2
43 Za'tara 6,289 4,408 3.62 14,242 0.63 40 1
44 Jannatah 5,416 3,623 4.10 13,655 0.60 45 2
45 Tuqu' 8,881 6,165 3.72 20,563 0.91 50 2

289
46 Beit Fajjar 11,004 7,896 3.37 23,609 1.04 60 3
47 Surif 13,365 9,541 3.43 29,016 1.28 30 1
48 Beit Ummar 13,548 9,867 3.22 28,091 1.24 50 2
49 Kharas 6,655 5,100 2.70 12,274 0.54 42 1
50 Beit Ula 10,885 7,563 3.71 25,150 1.11 35 1
51 Sa'ir 18,045 13,171 3.20 37,227 1.64 30 1
52 Halhul 22,128 15,658 3.52 49,025 2.16 35 1
53 Ash Shuyukh 8,811 5,986 3.94 21,437 0.94 45 2
54 Tarqumiya 14,357 10,441 3.24 29,868 1.32 40 1
55 Beit Kahil 6,526 4,159 4.61 18,393 0.81 50 2
56 Idhna 19,012 13,582 3.42 41,207 1.82 45 2
57 Taffuh 10,597 7,065 4.14 26,924 1.19 30 1
58 Deir Samit 6,237 4,118 4.24 16,205 0.71 55 2
59 Bani Na'im 20,084 13,448 4.09 50,523 2.23 42 1
60 Beit 'Awwa 8,064 5,924 3.13 16,391 0.72 25 1
61 Dura 28,268 18,767 4.18 72,521 3.20 50 2
62 Yatta 48,672 33,688 3.75 113,456 5.00 30 1
63 Adh Dhahiriya 28,776 20,434 3.48 63,239 2.79 55 2
64 As Samu' 19,649 13,999 3.45 42,855 1.89 60 3
113,456

290
Note
* From PCBS
* Water consumption (PWA, 2005)
** Actual Growth-Rate= (population 2007 / Population 1997)(1/10) - 1
*** Expected population in (2030) = Population
in (2007)* (1+r)^23
Rating-Equation
>=L/day/cap score
adjustable
Ds = 5 x P/ Ph (highest population)
0 1
45 2
56 3
66 4
91 5
Rating 1 point: < 45L/day/cap
2 points: 45 - 55L/day/cap
3 points: 56 - 65L/day/cap
4 points: 66 - 90L/day/cap
5 points: > 91 L/day/cap

291
No. Locality Name
Reuse Environmental factor
Agricultural land value* score
Hydrological vulnerability to Grounwater*
score
springs or wells in the
region** score
Total Score
1 Silat al Harithiya High 5 High 3 No 1 4
2 Al Yamun High 5 Low 1 Yes 2 3
3 Kafr Dan High 5 Medium 2 Yes 2 4
4 Deir Abu Da'if High 5 High 3 No 1 4
5 Birqin Medium 3 Low 1 Yes 2 3
6 Ya'bad Medium 3 Medium 2 Yes 2 4
7 Qabatiya Medium+High 4 High 3 Yes 2 5
8 Arraba Medium+High 4 Low 1 Yes 2 3
9 Kafr Ra'i Low+Medium 2 Medium 2 No 1 3
10 Meithalun low+Medium+High 3 High 3 No 1 4
11 Jaba' Medium 3 High 3 Yes 2 5
12 El Far'a Camp High 5 High 3 Yes 2 5
13 Tammun Low 1 Low 1 Yes 2 3
14 Qaffin Medium 3 Low 1 Yes 2 3
15 'Attil High 5 Medium 2 Yes 2 4
16 Deir al Ghusun High 5 Low 1 Yes 2 3
17 Bal'a Low+Medium 2 Medium 2 Yes 2 4
18 'Asira ash Shamaliya
Low 1
High 3 No 1 4
19 'Awarta Low+Medium+High 3 Low 1 Yes 2 3
20 Huwwara Low+Medium 2 Low 1 Yes 2 3
21 Beita Low+Medium 2 Medium 2 No 1 3
22 Jamma'in Low+Medium 2 High 3 No 1 4
23 Aqraba Low+Medium 2 High 3 Yes 2 5

292
24 Qabalan Low+Medium 2 High 3 No 1 4
25 'Azzun Low+Medium 2 Medium 2 Yes 2 4
26 Biddya Low+Medium 2 High 3 No 1 4
27 Sinjil Low+Medium 2 High 3 Yes 2 5
28 Shuqba Low+Medium 2 High 3 Yes 2 5
29 Qibya Low+Medium 2 High 3 No 1 4
30 Al Jalazun Camp Low+High 3 High 3 No 1 4
31 Kharbatha al
Misbah Medium
3 Low 1 No 1 2
32 Beit Liqya Medium+High 4 Medium 2 Yes 2 4
33 Ar Ram & Dahiyat al
Bareed Low
1 High 3 No 1 4
34 Biddu Medium 3 High 3 No 1 4
35 Hizma Low 1 High 3 Yes 2 5
36 'Anata Low 1 High 3 No 1 4
37 Al 'Eizariya Low 1 Low 1 Yes 2 3
38 Abu Dis Low 1 Low 1 No 1 2
39 As Sawahira ash
Sharqiya Low
1 Low 1 Yes 2 3
40 Al 'Ubeidiya Low 1 Low 1 No 1 2
41 Husan Medium 3 High 3 Yes 2 5
42 Nahhalin Medium 3 High 3 Yes 2 5
43 Za'tara Low+Medium 2 Low 1 Yes 2 3
44 Jannatah Low+Medium 2 Medium 2 No 1 3
45 Tuqu' Low+Medium 2 High 3 Yes 2 5
46 Beit Fajjar Low+Medium 2 High 3 Yes 2 5
47 Surif Low 1 High 3 No 1 4
48 Beit Ummar Low+Medium 2 High 3 Yes 2 5

293
49 Kharas Low 1 High 3 No 1 4
50 Beit Ula Low 1 Medium 2 No 1 3
51 Sa'ir Low+Medium 2 High 3 Yes 2 5
52 Halhul Low+Medium 2 High 3 Yes 2 5
53 Ash Shuyukh Low 1 High 3 Yes 2 5
54 Tarqumiya Low 1 High 3 No 1 4
55 Beit Kahil Low+Medium 2 High 3 Yes 2 5
56 Idhna Low 1 Low 1 Yes 2 3
57 Taffuh Low+Medium 2 High 3 Yes 2 5
58 Deir Samit Low+Medium 2 Low 1 No 1 2
59 Bani Na'im Low 1 Low 1 Yes 2 3
60 Beit 'Awwa Low+Medium 2 Low 1 No 1 2
61 Dura Low 1 High 3 Yes 2 5
62 Yatta Low 1 Medium 2 Yes 2 4
63 Adh Dhahiriya Low+Medium+High 3 Low 1 No 1 2
64 As Samu' Low 1 Low 1 Yes 2 3
Note
* Agricultural land map (published by MoA)
* hydrological vulnerability map (published by UNEP in cooperation with the EQA, 2002)
** GIS database
Rating-Equation
Agricultural land value score Hydrological
vulnerability to Grounwater
score springs or
wells in the region
score
adjustable Low 1 Low 1 No 1
Low+Medium 2 Medium 2 Yes 2
Medium 3 High 3
Low+Medium+High 3
Low+High 3
Medium+High 4
High 5

294
Rating 1 points: Low-value agricultural land 1 point: No springs and wells in the region
3 points: Medium -value agricultural land 2 points: >= 1 springs or wells in the region
5 points: High-value agricultural land 1 point: Low hydrological vulnerability
2 points: Medium hydrological vulnerability
3 points: High hydrological vulnerability
No. Locality Name
Operation body Risk for Industrial Waste
Rank of municipality-
MoLG* score
Rank of municipality-
MDLF** score
Total Score
olive presses
*
stonecutters*
textiles*
Total score
1 Silat al Harithiya C 1.5 C 2 3.5 1 2 0 3 4
2 Al Yamun B 2 C 2 4 4 3 0 7 3
3 Kafr Dan Village Council 0.5 C 2 2.5 1 0 0 1 4
4 Deir Abu Da'if Village Council 0.5 C 2 2.5 1 0 0 1 4
5 Birqin C 1.5 C 2 3.5 3 0 0 3 4
6 Ya'bad B 2 C 2 4 2 0 0 2 4
7 Qabatiya B 2 C 2 4 4 64 0 68 1
8 Arraba B 2 C 2 4 5 3 0 8 3
9 Kafr Ra'i C 1.5 C 2 3.5 5 1 0 6 3
10 Meithalun C 1.5 C 2 3.5 2 2 0 4 4
11 Jaba' C 1.5 C 2 3.5 2 1 0 3 4
12 El Far'a Camp Projects Committee 0.5 C 2 2.5 0 0 0 0 5
13 Tammun C 1.5 C 2 3.5 0 5 0 5 3
14 Qaffin C 1.5 C 2 3.5 3 2 0 5 3
15 'Attil C 1.5 C 2 3.5 2 3 0 5 3
16 Deir al Ghusun C 1.5 C 2 3.5 4 1 0 5 3
17 Bal'a C 1.5 C 2 3.5 2 1 0 3 4
18 'Asira ash Shamaliya
C 1.5 C 2 3.5
3 2 0 5 3
19 'Awarta Village Council 0.5 C 2 2.5 2 0 0 2 4

295
20 Huwwara C 1.5 C 2 3.5 0 2 0 2 4
21 Beita C 1.5 C 2 3.5 5 0 0 5 3
22 Jamma'in C 1.5 C 2 3.5 2 30 0 32 1
23 Aqraba C 1.5 C 2 3.5 2 2 0 4 4
24 Qabalan C 1.5 C 2 3.5 3 1 0 4 4
25 'Azzun C 1.5 C 2 3.5 2 0 0 2 4
26 Biddya C 1.5 C 2 3.5 5 0 0 5 3
27 Sinjil C 1.5 E 1 2.5 0 0 0 0 5
28 Shuqba Village Council 0.5 C 2 2.5 1 1 0 2 4
29 Qibya Village Council 0.5 C 2 2.5 0 1 0 1 4
30 Al Jalazun Camp Projects Committee 0.5 C 2 2.5 0 0 0 0 5
31 Kharbatha al
Misbah Village Council 0.5 C 2 2.5
2 2 0 4 4
32 Beit Liqya C 1.5 C 2 3.5 1 2 0 3 4
33 Ar Ram & Dahiyat
al Bareed C 1.5 C 2 3.5
1 4 0 5 3
34 Biddu C 1.5 C 2 3.5 2 3 0 5 3
35 Hizma Village Council 0.5 C 2 2.5 0 5 0 5 3
36 'Anata C 1.5 E 1 2.5 0 11 0 11 2
37 Al 'Eizariya C 1.5 C 2 3.5 0 0 1 1 4
38 Abu Dis C 1.5 C 2 3.5 0 0 0 0 5
39 As Sawahira ash
Sharqiya C 1.5 C 2 3.5
0 0 0 0 5
40 Al 'Ubeidiya C 1.5 C 2 3.5 0 0 0 0 5
41 Husan Village Council 0.5 C 2 2.5 0 0 0 0 5
42 Nahhalin Village Council 0.5 C 2 2.5 0 0 0 0 5
43 Za'tara C 1.5 C 2 3.5 0 0 0 0 5
44 Jannatah D 1 C 2 3 0 0 0 0 5
45 Tuqu' C 1.5 C 2 3.5 0 1 0 1 4

296
46 Beit Fajjar C 1.5 C 2 3.5 0 182 0 182 1
47 Surif C 1.5 C 2 3.5 2 2 0 4 4
48 Beit Ummar C 1.5 C 2 3.5 0 15 0 15 2
49 Kharas C 1.5 C 2 3.5 2 2 0 4 4
50 Beit Ula C 1.5 C 2 3.5 1 0 0 1 4
51 Sa'ir B 2 C 2 4 2 12 0 14 2
52 Halhul B 2 C 2 4 0 9 0 9 3
53 Ash Shuyukh C 1.5 C 2 3.5 0 15 0 15 2
54 Tarqumiya C 1.5 C 2 3.5 1 5 0 6 3
55 Beit Kahil Village Council 0.5 C 2 2.5 0 0 0 0 5
56 Idhna B 2 B 2.5 4.5 3 6 0 9 3
57 Taffuh C 1.5 C 2 3.5 0 0 0 0 5
58 Deir Samit C 1.5 C 2 3.5 1 0 0 1 4
59 Bani Na'im B 2 C 2 4 1 4 0 5 3
60 Beit 'Awwa C 1.5 C 2 3.5 0 13 0 13 2
61 Dura B 2 B 2.5 4.5 1 0 0 1 4
62 Yatta B 2 C 2 4 2 9 0 11 2
63 Adh Dhahiriya B 2 C 2 4 2 8 0 10 2
64 As Samu' B 2 C 2 4 0 0 0 0 5
Note * http://www.molg.pna.ps/LGU.aspx
* From municipalities and Village councils
**http://www.mdlf.org.ps/Details.aspx?LangID=En&PageID=49&mi
d=22
Rating-Equation
Rank of municipality-
MoLG score
Rank of municipality-
MDLF score
>= score
adjustable Village Council 0.5 F 0.5
16 1
Projects Committee 0.5 E 1
10 2
D 1 D 1.5
5 3

297
C 1.5 C 2
1 4
B 2 B 2.5
0 5
A 2.5 A 2.5
Rating
0.5 point: Village Council or
Projects Committee
0.5 point: F
1 point: > 15 stonecutters +
olive presses + textiles
1 point: E
2 points: Between 10 and 15
1 point: D 1.5 point: D
3 points: Between 5 and 10
1.5 point: C 2 point: C
4 points: < 5
2 point: B 2.5 point: A,B
5 points: No stonecutters +
olive presses + textiles
2.5 point: A

298
No. Locality Name
Socio-economic factor
Total population aged 10 years
and over*
Ph.D*
Master*
Higher
Diploma*
Bachelor*
Total bachelor degree
or higher*
% holds a B.Sc.
or higher*
score
Economically
Active*
% Economicall
y Active*
score Total Score
1 Silat al Harithiya 6,640 13 27 4 356 400 6 1.5 2,042 31 1.5 3.0
2 Al Yamun 11,484 9 27 7 477 520 5 0.5 3,675 32 1.5 2.0
3 Kafr Dan 3,585 1 8 191 200 6 1.5 1,157 32 1.5 3.0
4 Deir Abu Da'if 3,805 10 3 162 175 5 0.5 1,334 35 2.5 3.0
5 Birqin 4,159 6 20 4 336 366 9 1.5 1,518 36 2.5 4.0
6 Ya'bad 9,759 14 36 7 675 732 8 1.5 3,132 32 1.5 3.0
7 Qabatiya 13,446 10 45 12 703 770 6 1.5 3,494 26 0.5 2.0
8 Arraba 7,127 4 28 5 468 505 7 1.5 2,206 31 1.5 3.0
9 Kafr Ra'i 5,325 4 22 5 271 302 6 1.5 1,636 31 1.5 3.0
10 Meithalun 5,054 14 50 11 423 498 10 1.5 1,656 33 1.5 3.0
11 Jaba' 6,079 3 15 3 280 301 5 0.5 1,680 28 0.5 1.0
12 El Far'a Camp 3,778 3 12 1 227 243 6 1.5 1,316 35 1.5 3.0
13 Tammun 7,651 7 35 4 570 616 8 1.5 2,586 34 1.5 3.0
14 Qaffin 6,041 3 15 1 267 286 5 0.5 1,840 30 1.5 2.0
15 'Attil 6,793 26 4 534 564 8 1.5 2,208 33 1.5 3.0
16 Deir al Ghusun 6,079 7 47 13 583 650 11 2.5 2,052 34 1.5 4.0
17 Bal'a 4,756 3 15 2 225 245 5 1.5 1,474 31 1.5 3.0
18 'Asira ash Shamaliya 5,557 12 52 11 649 724 13 2.5 2,023 36 2.5 5.0
19 'Awarta 3,982 8 1 193 202 5 1.5 1,292 32 1.5 3.0
20 Huwwara 3,948 3 20 3 221 247 6 1.5 1,201 30 1.5 3.0
21 Beita 6,198 6 33 2 383 424 7 1.5 1,902 31 1.5 3.0
22 Jamma'in 4,206 4 21 1 263 289 7 1.5 1,261 30 0.5 2.0

299
23 Aqraba 5,625 1 6 145 152 3 0.5 1,713 30 1.5 2.0
24 Qabalan 5,030 1 11 1 164 177 4 0.5 1,551 31 1.5 2.0
25 'Azzun 5,414 3 21 7 390 421 8 1.5 1,765 33 1.5 3.0
26 Biddya 5,563 5 41 2 377 425 8 1.5 1,791 32 1.5 3.0
27 Sinjil 3,459 5 12 4 139 160 5 0.5 1,129 33 1.5 2.0
28 Shuqba 2,929 1 6 1 105 113 4 0.5 1,014 35 1.5 2.0
29 Qibya 3,253 3 101 104 3 0.5 1,163 36 2.5 3.0
30 Al Jalazun Camp 5,158 2 15 162 179 3 0.5 1,773 34 1.5 2.0
31 Kharbatha al
Misbah 3,478 1 7 1 106 115 3 0.5 1,091 31 1.5 2.0
32 Beit Liqya 5,226 16 1 260 277 5 1.5 1,692 32 1.5 3.0
33 Ar Ram & Dahiyat al
Bareed 9,589 16 101 12 698 827 9 1.5 3,520 37 2.5 4.0
34 Biddu 4,303 2 10 2 193 207 5 0.5 1,420 33 1.5 2.0
35 Hizma 3,962 9 28 5 329 371 9 1.5 1,286 32 1.5 3.0
36 'Anata 6,067 9 32 12 331 384 6 1.5 2,064 34 1.5 3.0
37 Al 'Eizariya 8,703 18 53 10 464 545 6 1.5 2,873 33 1.5 3.0
38 Abu Dis 6,141 28 119 22 647 816 13 2.5 2,307 38 2.5 5.0
39 As Sawahira ash
Sharqiya 3,282 15 24 3 189 231 7 1.5 1,088 33 1.5 3.0
40 Al 'Ubeidiya 7,142 3 10 1 287 301 4 0.5 2,205 31 1.5 2.0
41 Husan 3,872 4 9 10 138 161 4 0.5 1,295 33 1.5 2.0
42 Nahhalin 4,542 11 21 12 314 358 8 1.5 1,442 32 1.5 3.0
43 Za'tara 4,209 5 17 9 305 336 8 1.5 1,316 31 1.5 3.0
44 Jannatah 3,572 2 2 98 102 3 0.5 1,023 29 0.5 1.0
45 Tuqu' 6,047 1 11 1 267 280 5 0.5 1,727 29 0.5 1.0
46 Beit Fajjar 7,517 2 17 3 264 286 4 0.5 2,387 32 1.5 2.0
47 Surif 9,381 8 31 13 789 841 9 1.5 2,198 23 0.5 2.0
48 Beit Ummar 9,331 25 55 12 799 891 10 1.5 3,066 33 1.5 3.0

300
49 Kharas 4,526 3 17 4 254 278 6 1.5 1,298 29 0.5 2.0
50 Beit Ula 7,160 3 9 3 343 358 5 1.5 2,180 30 1.5 3.0
51 Sa'ir 12,046 9 24 17 540 590 5 0.5 3,608 30 0.5 1.0
52 Halhul 15,475 32 93 33 1290 1448 9 1.5 5,215 34 1.5 3.0
53 Ash Shuyukh 5,956 2 25 5 325 357 6 1.5 1,747 29 0.5 2.0
54 Tarqumiya 9,978 9 31 4 651 695 7 1.5 3,089 31 1.5 3.0
55 Beit Kahil 4,169 1 14 6 327 348 8 1.5 1,154 28 0.5 2.0
56 Idhna 13,062 18 47 8 759 832 6 1.5 4,045 31 1.5 3.0
57 Taffuh 6,877 1 15 1 245 262 4 0.5 2,014 29 0.5 1.0
58 Deir Samit 3,999 3 5 147 155 4 0.5 1,074 27 0.5 1.0
59 Bani Na'im 13,194 15 36 3 579 633 5 0.5 4,151 31 1.5 2.0
60 Beit 'Awwa 5,557 3 4 4 194 205 4 0.5 1,684 30 1.5 2.0
61 Dura 19,514 53 156 31 1914 2154 11 2.5 6,355 33 1.5 4.0
62 Yatta 31,541 21 60 11 1267 1359 4 0.5 9,083 29 0.5 1.0
63 Adh Dhahiriya 19,245 14 41 25 793 873 5 0.5 6,152 32 1.5 2.0
64 As Samu' 13,116 9 33 6 734 782 6 1.5 3,447 26 0.5 2.0
Note
* Census Final Results – Summary, (Population, Buildings, Housing, Establishments) Census 2007, 2008-2009
Rating-Equation
score
score
adjustable
> 10 2.5 > 35 2.5
>= 5 1.5 > 30 1.5
>= 0 0.5 >= 0 0.5

301
Rating
0.5 point: <= 5% of the population hold a bachelor degree or higher of the total population aged 10 years and
over
1.5 points: 5% to 10% of the population hold a bachelor degree or higher of the total population aged 10 years
and over
2.5 point: > 10% of the population hold a bachelor degree or higher of the total population aged 10 years and
over
0.5 points: <= 30% of the population economically active of the total population aged 10 years and over
1.5 points: 30% to 35% of the population economically active of the total population aged 10 years and over
2.5 points: > 35% of the population economically active of the total population aged 10 years and over
No. Locality Name
Geographical factor Political Issues
% gravity
flow* score
No. of catchments*
score Total Score
settlement in the catchment
area* score
Political land classifications*
score Total Score
1 Silat al
Harithiya 50% to
75% 1 2 2
3 NO 2 A+B 2 4.0
2 Al Yamun
75% to 95%
1.5 2 2 3.5
NO 2 A+B 2 4.0
3 Kafr Dan > 95% 2 2 2 4 NO 2 A+B 2 4.0
4 Deir Abu Da'if > 95% 2 1 1 3 NO 2 A+B 2 4.0
5 Birqin
75% to 95%
1.5 2 2 3.5
NO 2 B 2 4.0
6 Ya'bad
50% to 75%
1 2 2 3
YES 1 B+C 1 2.0

302
7 Qabatiya > 95% 2 1 1 3 NO 2 B 2 4.0
8 Arraba <50% 0.5 > 2 3 3.5 NO 2 A+B+C 1 3.0
9 Kafr Ra'i
50% to 75%
1 > 2 3 4
NO 2 A 3 5.0
10 Meithalun > 95% 2 1 1 3 NO 2 A 3 5.0
11 Jaba'
75% to 95%
1.5 2 2 3.5
NO 2 B 2 4.0
12 El Far'a Camp > 95% 2 1 1 3 NO 2 A 3 5.0
13 Tammun
50% to 75%
1 2 2 3
NO 2 A+B 2 4.0
14 Qaffin > 95% 2 2 2 4 NO 2 B+C 1 3.0
15 'Attil > 95% 2 2 2 4 NO 2 B+C 1 3.0
16 Deir al Ghusun
50% to 75%
1 2 2 3
NO 2 B+C 1 3.0
17 Bal'a
75% to 95%
1.5 > 2 3 4.5
NO 2 A+B+C 1 3.0
18 'Asira ash Shamaliya
50% to 75%
1 2 2 3
NO 2 A+B 2 4.0
19 'Awarta
50% to 75%
1 2 2 3
YES 1 B+C 1 2.0
20 Huwwara > 95% 2 1 1 3 NO 2 B+C 1 3.0
21 Beita > 95% 2 2 2 4 NO 2 B+C 1 3.0
22 Jamma'in
50% to 75%
1 2 2 3
NO 2 B+C 1 3.0
23 Aqraba
50% to 75%
1 2 2 3
NO 2 B+C 1 3.0
24 Qabalan > 95% 2 2 2 4 NO 2 B 2 4.0
25 'Azzun > 95% 2 2 2 4 YES 1 B+C 1 2.0

303
26 Biddya
50% to 75%
1 2 2 3
YES 1 B+C 1 2.0
27 Sinjil > 95% 2 2 2 4 NO 2 A+B+C 1 3.0
28 Shuqba
50% to 75%
1 > 2 3 4
NO 2 B+C 1 3.0
29 Qibya <50% 0.5 > 2 3 3.5 NO 2 B+C 1 3.0
30 Al Jalazun
Camp 75% to
95% 1.5 2 2
3.5 YES 1 B+C 1 2.0
31 Kharbatha al
Misbah 50% to
75% 1 2 2
3 NO 2 B+C 1 3.0
32 Beit Liqya > 95% 2 1 1 3 NO 2 B+C 1 3.0
33 Ar Ram & Dahiyat al
Bareed <50% 0.5 > 2 3
3.5 YES 1 B+C 1 2.0
34 Biddu
50% to 75%
1 2 2 3
YES 1 B+C 1 2.0
35 Hizma
75% to 95%
1.5 2 2 3.5
YES 1 B+C 1 2.0
36 'Anata
75% to 95%
1.5 2 2 3.5
YES 1 B+C 1 2.0
37 Al 'Eizariya <50% 0.5 > 2 3 3.5 YES 1 B+C 1 2.0
38 Abu Dis <50% 0.5 > 2 3 3.5 YES 1 B+C 1 2.0
39 As Sawahira ash Sharqiya
50% to 75%
1 2 2 3
YES 1 B+C 1 2.0
40 Al 'Ubeidiya <50% 0.5 > 2 3 3.5 NO 2 A+C 1 3.0
41 Husan <50% 0.5 > 2 3 3.5 NO 2 B+C 1 3.0
42 Nahhalin <50% 0.5 > 2 3 3.5 YES 1 B+C 1 2.0
43 Za'tara 50% to 1 2 2 3 NO 2 A+B+C 1 3.0

304
75%
44 Jannatah <50% 0.5 > 2 3 3.5 NO 2 B+C 1 3.0
45 Tuqu' > 95% 2 2 2 4 YES 1 B+C 1 2.0
46 Beit Fajjar
50% to 75%
1 2 2 3
NO 2 B 2 4.0
47 Surif
50% to 75%
1 2 2 3
NO 2 B+C 1 3.0
48 Beit Ummar <50% 0.5 > 2 3 3.5 YES 1 B+C 1 2.0
49 Kharas > 95% 2 1 1 3 NO 2 B 2 4.0
50 Beit Ula
50% to 75%
1 > 2 3 4
NO 2 B 2 4.0
51 Sa'ir <50% 0.5 > 2 3 3.5 NO 2 B+C 1 3.0
52 Halhul
75% to 95%
1.5 > 2 3 4.5
NO 2 B+C 1 3.0
53 Ash Shuyukh
75% to 95%
1.5 2 2 3.5
NO 2 B+C 1 3.0
54 Tarqumiya <50% 0.5 > 2 3 3.5 YES 1 B+C 1 2.0
55 Beit Kahil
50% to 75%
1 2 2 3
NO 2 B+C 1 3.0
56 Idhna <50% 0.5 > 2 3 3.5 NO 2 B+C 1 3.0
57 Taffuh
50% to 75%
1 2 2 3
NO 2 A+B 2 4.0
58 Deir Samit
75% to 95%
1.5 > 2 3 4.5
NO 2 B+C 1 3.0
59 Bani Na'im <50% 0.5 > 2 3 3.5 NO 2 A+B+C 1 3.0
60 Beit 'Awwa
50% to 75%
1 > 2 3 4
YES 1 B+C 1 2.0
61 Dura 75% to 1.5 > 2 3 4.5 NO 2 A+B 2 4.0

305
95%
62 Yatta
50% to 75%
1 > 2 3 4
NO 2 A+B 2 4.0
63 Adh Dhahiriya <50% 0.5 > 2 3 3.5 NO 2 A+B 2 4.0
64 As Samu'
75% to 95%
1.5 2 2 3.5
NO 2 A+B 2 4.0

306
Note
* Have been identified from the contour maps
* GIS database
Rating-Equation
% gravity
flow score
No. of catchments
score
settlement in
the catchment area
score Political land classifications
score
adjustable <50% 0.5 1 1
YES 1 C 1
50% to
75% 1 2 2
NO 2 B+C 1
75% to
95% 1.5 > 2 3
A+C 1
> 95% 2
A+B+C 1
B 2
A+B 2
A 3
Rating 0.5 point: <50% by gravity flow 1 point: >=1 settlements in the catchment area
1 points: 50% to 75% by gravity
flow
2 points: No settlements in the catchment area
1.5 points: 75% to 95% by
gravity flow
1 points: Trunk lines and/or WWTP in Area C
2 points: > 95% by gravity flow
2 points: Entire project in Areas A and/or B
1 points: > 2 catchment areas
3 points: Entire project in Areas A
2 points: 2 catchment areas
3 point: 1 catchment areas

307
Normalize weights Sheet:
No. Criteria Environmental Assessment Committee
EQA National
Economy MoLG Transport Agriculture Health
Tourism
and
Antiquities
Planning and
Administrative
Development
PWA
1 Demography 5 8 8 8 9 10 8 9 9
2 Water consumption /
Wastewater
production
7 6 8 6 9 7 6 9 9
3 Reusing wastewater 5 4 5 3 8 2 5 5 8
4 Environmental factor 10 9 8 10 10 10 9 10 10
5 Operation body 10 8 8 8 9 8 8 10 9
6 Risk for Industrial
Waste 7 6 6 5 7 7 5 10 7
7 Socio-economic factor 10 8 10 8 9 10 8 8 9
8 Geographical factor 7 4 6 6 7 5 5 6 8
9 Political Issues 6 7 8 7 8 7 7 7 9
Can Change Directly
Weights of the criteria were identified through the intergovernmental agencies

308
No. Criteria Palestinian
Energy Authority
Public Works
and Housing
Labour Civil
defense
Petroleum
Authority
Weights
(Wm)
from 10
Normalize weight
(from 100%)
(Wm×100/∑W)
1 Demography 7 10 9 8 7 8.2 12.5
2 Water consumption /
Wastewater
production
4 5 6 7 6 6.8 10.37
3 Reusing wastewater 6 4 5 6 4 5 7.62
4 Environmental factor 8 10 10 10 9 9.5 14.48
5 Operation body 8 9 9 8 8 8.6 13.11
6 Risk for Industrial
Waste 7 5 6 4 8 6.4 9.76
7 Socio-economic factor 7 9 8 8 8 8.6 13.11
8 Geographical factor 5 4 5 4 5 5.5 8.38
9 Political Issues 7 6 7 6 6 7 10.67

309
Evaluation measure Sheet:
No.
Locality Name
Criteria Score for each community Score for
each community
Demography
Water consumptio
n
Reusing wastewate
r
Environmental factor
Operation body
Risk for Industrial
Waste
Socio-economic
factor
Geographical factor
Political Issues
Normalize weight 12.5 10.37 7.62 14.48 13.11 9.76 13.11 8.38 10.67
1 Silat al
Harithiya 0.76 5 5 4 3.5 4 3 3 4 69.9
2 Al Yamun 1.41 4 5 3 4 3 2 3.5 4 64.1
3 Kafr Dan 0.47 3 5 4 2.5 4 3 4 4 64.1
4 Deir Abu Da'if 0.56 4 5 4 2.5 4 3 3 4 64.7
5 Birqin 0.47 4 3 3 3.5 4 4 3.5 4 64.6
6 Ya'bad 1.07 2 3 4 4 4 3 3 2 58.4
7 Qabatiya 1.61 4 4 5 4 1 2 3 4 64.1
8 Arraba 0.81 3 4 3 4 3 3 3.5 3 59.5
9 Kafr Ra'i 0.57 4 2 3 3.5 3 3 4 5 61.7
10 Meithalun 0.61 3 3 4 3.5 4 3 3 5 64.5
11 Jaba' 0.71 3 3 5 3.5 4 1 3.5 4 61.1
12 El Far'a Camp 0.52 2 5 5 2.5 5 3 3 5 67.4
13 Tammun 1.09 4 1 3 3.5 3 3 3 4 57.7
14 Qaffin 0.68 4 3 3 3.5 3 2 4 3 56.6
15 'Attil 0.58 4 5 4 3.5 3 3 4 3 65
16 Deir al Ghusun 0.53 5 5 3 3.5 3 4 3 3 65
17 Bal'a 0.47 4 2 4 3.5 4 3 4.5 3 62.9
18 'Asira ash Shamaliya
0.63 3 1 4 3.5 3 5 3 4 62.6
19 'Awarta 0.46 4 3 3 2.5 4 3 3 2 54.2
20 Huwwara 0.45 4 2 3 3.5 4 3 3 3 57.4

310
21 Beita 0.87 3 2 3 3.5 3 3 4 3 56.1
22 Jamma'in 0.66 3 2 4 3.5 1 2 3 3 50.3
23 Aqraba 0.78 5 2 5 3.5 4 2 3 3 63.5
24 Qabalan 0.61 1 2 4 3.5 4 2 4 4 55.7
25 'Azzun 0.69 5 2 4 3.5 4 3 4 2 62.5
26 Biddya 0.71 2 2 4 3.5 3 3 3 2 52.7
27 Sinjil 0.46 2 2 5 2.5 5 2 4 3 57.5
28 Shuqba 0.49 1 2 5 2.5 4 2 4 3 53.5
29 Qibya 0.49 3 2 4 2.5 4 3 3.5 3 56.6
30 Al Jalazun
Camp 0.62 5 3 4 2.5 5 2 3.5 2 59.8
31 Kharbatha al
Misbah 0.52 3 3 2 2.5 4 2 3 3 48.9
32 Beit Liqya 0.70 2 4 4 3.5 4 3 3 3 59.9
33 Ar Ram & Dahiyat al
Bareed 1.09 2 1 4 3.5 3 4 3.5 2 55.6
34 Biddu 0.72 4 3 4 3.5 3 2 3 2 55.8
35 Hizma 0.61 4 1 5 2.5 3 3 3.5 2 56.2
36 'Anata 1.83 4 1 4 2.5 2 3 3.5 2 54.4
37 Al 'Eizariya 1.64 5 1 3 3.5 4 3 3.5 2 59.7
38 Abu Dis 0.75 5 1 2 3.5 5 5 3.5 2 61.7
39 As Sawahira ash Sharqiya
0.67 5 1 3 3.5 5 3 3 2 58.4
40 Al 'Ubeidiya 1.00 2 1 2 3.5 5 2 3.5 3 50.4
41 Husan 0.48 2 3 5 2.5 5 2 3.5 3 58.2
42 Nahhalin 0.73 2 3 5 2.5 5 3 3.5 2 59.3
43 Za'tara 0.63 1 2 3 3.5 5 3 3 3 53.6

311
44 Jannatah 0.60 2 2 3 3 5 1 3.5 3 49.9
45 Tuqu' 0.91 2 2 5 3.5 4 1 4 2 54.5
46 Beit Fajjar 1.04 3 2 5 3.5 1 2 3 4 56.3
47 Surif 1.28 1 1 4 3.5 4 2 3 3 52
48 Beit Ummar 1.24 2 2 5 3.5 2 3 3.5 2 55.9
49 Kharas 0.54 1 1 4 3.5 4 2 3 4 52.3
50 Beit Ula 1.11 1 1 3 3.5 4 3 4 4 55.1
51 Sa'ir 1.64 1 2 5 4 2 1 3.5 3 53
52 Halhul 2.16 1 2 5 4 3 3 4.5 3 63.2
53 Ash Shuyukh 0.94 2 1 5 3.5 2 2 3.5 3 53.1
54 Tarqumiya 1.32 1 1 4 3.5 3 3 3.5 2 51.5
55 Beit Kahil 0.81 2 2 5 2.5 5 2 3 3 56.7
56 Idhna 1.82 2 1 3 4.5 3 3 3.5 3 56.7
57 Taffuh 1.19 1 2 5 3.5 5 1 3 4 57.7
58 Deir Samit 0.71 2 2 2 3.5 4 1 4.5 3 48.3
59 Bani Na'im 2.23 1 1 3 4 3 2 3.5 3 51.7
60 Beit 'Awwa 0.72 1 2 2 3.5 2 2 4 2 42
61 Dura 3.20 2 1 5 4.5 4 4 4.5 4 74.3
62 Yatta 5.00 1 1 4 4 2 1 4 4 59.9
63 Adh Dhahiriya 2.79 2 3 2 4 2 2 3.5 4 55.5
64 As Samu' 1.89 3 1 3 4 5 2 3.5 4 61

312
Setting priorities Sheet:
No. Locality Name Score No. Locality Name Score No. Locality Name
Score
1 Dura 74.3 23 Al Jalazun Camp 59.8 45 Adh Dhahiriya
55.5
2 Silat al Harithiya 69.9 24 Al 'Eizariya 59.7 46 Beit Ula 55.1 3 El Far'a Camp 67.4 25 Arraba 59.5 47 Tuqu' 54.5
4 'Attil 65 26 Nahhalin 59.3 48 'Anata 54.4
5 Deir al Ghusun 65 27 Ya'bad 58.4 49 'Awarta 54.2
6 Deir Abu Da'if 64.7 28 As Sawahira ash Sharqiya
58.4 50 Za'tara 53.6
7 Birqin 64.6 29 Husan 58.2 51 Shuqba 53.5 8 Meithalun 64.5 30 Tammun 57.7 52 Ash Shuyukh 53.1
9 Al Yamun 64.1 31 Taffuh 57.7 53 Sa'ir 53
10 Kafr Dan 64.1 32 Sinjil 57.5 54 Biddya 52.7
11 Qabatiya 64.1 33 Huwwara 57.4 55 Kharas 52.3 12 Aqraba 63.5 34 Beit Kahil 56.7 56 Surif 52
13 Halhul 63.2 35 Idhna 56.7 57 Bani Na'im 51.7
14 Bal'a 62.9 36 Qaffin 56.6 58 Tarqumiya 51.5
15 'Asira ash Shamaliya 62.6 37 Qibya 56.6 59 Al 'Ubeidiya 50.4 16 'Azzun 62.5 38 Beit Fajjar 56.3 60 Jamma'in 50.3
17 Kafr Ra'i 61.7 39 Hizma 56.2 61 Jannatah 49.9
18 Abu Dis 61.7 40 Beita 56.1 62 Kharbatha al Misbah
48.9
19 Jaba' 61.1 41 Beit Ummar 55.9 63 Deir Samit 48.3
20 As Samu' 61 42 Biddu 55.8 64 Beit 'Awwa 42

313
21 Beit Liqya 59.9 43 Qabalan 55.7
22 Yatta 59.9 44 Ar Ram & Dahiyat al Bareed
55.6

314
Alternative A
Normalize weights to each criteria
No. Criteria Weights
(Wm)
Normalize
weight
1 Demography 8.2 13.99
2 Water consumption / Wastewater production 6.8 11.6
3 Reusing wastewater 5 8.53
4 Environmental factor 9.5 16.21
5 Operation body 8.6 14.68
6 Risk for Industrial Waste 6.4 10.92
7 Socio-economic factor 8.6 14.68
8 Geographical factor 5.5 9.39
9 Political Issues 0 0
58.6 100
Setting priorities for communities
No. Locality
Name Score No.
Locality
Name Score
No
.
Locality
Name Score
1 Dura 73.6 23 Beit Liqya 59.8 45 Taffuh 55
2 Silat al
Harithiya 68.7 24 Arraba 59.5 46 Biddya 54.3
3 'Attil 65.6 25 Jaba' 58.8 47 Beit
Fajjar 53.5
4 Deir al
Ghusun 65.6 26 As Samu' 58.8 48 Za'tara 52.9
5 'Azzun 65.2 27 Hizma 58.2 49 Tarqumi
ya 52.9
6 Abu Dis 64.3 28 Husan 58 50 Qabalan 52.8
7 Aqraba 63.9 29 Beit Ummar 57.8 51 Shuqba 52.8
8 El Far'a
Camp 63.5 30 Biddu 57.7 52
Adh
Dhahiriy
a
52.6
9 Halhul 63.5 31 Yatta 57.5 53 Ash
Shuyukh 52.3
10 Bal'a 63.2 32
Ar Ram &
Dahiyat al
Bareed
57.5 54 Beit Ula 52.2

315
11 Deir Abu
Da'if 62.9 33 Kafr Ra'i 57.2 55 Sa'ir 52.2
12 Birqin 62.8 34 Sinjil 57.2 56 Surif 51.1
13 Al Yamun 62.2 35 Huwwara 57.1 57 Bani
Na'im 50.7
14 Kafr Dan 62.2 36 Beit Kahil 56.3 58
Al
'Ubeidiy
a
49.3
15 Qabatiya 62.2 37 Idhna 56.3 59 Jamma'i
n 49.1
16 Al Jalazun
Camp 62.1 38 Tuqu' 56.3 60 Kharas 49
17 Al
'Eizariya 62 39 Qaffin 56.2 61 Jannatah 48.7
18 Nahhalin 61.7 40 Qibya 56.2 62
Kharbath
a al
Misbah
47.6
19 Ya'bad 60.6 41 'Anata 56.2 63 Deir
Samit 46.9
20
As
Sawahira
ash
Sharqiya
60.6 42 'Awarta 55.9 64 Beit
'Awwa 42.3
21 'Asira ash
Shamaliya 60.5 43 Beita 55.7
22 Meithalun 60.2 44 Tammun 55

316
Alternative B
Normalize weights to each criteria
No. Criteria Weights (Wm) Normalize weight
1 Demography 8.2 13.95
2 Water consumption /
Wastewater production 0 0
3 Reusing wastewater 5 8.5
4 Environmental factor 9.5 16.16
5 Operation body 8.6 14.63
6 Risk for Industrial Waste 6.4 10.88
7 Socio-economic factor 8.6 14.63
8 Geographical factor 5.5 9.35
9 Political Issues 7 11.9
58.8 100
Setting priorities for communities
No. Locality
Name Score No.
Locality
Name Score No.
Locality
Name Score
1 Dura 78.3 23 Qabalan 59.8 45 Bani Na'im 55.4
2 El Far'a
Camp 70.6 24 Kafr Ra'i 59.6 46 Tarqumiya 55.2
3 Halhul 68.2 25 Arraba 59.5 47 Al Jalazun
Camp 55.1
4
Silat al
Harithiy
a
66.4 26 Sinjil 59.5 48 Tammun 55.1
5 Meithalu
n 65 27 Aqraba 59.3 49 Al 'Eizariya 55
6 Yatta 64.6 28 Beit Ula 59.2 50 Huwwara 54.8
7 Kafr
Dan 64.5 29
Beit
Kahil 58.6 51 Ash Shuyukh 54.6
8 'Attil 63.2 30 Idhna 58.6 52 Biddya 54.2
9
Deir
Abu
Da'if
62.9 31 'Azzun 58.2 53 Qaffin 53.9
10
'Asira
ash
Shamali
ya
62.9 32 Beit
Ummar 57.7 54
As Sawahira
ash Sharqiya 53.5
11 Birqin 62.8 33 Za'tara 57.5 55 Hizma 53.5
12 Al
Yamun 62.3 34
Ar Ram
&
Dahiyat
57.4 56 Biddu 53

317
al
Bareed
13 Qabatiya 62.3 35 Shuqba 57.4 57 Al 'Ubeidiya 51.6
14 Beit
Liqya 62.2 36 Abu Dis 57.3 58 'Anata 51.5
15 Taffuh 62 37
Adh
Dhahiriy
a
57.3 59 'Awarta 51.3
16 Nahhali
n 61.6 38 Sa'ir 56.8 60 Jannatah 51
17 Jaba' 61.2 39 Qibya 56.2 61 Deir Samit 49.3
18 As
Samu' 61.2 40 Tuqu' 56.2 62 Jamma'in 49.2
19 Deir al
Ghusun 60.9 41 Kharas 56.1 63
Kharbatha al
Misbah 47.6
20 Bal'a 60.9 42 Beit
Fajjar 55.9 64 Beit 'Awwa 44.6
21 Ya'bad 60.6 43 Beita 55.7
22 Husan 60.3 44 Surif 55.7

318
Alternative C
Normalize weights to each criteria No. Criteria Weights (Wm) Normalize weight
1 Demography 8.2 14.39
2 Water consumption /
Wastewater production 6.8 11.93
3 Reusing wastewater 5 8.77
4 Environmental factor 9.5 16.67
5 Operation body 0 0
6 Risk for Industrial Waste 6.4 11.23
7 Socio-economic factor 8.6 15.09
8 Geographical factor 5.5 9.65
9 Political Issues 7 12.28
57.0 100
Setting priorities for communities
No. Locality
Name Score No.
Locality
Name Score No.
Locality
Name Score
1 Dura 72 23 Sinjil 58.6 45 Qabalan 53.5
2 El Far'a
Camp 70.1 24 Beit Liqya 58.3 46
Ar Ram &
Dahiyat al
Bareed
53.5
3 Silat al
Harithiya 69.9 25 As Samu' 58.2 47 Beit Ula 52.9
4 Deir Abu
Da'if 66.9 26 Al 'Eizariya 58.1 48 Tuqu' 52.2
5 Kafr Dan 66.2 27 Beit Kahil 57.7 49 Adh
Dhahiriya 51.8
6 'Attil 64.2 28 Qibya 57.6 50 Idhna 51.7
7 Deir al
Ghusun 64.2 29 Hizma 57.2 51 Za'tara 51.1
8 Birqin 63.8 30 Yatta 56.9 52 Ash
Shuyukh 50.6
9 Meithalun 63.6 31
As
Sawahira
ash
Sharqiya
56.6 53 Biddya 50.1
10 Aqraba 62.5 32 Arraba 56.4 54 Kharas 49.7
11 Qabatiya 61.8 33 Tammun 55.8 55 Surif 49.3
12 Bal'a 61.8 34 Taffuh 55.8 56 Sa'ir 48.9
13 Al Yamun 61.7 35 Huwwara 55.5 57 Kharbatha
al Misbah 48.8
14 'Asira ash 61.5 36 Ya'bad 55.2 58 Tarqumiya 48.7

319
Shamaliy
a
15 'Azzun 61.4 37 'Anata 55.1 59 Jannatah 48.4
16
Al
Jalazun
Camp
61.2 38 'Awarta 54.9 60 Al
'Ubeidiya 47.5
17 Nahhalin 60.8 39 Qaffin 54.6 61 Bani Na'im 47.4
18 Halhul 60.6 40 Beit Fajjar 54.2 62 Jamma'in 47.3
19 Kafr Ra'i 60.5 41 Beita 54.1 63 Deir Samit 45.1
20 Abu Dis 60.5 42 Shuqba 54.1 64 Beit 'Awwa 37.8
21 Jaba' 59.7 43 Beit
Ummar 53.7
22 Husan 59.5 44 Biddu 53.7

320
Alternative D
Normalize weights to each criteria No. Criteria Weights (Wm) Normalize weight
1 Demography 8.2 13.85
2 Water consumption /
Wastewater production 6.8 11.49
3 Reusing wastewater 5 8.45
4 Environmental factor 9.5 16.05
5 Operation body 8.6 14.53
6 Risk for Industrial
Waste 0 0
7 Socio-economic factor 8.6 14.53
8 Geographical factor 5.5 9.29
9 Political Issues 7 11.82
59.2 100
Setting priorities for communities
No. Locality
Name Score No.
Locality
Name Score No.
Localit
y Name Score
1 Dura 73.7 23 Abu Dis 57.6 45 Jamma'
in 53.6
2 Qabatiya 68.9 24 Beit
Ummar 57.6 46 Taffuh 53.1
3 Silat al
Harithiya 68.8 25 Al 'Eizariya 57.5 47
Qabala
n 53.1
4 'Attil 65.5 26 Tammun 57.4 48 Sinjil 52.9
5 Deir al
Ghusun 65.5 27
Adh
Dhahiriya 57.2 49
Beit
Ula 52.5
6 Al Yamun 64.6 28 As Samu' 56.8 50 Beit
Kahil 52
7 El Far'a
Camp 63.9 29 Idhna 56.3 51 Biddya 52
8 Halhul 63.5 30 Qaffin 56.3 52 Tuqu' 51.8
9 Deir Abu
Da'if 63 31 Ya'bad 56.1 53 'Awarta 51.5
10 Birqin 62.9 32 'Anata 56 54 Bani
Na'im 50.8
11 'Asira ash
Shamaliya 62.9 33 Hizma 55.8 55 Shuqba 50.7
12 Meithalun 62.8 34 Beita 55.7 56 Tarqum
iya 50.6
13 Kafr Dan 62.3 35 Al Jalazun
Camp 55.4 57 Kharas 49.3
14 Yatta 62.1 36 Biddu 55.4 58 Surif 49
15 Kafr Ra'i 61.9 37 Ar Ram & 55.2 59 Za'tara 48.6

321
Dahiyat al
Bareed
16 Aqraba 61.7 38 Nahhalin 55 60
Kharba
tha al
Misbah
45.6
17 Bal'a 61 39 Huwwara 55 61
Al
'Ubeidi
ya
45.1
18 'Azzun 60.7 40 Ash
Shuyukh 54.5 62
Deir
Samit 44.9
19 Beit Fajjar 60.2 41 Sa'ir 54.4 63 Jannata
h 44.5
20 Arraba 59.5 42 Qibya 54 64 Beit
'Awwa 42.2
21 Jaba' 59 43
As
Sawahira
ash
Sharqiya
53.9
22 Beit Liqya 57.7 44 Husan 53.7

جامعة النجاح الوطنية كمية الدراسات العميا
تحديد أولويات قطاع الصرف الصحي في الضفة الغربية (MCDAبإستخدام طريقة تحميل القرار متعدد المعايير )
إعداد براء ياسين عبد الفتاح جرارعو
إشراف مروان حدادد. أ.
المياه والبيئة بكمية ىندسةفي الماجستيرقدمت ىذه االطروحة استكماال لمتطمبات نيل درجة الدراسات العميا في جامعة النجاح الوطنية في نابمس، فمسطين.
3102

ب
تحميل القرار متعدد تحديد أولويات قطاع الصرف الصحي في الضفة الغربية بإستخدام طريقة (MCDA) المعايير
إعداد براء ياسين عبد الفتاح جرارعو
إشراف.مروان حدادد
الممخص
األراضيي فيي الصييي الصير قطياع فيي الدوالرات ماليين استثمار تم األخيرين، العقدين خالل فييعتبر قطياع الصير الصييي مين القطاايات المخملية خيالل العقيود الماضيية ذلك، ومع. الفلسطينية
% فقييط مين السيبان بتيببات صير صييي وبيذت التييببات 32-22ييي ييتم خدمية ميا نسيبت بيين تخيييدم بعيييض الميييدن الرميسيييية والمخيميييات والقيييرا فيميييا ييييتخلص معظيييم السيييبان مييين المييييات العادمييية
بواسطة اليفر اإلمتصاصية.
تم امل العديد من األبيا والدراسات الي قطياع الصير الصييي فيي فلسيطين وتيم وضيع العدييد مييين بيييذت األبييييا خيييالل السيينوات الماضيييية لبييين يييا ميين الخطيييط واإلسيييتراتيهيات فييي بيييذا المهيييال
واإلستراتيهيات لم ييدد ولويات المناطق التي بياهة ليل متبلة الصر الصيي.
يخد البي لتيديد ولويات المناطق التي بياهة ليل متبلة الصر الصيي لعمل متياريع فيخيا اليالييية الطريقيية(، يييي ظخيير البييي ن MCDAبإسييتخدام طريقيية تيليييل القييرار متعييدد المعييايير
سيلو و الميانيين سياسيات سياس الي إميا المتياريع بيذت من المستخدفة المناطق تيديد يتم التي .الصييح القرار التخاذ والعلمية الصييية المعايير هميع تأخذ ال نخاأل ذلك المي غير
بيي الصييي الصير قطياع فيي القيرار صينع الي بتبل ببيير تؤثر التي المعايير ن ظخر البي المييييات، اسيييتخدام إاييياد ،المنتهييية الصييييي الصييير مييييات/ المييييات اسيييتخالك اليييديموغرافيا،: القضيييايا
-اإلقتصييياد عاميييلال الصييينااية، لنفايييياتالناتهييية اييين ا المخييياطر الهسيييم المتييي ل، ،يالبيمييي عاميييلال

ت
وقييد نيياقش البييي قلييية تقييييم بييذت المعييايير وتييم .السياسييية والقضييايا اله رافييي، العامييل ،اإلهتمييااي يهاد االقة رياضية تربط بين المعايير المختلفة مما يسخل املية تيديد ولويات المناطق.إ
قال نسييمة فييي اييام 10 ظخيير البييي ن اييدد التهمعييات المتوقييع ن يبليي اييدد سييبانخا بثيير ميين تهميع مخييدوم بتيببات صير صييي و قييد التنفييذ و فييي 33تهميع، يوهيد منخيا 79بيي 2030
تهميع ييتم اليتخلص مين المييات العادمية 44وقد تم تخصيص تمويل لخا، بينما بناك مريلة التصميم التييي تييم املخييا ميين 2030-2010بواسييطة اليفيير اإلمتصاصييية. ويسيي الخطيية القطااييية للميييات
يهي ن تبيون بيل التهمعيات التيي يبلي اييدد 2030قبيل سيلطة المييات الفلسيطينية فإني بيليول اييام نسمة مربوطة بنظام صر صيي.قال 10سبانخا بثر من
( التيي تيم تطويربيا خيالل بيذا البيي اليي MCDAتيم تطبييق طريقية تيلييل القيرار متعيدد المعييايير تهمييع يييتم الييتخلص ميين الميييات العادميية فيخييا بواسييطة اليفيير اإلمتصاصييية والتييي سييتخدم بيلييول 44 مع يس األولوية.ته 44يس الخطة القطااية للميات، وقد تم ترتي ال 2030اام
وخطية األهيل طويلية خطة وضعخرهت الدراسة بعدد من التوصيات من بينخا ن تبد سلطة الميات بلزام الهخات المانية بخذت الخطة. 20 خدمة تتمل خمسية تهمع يس األولوية وا