multiple drought indices for agricultural drought risk ... · multiple drought indices for...
TRANSCRIPT
INTERNATIONAL JOURNAL OF CLIMATOLOGYInt. J. Climatol. (2011)Published online in Wiley Online Library(wileyonlinelibrary.com) DOI: 10.1002/joc.2385
Multiple drought indices for agricultural drought riskassessment on the Canadian prairies
Liu Sun,a,b* Scott W. Mitchella,b and Andrew Davidsona,c
a Department of Geography and Environmental Studies, Carleton University, Ottawa, Ontario K1S 5B6, Canadab Geomatics and Landscape Ecology Research Laboratory, Carleton University, Ottawa, Ontario K1S 5B6, Canada
c National Land and Water Information Service, Agriculture and Agri-Food Canada, Ottawa, Ontario K1A 0K9, Canada
ABSTRACT: A multi-index drought (MID) model was developed to combine the strengths of various drought indices foragricultural drought risk assessment on the Canadian prairies, as related to spring wheat crop yield. The model automaticallyselects and combines optimum drought indices derived from the preceding and current months as they become available tobetter match the conditions (both spatially and temporally) where they work well. The cross-validation results showed that(1) the prediction accuracy of the MID model is better than (or occasionally equal to) using any single drought index for allmodelling stages, (2) drought indices derived from the recharge period are useful for early drought risk detection, (3) modelprediction accuracy improved as the growing season progressed with the most accurate assessments at the beginning ofAugust, and (4) the model performed best in the more arid locations in the southern prairies, which tend to have a morevariable precipitation regime. The model assessment results provide the spatial intensity distribution of possible droughtprogression and recession before and during the growing season, and can be used with complementary information inagricultural drought risk management and mitigation strategies. Copyright 2011 Royal Meteorological Society
KEY WORDS agricultural drought; Canadian prairies; drought index; spring wheat yield; risk assessment
Received 8 July 2010; Revised 10 March 2011; Accepted 28 May 2011
1. Introduction
Drought is a recurrent phenomenon on the Cana-dian prairies (hereafter referred to as ‘the prairies’).Three decades in the twentieth century (1910–1919,1930–1939, and 1980–1989) experienced drought formore than half the decade (Nkemdirim and Weber, 1999).Droughts on the prairies are closely related to the lackof precipitation, above-normal air temperatures, low soilmoisture, and insufficient surface water supply (Wheatonet al., 1992).
Although the natural conditions of the prairies arefavourable for mechanized farming, the agricultural sec-tor is highly vulnerable to weather variability (Quir-ing and Papakyriakou, 2003). Recent growing seasondroughts in the prairies during 2001 and 2002 resultedin an estimated loss of $3.6 billion in agricultural pro-duction (Wheaton et al., 2005). To reduce the seriousconsequences of drought, besides improving the under-standing of the hazard and the factors that influencevulnerability, there are calls for more attention to pre-diction/early warning activities (i.e. risk assessment) thatcould improve drought preparedness and response, aswell as to reduce future impacts (Sivakumar and Wilhite,2002).
∗ Correspondence to: L. Sun, c/o Scott Mitchell, Department of Geog-raphy and Environmental Studies, Carleton University, B349 LoebBuilding, 1125 Colonel By Drive, Ottawa, ON, K1S 5B6, Canada.E-mail: [email protected]
Drought indices are the integration of one or moreclimate or hydrological variables (e.g. precipitation, tem-perature, soil moisture, stream flow, groundwater levels,etc.) on a quantitative scale (Steinemann et al., 2005).They have been widely used to detect the onset andseverity of drought, and to study its spatial and temporalpatterns (Quiring and Papakyriakou, 2003). The relativelylow cost and generally high availability of the weatherand hydrological data compared to other types of data areother reasons for their wide application.
Over the years, to our knowledge, the majorityof drought indices studies have focused on evaluat-ing drought indices for specific regions (e.g. Quiringand Papakyriakou, 2003; Morid et al., 2006; Mavro-matis, 2007) or the use of a single well-developeddrought index to characterize and predict droughts overspecific regions (e.g. Tsakiris and Vangelis, 2004; Can-celliere et al., 2007). However, because each index pro-vides a somewhat different measure of drought, useof a particular specific index has often been demon-strated to be inadequate for completely representingthis complex phenomenon (Heim, 2002; Steinemannet al., 2005; Quiring, 2009). A combination of vari-ous drought indices may provide a more comprehensiveassessment of drought conditions than a single-indexapproach, but this has been challenging because therehas been a lack of systematic methods for their combi-nation, use, and evaluation (Steinemann and Cavalcanti,2006).
Copyright 2011 Royal Meteorological Society

L. SUN et al.
In recent years, significant progress has been made inemploying multiple drought indices in droughtmanagement. For example, the Objective Blend ofDrought Indicators (OBDI) was developed for the U.S.Drought Monitor to provide a comprehensive assessmentof drought conditions across the country (Svoboda et al.,2002). The OBDI combines three climate-based droughtindices and the Climate Prediction Center’s soil mois-ture model. A percentile approach was used to trans-form all input data into a standardized scale to whichdrought category thresholds and weights for each indi-vidual index could be assigned. The OBDI is beneficialin providing a single ‘average’ drought designation atthe national and state level, but is not meant to capturelocal drought conditions, such as in individual counties(Steinemann et al., 2005). Brown et al. (2008) developeda hybrid geospatial drought monitoring tool, the Vege-tation Drought Response Index (VegDRI), to produce anear real-time 1 km resolution map of drought conditionsin seven north-central states of the United States. Themodel integrates climate-based drought indices, satellite-derived vegetation condition information, and other bio-physical information. The model was empirically derivedfor three seasonal phases (spring, summer, and fall) byapplying a supervised classification and regression treeanalysis for each phase. The VegDRI map provides morelocalized drought information at a county to sub-countyscale.
The purpose of this article is to present an opera-tional model framework that combines the strengths ofvarious drought indices to provide a more comprehen-sive assessment of agricultural drought conditions in theCanadian prairies. Agricultural drought has been defined
as ‘the condition when moisture supply of a regionconsistently fails to meet the needs of a particular crop ata particular time, such that the crop production or rangeproductivity is significantly affected’ (Bordi and Sutera,2007). As agricultural drought on the prairies is the singlemost limiting factor to crop yield (Akinremi et al., 1996),it can be used as an agricultural drought indicator: Bypredicting reduced crop yield, one can predict droughts(Morgan, 1985; Sinha et al., 1992). As drought indexintegration is the main focus of this study, other man-agement (e.g. soil fertility status, cultivation practices,pest control, and crop disease) and weather-related fac-tors that effect crop yield were not considered and wereassumed to remain stable throughout the study period.To better match crop phenological stages and to detectshort-term dry spells, especially at pre-planting and earlycrop growth stages, agricultural drought risk is assessedat pre-planting and at the beginning of each month dur-ing the growing season. The risk assessment results aremapped monthly to provide the spatial intensity distribu-tion of possible drought progression and recession in theprairies.
2. Materials and methods
2.1. Study area
The study area is composed of a total of 34 Census Agri-cultural Regions (CARs) across the prairies (Figure 1).These CARs are composed of groups of adjacent censusdivisions, which were defined by the agricultural agenciesin each province for the purposes of regional planning andmanaging common services (Statistics Canada, 2003).
Figure 1. Spatial distribution of the 34 CARs across the prairies. Nine clusters (C1–C9) were composed of neighbouring CARs as determinedby Ward’s (1963) minimum-variance cluster analysis. This figure is available in colour online at wileyonlinelibrary.com/journal/joc
Copyright 2011 Royal Meteorological Society Int. J. Climatol. (2011)

MULTIPLE DROUGHT INDICES FOR AGRICULTURAL DROUGHT RISK ASSESSMENT
The Canadian prairies cross the southern parts of theprovinces of Alberta, Saskatchewan, and Manitoba. Dom-inated by a semi-arid climate, the precipitation in thisregion is highly variable and unevenly distributed. Grow-ing season (May to August) precipitation averages about200 mm, lower than the crop water demand (approx-imately 300 mm) (Ash et al., 1992). Winter precipita-tion in the form of snowfall is important, accountingfor approximately one third of annual precipitation andproducing 80% or more of annual local surface runoff(Pomeroy and Goodison, 1997). The prairie landscapeis dominated by plains and gently rolling terrain. Theabsence of any significant topographic barrier in the vastnorth–south corridor is responsible for the great varietyof weather (Hare and Thomas, 1919).
2.2. Data
Spring wheat yield data (tha−1) for each CAR, availablefor 28 years (1976–2003), were obtained from StatisticsCanada. Spring wheat was selected in this study becauseits acreage is the highest compared with other crops in theprairies and it is growing extensively in all CARs. Also,spring wheat is widely used in the literature to representagricultural drought on the prairies (e.g. Kumar and Panu,1997; Quiring and Papakyriakou, 2003).
Three widely used drought indices, the StandardizedPrecipitation Index (SPI; McKee et al., 1993) at threetime steps (1-, 3-, and 6-month), the Palmer DroughtSeverity Index (PDSI; Palmer, 1965), and the PalmerMoisture Anomaly Index (Z-index; Palmer, 1965) wereselected for use in this study. Their individual effective-ness in characterizing agricultural drought on the prairieshas been widely studied (e.g. Akinremi et al., 1996; Quir-ing and Papakyriakou, 2003; Wheaton et al., 2008). TheSPI’s calculation requires at least 30 years of monthlyprecipitation data for the region. Besides precipitation, thePDSI and Z-index’s calculations require at least 30 years’monthly maximum and minimum temperature data, plusthe available holding capacity (AWHC) of the soil andthe longitude and latitude of the site for which it is beingcalculated.
Considering weather stations are unevenly distributedin some CARs and this affects the reliability of CARaveraged drought indices, daily maximum and minimumtemperature and precipitation data were obtained fromthe daily 10 km gridded climate data set for Canada(1961–2003; AAFC, 2008a). Grids were interpolatedfrom daily Environment Canada climate station observa-tions using a thin plate smoothing spline surface fittingmethod implemented by ANUSPLIN V4.3. This methodhas been shown to perform well when interpolating noisyclimate data across complex terrain in comparison withother interpolation techniques (Hutchinson and Gessler,1994; McKenney et al., 2006). According to the meta-data of this specific gridded climate data set, on aver-age, ANUSPLIN tends to overestimate extreme minimumtemperature by around 0.6 °C, underestimate extrememaximum temperature by around 0.25 °C, and underesti-mate high precipitation extremes by around 2 mm.
The SPI was calculated using FORTRAN 90/95 codeprovided by the National Agroclimate Information Ser-vice (NAIS) of Agriculture and Agri-Food Canada(AAFC). The AWHC value of the soils was definedvia the Soil Landscapes of Canada (SLC) Version 3.1.1(AAFC, 2008b).
The PDSI and Z-index were calculated using theNational Drought Model employed by the NAIS DroughtWatch program. The PDSI calculated from Palmer’s orig-inal method has considerable limitations, including theuse of two simplified soil layers in the water balancecomputations that may not be accurately representative ofa location, the use of empirical constants for the climaticcharacteristic and the duration factors, limiting the spatialcomparability of the index, and the estimation of poten-tial evapotranspiration with the Thornthwaite method(Thornthwaite, 1948) which yields less realistic estimatesthan Priestley and Taylor’s (1972) method (Alley, 1984;Guttman et al., 1992). The most recent version of PDSImodel developed by Wells et al. (2004) improved thespatial comparability of PDSI values by replacing theempirical constants in the index with dynamically calcu-lated values. The national drought model version used inthis study is based on a six-layer structure that is moreaccurate in tracking the movement of soil moisture thanPalmer’s two-layer model. It also replaces the regionalcorrection factor of 17.67 employed in Palmer’s originalmethod to 14.2, established by Akinremi et al. (1996), tobetter simulate soil moisture variations in Canada. More-over, the potential evapotranspiration is calculated usingthe Priestley and Taylor equation which has better phys-ical appeal than the Thornthwaite’s method. These alter-ations overcome many of the limitations in the Palmerdrought indices, providing a more accurate measurementof moisture conditions of the study area.
Five drought indices were calculated for the entireperiod from 1961 to 2003 to characterize long-termconditions, but due to the availability constraints overthe entire study area, only the data from 1976 to 2003were used for further analysis. Gridded drought indiceswere then aggregated to CAR averages, by taking theaverage value of all grid cells within each CAR.
2.3. Methods
2.3.1. Crop yield data detrending and standardization
Owing to advances in agricultural technology, such asgreater rates and frequency of fertilizer application, theuse of new crop varieties, improved weed control, andbetter tillage practices, agricultural areas are generallyexperiencing an upward trend in spring wheat yields(Qian et al., 2009). To eliminate bias due to non-climaticfactors, the trend was removed using linear regressionwhen calculating yield variability (e.g. Hill et al., 1980;Wu et al., 2004). To compare yield variability from CARswith different mean values and standard deviations, theyield residuals were standardized for each CAR using theZ-score transformation quantifying the original score in
Copyright 2011 Royal Meteorological Society Int. J. Climatol. (2011)

L. SUN et al.
Table I. Canadian prairies drought intensity classification.
Standardized yieldresiduals
Drought category Cumulativefrequency (%)
> −0.20 Non-drought >35> −0.69 to −0.20 Mild >20 to 35> −1.24 to −0.69 Moderate >10 to 20> −1.84 to −1.24 Severe >5 to 10≤ −1.84 Extreme ≤5
terms of the number of standard deviations that the scoreis from the mean of the distribution.
2.3.2. Agricultural drought intensity classification
Drought intensity is one of the essential componentsfor representing a comprehensive picture of droughtfor a region (Sivakumar and Whilhite, 2002). In thisstudy, a five-level drought intensity classification – non-drought, mild, moderate, severe, and extreme – was uti-lized (Table I). As we focused on assessing dry condi-tions, the near normal and wet conditions were groupedinto one class termed ‘non-drought.’ The chance of occur-rence for each level of drought was defined accordingto the commonly used cumulative frequency of differ-ent drought intensities, such as the percentile categoriesemployed by the U.S. Drought Monitor (Svoboda et al.,2002) and the SPI classification (McKee et al., 1993). Foreach drought category, the corresponding yield thresholdwith the specific chance of occurrence was calculatedfrom an empirical cumulative distribution function devel-oped from the standardized spring wheat yields of the 34CARs during the 28 years. According to this classifica-tion, a year is identified as a drought year with a specificintensity when the corresponding yield is lower than thehistorical mean by 0.20 standard deviations.
2.3.3. Creation of spatial scale for agricultural droughtrisk assessment
Widely used spatial scales for drought evaluation includeclimate divisions (Svoboda et al., 2002; Steinemann andCavalcanti, 2006), crop districts (Quiring and Papakyr-iakou, 2003), and political jurisdictions (e.g. countries,provinces) (Wu et al., 2004). For the prairies, evaluat-ing droughts by province or territory is not appropri-ate, because administrative boundaries do not accuratelyreflect the physical features and climate of the region. Toincrease the sample size for model development, neigh-bouring CARs were grouped together based on the sim-ilarity of yield variations throughout the study period.
Ward’s (1963) minimum-variance hierarchical clusteranalysis was applied to determine which CARs were mostsimilar by maximizing the proportion of variation in stan-dardized yields explained by a particular clustering of theCARs. Different clustering solutions were examined anda nine-clustering solution was selected, because it keptas much similarity of the CARs within each cluster aspossible, and the number of CARs was relatively equal
within each cluster. As shown in Figure 1, the clustersappeared to be primarily controlled by geographic loca-tion, conforming to the generalization that geographicallyclose regions usually experience similar weather and cropresponse (Wu et al., 2004; Williams et al., 2008). Theseclusters, referred to as C1, C2 . . . C9, were used as thespatial units for model development.
2.3.4. Identification of outliers
Both drought and flood can lead to crop water stress andthus reduce crop yield. As the drought indices chosen inthis study do not reflect the effects of flooding, the flood-induced yield reductions, which have an inconsistentinfluence on the model development, needed to beremoved from the analysis. The criterion for identifyingthe influential data was the consistency between thestandardized yield residuals and the drought indicesvalues before and during the growing season (c.f. Wuet al., 2004). For each CAR, in cases where the droughtindices were constantly over 2 (i.e. moderately wet) forat least 2 months, but the standardized yield residualwas lower than −0.69 (i.e. associated with moderatedrought), the data of that year were omitted from modeldevelopment. For each CAR, the number of flood yearsvaries from 0 to 3 during the study period.
For example, 1997 was a severe flood year in Man-itoba. The Red River flooding severely damaged farmbuildings, equipment, and delayed spring planting inrural areas (Environment Canada, 2008), and as a resultthe yield was very poor in this year (e.g. the standard-ized yield residual for CAR 4609 was −1.04). However,the drought indices (expressed in terms of yield) wereextremely high in affected CARs, which would predicta high-yield year. Therefore, the data from 1997 wereidentified as outliers for most of the CARs in Manitobaand were not used to develop the model. Replacing ourapproach with a model of flood impacts on crop yieldwould be an appropriate method to fill in the resultinggaps.
2.3.5. Multi-index drought model development
A multi-index drought (MID) model was developed topredict agricultural drought at six stages: pre-planting,and at the beginning of each month during the growingseason (defined in the model as May 1st to Septem-ber 1st). Before the growing season, the MID modelassesses drought risk at the beginning of April by evalu-ating the drought indices of the recharge period (from theprevious September to current March for a given year).During the growing season, the model is updated at thebeginning of each month by assessing the drought indicesfrom the recharge period to the preceding month. Thelast stage of the model is updated at the beginning ofSeptember, using the drought indices from August.
Principal Component Analysis (PCA) and multiplelinear regression were used to establish a predictablerelationship between drought indices and the standardizedspring wheat yield residuals. A nested loop procedure
Copyright 2011 Royal Meteorological Society Int. J. Climatol. (2011)
MULTIPLE DROUGHT INDICES FOR AGRICULTURAL DROUGHT RISK ASSESSMENT
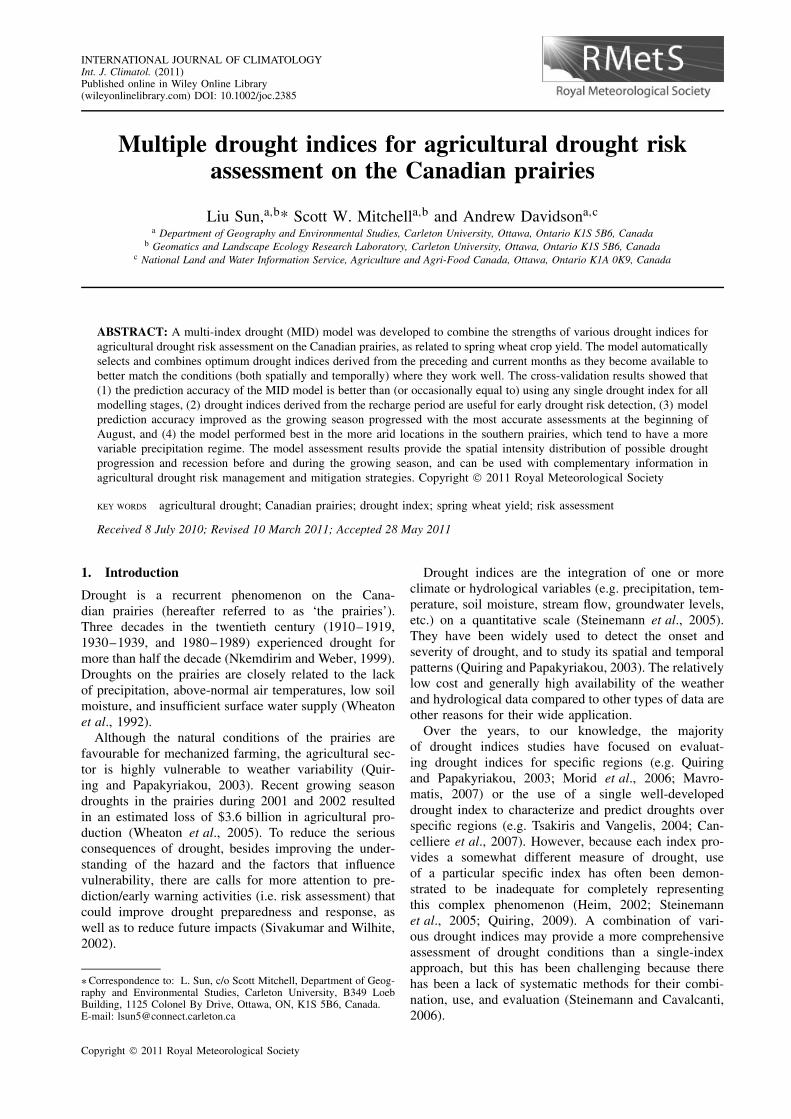
Figure 2. Flowchart of the nested loop approach for MID modelconstruction, where n is the number of candidate drought indices ateach stage of modelling; m is the number of ranked resulting principalcomponents (ranked by their correlations between standardized yieldresiduals) for the multiple regression analysis. In each iteration ofcross-validation (CV), a different year, i, was withheld for validationuntil all 28 years were used for validation. For each modelling stage,the optimum model structure was obtained by minimizing the CV
RMSE in the nested loop approach.
was employed to obtain the optimum model structure(Figure 2). The outer loop selects a robust combinationof predictors. For each specific combination of droughtindices, the inner loop controls the selection of whichand how many principal components (PCs) should beused for regression analysis. For a total of 28 years, aleave-one-out cross-validation (CV) (by year) approachwas used to evaluate the model performance. For eachstage of modelling, the optimum model structure (i.e.the robust combination of drought indices and the bestresulting PCs for the regression) was determined by theminimized CV RMSE (i.e. root mean square error fromthe cross validation).
This approach evaluates different combinations ofcandidate drought indices at each stage of modelling,which was necessary because as the crop develops, theimpact of previous months’ weather conditions on yieldbecomes less important and may only introduce noise.To save computing resources, the evaluations were not
performed on all possible combinations of candidates (i.e.different combinations from drought indices with poorcorrelations between yield residuals were ignored). Thefirst evaluated combination was a single drought indexwith the highest correlation between yield residuals. Thesubsequent combinations were created by adding the nexthighest ranked drought index at each loop step, until allcandidates were included.
However, the specific combinations of drought indicescould not be used directly in a multiple regression,because of the inherent multicollinearity among droughtindices. Multicollinearity refers to a situation in whichtwo or more explanatory variables in a multiple regres-sion model are highly correlated, with a large portionof shared variance and low levels of unique variance(Coolidge, 2000). PCA was employed to extract thesmallest number of uncorrelated components (i.e. PCs)that account for most of the variation in the original mul-tivariate data (Rogerson, 2001). Although the first severalPCs account for most of the total variance, there is noguarantee that they are the best predictors, and low vari-ance components can have significant correlation with adependant variable (Jollife, 1982; Hadi and Ling, 1998).
To select the best PCs for multiple regression analy-sis, another optimization loop (i.e. the inner loop of thenested approach) was employed. Similar to the droughtindex selection process, the PCs were ranked by com-paring their correlations between the standardized yieldresiduals. The evaluation began from the highest-rankingPC, and then iteratively added the next highest-rankingPC, until the CV RMSE started to increase. In this study,the minimum CV RMSE was achieved with no more thanfour highest-ranking PCs (one or two PCs for the majorityof cases). For each stage of modelling, a set of mini-mum CV RMSEs from different combinations of droughtindices were compared, and the optimum model struc-ture was defined as the specific combination of droughtindices and specific number of resulting ranked PCs thatobtained the lowest minimum CV RMSE in the set.
Three model evaluation statistics were employed toevaluate the prediction accuracy, including the coefficientof determination (R2), the RMSE, and the predictionaccuracy associated with each drought category. A leave-one-out cross-validation was employed again to evaluatethe prediction accuracy of the model (c.f. Qian et al.,2009). For each modelling stage, using the final-selectedpredictors and the best PCs, the predicted results for eachyear were obtained from the model calibrated with theremaining 27 years of data.
3. Results and discussion
3.1. Results of cross-validation of the MID model
The R2 and standardized yield residual RMSE resultsfor the 54 MID models (9 clusters × 6 stages) areplotted by cluster (Figure 3). The average rate of droughtcategory prediction accuracy for each stage of modellingis summarized in confusion matrices (Table II).
Copyright 2011 Royal Meteorological Society Int. J. Climatol. (2011)

L. SUN et al.
Figure 3. Plots of the R2 (left) and RMSE (right) between the observed and the predicted standardized spring wheat yield residuals by cluster.This figure is available in colour online at wileyonlinelibrary.com/journal/joc
Unsurprisingly, due to the uncertainties of (future)growing season weather conditions, the model perfor-mance at the pre-planting stage was relatively poor com-pared to that of the later stages. Only 20% of mild and11% of moderate droughts were precisely predicted, 42%of severe droughts were detected as mild or moderate,and 44% of extreme droughts were forecasted to be mildto severe at this stage. This indicates that while growingseason’s weather is critical to evolving drought condi-tions, the recharge period weather conditions also have animportant impact on drought occurrence and persistence.This is understandable, because growing season precipi-tation is usually not sufficient to meet crop demand formost regions on the prairies. If spring soil moisture levelsare drier than normal, timely above-normal precipitationis required during the growing season to make up thedeficit (Sutton, 2003). However, the chance of this occur-ring in a growing season is low on the prairies. Therefore,drought indices derived from recharge period are valu-able for agricultural drought risk assessment, providing awarning of possible drought progression as early as April.
When compared with Stage 1 and with regards to R2,the model performance at Stages 2 and 3 increased forthe most regions, but remained stable for C1 and C5.This indicates that the contributions of April and Mayweather conditions on the yields varies spatially. Forsome regions, the contributions are minor. The assess-ment accuracy was further improved at the fourth stageand reached its highest at the fifth stage (average R2 =0.60). It is not surprising that the strongest correlationbetween the drought indices and spring wheat yield resid-uals was in June (Stage 4) and July (Stage 5), becausespring wheat yield is largely determined by moisturestress during the heading and soft dough stages, whichusually occur during the second half of June through July(Arora et al., 1987; Quiring and Papakyriakou, 2003).
Crops at these stages are vulnerable to drought, and evena moderate drought may reduce the yield greatly. There-fore, June and July are the most important months fordetermining the risk of agricultural drought. Convertingthe standardized yield residuals of Stage 5 to yield resid-uals, the mean yield residual RMSE was 0.238 tha−1,ranging from 0.162 to 0.387 tha−1.
Mavromatis (2007) evaluated the SPI and three varia-tions of the PDSI (the original PDSI, a self-calibratedversion, and a modified scheme employing Priest-ley–Taylor’s approach to compute potential evapotran-spiration instead of Thornthwaite’s method) and theirrespective Z-index for accessing rain-fed common wheatand durum wheat yield in two pilot regions in north andcentral Greece. The model performance statistics showedthat the drought indices based on Palmer’s scheme aremost suitable for predicting yields. The self-calibratedPDSI ranked the highest (RMSE = 0.105 tha−1) forpredicting durum wheat residuals and the original PDSIranked the highest (RMSE = 0.149 tha−1) for predictingcommon wheat residuals. Greece has a sharply seasonalMediterranean climate, and the summer is extremely hotand rainless. Compared to the Canadian prairies, mois-ture stress is a more significant factor in limiting yieldin Greece, and thus the prediction accuracy of Palmer’sdrought indices was higher. Quiring and Papakyriakou(2003) performed an evaluation of four drought indices(SPI, PDSI, Z-index and NDI (NOAA Drought Index) forpredicting spring wheat yield on the Canadian prairiesbased on the sum of the index’s June and July values.The model evaluation indicated that the Z-index was themost appropriate index for predicting yield departureswhen there is significant moisture stress, with a meanRMSE value of 0.256 tha−1 for all 43 crop districts. Themulti-index approach was able to achieve lower meanRMSE, however, of 0.238 tha−1.
Copyright 2011 Royal Meteorological Society Int. J. Climatol. (2011)

MULTIPLE DROUGHT INDICES FOR AGRICULTURAL DROUGHT RISK ASSESSMENT
Table II. The average prediction accuracy rate (%) for each drought category across all clusters.
Predicted (%)
Actual (%) Non-drought Mild Moderate Severe Extreme
Stage 1 Non-drought 75 20 4 1 0Mild 73 20 7 0 0Moderate 53 36 11 0 0Severe 58 38 4 0 0Extreme 56 33 9 2 0
Stage 2 Non-drought 74 21 4 1 0Mild 73 19 8 0 0Moderate 64 24 11 1 0Severe 60 35 5 0 0Extreme 58 33 5 4 0
Stage 3 Non-drought 77 16 6 1 0Mild 67 22 11 0 0Moderate 54 32 12 2 0Severe 42 35 20 3 0Extreme 42 42 9 7 0
Stage 4 Non-drought 79 16 5 0 0Mild 57 30 11 2 0Moderate 46 21 26 7 0Severe 27 28 30 15 0Extreme 35 19 30 16 0
Stage 5 Non-drought 82 15 3 0 0Mild 54 35 9 2 0Moderate 25 36 29 10 0Severe 20 20 35 20 5Extreme 14 31 23 23 9
Stage 6 Non-drought 81 15 3 1 0Mild 58 32 7 3 0Moderate 25 32 37 6 0Severe 11 18 45 23 3Extreme 4 23 40 26 7
August weather conditions seemed to have little con-tribution to the prediction accuracy of Stage 6, and evenhad a negative influence for some regions (e.g. C2). Thissuggests that late summer weather plays only a minorrole in agricultural drought prediction, or may even mis-lead the assessment. This is consistent with the findingsof Whitmore (2000), who pointed out that drought has lit-tle further detrimental effect on the wheat from the harddough stage up to ripening. At this point, spring wheatis near maturity and does not respond to water stressas much as during the previous stages. A slightly drierthan normal August ensures that harvest can take placewithout difficulty or significant loss of yield (Whitmore,2000).
3.2. Spatial variability of model performance
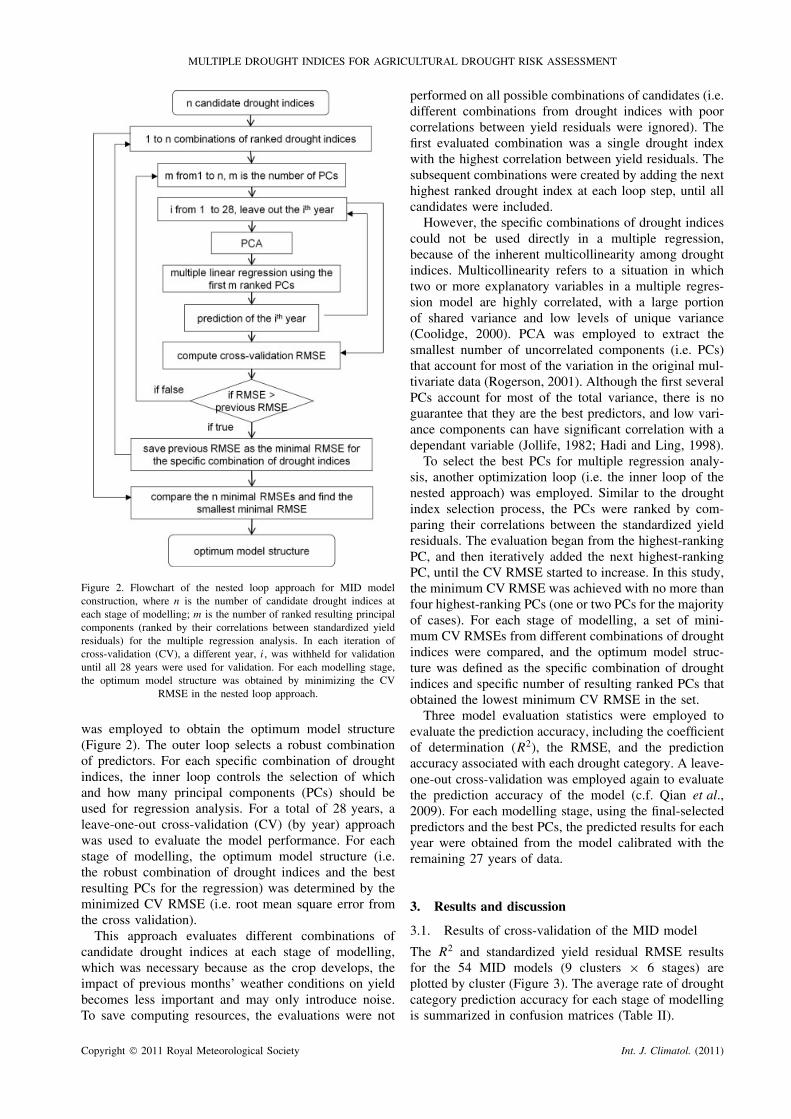
The results also revealed great spatial variation acrossthe prairies in the model performance (Figure 4), gen-erally paralleling the pattern of growing season precip-itation. Figure 5 shows the mean and the coefficientof variation (standard deviation/mean) of growing sea-son precipitation for the period of 1976 to 2003. The
south, southwest, and central prairies that receive inade-quate amounts of growing season precipitation and havea large year-to-year variability in precipitation regimetend to have stronger correlations between the droughtindices and the spring wheat yield. Conversely, the cor-relation becomes weak in the eastern prairies with abun-dant and reliable precipitation spread over the growingseason.
In addition, southern prairies tend to have more fertilesoils and higher temperature (Acton et al., 1998; Luo andZhou, 2006). These factors, which were not consideredin the model, do not normally limit crop growth inthe south, but may have increased influence on thecrop production of more northerly prairies. All thesefactors collectively influence the correlation betweenspring wheat yield and drought indices, and should bejointly considered when interpreting their relationshipsto model performance.
3.3. Comparison of multi-index and single droughtindex
To further explore the advantages of employing multipledrought indices versus a single drought index in this
Copyright 2011 Royal Meteorological Society Int. J. Climatol. (2011)
L. SUN et al.
Figure 4. Mapping the R2 for the relationship between multiple drought indices and the standardized spring wheat yield residuals. This figureis available in colour online at wileyonlinelibrary.com/journal/joc
Figure 5. Mapping the mean (left) and coefficient of variation (right) of growing season (May 1st to September 1st) precipitation for the prairies(1976–2003). This figure is available in colour online at wileyonlinelibrary.com/journal/joc
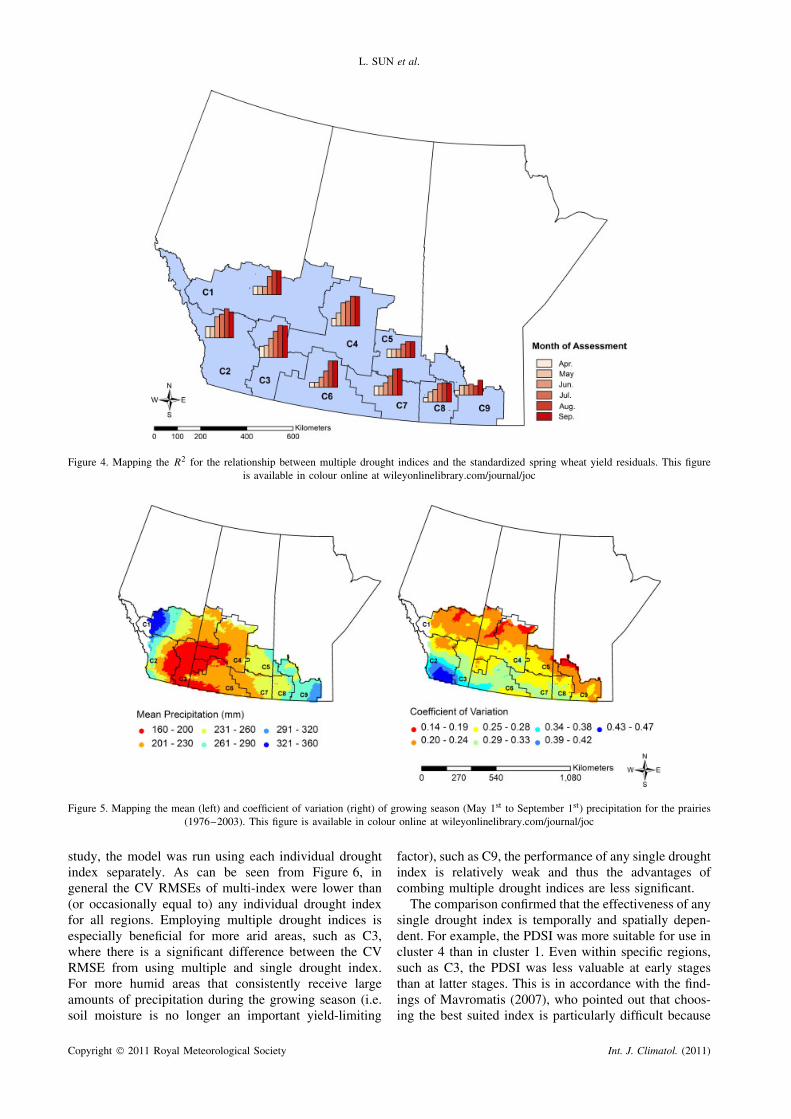
study, the model was run using each individual droughtindex separately. As can be seen from Figure 6, ingeneral the CV RMSEs of multi-index were lower than(or occasionally equal to) any individual drought indexfor all regions. Employing multiple drought indices isespecially beneficial for more arid areas, such as C3,where there is a significant difference between the CVRMSE from using multiple and single drought index.For more humid areas that consistently receive largeamounts of precipitation during the growing season (i.e.soil moisture is no longer an important yield-limiting
factor), such as C9, the performance of any single droughtindex is relatively weak and thus the advantages ofcombing multiple drought indices are less significant.
The comparison confirmed that the effectiveness of anysingle drought index is temporally and spatially depen-dent. For example, the PDSI was more suitable for use incluster 4 than in cluster 1. Even within specific regions,such as C3, the PDSI was less valuable at early stagesthan at latter stages. This is in accordance with the find-ings of Mavromatis (2007), who pointed out that choos-ing the best suited index is particularly difficult because
Copyright 2011 Royal Meteorological Society Int. J. Climatol. (2011)
MULTIPLE DROUGHT INDICES FOR AGRICULTURAL DROUGHT RISK ASSESSMENT
Figure 6. Comparison of the model CV RMSE from each individual drought index (i.e. SPI 1, SPI 3, SPI 6, PDSI and Z-index, respectively)and the multiple drought indices. This figure is available in colour online at wileyonlinelibrary.com/journal/joc
the answer will vary depending on the crop’s sensitivityto moisture storage and the characteristics of the studyarea (e.g. soil properties/variability, climate regime, etc.).Therefore, employing multi-index approach in droughtrisk management is beneficial in overcoming some of thedeficiencies in any individual index.
3.4. Limitations of the MID model
The MID model is weak at accurately predicting largenegative yield departures, as severe and extreme droughtswere routinely underpredicted (Table II). For example,none of the extreme droughts was precisely predicteduntil Stage 5, with an accuracy rate of 9%, and 77%of them were underestimated as mild to severe droughts.One possible reason for this is the insufficient numberof observations with extremely low yield. For eachregion, there are not more than 3 years with extremelow yield within the 28 study years. It is also likelythat the response of yield to dry conditions may notbe linear when the soil moisture drops below a certainthreshold. A nonlinear model may be more appropriateto estimate yields under very dry conditions (e.g. Quiringand Papakyriakou, 2003). For regions with good densityand relatively evenly distributed weather stations, theuse of in-situ station data would further improve theprediction accuracy of severe and extreme droughts.
The second weakness is that the model’s predictionaccuracy did not always show a stable increase from stageto stage during the growing season. A certain level ofdrought that had been correctly predicted at earlier stageswas likely to be mis-predicted as other categories at later
stages. This may be due to the model’s monthly scaleof assessment, which limits the opportunity to predictdroughts that occur for shorter intervals or to associatethe water stress to critical growth stages that are lessthan a month. Besides total precipitation, the distributionof the precipitation over the growing season is criticalto crop yield. In some cases, several large precipitationevents will skew the monthly precipitation totals, andthe empirical nature (specifically, the temporal resolutionof the relationships) of the model may miss cases ofinadequate precipitation in certain critical, water-sensitiveperiods (e.g. at the end of June and the beginning of July).Therefore, above average but poorly distributed growingseason precipitation can also lead to poor yield if thetiming prevents proper crop development or agriculturalpractices. Conversely, even if the total growing seasonprecipitation complies with a numerical definition ofdrought, it could possibly be so well-distributed in termsof a crop’s pattern of water demands, that it provides anadequate or even superior crop yield (Whitmore, 2000).It is likely that the model performance would be furtherimproved if drought conditions were assessed weekly orbiweekly.
In addition, some poor predictions may be attributed tofactors other than drought, such as pests, disease, weeds,and other weather-related damages (e.g. hail, wind, andfrost). Furthermore, the predictions could be affectedby the quality of the weather and observed yield data.The observed yield data have errors that are particularlydifficult to quantify due to the constraints of privacyprotection.
Copyright 2011 Royal Meteorological Society Int. J. Climatol. (2011)

L. SUN et al.
Figure 7. Mapping of the MID modelling results of 2001. The results were obtained at the beginning of each month from April to September.This figure is available in colour online at wileyonlinelibrary.com/journal/joc
3.5. MID model application
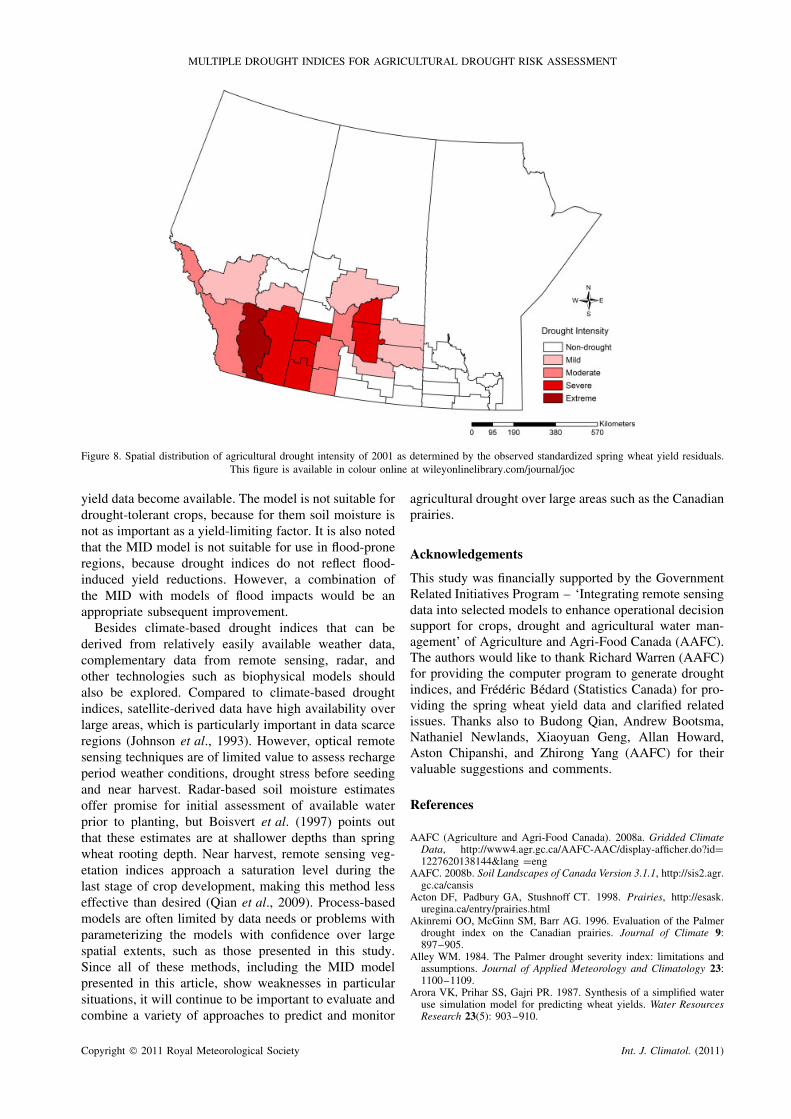
To provide a better visualization of the assessment results,the MID model was applied to 2001, which was identifiedas the most severe drought on record in parts of theprairies (Bonsal and Wheaton, 2005).
The spatial patterns and temporal behaviour of thepredictions are shown in Figure 7. Alberta and part ofSaskatchewan were identified as being under mild tomoderate drought stress at early stages. As the crop devel-oped, the increasingly severe drought risk spread to mostof the regions in Saskatchewan. Compared to the actualdrought conditions of 2001, which were determined bythe observed standardized spring wheat yield residuals(Figure 8), the overall assessment generally resembledthe dry conditions of 2001.
4. Conclusions
This article aims to present an operational model frame-work that combines the strengths of various droughtindices to provide a more comprehensive assessment ofagricultural drought conditions in the Canadian prairies.The MID model combines the strengths of variousdrought indices derived from preceding and currentmonths as they become available to better match theconditions (both spatially and temporally) in which theywork well, providing a more reliable and comprehensive
assessment of drought conditions. The results showedthat (1) the prediction accuracy of the MID model isbetter than (or occasionally equal to) using any singledrought index for all modelling stages, (2) droughtindices derived from recharge period are useful forearly drought risk detection, (3) the prediction accuracyimproved as the growing season progressed, with themost accurate assessments at the beginning of August,and (4) a multi-index approach is best suited for the morearid locations in the southern prairies, which tend to havea more variable precipitation regime.
Further improvements in the approach presented hereare likely by generating drought indices on shorter timescales (weekly or biweekly) to assess short-term dryspells during critical crop phenological stages. A non-linear model may be more appropriate to estimate cropyield under very dry conditions. Additional data that mea-sure some of the other factors affecting crop yield, suchas pests, diseases, and weather-related damages would bevaluable to further increase model performance. It wouldalso be useful to extend this study to cover other cropsthat are important to the prairies, such as canola andbarley.
The drought and responding crop yield patterns varythrough time with climate and cropping pattern changes.If the MID model is used on an operational basis, theclusters need to be updated periodically as more years of
Copyright 2011 Royal Meteorological Society Int. J. Climatol. (2011)
MULTIPLE DROUGHT INDICES FOR AGRICULTURAL DROUGHT RISK ASSESSMENT
Figure 8. Spatial distribution of agricultural drought intensity of 2001 as determined by the observed standardized spring wheat yield residuals.This figure is available in colour online at wileyonlinelibrary.com/journal/joc
yield data become available. The model is not suitable fordrought-tolerant crops, because for them soil moisture isnot as important as a yield-limiting factor. It is also notedthat the MID model is not suitable for use in flood-proneregions, because drought indices do not reflect flood-induced yield reductions. However, a combination ofthe MID with models of flood impacts would be anappropriate subsequent improvement.
Besides climate-based drought indices that can bederived from relatively easily available weather data,complementary data from remote sensing, radar, andother technologies such as biophysical models shouldalso be explored. Compared to climate-based droughtindices, satellite-derived data have high availability overlarge areas, which is particularly important in data scarceregions (Johnson et al., 1993). However, optical remotesensing techniques are of limited value to assess rechargeperiod weather conditions, drought stress before seedingand near harvest. Radar-based soil moisture estimatesoffer promise for initial assessment of available waterprior to planting, but Boisvert et al. (1997) points outthat these estimates are at shallower depths than springwheat rooting depth. Near harvest, remote sensing veg-etation indices approach a saturation level during thelast stage of crop development, making this method lesseffective than desired (Qian et al., 2009). Process-basedmodels are often limited by data needs or problems withparameterizing the models with confidence over largespatial extents, such as those presented in this study.Since all of these methods, including the MID modelpresented in this article, show weaknesses in particularsituations, it will continue to be important to evaluate andcombine a variety of approaches to predict and monitor
agricultural drought over large areas such as the Canadianprairies.
Acknowledgements
This study was financially supported by the GovernmentRelated Initiatives Program – ‘Integrating remote sensingdata into selected models to enhance operational decisionsupport for crops, drought and agricultural water man-agement’ of Agriculture and Agri-Food Canada (AAFC).The authors would like to thank Richard Warren (AAFC)for providing the computer program to generate droughtindices, and Frederic Bedard (Statistics Canada) for pro-viding the spring wheat yield data and clarified relatedissues. Thanks also to Budong Qian, Andrew Bootsma,Nathaniel Newlands, Xiaoyuan Geng, Allan Howard,Aston Chipanshi, and Zhirong Yang (AAFC) for theirvaluable suggestions and comments.
References
AAFC (Agriculture and Agri-Food Canada). 2008a. Gridded ClimateData, http://www4.agr.gc.ca/AAFC-AAC/display-afficher.do?id=1227620138144&lang =eng
AAFC. 2008b. Soil Landscapes of Canada Version 3.1.1, http://sis2.agr.gc.ca/cansis
Acton DF, Padbury GA, Stushnoff CT. 1998. Prairies, http://esask.uregina.ca/entry/prairies.html
Akinremi OO, McGinn SM, Barr AG. 1996. Evaluation of the Palmerdrought index on the Canadian prairies. Journal of Climate 9:897–905.
Alley WM. 1984. The Palmer drought severity index: limitations andassumptions. Journal of Applied Meteorology and Climatology 23:1100–1109.
Arora VK, Prihar SS, Gajri PR. 1987. Synthesis of a simplified wateruse simulation model for predicting wheat yields. Water ResourcesResearch 23(5): 903–910.
Copyright 2011 Royal Meteorological Society Int. J. Climatol. (2011)

L. SUN et al.
Ash GHB, Shaykewich CF, Raddatz RL. 1992. Moisture riskassessment for spring wheat on the eastern prairies: a water-usesimulation model. Climatological Bulletin 26(2): 65–78.
Boisvert JB, Gwyn QHJ, Chanzy A, Major DJ, Brisco B, Brown RJ.1997. Effect of surface soil moisture gradients on modelling radarbackscattering from bare fields. International Journal of RemoteSensing 18(1): 153–170.
Bonsal BR, Wheaton EE. 2005. Atmospheric circulation comparisonsbetween the 2001 and 2002 and the 1961 and 1988 Canadian prairiedroughts. Atmosphere-Ocean 43(2): 163–172.
Bordi I, Sutera A. 2007. Drought monitoring and forecasting at largescale. In Methods and Tools for Drought Analysis and Management,Rossi G, Vega T, Bonaccorso B (eds). Springer Netherlands: NewYork; 3–27.
Brown JF, Wardlow BD, Tadesse T, Hayes MJ, Reed BC. 2008. Thevegetation drought response index (VegDRI): a new integratedapproach for monitoring drought stress in vegetation. GIScience andRemote Sensing 45: 16–46.
Cancelliere A, Di Mauro G, Bonaccorso B, Rossi G. 2007. Droughtforecasting using the standardized precipitation index. WaterResources Management 21(5): 801–819.
Coolidge FL. 2000. Statistics: A Gentle Introduction. Sage: London.Environment Canada. 2008. Flooding events in Canada – Prairie
Provinces. http://www.ec.gc.ca/eau-water/default.asp?lang=En&n=E0399791-1
Guttman NB, Wallis JR, Hosking JRM. 1992. Spatial comparabilityof the Palmer drought severity index. Water Resources Bulletin 28:1111–1119.
Hadi AS, Ling RF. 1998. Some cautionary notes on the use of principalcomponents regression. The American Statistician 52: 15–19.
Hare FK, Thomas MK. 1919. Climate Canada. John Wiley and SonsCanada Limited: Toronto.
Heim RR. 2002. A review of twentieth-century drought indices usedin the United States. Bulletin of the American Meteorological Society83(8): 1149–1165.
Hill JD, Strommen ND, Sakamoto CM, Leduc SK. 1980. LACIE – anapplication of meteorology for United States and foreign wheatassessment. Journal of Applied Meteorology 19: 22–34.
Hutchinson MF, Gessler PE. 1994. Splines – more than just a smoothinterpolator. Geoderma 62: 45–67.
Johnson GE, Achutuni VR, Thiruvengadachari S, Kogan FN. 1993. Therole of NOAA satellite data in drought early warning and monitoring:selected case studies. In Drought Assessment, Management, andPlanning: Theory and Case Studies, Wilhite DA (ed). KluwerAcademic Publishers: Boston, 31–48.
Jollife IT. 1982. A note on the use of principal components inregression. Applied Statistics 31(3): 300–303.
Kumar V, Panu U. 1997. Predictive assessment of severity ofagricultural droughts based on agro-climatic factors. Journal of theAmerican Water Resources Association 33(6): 1255–1264.
Luo Y, Zhou X. 2006. Temperature and spatial variations in soilrespiration. In Soil Respiration and the Environment, Luo Y, Zhou X(eds). Academic Press: New York, 107–132.
Mavromatis T. 2007. Drought index evaluation for assessing futurewheat production in Greece. International Journal of Climatology27(7): 911–924.
McKee TB, Doesken NJ, Kleist J. 1993. The relationship of droughtfrequency and duration to time scales. In Eighth Conference onApplied Climatology, Anaheim, California, 179–184.
McKenney DW, Pedlar JH, Papadopol P, Hutchinson MF. 2006. Thedevelopment of 1901–2000 historical monthly climate models forCanada and the United States. Agricultural and Forest Meteorology138: 69–81.
Morgan R. 1985. The development and application of a drought earlywarning system in Botswana. Disasters 9(1): 44–50.
Morid S, Smakhtin V, Moghaddasi M. 2006. Comparison of sevenmeteorological indices for drought monitoring in Iran. InternationalJournal of Climatology 26: 971–985.
Nkemdirim L, Weber L. 1999. Comparison between the droughts ofthe 1930s and the 1980s in the southern prairies of Canada. Journalof Climate 12(8): 2434–2450.
Palmer WC. 1965. Meteorological drought. Research Paper No. 45, USWeather Bureau, Washington, DC.
Pomeroy JW, Goodison BE. 1997. Winter and snow. In The SurfaceClimates of Canada, Bailey WG, Oke TR, Rouse WR (eds). McGill-Queen’s University Press: Montreal, 68–100.
Priestley CHB, Taylor RJ. 1972. On the assessment of surface heatflux and evaporation using large-scale parameters. Monthly WeatherReview 100: 81–92.
Qian B, De Jong R, Warren R, Chipanshi A, Hill H. 2009. Statisticalspring wheat yield forecasting for the Canadian prairies provinces.Agricultural and Forecast Meteorology 149(6–7): 1022–1031.
Quiring SM. 2009. Monitoring drought: an evaluation of meteorologi-cal drought indices. Geography Compass 3(1): 64–88.
Quiring SM, Papakyriakou TN. 2003. An evaluation of agriculturaldrought indices for the Canadian prairies. Agricultural and ForestMeteorology 118(1–2): 49–62.
Rogerson PA. 2001. Data reduction: factor analysis and cluster analysis.In Statistical Methods for Geography, Rogerson PA (ed). Sage:London, 192–197.
Sinha CP, Chaube UC, Saxena RP. 1992. A critical analysis of droughtindices for different regions. In Proceedings World Congress onNatural Hazards, New Delhi, 10–14.
Sivakumar MKV, Wilhite DA. 2002. Drought preparedness and droughtmanagement. In International Conference on Drought Mitigation andPrevention of Land Desertification, Bled, Slovenia.
Statistics Canada. 2003. Geographic Units. http://geodepot.statcan.ca/Diss/Reference/COGG/Index e.cfm [2009].
Steinemann AC, Cavalcanti LFN. 2006. Developing multiple indica-tors and triggers for drought plans. Journal of Water ResourcesPlanning and Management 132(3): 164–174.
Steinemann AC, Hayes MJ, Cavalcanti LFN. 2005. Drought indicatorsand triggers. In Drought and Water Crises: Science, Technology,and Management Issues, Wilhite DA (ed). CRC Press: Boca Raton,71–92.
Sutton D. 2003. Agroclimatic Atlas of Alberta: Soil Moisture Conditionsin Alberta. http://www1.agric.gov.ab.ca/$department/deptdocs.nsf/all/sag6302 [2009].
Svoboda M, LeComte D, Hayes M, Heim R, Gleason K, Angel J,Rippey B, Tinker R, Palecki M, Stooksbury D, Miskus D,Stephens S. 2002. The drought monitor. Bulletin of the AmericanMeteorological Society 83(8): 1181–1190.
Thornthwaite CW. 1948. An approach toward a rational classificationof climate. Geographical Review 38(1): 55–94.
Tsakiris G, Vangelis H. 2004. Towards a drought watch system basedon spatial SPI. Water Resources Management 18(1): 1–12.
Ward JH. 1963. Hierarchical grouping to optimize an objectivefunction. Journal of the American Statistical Association 58(301):236–244.
Wells N, Goddard S, Hayes MJ. 2004. A self-calibrating Palmerdrought severity index.Journal of Climate 15: 2335–2351.
Wheaton EE, Arthur LM, Chorney B, Shewchuk S, Thorpe J, Whit-ing J, Wittrock V. 1992. The prairies drought of 1988. Climatologi-cal Bulletin 26: 188–205.
Wheaton EE, Kulshreshtha S, Wittrock V, Koshida G. 2008. Drytimes: hard lessons from the Canadian drought of 2001 and 2002.The Canadian Geographer 52(2): 241–262.
Wheaton EE, Wittrock V, Kulshreshtha S, Koshida G, Grant C,Chipanshi A, Bonsal B. 2005. Lessons learned from the Canadiandrought years of 2001 and 2002: synthesis report. SaskatchewanResearch Council, Publication No. 11602-46E03.
Whitmore JS. 2000. Hardy and drought – evasive cereal crops. InDrought Management on Farmland, Whitmore JS (ed). Springer:London, 79–97.
Williams CL, Liebman M, Edwards JW, James DE, Singer JW,Arritt R, Herzmann D. 2008. Patterns of regional yield stability inassociation with regional environmental characteristics. Crop Science48(4): 1545–1559.
Wu H, Hubbard KG, Wilhite DA. 2004. An agricultural drought risk-assessment model for corn and soybeans. International Journal ofClimatology 24(6): 723–741.
Copyright 2011 Royal Meteorological Society Int. J. Climatol. (2011)