multiple human electrophysiological responses to extremely … · multiple human...
TRANSCRIPT

138
Estonian Journal of Engineering, 2008, 14, 2, 138–153 doi: 10.3176/eng.2008.2.04
Multiple human electrophysiological responses to extremely low frequency pulsed electromagnetic
field exposures: a pilot study
Dean Cvetkovic, Qiang Fang and Irena Cosic
Australian Centre for Radiofrequency Bioeffects Research (ACRBR), School of Electrical and Computer Engineering, RMIT University, GPO Box 2476V, Melbourne, VIC 3001, Australia; [email protected] Received 25 January 2008, in revised form 10 April 2008 Abstract. This pilot study was conducted to investigate whether multiple electrophysiological activities could be altered when exposed to extremely low frequency pulsed electromagnetic field (PEMF) over a consecutive 5 day period. Our results revealed substantial changes in electro-encephalographic hemispheric asymmetry, observed at the theta band posterior predominance, an increase in the low frequency heart rate variability, changes in the surface skin temperature and skin bioelectric impedance fluctuations in its frequency spectrum. Due to the small sample size these results reveal no solid and conclusive evidence in the possible alterations in electro-physiological responses due to PEMF. Key words: electrophysiological response, electroencephalography, heart rate variability, photo-plethysmography, bioelectric impedance analysis.
1. INTRODUCTION In the past few decades, the responses of human and animal electro-
physiological signal activity to non-ionising extremely low frequency (ELF) pulsed electromagnetic field radiation have been studied. Various studies have reported that humans and animals are particularly sensitive to ELF alternative or ELF pulsed/modulated sensory stimulation [1]. A number of studies have investi-gated the therapeutic effects of ELF PEMF in the following applications: reliev-ing insomnia [2], accelerated bone repair and reducing pain [3–4] and dental sensory and cutaneous pain [5].
Several studies have reported on the influence of the ELF PEMF exposure to the heart rate variability (HRV) alterations (the low frequency (LF) and high frequency (HF) ratio) [6–8], on the 16 Hz/28.3 µT MF exposure to HRV [9], on an
139
intermittent 16.7 Hz MF exposure to the heart rate (HR) [10] and on parameters derived from the ECG, such as heart rate, duration of P and QRS waves, duration of PR and QT intervals and corrected QT (QTc) [11]. Other studies have investigated the effects of ELF PEMF on the EEG activity after the applied frequency modulated ‘Thomas pattern’ (0–500 Hz pulses in 853 ms segments (18 pulses), varying periods of 110, 220, 330 ms at ± 200 µT) [1,12,13] during a weak ELF PEMF exposure [14]. Another study investigated the effect of the magnetic field on the skin conductance [15].
The authors’ pilot studies examined the effects of sinusoidal 8.33 Hz/174 µT ELF MF [16–17] and ELF PEMF (0–100 Hz) on the human EEG activity [18–19]. These results have led the authors to further investigation of the electro-physiological activity alterations due to PEMF exposures. The aim of this pilot study is to investigate whether there are any alterations in the multiple electro-physiological activities due to ELF PEMF exposures over a consecutive 5 day period. The multiple electrophysiological parameters consisted of electro-encephalographic (EEG), photoplethysmographic (PPG), heart rate and heart rate variability values, derived from electrocardiographic (ECG), skin bioelectric impedance analysis (BIA) and skin temperature (surface) measurements. Statistical analysis for any significant differences was not carried out due to small sample size.
2. METHODS
2.1. Subjects Five healthy subjects (3 females and 2 males) were recruited to participate
(mean age 30, SD 7.8 and range 24–42) for 5 consecutive working days. RMIT University ethics committee approved the study and all subjects gave written consent prior to the experiment.
2.2. Experimental Protocol and the ELF PEMF exposure system
The experiment was of double-blinding counter-balanced type. In total there
were 25 recording sessions. At each session (day) the experimental protocol was designed to record the biosignals before (baseline) and after (post) PEMF exposure during the control and exposure conditions. The experiment was conducted between 10 am and 3 pm. The ELF PEMF stimulations were carried out with a Bioresonance BRS-500 system (Medec Limited, Australia). The BRS magnetic field exposure system consists of the programmed control unit, an applicator mattress and pillow. In order to secure double-blind conditions, a switch board was constructed to control whether the magnetic field exposure was active. The mattress (60 × 140 cm in size) was used as a magnetic field exposure system; it consisted of 3 coil pairs, embedded within the mattress and spaced strategically in order to apply the exposure to the whole body area, as shown in

140
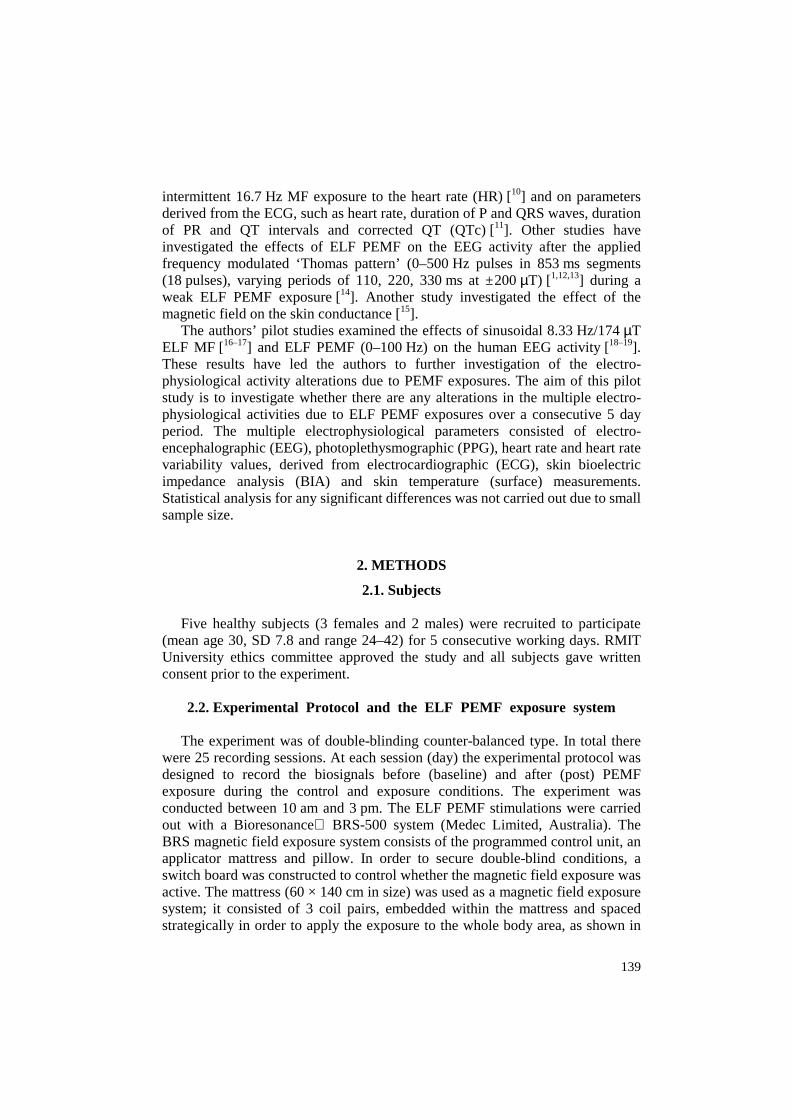
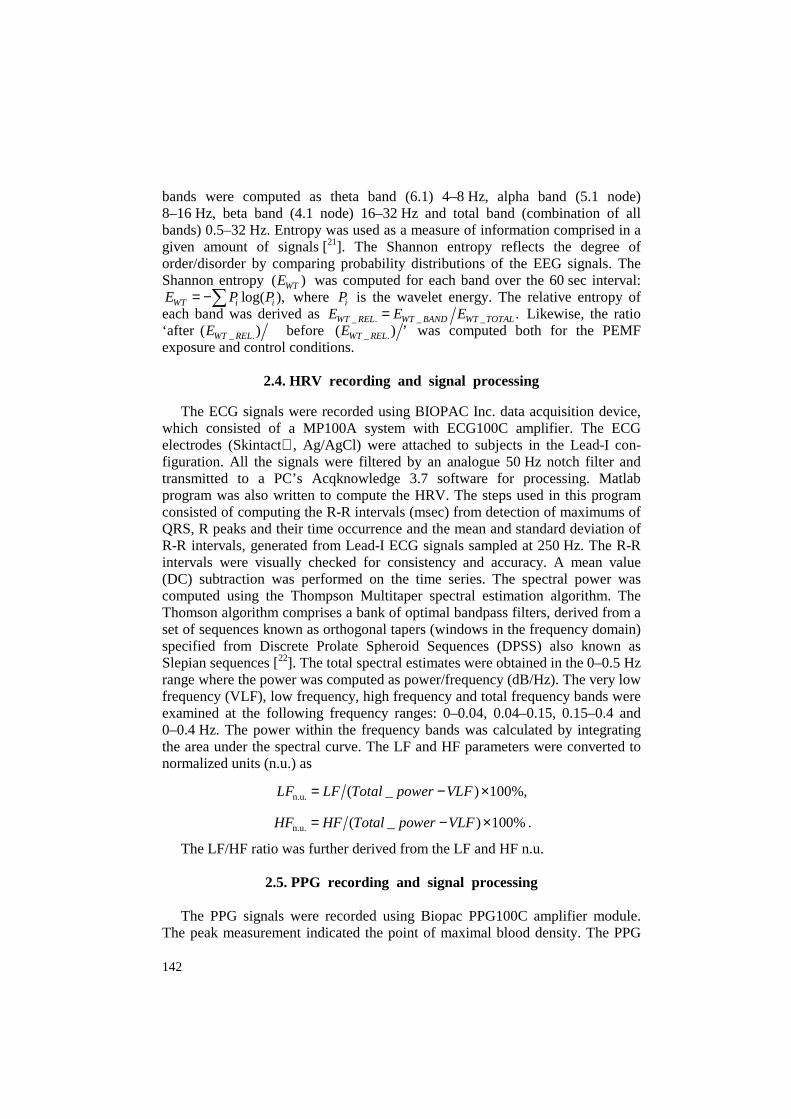
Fig. 1. The magnetic flux density (Brms) was verified by direct measurement using “Wandel and Goltermann” EFA-200 EMF Analyser and external B-field probe with a diameter of 3 cm with measurement accuracy of 6%. The applied magnetic field direction was perpendicular to the body and mattress. The commercial mattress contained three pairs of coils of different size resulting in generating different magnetic flux densities. The 10 min exposure generated the maximum magnetic flux densities of 8.3, 2 and 1 µT at the subject’s back of the neck, head/chest and stomach/hip/leg/feet region, respectively. The signal, generated from the control unit to create PEMF, consisted of ‘saw-tooth-like’ waveform (0–100 Hz) bundles and delays, each lasting 20 msec (Fig. 2).
All the biosignals were recorded for 60 sec after the ELF PEMF exposure. In order to shield the subjects and electrodes from the electric fields in the laboratory, the recording took place in a dim, 20 °C temperature-controlled room, inside a Faraday cage (1.95 × 1.83 × 2.67 m), constructed of mesh wire (2.5 × 2.5 cm) and steel frames. Inside the cage, subjects were laid in a comfort-able semi-reclining Metron® chair.
Fig. 1. The applicator mattress consisted of three pairs of coils. The first coil pair, 20 cm in diameter each, was spaced 10 cm apart at the top side of the mattress, where the subject’s head was positioned. The second coil pair, 13 cm in diameter each, was spaced at 23 cm from the first pair, approximately positioned in the middle of the mattress. The third coil pair, 10 cm in diameter, was spaced at 28 cm from the second coil pair (at the bottom of the mattress).
141
Fig. 2. The signal, generated from the control unit to create PEMF, consisted of ‘saw-tooth like’ waveform (0–100 Hz) bundles and delays, each lasting 20 msec. The signals pulsate, directed plus or minus in one direction with 0.4 V maximum, followed by a fast fall to – 0.8 V.
2.3. EEG recording montage and signal processing EEG was recorded using Mindset EEG data acquisition system and standard
10/20 International system Neuroscan 19-electrode EEG cap. The referential montage of 16 channels was used throughout this investigation. The left brain hemisphere electrodes Fp1, F7, F3, T7, C3, P7, P3 and O1 were all referenced to M1 or A1 (left mastoid) while the right brain hemisphere electrodes Fp2, F8, F4, T8, C4, P8, P4 and O2 were referenced to the right mastoid (M2 or A2). The EEG signals were sampled at the rate of 256 Hz.
Initially we analysed the data to derive the hemispheric asymmetry of left (L), right (R), anterior (A) and posterior (P) hemisphere. Four sets of EEG sites were evaluated as follows: R – over the right sites F8, F4, T8, C4, P8, P4 and O2; L – over the left sites F7, F3, T7, C3, P7, P3 and O1; A – F3, F4, F7, F8, T7, T8; and P – C3, C4, P3, P4, P7, P8, O1, O2. Fp1 and Fp2 were excluded from the analysis. Subject’s eyes remained closed throughout the testing.
The EEG frequency bands were extracted using Wavelet Packet Decomposi-tion (WPD). The WPD originates from Wavelet Transforms (WT) and offers greater flexibility in defining the frequency bands of decomposition than is given by a standard discrete wavelet transform (DWT). The WPD are generated by a filtering scheme similar to that used in a conventional DWT and are closely related to filter banks, often used to divide the EEG signal into finer set of band-pass signals. The WPD permits the functions to be further split into two or more subbands. In this study, each EEG band was decomposed by Daubechies [18–20] order 6 wavelet (db6). The calculation of the wavelet packet decomposition coefficients was made using selected nodes of the wavelet packet analysis tree. Delta band (0.5–4 Hz) was created from the following combination: delta1 (9.1 node) 0.5–1 Hz; delta2 (8.1 node) 1–2 Hz; delta3 (7.1 node) 2–4 Hz. The other
142
bands were computed as theta band (6.1) 4–8 Hz, alpha band (5.1 node) 8–16 Hz, beta band (4.1 node) 16–32 Hz and total band (combination of all bands) 0.5–32 Hz. Entropy was used as a measure of information comprised in a given amount of signals [21]. The Shannon entropy reflects the degree of order/disorder by comparing probability distributions of the EEG signals. The Shannon entropy ( )WTE was computed for each band over the 60 sec interval:
log( ),WT i iE P P= −∑ where iP is the wavelet energy. The relative entropy of each band was derived as _ . _ _ .WT REL WT BAND WT TOTALE E E= Likewise, the ratio ‘after _ .( )WT RELE before _ .( ) ’WT RELE was computed both for the PEMF exposure and control conditions.
2.4. HRV recording and signal processing
The ECG signals were recorded using BIOPAC Inc. data acquisition device,
which consisted of a MP100A system with ECG100C amplifier. The ECG electrodes (Skintact , Ag/AgCl) were attached to subjects in the Lead-I con-figuration. All the signals were filtered by an analogue 50 Hz notch filter and transmitted to a PC’s Acqknowledge 3.7 software for processing. Matlab program was also written to compute the HRV. The steps used in this program consisted of computing the R-R intervals (msec) from detection of maximums of QRS, R peaks and their time occurrence and the mean and standard deviation of R-R intervals, generated from Lead-I ECG signals sampled at 250 Hz. The R-R intervals were visually checked for consistency and accuracy. A mean value (DC) subtraction was performed on the time series. The spectral power was computed using the Thompson Multitaper spectral estimation algorithm. The Thomson algorithm comprises a bank of optimal bandpass filters, derived from a set of sequences known as orthogonal tapers (windows in the frequency domain) specified from Discrete Prolate Spheroid Sequences (DPSS) also known as Slepian sequences [22]. The total spectral estimates were obtained in the 0–0.5 Hz range where the power was computed as power/frequency (dB/Hz). The very low frequency (VLF), low frequency, high frequency and total frequency bands were examined at the following frequency ranges: 0–0.04, 0.04–0.15, 0.15–0.4 and 0–0.4 Hz. The power within the frequency bands was calculated by integrating the area under the spectral curve. The LF and HF parameters were converted to normalized units (n.u.) as
n.u. ( _ ) 100%,LF LF Total power VLF= − ×
n.u. ( _ ) 100%HF HF Total power VLF= − × .
The LF/HF ratio was further derived from the LF and HF n.u.
2.5. PPG recording and signal processing The PPG signals were recorded using Biopac PPG100C amplifier module.
The peak measurement indicated the point of maximal blood density. The PPG

143
transducer TSD200 was attached to subject’s right hand index finger using stretchable Velcro strap. The spectral density of the PPG signals, sampled at 100 Hz, were computed using the same Thompson Multitaper spectral estimation algorithm for derivation of HRV, mentioned previously. Three frequency bands were computed to estimate the blood power density. The total frequency, VLF, LF and HF (without the total frequency for normalized estimate) bands were taken as 0.003–1.125, 0.01–0.04 and 0.125–8 Hz, respectively.
2.6. Heart rate, skin temperature and bioelectric impedance analysis The heart rate (HR) was recorded using Biopac OXY100C pulse oxymeter
module via UIM100C, which was primarily used to measure the blood oxygen saturation level in a non-invasive manner. The oxygen saturation level was not measured in this study, but its TSD123 series SpO2 finger transducer (photo-diode) was used for HR recordings only. The skin (surface) temperature was recorded using Biopac SKT100C skin temperature differential amplifier module at sampling frequency of 100 Hz. The TSD202D surface temperature thermistor probe was secured to subject’s right-hand finger using the Velcro strap. The scaling was set to corresponding 5 °F/V, adjusted on the amplifier module.
The application of the bioelectric impedance analysis (BIA) method is safe, non-invasive, rapid, inexpensive, easy to use, and amenable for laboratory, clinical and field assessment of the human body composition [23]. BIA consists of the local injection of a small alternating current into the human body and the measurement of induced complex impedance (Z). Our study has used the ‘whole-body’ multiple-frequency bioelectric impedance analysis (MF-BIA) [24], using 1260 Impedance/Gain-phase Analyzer, interfaced to PC with Solarton 1294 Impedance Interface via GPIB. The 4-terminal measurement configurations were used in the recordings, where the current or signal inducing electrodes were placed on the mid-dorsum of the hand midway between voltage electrodes and the proximal metacarpal-phalangeal joint line, and similarly on the appropriate foot. The voltage sensing electrodes, 3M™ Red Dot 2330 (Ag/AgCl) series resting electrodes with tab style connector, were applied on the mid-dorsum of the wrist with the distal bony prominence of the radius and ulna as land-marks, and on the mid-anterior aspect of the ankle with the medial and lateral malleoli as location landmarks. The signal frequency sweep, 1 Hz–1 MHz/100 mVrms source was applied for each recording of the bioimpedance. The magnitude of impedance, capacitance and admittance, together with phase impedance data was collected using ‘Solartron Smart’ software and exported to Microsoft Excel and Mathwork Matlab software for further processing.
3. RESULTS
All-subject data was processed using Matlab (Mathworks, USA) software tool and processed results were statistically analysed using statistical SPSS 14

144
(SPSS Inc.) software tool. No statistical elaboration of the data has been attempted in this investigation due to the small number of subjects.
3.1. HRV and heart rate results
The R-R interval results were represented as the relative difference ratios
(exposure/before and control/before). Throughout the 5 days of testing, relative R-R interval results did not reveal any substantial difference, recorded between the exposure and control conditions (Fig. 3a). The minimal standard error (SE) difference was shown on day 4, (exposure 0.01 and control 0.02). The only evident difference between PEMF exposure and control was on days 3 and 5, with exposure being slightly smaller than control. However, the error difference was greatest on these days. The maximum mean and SE difference was exhibited on the day 3 (exposure 1.81 ± 0.84 and control 1.84 ± 0.83) and 5 (exposure 1.90 ± 0.91 and control 1.964 ± 0.97). The exposure and control conditions were all relatively larger than the ‘before’ condition (R-R interval > 1). In general, no substantial difference was found in the R-R interval results between the relative PEMF exposure and control conditions, as shown in Fig. 3a.
The heart rate results, represented by beats per minute (bpm) in Fig. 3b, revealed a two-fold characteristic. Firstly, on days 1 and 3, the PEMF exposure was substantially less than both ‘before’ and ‘control’ conditions (day 1 before 67.34 ± 3.81, exposure 64.87 ± 4.17 and control 67.47 ± 3.56, day 3 before 67.73 ± 2.85, exposure 64.12 ± 2.86 and control 67.12 ± 2.25). Secondly, on days 2, 4 and 5, the HR ‘before’ was the highest, followed by the exposure and control (least). Interestingly, the HR was also generally highest on day 2 (before 71.92 ± 4.65, exposure 69.39 ± 4.44 and control 66.07 ± 5.09) and gradually decreased throughout day 4 (before 67.39 ± 2.62, exposure 65.94 ± 3.79 and control 63.20 ± 3.26) and day 5 (before 64.91 ± 3.56, exposure 61.80 ± 4.07 and control 60.36 ± 4.52, as shown in Fig. 3b).
The LF HRV band was represented as the relative difference ratios (exposure/before and control/before) in Fig. 3c. The relative difference of exposure was higher in comparison to control on days 1, 3 and 4, with both conditions exhibiting gradual increase (day 1 exposure 1.01 ± 0.09 and control 0.93 ± 0.14, day 3 exposure 1.20 ± 0.38 and control 1.02 ± 0.26 and day 4 exposure 0.74 ± 0.15 and control 0.91 ± 0.11). Whereas the control was higher than exposure on days 2 and 5. At the HF HRV band, the control was higher than exposure condition for all the days except day 5 (exposure 1.32 ± 0.39 and control 1.07 ± 0.14, Fig. 3d).
In our pilot study, the LF/HF ratio revealed once again a two-fold charac-teristic: exposure substantially and identically higher than before and control on the days 3 (before 3.64 ± 2.50, exposure 5.85 ± 3.19 and control 1.05 ± 0.52) and 5 (before 3.33 ± 1.33, exposure 5.45 ± 3.50 and control 1.25 ± 0.56, Fig. 3e). The exposure was also slightly higher than before and control on day 1 and lower than control on days 2 (before 0.81 ± 0.25, exposure 1.60 ± 0.35 and control 2.01 ± 0.95) and 4 (before 1.03 ± 0.33, exposure 2.66 ± 1.07 and control 3.39 ± 2.09).

145
Fig. 3. The 95% confidence interval (y-axis) bar plots of ECG’s RR (a), heart rate (b), HRV’s low frequency band (c), HRV’s high frequency band (d), and HRV’s low/high frequency band ratio (e). The x axis represents the days of testing. The legends represent the PEMF conditions.

146
3.2. PPG results
The total PPG band results are shown in Fig. 4a. The most obvious difference between before, exposure and control was revealed on days 2 (before 1.38 ± 0.16, exposure 1.24 ± 0.065 and control 1.34 ± 0.11) and 4 (before 1.32 ± 0.08, exposure 1.22 ± 0.035 and control 1.34 ± 0.08). The PEMF exposure was substantially lower than before and control. Similar decrease in exposure in respect to before and control was exhibited at the HF PPG band (Fig. 4c) on days 3 (before 0.21 ± 0.10, exposure 0.11 ± 0.03 and control 0.21 ± 0.09) and 4 (before 0.71 ± 0.40, exposure 0.34 ± 0.18 and control 0.45 ± 0.15). The only time the exposure was slightly higher than both the before and control was on days 2 and 5 (before 1.116 ± 0.002, exposure 1.119 ± 0.003 and control 1.115 ± 0.002) at the LF PPG band, as shown in Fig. 4b.
Fig. 4. The 95% confidence interval (y axis) bar plots of PPG’s total frequency band (a), PPG’s low frequency band (b) and HRV’s high frequency band (c). The legend represents the PEMF conditions.

147
3.3. Skin temperature results The skin temperature (ST) results are shown in Fig. 5a as the ratio of
exposure/control (post) and before (pre). An interesting characteristic of this result is the fact that the control is higher than exposure on days 1, 2 and 3, and the exposure is higher than control on days 4 and 5. The pre-stimulation record-ing of ‘before’ was higher than both the exposure and control on the first and last day of testing. On the day 3 of testing, both exposure and control conditions
Fig. 5. The skin temperature results, relative difference between after and before (y axis), are represented by the 95% confidence interval bar (a) and quadratic curve estimation plot (b). The legend represents the PEMF conditions.

148
exhibited maximum relative difference, 1.05 and 1.04, respectively. The ST data was further described using quadratic curve estimation, represented by the following equations (Fig. 5b):
2contr 0.921 0.093 0.017 ,Y t t= + −
2exp 0.910 0.089 0.015 .Y t t= + −
The intersection of the two curves occurs on the day 4 that describes the commencement of the increase in exposure over the control condition.
3.4. EEG results
The EEG hemispheric asymmetry of anterior-posterior (A-P) and right-left
(R-L) was computed for delta, theta, alpha and beta bands (Fig. 6). The positive ratio indicated the predominance of anterior (A-P) and right (R-L) hemispheres, whereas the negative ratio indicated the posterior and left hemisphere pre-dominance over the 5 day testing period. The most evident difference between the anterior and posterior hemisphere in Fig. 6a is shown at the theta band, where the exposure condition exhibited predominance at the posterior hemisphere throughout the 5 days. The results revealed similar characteristics at the control condition, except on days 3 (control 0.09 ± 0.14) and 4 (control – 0.03 ± 0.05), which showed the anterior predominance. At the delta band, the main difference in A-P asymmetry occurs on the day 2, with exposure (anterior) and control (posterior). The alpha band exhibited a slight asymmetric A-P difference on the days 1 (exposure (anterior) and control (posterior)) and 2 (exposure (posterior) and control (anterior)). There were minimal A-P asymmetric changes in the beta band on the day 3, where the control condition showed the only posterior shift.
The right-left (R-L) hemispheric asymmetry was once again evident at the theta band. From the day 1 to day 5, there seems to be a dynamic transition from the right to the left hemisphere. For the exposure condition, this transition started earlier, from the day 2 (0.001 ± 0.05) to 3 (– 0.02 ± 0.05), as shown in Fig. 6b. Whereas, for the control condition, the right to left hemisphere transition commenced later, from the day 4 (0.03 ± 0.04) to 5(– 0.04 ± 0.04). The theta band clearly characterized the substantial difference in R-L hemispheric asymmetry at the exposure/control conditions. At the delta band, the only R-L asymmetric difference was revealed on the day 3: exposure (left) and control (right). The alpha band also exhibited a slight change in the R-L asymmetry on days 2, 3 and 5. There was no substantial difference in R-L asymmetry between the exposure and control conditions.

149
Fig. 6. The EEG hemispheric asymmetry of anterior-posterior (A-P) (a) and right-left (R-L) (b) is computed for delta, theta, alpha and beta bands by the 95% confidence interval line plots of relative difference (after/before) (y axis). The 5 days (x axis) comparison is shown between the PEMF exposure and control conditions (dark and light lines, respectively) by EEG relative entropy computations. The positive ratio indicates the predominance of anterior (A-P) and right (R-L) hemispheres, whereas the negative ratio indicates the posterior and left hemisphere predominance.
150
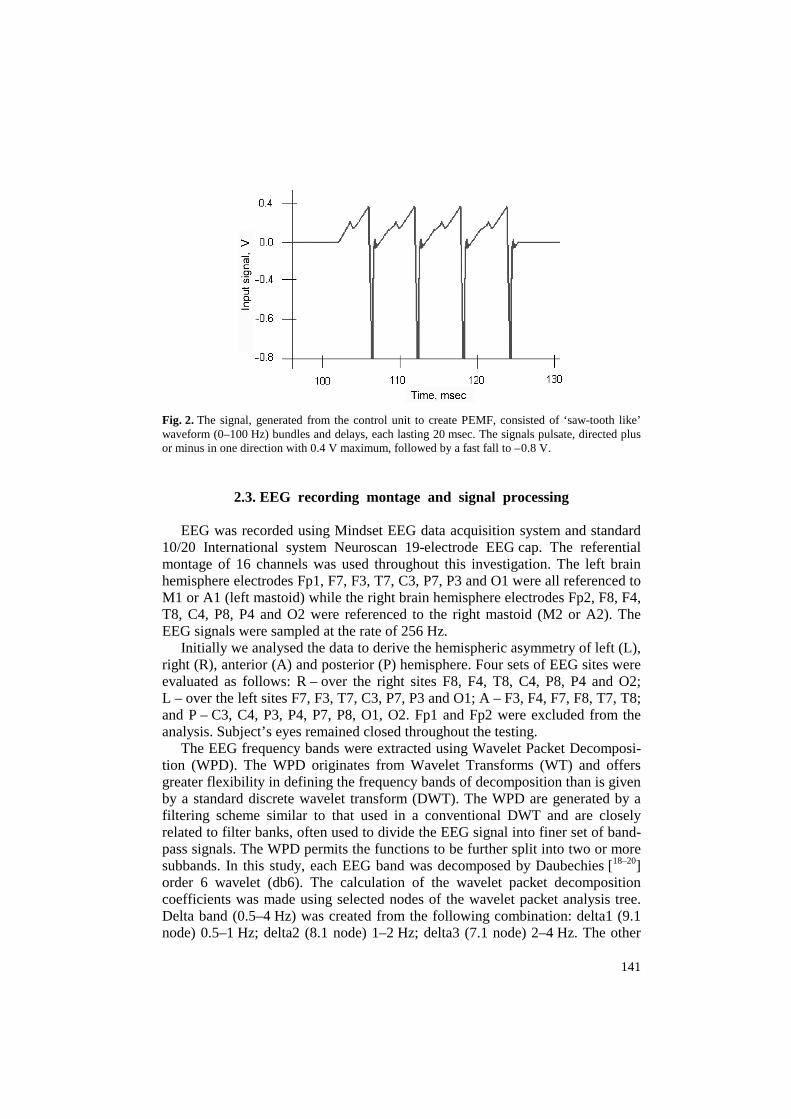
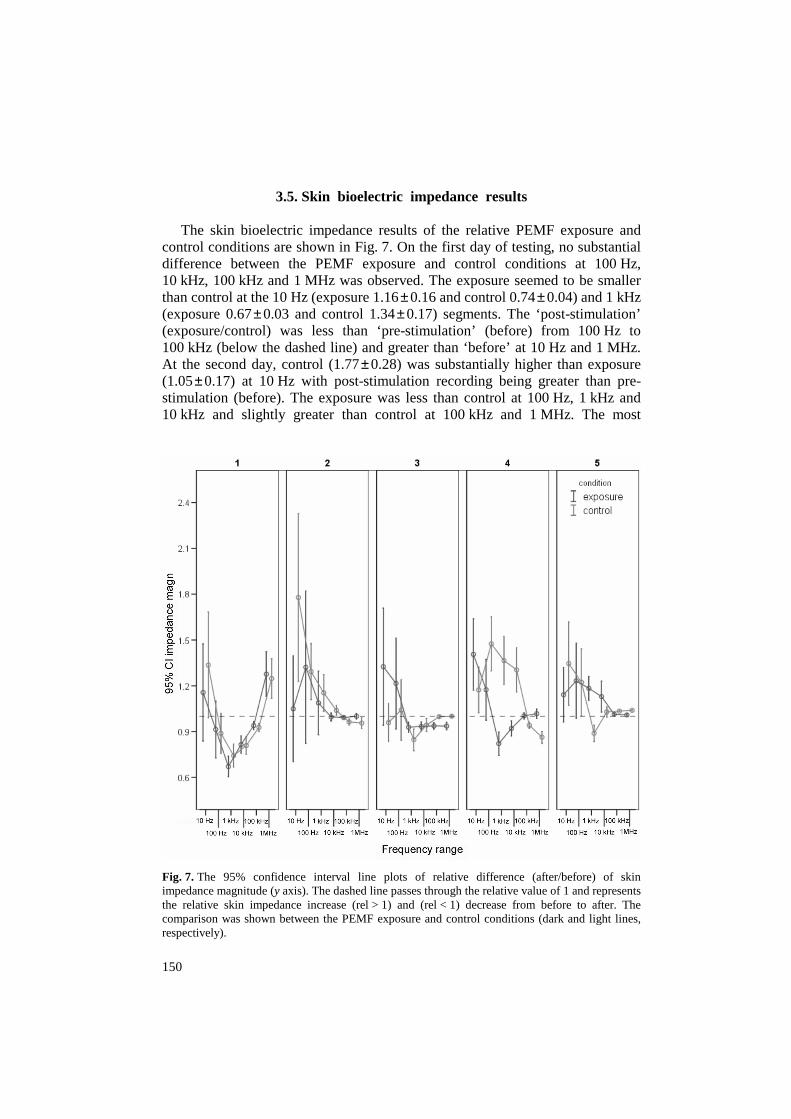
3.5. Skin bioelectric impedance results The skin bioelectric impedance results of the relative PEMF exposure and
control conditions are shown in Fig. 7. On the first day of testing, no substantial difference between the PEMF exposure and control conditions at 100 Hz, 10 kHz, 100 kHz and 1 MHz was observed. The exposure seemed to be smaller than control at the 10 Hz (exposure 1.16 ± 0.16 and control 0.74 ± 0.04) and 1 kHz (exposure 0.67 ± 0.03 and control 1.34 ± 0.17) segments. The ‘post-stimulation’ (exposure/control) was less than ‘pre-stimulation’ (before) from 100 Hz to 100 kHz (below the dashed line) and greater than ‘before’ at 10 Hz and 1 MHz. At the second day, control (1.77 ± 0.28) was substantially higher than exposure (1.05 ± 0.17) at 10 Hz with post-stimulation recording being greater than pre-stimulation (before). The exposure was less than control at 100 Hz, 1 kHz and 10 kHz and slightly greater than control at 100 kHz and 1 MHz. The most
Fig. 7. The 95% confidence interval line plots of relative difference (after/before) of skin impedance magnitude (y axis). The dashed line passes through the relative value of 1 and represents the relative skin impedance increase (rel > 1) and (rel < 1) decrease from before to after. The comparison was shown between the PEMF exposure and control conditions (dark and light lines, respectively).

151
evident difference between the exposure and control conditions was seen on the day 3, greater exposure at 10 Hz (exposure 1.33 ± 0.19 and control 0.96 ± 0.06) and 100 Hz (exposure 1.22 ± 0.15 and control 1.04 ± 0.10), day 4, with sub-stantially smaller exposure from 100 Hz (exposure 1.17 ± 0.10 and control 1.47 ± 0.09) to 10 kHz (exposure 0.92 ± 0.02 and control 1.30 ± 0.07) and day 5, smaller control at 1 kHz (exposure 1.18 ± 0.04 and control 0.89 ± 0.03) and smaller exposure at 10 Hz (exposure 1.14 ± 0.09 and control 1.35 ± 0.14). It was also evident from these results that at higher source frequencies (100 kHz and 1 MHz), the relative difference was minimal (approaching rel = 1) for both exposure and control on days 2 and 5.
4. DISCUSSION AND CONCLUSION Considering that inadequate statistical tests were conducted due to the small
sample size and multiple exposure intervals, our results may only represent the substantial differences with a large variation in high standard errors and therefore reveal no solid and conclusive evidence in the possible alterations in electro-physiological responses due to PEMF.
The substantial EEG hemispheric asymmetry alterations were observed at the theta band with the posterior predominance and gradual transition from the right to left hemisphere at the PEMF exposure period. The HRV results revealed a substantial increase in the LF band with inconsistent decrease in heart rate over the entire PEMF exposure period. A substantial increase in the vascular tone at LF PPG band was evident on certain days of PEMF exposure, in addition to a substantial decrease at total and HF PPG bands. The surface skin temperature at PEMF control was higher than exposure during the first half of testing and exposure was higher than control during the second half of testing. The measure-ments of the skin bioelectric impedance revealed an increase and decrease at PEMF relative exposure between 100 Hz and 10 kHz on days 4 and 5, respective.
Future studies might consider an inter-subject and intra-subject variance and perceived sensitivity to electromagnetic fields (electromagnetic hyper-sensitivity) [25–26]. Individual differences as well as sensitivity to EMF between subjects may cause high variability in a group. One possibility would be evaluation of alterations of individual subjects during at least a 10 weekday testing with an exclusion of the weekend, which would make it semi-consecutive, making a statistically liable test with at least 10 samples. Another option is to conduct a month-long testing (excluding weekends) on two (normal and hyper-sensitive) human subjects. If we were to extend our pilot study by pursuing this individual subject investigation, our pilot study protocol will need to be modified accordingly.

152
ACKNOWLEDGEMENTS The authors gratefully acknowledge Australian NHMRC, for their support of
the ACRBR, which has assisted in this research work. Special thanks are due also to Medec Limited (Australia) for funding this research project.
REFERENCES
1. Cook, C. M., Thomas, A. W. and Prato, F. S. Human electrophysiological and cognitive effects of exposure to ELF magnetic and ELF modulated RF and microwave fields: A review of recent studies. Bioelectromagnetics, 2002, 23, 144–157.
2. Pelka, R. B., Jaenicke, C. and Gruenwald, J. Impulse magnetic-field therapy for insomnia: A double-blind, placebo-controlled study. Adv. Therapy, 2001, 18, 174–180.
3. Bassett, C. A. Beneficial effects of electromagnetic fields. J. Cellular Biochem., 1993, 51, 387–392.
4. Bassett, C. A. Fundamental and practical aspects of therapeutic uses of pulsed electromagnetic fields (PEMFs). Critical Rev. Biomed. Eng., 1989, 17, 451–529.
5. Papi, F., Ghione, S., Rosa, C., Del Seppia, C. and Luschi, P. Exposure to oscillating magnetic field influences sensitive to electrical stimuli. II. Experiments on humans. Bioelectro-magnetics, 1995, 16, 295–300.
6. Baldi, E., Baldi, C. and Lithgow, B. J. A pilot investigation of the effects of extremely low frequency pulsed electromagnetic fields on human’s heart rate variability. Bioelectro-magnetics, 2007, 28, 64–68.
7. Tabor, Z., Michalski, J. and Rokita, E. Influence of 50 Hz magnetic field on human heart rate variability: linear and nonlinear analysis. Bioelectromagnetics, 2004, 25, 474–480.
8. Sait, M. L., Wood, A. W. and Kirsner, R. L. G. Effcets of 50 Hz magnetic field exposure on human heart rate variability with passive tilting. Physiol. Meas., 2006, 27, 73–83.
9. Sastre, A., Graham, C. and Cook, M. R. Brain frequency magnetic fields alter cardiac autonomic control mechanisms. Clinical Neurophysiol., 2000, 111, 1942–1948.
10. Griefahn, B., Kunemund, C., Blaszkewicz, M., Golka, K. and Degen, G. Experiments on effects of an intermittent 16.7-Hz magnetic field on salivary melatonin concentrations, rectal temperature and heart rate in humans. Int. Arch. Occup. Environm. Health, 2002, 75, 171–178.
11. Borjanovic, S. S., Jankovic, S. M. and Pejovic, Z. ECG changes in humans exposed to 50 Hz magnetic fields. J. Occup. Health., 2005, 47, 391–396.
12. Thomas, A. W., Kavaliers, M., Prato, F. S. and Ossenkopp, K. P. Antinociceptive effects of pulsed magnetic fields in the land snail: Cepaea nemoralis. Neurosci. Lett., 1997, 222, 107–110.
13. Cook, C. M., Thomas, A. W. and Prato, F. S. Resting EEG is affected by exposure to a pulsed ELF magnetic field. Bioelectromagnetics, 2004, 25, 196–203.
14. Cook, C. M., Thomas, A. W., Keenliside, L. and Prato, F. S. Resting EEG effects during exposure to a pulsed ELF magnetic field. Bioelectromagnetics, 2005, 26, 367–376.
15. Stevens, P. Effects of 5 s exposures to a 50 µT, 20 Hz magnetic field on skin conductance and ratings of affect and arousal. Bioelectromagnetics, 2001, 22, 219–223.
16. Cvetkovic, D. Electromagnetic and Audio-visual Stimulation of the Human Brain at Extremely Low Frequencies. PhD Thesis, RMIT University, Australia, 2005.
17. Cvetkovic, D. and Cosic, I. Automated ELF magnetic field stimulation of the human EEG activity. Integrated Computer-Aided Eng., 2006, 13, 313–328.
18. Cvetkovic, D., Ubeyli, E. D. and Cosic, I. Wavelet transform feature extraction from human PPG, ECG and EEG signal responses to ELF PEMF exposures: A pilot study. Digital Signal Process., 2007 (doi:10.1016/j.dsp.2007.05.009).

153
19. Cvetkovic, D., Fang, Q., Mahmoud, S. S. and Cosic, I. Human electrophysiological signal responses to non-continuous and consecutive 5 day ELF PEMF exposure: A pilot study. In XIII International Conference on Electrical Bioimpedance and VIII Conference on Electrical Impedance Tomography, ICEBI Proceedings. Springer, Graz, 2007.
20. Daubechies, I. The wavelet transform, time-frequency localization and signal analysis. IEEE Trans. Information Theory, 1990, 36, 961–1005.
21. Shannon, C. E. A mathematical theory of communication. Bell System Techn. J., 1948, 27, 623–656.
22. Thomson, D. J. Spectrum estimation and harmonic analysis. Proc. IEEE, 1982, 70, 1055–1096. 23. Lafargue, A. L., Cabrales, L. B. and Larramendi, R. M. Bioelectrical parameters of the whole
human body obtained through bioelectrical impedance analysis. Bioelectromagnetics, 2002, 23, 450–454.
24. Hoffer, E. C., Meador, C. K. and Simpson, D. C. Correlation of whole body impedance with total body water volume. J. Appl. Physiol., 1969, 20, 531–534.
25. Lyskov, E., Sandstrom, M. and Mild, K. H. Provocation study of persons with perceived electrical hypersensitivity and controls using magnetic field exposure and recording of electrophysiological characteristics. Bioelectromagnetics, 2001, 22, 457–462.
26. Leitgeb, N. and Schrottner, J. Electrosensibility and electromagnetic hypersensitivity. Bio-electromagnetics, 2003, 24, 387–394.
Mitmesed inimese elektrofüsioloogilised reaktsioonid kiiritamisele ultramadalsagedusliku impulsselektromagnetväljaga: pilootuuring
Dean Cvetkovic, Qiang Fang ja Irena Cosic
Pilootuuring teostati muutuste hindamiseks mitmesugustes elektrofüsioloogi-
listes elutoimingutes, kui inimest mõjutati ultramadalsagedusliku impulsselektro-magnetväljaga (UIEMV) 10 minutit päevas viie järjestikuse päeva jooksul. Iga päev mõõdeti viiel inimesel elektroentsefalograafilisi (EEG), elektrokardiograa-filisi (EKG) ja fotopletüsmograafilisi signaale, naha bioelektrilist impedantsi ning temperatuuri. Uuringutes täheldati muutusi EEG teetariba signaalide pool-keradevahelises asümmeetrias, tõusu südame taktsageduse spektri madalsagedus-likus osas, muutusi nahatemperatuuris ja bioimpedantsi fluktuatsioonides. Mõõte-tulemuste hajuvus oli väga suur, seepärast ei pruugi need tõeselt peegeldada elektrofüsioloogilist reaktsiooni UIEMV toimele ega selle poolt tekitatud või-malike muutuste olemasolu.