multiple linear regression model based on neural...
TRANSCRIPT
Hindawi Publishing CorporationAbstract and Applied AnalysisVolume 2012, Article ID 703153, 18 pagesdoi:10.1155/2012/703153
Research ArticleMultiple Linear Regression Model Based onNeural Network and Its Application inthe MBR Simulation
Chunqing Li, Zixiang Yang, Yiquan Deng, and Tao Wang
School of Computer Science and Software Technology, Tianjin Polytechnic University,Tianjin 300387, China
Correspondence should be addressed to Chunqing Li, [email protected]
Received 24 August 2012; Accepted 9 October 2012
Academic Editor: Yongfu Su
Copyright q 2012 Chunqing Li et al. This is an open access article distributed under the CreativeCommons Attribution License, which permits unrestricted use, distribution, and reproduction inany medium, provided the original work is properly cited.
The computer simulation of the membrane bioreactor MBR has become the research focus ofthe MBR simulation. In order to compensate for the defects, for example, long test period, highcost, invisible equipment seal, and so forth, on the basis of conducting in-depth study of themathematical model of the MBR, combining with neural network theory, this paper proposeda three-dimensional simulation system for MBR wastewater treatment, with fast speed, highefficiency, and good visualization. The system is researched and developed with the hybridprogramming of VC++ programming language and OpenGL, with a multifactor linear regressionmodel of affecting MBRmembrane fluxes based on neural network, applying modeling method ofinteger instead of float and quad tree recursion. The experiments show that the three-dimensionalsimulation system, using the above models and methods, has the inspiration and reference for thefuture research and application of the MBR simulation technology.
1. Introduction
TheMBR simulation is a simulation of the MBRwater treatment process and is a system usedfor special engineering and researchers. It belongs to the visual simulation, is also a dynamicsimulation, and uses visualization techniques to simulate the MBR water treatment process.Because of using the visual model designed by OpenGL technology to replace physicalprototype, it greatly reduces the cost, improves the efficiency of research, makes security geta good guarantee, and improves the ability of facing customers and the market.
The building of visual simulation system of MBR emulator uses the OpenGLgraphics standards that are designed in accordance with the computer graphic technologyand graphics principle. OpenGL technology system complies with the visual and opticalprinciples necessary for system development. OpenGL technology has many advantages and
2 Abstract and Applied Analysis
is very suitable for the visual design of the MBR simulation system. OpenGL also has lightprocessing technology, puts the parameters, the distance of light source and vertex, the lightto the vertex and the direction vector of the vertex to the viewpoint, and so forth, into opticalmodel, and calculates the color of each vertex, and can express the 3D optical properties ofthe objects through the whole lighting model. So the color of the visual simulation graphicsshows the spatial relationship between the object and the viewpoint and light sources anddemonstrates a strong sense of three dimensions in the visual features.
This paper conducts the research of MBR water treatment process by combiningnumerical simulative computing and the method of visualization in scientific computing. Itrealized the one-piece conversion from simulative computing to computer visual graphics,eliminated the lengthy middle of the data processing, and observed the distribution,variation, and objective laws of the device fastly and intuitively. At the same time, it helpsto understand the specific details of the water treatment, improve processing efficiency, andthus provide a reference and basis for the design, improvement, and optimization of theMBR.This paper will discuss it by two aspects, the data modeling and visualization realized.
2. Multifactor Mathematical Experimental Model Based on NNs
2.1. Modeling Method of MBR
The test of this paper mainly inspects pollution load, pollutant removal, the performance ofsludge sedimentation, organics removal, and so forth, all of which impact membrane foulingof the reactor. Thus, its feedback pollution situation through three-dimensional simulation ofthe MBR and measures through the membrane fouling index f :
f =(1 − Jv
J0
)× 100%. (2.1)
Known by the membrane fouling of the filter model, the initial states Rg and Rc are 0,and the MLSS is also 0. So the initial viscosity is μ0, and the initial membrane fluxes are setby the following formula J0:
J0 =Δp
μ0Rm. (2.2)
The set of the final membrane fluxes is determined by many factors, so we will discussand research it later in this paper.
2.2. Data Analysis of the MBR Modeling
Collecting actual operating data is the basis of establishing the mathematical model of theMBR. To collect relevant data, it is necessary to clear the quantitative relationship betweenthe various elements, also observe and analyse systematically for the research problems, andsummarize the goal of the decision and the restrictions of all the aspects of decision making.
For the collection of field data, this paper extracts the required data sources by usingthe field test data based on the MBR system, as Table 1 shows.
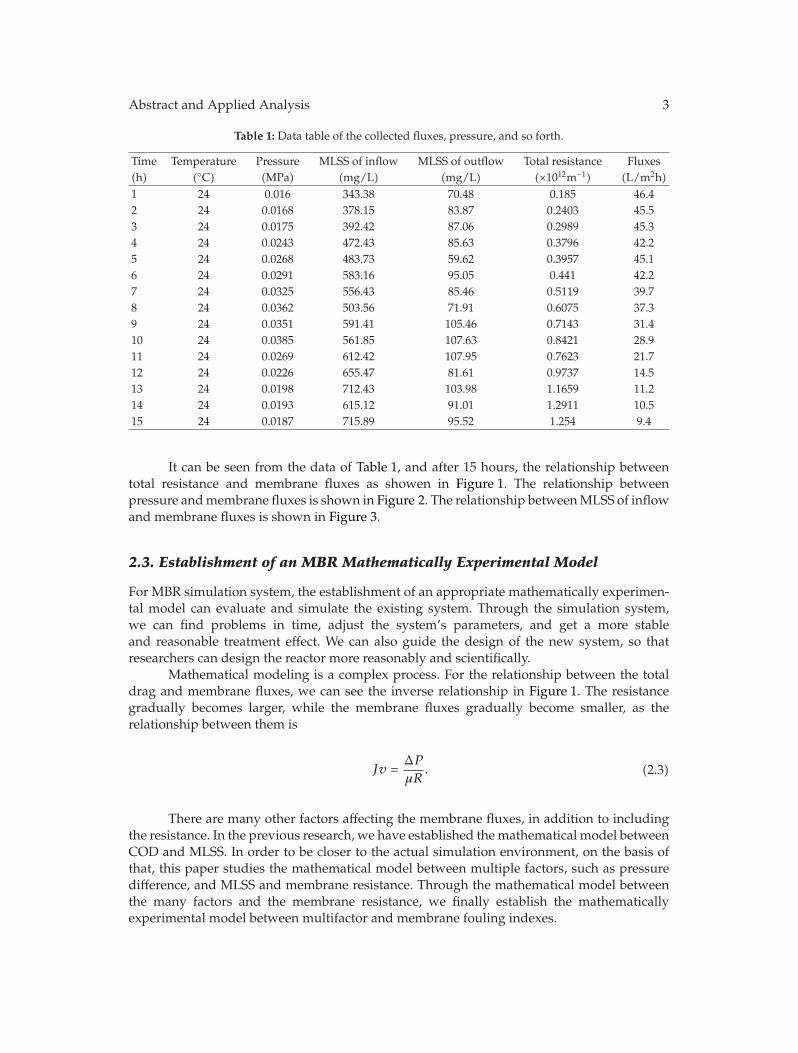
Abstract and Applied Analysis 3
Table 1: Data table of the collected fluxes, pressure, and so forth.
Time Temperature Pressure MLSS of inflow MLSS of outflow Total resistance Fluxes(h) (◦C) (MPa) (mg/L) (mg/L) (×1012m−1) (L/m2h)1 24 0.016 343.38 70.48 0.185 46.42 24 0.0168 378.15 83.87 0.2403 45.53 24 0.0175 392.42 87.06 0.2989 45.34 24 0.0243 472.43 85.63 0.3796 42.25 24 0.0268 483.73 59.62 0.3957 45.16 24 0.0291 583.16 95.05 0.441 42.27 24 0.0325 556.43 85.46 0.5119 39.78 24 0.0362 503.56 71.91 0.6075 37.39 24 0.0351 591.41 105.46 0.7143 31.410 24 0.0385 561.85 107.63 0.8421 28.911 24 0.0269 612.42 107.95 0.7623 21.712 24 0.0226 655.47 81.61 0.9737 14.513 24 0.0198 712.43 103.98 1.1659 11.214 24 0.0193 615.12 91.01 1.2911 10.515 24 0.0187 715.89 95.52 1.254 9.4
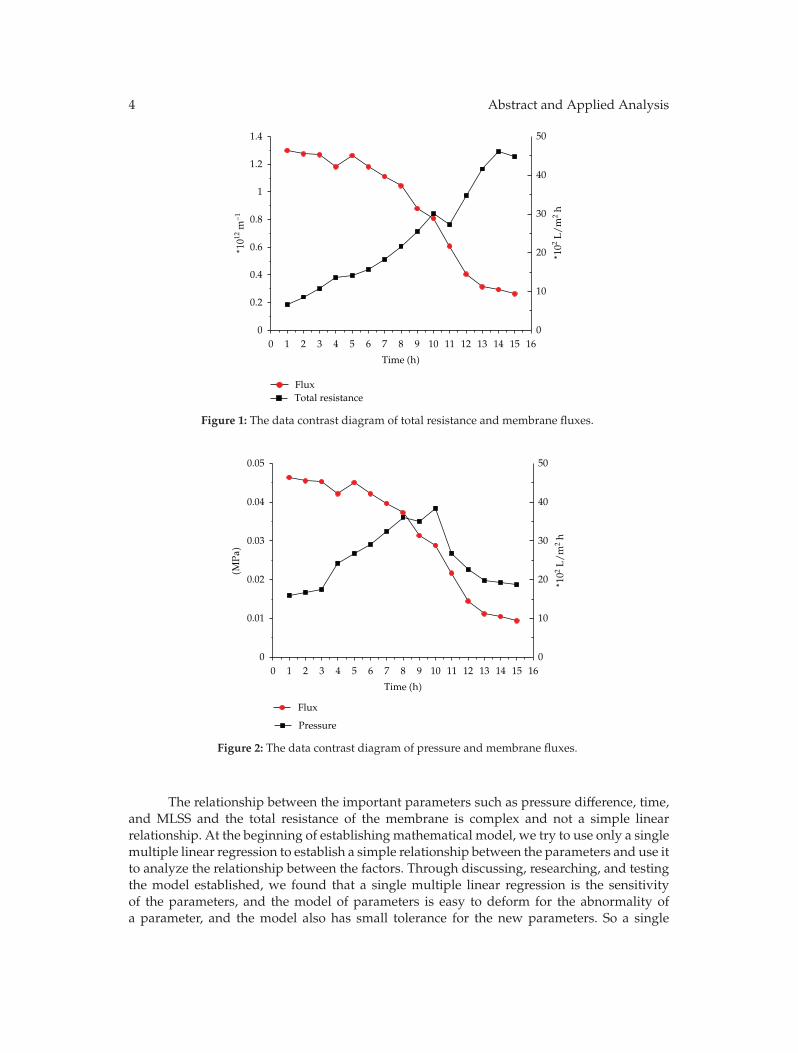
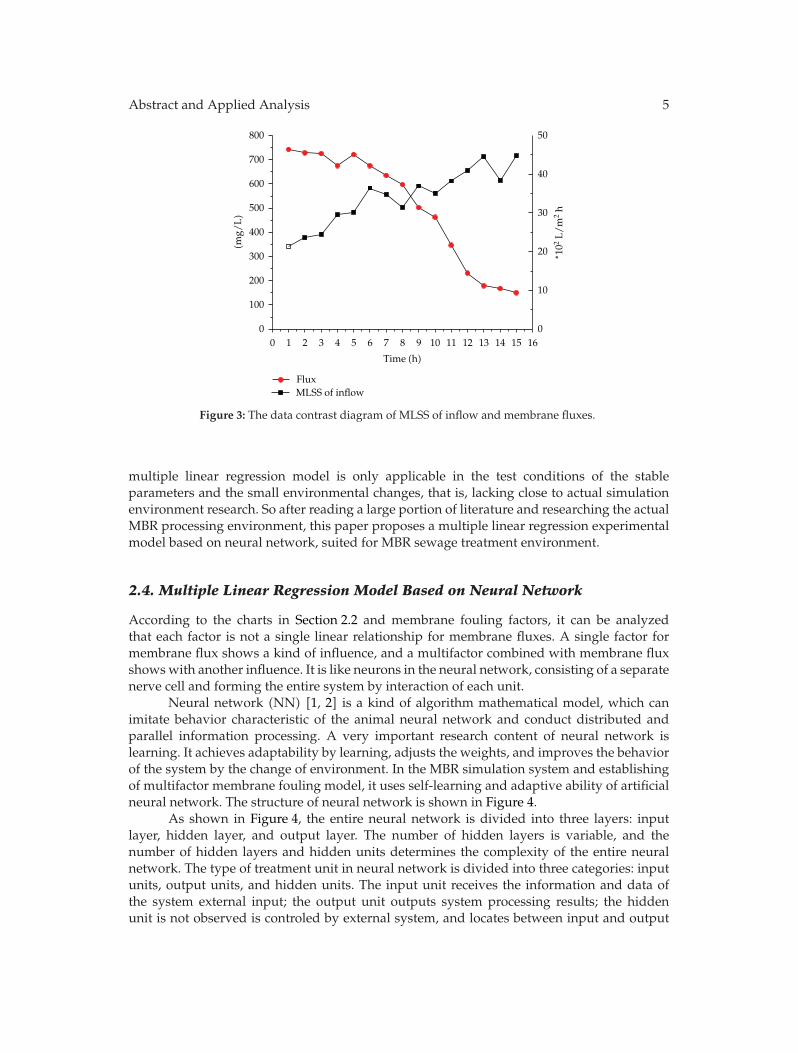
It can be seen from the data of Table 1, and after 15 hours, the relationship betweentotal resistance and membrane fluxes as showen in Figure 1. The relationship betweenpressure andmembrane fluxes is shown in Figure 2. The relationship betweenMLSS of inflowand membrane fluxes is shown in Figure 3.
2.3. Establishment of an MBR Mathematically Experimental Model
For MBR simulation system, the establishment of an appropriate mathematically experimen-tal model can evaluate and simulate the existing system. Through the simulation system,we can find problems in time, adjust the system’s parameters, and get a more stableand reasonable treatment effect. We can also guide the design of the new system, so thatresearchers can design the reactor more reasonably and scientifically.
Mathematical modeling is a complex process. For the relationship between the totaldrag and membrane fluxes, we can see the inverse relationship in Figure 1. The resistancegradually becomes larger, while the membrane fluxes gradually become smaller, as therelationship between them is
Jv =ΔP
μR. (2.3)
There are many other factors affecting the membrane fluxes, in addition to includingthe resistance. In the previous research, we have established themathematical model betweenCOD and MLSS. In order to be closer to the actual simulation environment, on the basis ofthat, this paper studies the mathematical model between multiple factors, such as pressuredifference, and MLSS and membrane resistance. Through the mathematical model betweenthe many factors and the membrane resistance, we finally establish the mathematicallyexperimental model between multifactor and membrane fouling indexes.
4 Abstract and Applied Analysis
FluxTotal resistance
∗ 1012
m−1
∗ 102
L/
m2
h
1.4
1.2
1
0.8
0.6
0.4
0.2
00 1 2 3 4 5 6 7 8 9 10 11 12 13 14 15 16
0
10
20
30
40
50
Time (h)
Figure 1: The data contrast diagram of total resistance and membrane fluxes.
0.05
0.04
0.03
0.02
0.01
0
Flux
0 1 2 3 4 5 6 7 8 9 10 11 12 13 14 15 16
Time (h)
0
10
20
30
40
50
∗ 102
L/
m2
h
Pressure
(MPa
)
Figure 2: The data contrast diagram of pressure and membrane fluxes.
The relationship between the important parameters such as pressure difference, time,and MLSS and the total resistance of the membrane is complex and not a simple linearrelationship. At the beginning of establishing mathematical model, we try to use only a singlemultiple linear regression to establish a simple relationship between the parameters and use itto analyze the relationship between the factors. Through discussing, researching, and testingthe model established, we found that a single multiple linear regression is the sensitivityof the parameters, and the model of parameters is easy to deform for the abnormality ofa parameter, and the model also has small tolerance for the new parameters. So a single
Abstract and Applied Analysis 5
(mg/
L)
∗ 102
L/
m2
h
800
700
600
500
400
300
200
100
00 1 2 3 4 5 6 7 8 9 10 11 12 13 14 15 16
Time (h)
0
10
20
30
40
50
FluxMLSS of inflow
Figure 3: The data contrast diagram of MLSS of inflow and membrane fluxes.
multiple linear regression model is only applicable in the test conditions of the stableparameters and the small environmental changes, that is, lacking close to actual simulationenvironment research. So after reading a large portion of literature and researching the actualMBR processing environment, this paper proposes a multiple linear regression experimentalmodel based on neural network, suited for MBR sewage treatment environment.
2.4. Multiple Linear Regression Model Based on Neural Network
According to the charts in Section 2.2 and membrane fouling factors, it can be analyzedthat each factor is not a single linear relationship for membrane fluxes. A single factor formembrane flux shows a kind of influence, and a multifactor combined with membrane fluxshowswith another influence. It is like neurons in the neural network, consisting of a separatenerve cell and forming the entire system by interaction of each unit.
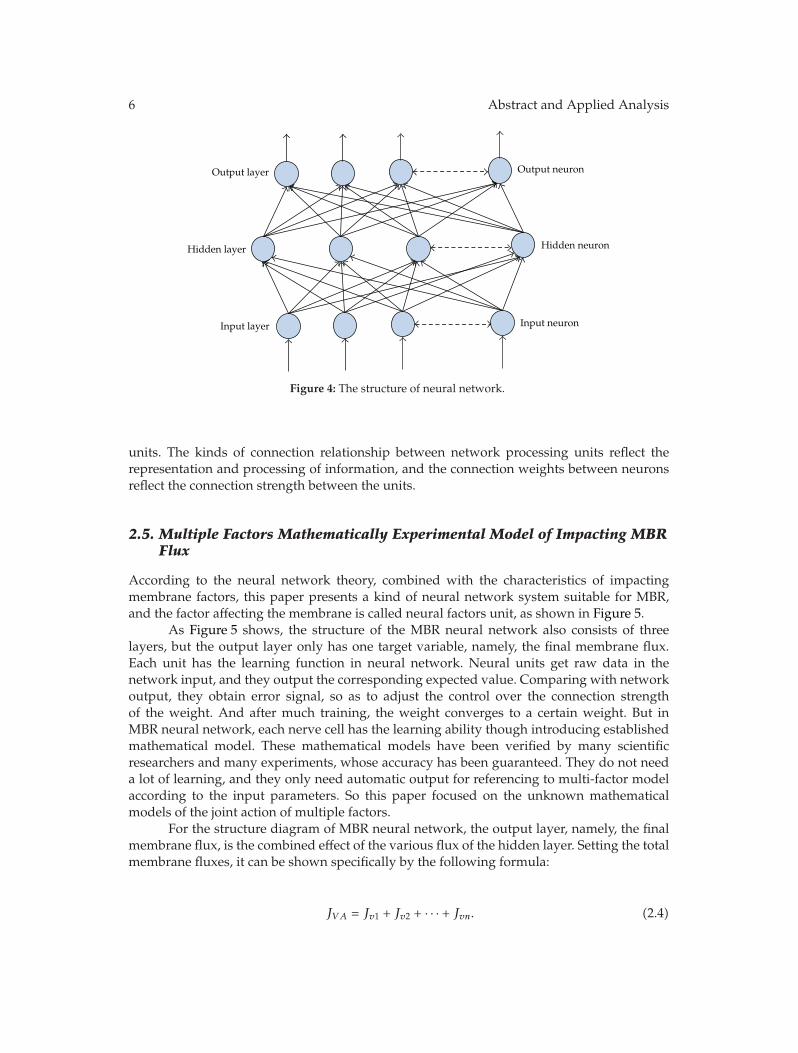
Neural network (NN) [1, 2] is a kind of algorithm mathematical model, which canimitate behavior characteristic of the animal neural network and conduct distributed andparallel information processing. A very important research content of neural network islearning. It achieves adaptability by learning, adjusts the weights, and improves the behaviorof the system by the change of environment. In the MBR simulation system and establishingof multifactor membrane fouling model, it uses self-learning and adaptive ability of artificialneural network. The structure of neural network is shown in Figure 4.
As shown in Figure 4, the entire neural network is divided into three layers: inputlayer, hidden layer, and output layer. The number of hidden layers is variable, and thenumber of hidden layers and hidden units determines the complexity of the entire neuralnetwork. The type of treatment unit in neural network is divided into three categories: inputunits, output units, and hidden units. The input unit receives the information and data ofthe system external input; the output unit outputs system processing results; the hiddenunit is not observed is controled by external system, and locates between input and output
6 Abstract and Applied Analysis
Output layer
Input layer
Hidden neuronHidden layer
Output neuron
Input neuron
Figure 4: The structure of neural network.
units. The kinds of connection relationship between network processing units reflect therepresentation and processing of information, and the connection weights between neuronsreflect the connection strength between the units.
2.5. Multiple Factors Mathematically Experimental Model of Impacting MBRFlux
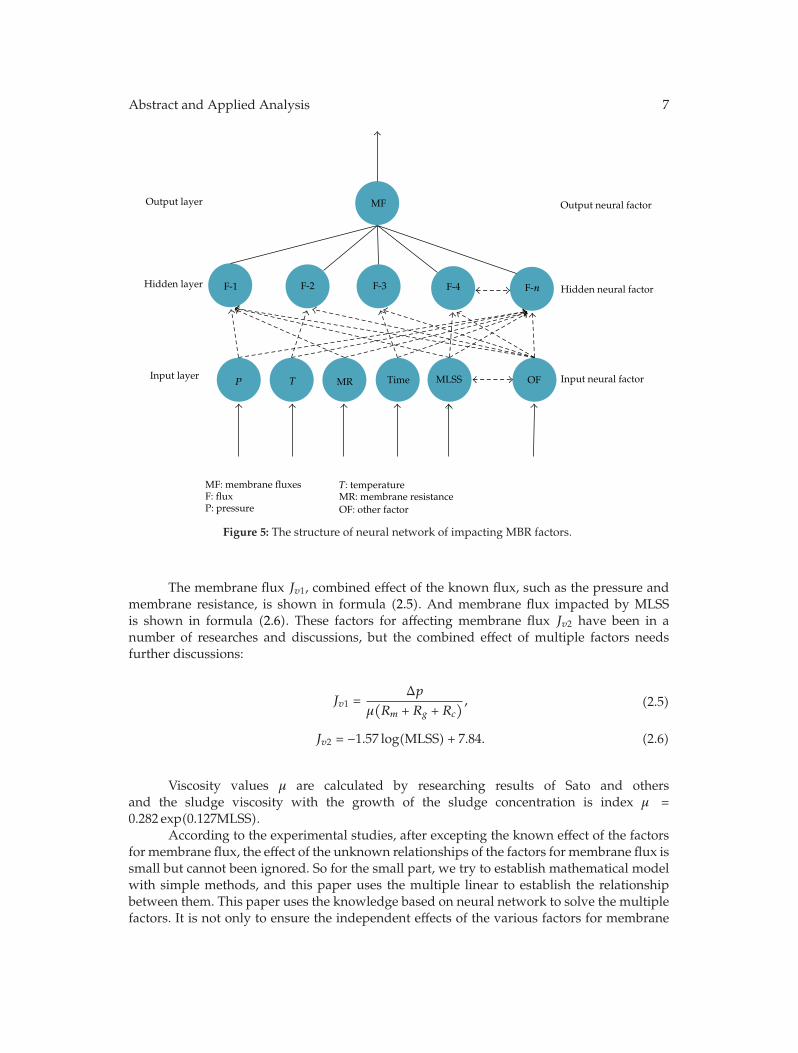
According to the neural network theory, combined with the characteristics of impactingmembrane factors, this paper presents a kind of neural network system suitable for MBR,and the factor affecting the membrane is called neural factors unit, as shown in Figure 5.
As Figure 5 shows, the structure of the MBR neural network also consists of threelayers, but the output layer only has one target variable, namely, the final membrane flux.Each unit has the learning function in neural network. Neural units get raw data in thenetwork input, and they output the corresponding expected value. Comparing with networkoutput, they obtain error signal, so as to adjust the control over the connection strengthof the weight. And after much training, the weight converges to a certain weight. But inMBR neural network, each nerve cell has the learning ability though introducing establishedmathematical model. These mathematical models have been verified by many scientificresearchers and many experiments, whose accuracy has been guaranteed. They do not needa lot of learning, and they only need automatic output for referencing to multi-factor modelaccording to the input parameters. So this paper focused on the unknown mathematicalmodels of the joint action of multiple factors.
For the structure diagram of MBR neural network, the output layer, namely, the finalmembrane flux, is the combined effect of the various flux of the hidden layer. Setting the totalmembrane fluxes, it can be shown specifically by the following formula:
JVA = Jv1 + Jv2 + · · · + Jvn. (2.4)
Abstract and Applied Analysis 7
F-1 F-2 F-3 F-4
MF
T MR Time MLSS OF
Output layer
Hidden layer
Input layer
MF: membrane fluxesF: fluxP: pressure
T: temperatureMR: membrane resistanceOF: other factor
Output neural factor
Hidden neural factor
Input neural factorP
F-n
Figure 5: The structure of neural network of impacting MBR factors.
The membrane flux Jv1, combined effect of the known flux, such as the pressure andmembrane resistance, is shown in formula (2.5). And membrane flux impacted by MLSSis shown in formula (2.6). These factors for affecting membrane flux Jv2 have been in anumber of researches and discussions, but the combined effect of multiple factors needsfurther discussions:
Jv1 =Δp
μ(Rm + Rg + Rc
) , (2.5)
Jv2 = −1.57 log(MLSS) + 7.84. (2.6)
Viscosity values μ are calculated by researching results of Sato and othersand the sludge viscosity with the growth of the sludge concentration is index μ =0.282 exp(0.127MLSS).
According to the experimental studies, after excepting the known effect of the factorsfor membrane flux, the effect of the unknown relationships of the factors for membrane flux issmall but cannot been ignored. So for the small part, we try to establish mathematical modelwith simple methods, and this paper uses the multiple linear to establish the relationshipbetween them. This paper uses the knowledge based on neural network to solve the multiplefactors. It is not only to ensure the independent effects of the various factors for membrane
8 Abstract and Applied Analysis
fluxes, but also not to neglect the common effects of the factors for membrane fluxes. So thismodel will be more close to realistic simulation environment.
The uncertainty of the effect of various factors for membrane fluxes increases thedifficulty of building model. Since the regression equation based on multiply linear is easy tofluctuate with changing the single factor, it is very suitable for the processing environment tochange very little like the MBR reactor in a short time. To establish multiple linear regressionequation is a process to estimate multi-factor linear model and seek the estimator. Similar toa linear regression analysis, the basic idea of that is also based on the principle of the leastsquare, solving the multicoefficient to make the residual sum of squares observations yi andregression value yi reach the minimum. As the residual sum of squares
Q =n∑i=1
(yi − yi
)2 = n∑i=1
[yi −
(b0 + b1xi1 + · · · + bpxip
)]2(2.7)
is nonnegative quadratic of b0, b1, . . . , bp, so the minimum must exist. According to theextremism principle, when Q is set in extremism, b0, b1, . . . , bp must meet
∂Q
∂bj= 0
(j = 0, 1, 2, . . . , p
). (2.8)
Accordingly (2.7) namely meetsn∑i=1
[yi −
(b0 + b1xi1 + · · · + bpxip
)]= 0,
n∑i=1
[yi −
(b0 + b1xi1 + · · · + bpxip
)]xi1 = 0,
n∑i=1
[yi −
(b0 + b1xi1 + · · · + bpxip
)]xij = 0,
...
n∑i=1
[yi −
(b0 + b1xi1 + · · · + bpxip
)]xip = 0.
(2.9)
The normal equations of (2.9) show the following:
nb0 +
(n∑i=1
xi1
)b1 + · · · +
(n∑i=1
xip
)bp =
n∑i=1
yi,
(n∑i=1
xi1
)b0 +
(n∑i=1
x2i1
)b1 + · · · +
(n∑i=1
xi1xip
)bp =
n∑i=1
xi1yi,
...(
n∑i=1
xip
)b0 +
(n∑i=1
xipxi1
)b1 + · · · +
(n∑i=1
x2ip
)bp =
n∑i=1
xipyi.
(2.10)
Abstract and Applied Analysis 9
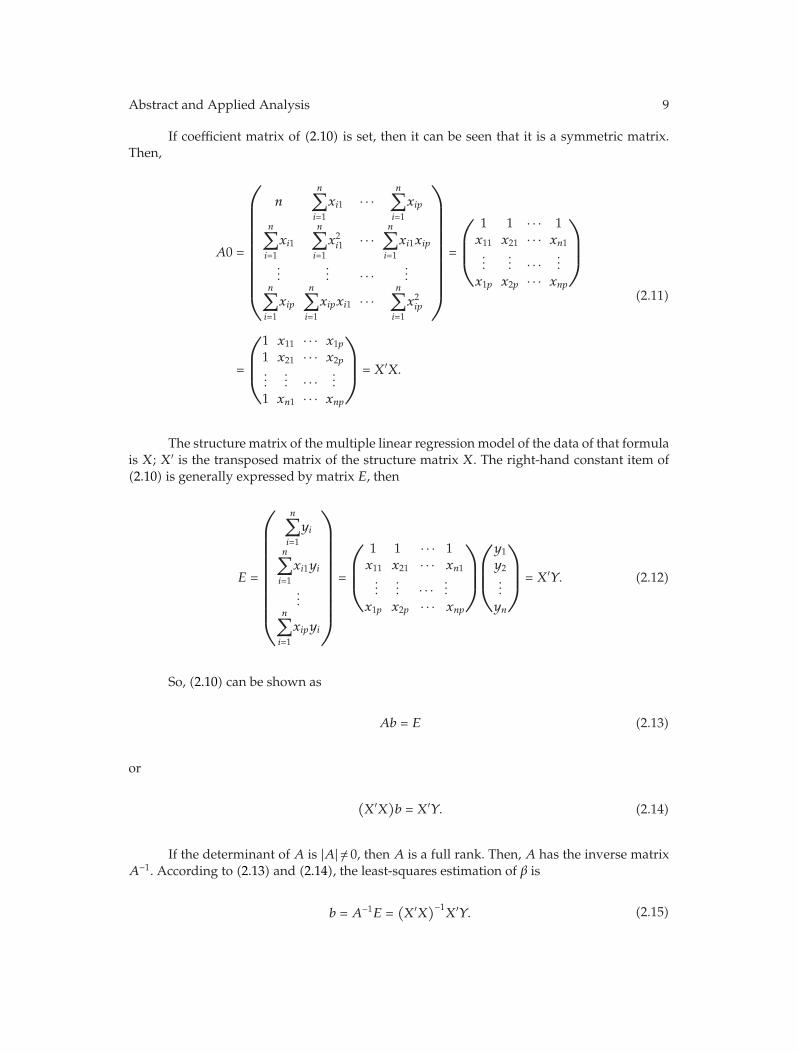
If coefficient matrix of (2.10) is set, then it can be seen that it is a symmetric matrix.Then,
A0 =
⎛⎜⎜⎜⎜⎜⎜⎜⎜⎜⎜⎜⎜⎝
nn∑i=1
xi1 · · ·n∑i=1
xip
n∑i=1
xi1
n∑i=1
x2i1 · · ·
n∑i=1
xi1xip
...... · · · ...
n∑i=1
xip
n∑i=1
xipxi1 · · ·n∑i=1
x2ip
⎞⎟⎟⎟⎟⎟⎟⎟⎟⎟⎟⎟⎟⎠
=
⎛⎜⎜⎜⎝
1 1 · · · 1x11 x21 · · · xn1...
... · · · ...x1p x2p · · · xnp
⎞⎟⎟⎟⎠
=
⎛⎜⎜⎜⎝
1 x11 · · · x1p
1 x21 · · · x2p...
... · · · ...1 xn1 · · · xnp
⎞⎟⎟⎟⎠ = X′X.
(2.11)
The structure matrix of the multiple linear regression model of the data of that formulais X; X′ is the transposed matrix of the structure matrix X. The right-hand constant item of(2.10) is generally expressed by matrix E, then
E =
⎛⎜⎜⎜⎜⎜⎜⎜⎜⎜⎜⎜⎜⎝
n∑i=1
yi
n∑i=1
xi1yi
...n∑i=1
xipyi
⎞⎟⎟⎟⎟⎟⎟⎟⎟⎟⎟⎟⎟⎠
=
⎛⎜⎜⎜⎝
1 1 · · · 1x11 x21 · · · xn1...
... · · · ...x1p x2p · · · xnp
⎞⎟⎟⎟⎠
⎛⎜⎜⎜⎝
y1
y2...yn
⎞⎟⎟⎟⎠ = X′Y. (2.12)
So, (2.10) can be shown as
Ab = E (2.13)
or
(X′X
)b = X′Y. (2.14)
If the determinant of A is |A|/= 0, then A is a full rank. Then, A has the inverse matrixA−1. According to (2.13) and (2.14), the least-squares estimation of β is
b = A−1E =(X′X
)−1X′Y. (2.15)
10 Abstract and Applied Analysis
These are regression coefficients of the multiple linear regression equations. As (2.10)is the linear equations with p + 1 unknown quantities, so the first equation of it can besimplified as
b0 = y − b1x1 − b2x2 − · · · − bpxp. (2.16)
Among this,
xj =1n
n∑i=1
xij , j = 1, 2, 3, . . . , p,
y =1n
n∑i=1
yi.
(2.17)
Putting (2.16) into the rest of equations in (2.10), then
L11b1 + L12b2 + · · · + L1pbp = L1y,
L21b1 + L22b2 + · · · + L2pbp = L2y,
...
Lp1b1 + Lp2b2 + · · · + Lppbp = Lpy.
(2.18)
Among this,
Ljk =n∑i=1
(xji − xj
)(xki − xk) =
n∑i=1
xjixki − 1n
⎛⎝ n∑
j=1
xji
⎞⎠⎛⎝ n∑
j=1
xki
⎞⎠,
Ljy =n∑i=1
(xji − xj
)(y − y
)=
n∑i=1
xjiyi − 1n
⎛⎝ n∑
j=1
xij
⎞⎠⎛⎝ n∑
j=1
yi
⎞⎠.
(2.19)
Equations (2.15) are shown by matrix, then
L · b = F. (2.20)
Therefore, the coefficient of the multiple linear regression equation can first solve L by(2.19) and then go back to (2.20). Then we can solve coefficient b by Gauss transform and putcoefficient b into regression equation
y = b0 + b1x1 + b2x2 + · · · + bnxn. (2.21)
Abstract and Applied Analysis 11
We put the regression equation of membrane fluxes between the multiple factors thatis solved into the index equation of the membrane fouling. Then,
f =(1 − JVA
J0
)× 100%
=(1 − Jv1 + Jv2 + · · · + μ(b0 + b1x1 + b2x2 + · · · + bnxn)
μ0Rm
)× 100%.
(2.22)
Here, the mathematically experimental model of the MBR membrane fouling indexhas been built.
3. The Process of Three-Dimensional Simulation of the MBR
This subject is based on VC++ 6.0 and OpenGL, combines the real-time processing of the dataof the MBR simulation system with the three-dimensional graphics processing module, andconducts the real-time three-dimensional solid model and data generated.
It is a good support for OpenGL in the Windows operating system, which makesdeveloping OpenGL applications become more simple and fast by using the VC++ 6.0 orthe Visual C++ of other versions, such as VS2005 and others in Windows system [3, 4].The development tool used by this topic is VC++ 6.0 with a good support for the OpenGLlibrary and uses a visual programming environment provided by the OpenGL graphicslibrary. These series of instructions and functions cooperate with flexible application guidesAppWizard and the basic class librariesMFC sound of VC++ 6.0, which can greatly simplifythe development of three-dimensional graphic programming in the MBR three-dimensionalsimulation system [5, 6].
3.1. Application Interface of VC++ 6.0 and OpenGL
It needs to establish the interface application [7] of VC++ 6.0 and OpenGL to developapplications by cooperating development tools of VC++ 6.0 with OpenGL, and we mustconfigure the parameters in the VC++ 6.0 development environment. It is not consistent withthe method of the establishment of OpenGL graphics libraries, graphics device interface GDIof the Windows, and most of MFC applications, whose graphics libraries have nothing todo with the operating system and whose unique design makes the Windows provide it withsome special API function libraries.
After related parameters are set, in order to meet the special needs of the OpenGLpixel format, we need to reset the pixel format of the drawing window. Here, we declare astructure variable Pixelformatdescriptor and make the structure variable support OpenGLand the color mode of it, but we also need to set appropriately some structural members.Then, we use the structure variable as parameter to call function ChoosePixelFormat(), so asto allocate a number pixel formats. Then we call SetPixelFormat() to set the number of pixelformats allocated to the current pixel format. After reseting the pixel format, the next stepis to establish the coloring scene for OpenGL. The role of the coloring scene is equivalentto the scene of the device in Windows and is similar to the equipment scene. Only aftersetting the coloring scene, OpenGL can call the drawing statement by itself to draw graphicsin Windows.
12 Abstract and Applied Analysis
Win32API provides several scene functions operating coloring with the prefix wgl,including wglCreateContext(), wglDeleteContext(), wglGetCurrentContent(), wglGetCur-rentDC(), and wglDeleteContent(). What we need to know is that the coloring scene has setthread for unit. Namely, in order to execute statements of the drawing function of the coloringscene in OpenGL, each drawing thread must use a coloring scene as the scene coloring scene.In these functions of the coloring scene, wglCreateContext() is the function established by thecoloring scene, with a handle of the device scene as its parameter and returning a handle ofthe coloring scene linking with the handle of the equipment scene. Then we call the functionwglMakeCurrent() with these two handle as parameters, which makes the coloring scene asthe coloring scene used by the current thread. Then, it is built the application programminginterface of the VC++ 6.0 and OpenGL in Windows.
3.2. Method of Building Virtual Model of the MBR Simulation
In the virtual system of the MBR simulation, the MBR water treatment is the most importantpart of the simulation and also the researching focus of this subject. Through providingthese advanced features of the OpenGL for the MBR mathematical model that has beenestablished, including modeling, coordinate transformation, coloring, light, and smooth ofthe two-dimensional and three-dimensional graphics functions and texture mapping andNURBS curve, the virtual model of the MBR simulation can generate the three-dimensionalsimulation scene of the MBR and draw three-dimensional objects [8].
The synthesis method is the basic method of building a virtual model in OpenGL.Using OpenGL to draw the three-dimensional entity model is the same with other entitymodels, and they all are synthesized through the simple rule and have three cases as follows.
(1) The synthesis of the rule entity, such as the design of the rule entity of shape modelof the MBR reactor, can simply use the spatial geometry provided by the OpenGL,such as the combination of cylinder, the cone, and the sphere. Then changing thesize and location of these spatial geometries, through adjusting some parameters ofOpenGL functions, makes them combine into the entity rule that meets the demand.
(2) The synthesis of the surfacely complex entity, such as the design of the sludge layerof the MBR reactor, can use the backup provided by NURBS functions in OpenGLGlu library. Through the evaluating program, OpenGL can draw the number ofthe NURBSs and can also calculate the number of the curves and surfaces of theBezier. When we need to draw the curved surface, wemust first determine the mostsimilar polygon to the maximum plane of this surface or use directly the polygon ofthe physical interface to ensure that the vertexes of the polygon locate in the edgeof the surface basically. After the polygon is established, we construct the surfacebased on that again, and the degree of the bump of the surface can be determinedby controlling the position of the point. For the construction of the closed surface,we need to ensure the smoothness of the junctions by arranging the same controlpoints in the junction.
(3) The synthesis of irregular complex entities: the triangle can join into any polygon,and its function is outstanding in the OpenGL programming design. So it ispreferred in the design of OpenGL physical synthetic, and in the hardware level,the drawing of the triangle is highly optimized by most of the three-dimensionalaccelerated hardware and the accelerated card of the graphics. For some irregular
Abstract and Applied Analysis 13
entities, we can first synthesize some simple geometry through the triangle orpolygon and then combine them. And for those like the membrane module of theMBR, they need to show the detail feature of the local one, while the surface of themembrane module changes with membrane fouling. For the kind of the object withchangable, complex graphics or needing to express the detail feature of the local, itis especially suitable to join with the triangle.
3.3. Build the Virtual System of the MBR Simulation
The virtual object of this paper is mainly the virtual device class including the simulation ofthe MBR water treatment. In order to simulate all kinds of virtual objects in the process ofthe MBR water treatment, we need to build the behavior model of various objects, and theyhave the essential difference of this simple geometric model. The object-oriented technologyis the ideal choice in the design and realization of the virtual object. Through the object-oriented technology, it is easy to make the object of the virtual entity show consistencywith the behavior of the physical object that it corresponds to, and then the kind of virtualsystem can show authenticity. For the kind of virtual device of the MBR membrane modulehaving the capacity of the conduct, the object of object-oriented technology corresponds to thevirtual device, object’s properties show the properties of the virtual device, and the methodof the object shows the behavior of the device. The encapsulation of the object makes themmaintain the excellent interface between objects and the independence at the same time, andthe polymorphism of the object makes the class library have a good extensibility, and theinheritance of the object reflects the classifiable level of the device.
4. Visual Simulation of the MBR Mathematically Experimental Model
After the mathematic test model and the virtual model built, it still needs to research thestate of the MBR reactor by combining the method of numerical simulation and scientificvisualization. It abandons the original output of the tedium digital form and realizes theconversion from mathematical simulation to visual graphics. It can also observe the state,change, and related rules of the MBR water treatment fastly and intuitively, so as to offer thereference and basis for the design, improvement and optimization of the MBR.
The equipments need for research include sewage pumps, air pump, flow meter,vacuum gauge, and MBR. The component of the membrane that this subject adopts is hollowfiber membrane microporous filter (MF) components of polyvinylidene fluoride (PVDF)from the research center of Tianjin Motimo, and fiber aperture is 0.2μm of the externalpressure type water; the efficient area used is 25m2. For the MBR test model, according tothe entity parameters of the model given, we first build a virtual three-dimensional modelusing OpenGL.
4.1. Equipment Specifications of the MBR
PVDF has the characteristics of good antipollution performance, high flux, the smoothnessin the surface of inside and outside, relatively high strength, good recovery in cleaning flux,and so on. The parameters of the main performance are as in Table 2.
14 Abstract and Applied Analysis
Table 2: The membrane parameter of PVDF.
Physical parameters IndexInner diameter (mm) 0.7 ∼ 0.9Wall thickness (mm) 0.6Fiber aperture (m) 0.2External diameter (mm) 1.3 ∼ 1.5Area (m2) 20Tolerance range of PH value 2 ∼ 13Tolerance range of temperature ( ◦C) 1 ∼ 40Effluent turbidity (NTU) <0.2Pressure load (MPa) −0.01 ∼ −0.05
Table 3: Equipment specifications of the MBR.
Physical parameters IndexNumber of membranes (slice) 15Area of membrane (m2) 300Design flux of membrane (T/D) 50 ∼ 75Size of membrane reactor (mm) 1450 ∗ 780 ∗ 2000
In this paper, we use water processor composed of 15 pieces of membrane biologicalreactor fixed volume, and the specific parameters of the equipment are shown in Table 3.
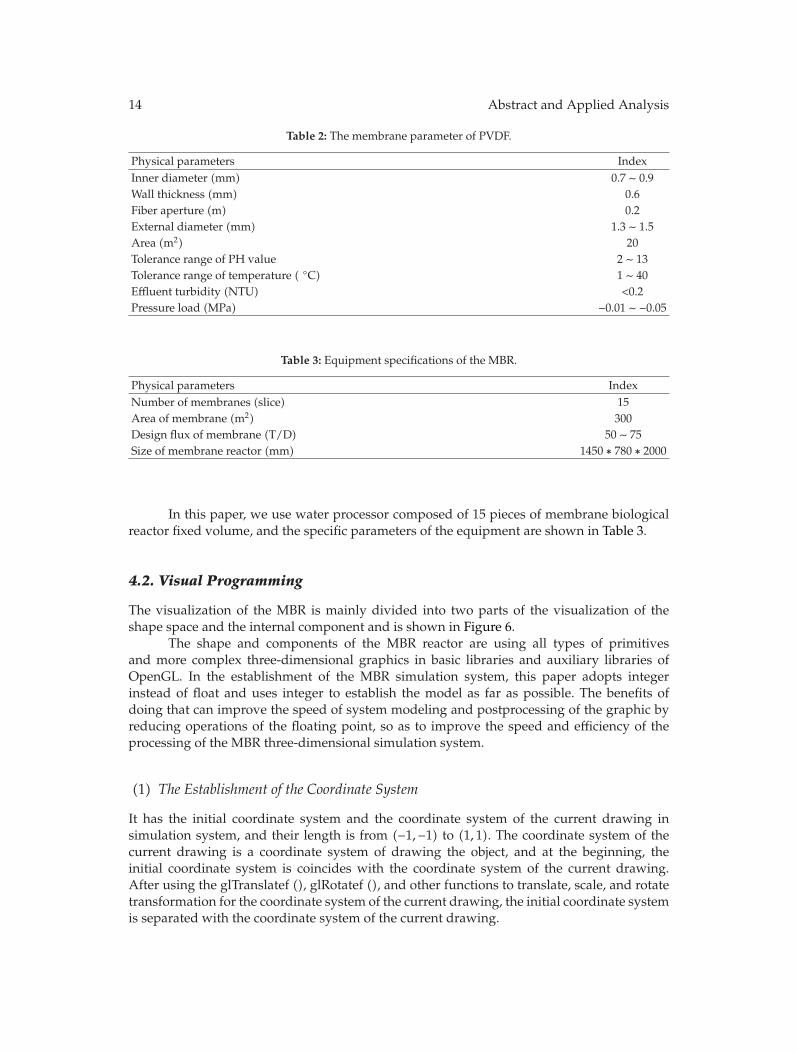
4.2. Visual Programming
The visualization of the MBR is mainly divided into two parts of the visualization of theshape space and the internal component and is shown in Figure 6.
The shape and components of the MBR reactor are using all types of primitivesand more complex three-dimensional graphics in basic libraries and auxiliary libraries ofOpenGL. In the establishment of the MBR simulation system, this paper adopts integerinstead of float and uses integer to establish the model as far as possible. The benefits ofdoing that can improve the speed of system modeling and postprocessing of the graphic byreducing operations of the floating point, so as to improve the speed and efficiency of theprocessing of the MBR three-dimensional simulation system.
(1) The Establishment of the Coordinate System
It has the initial coordinate system and the coordinate system of the current drawing insimulation system, and their length is from (−1,−1) to (1, 1). The coordinate system of thecurrent drawing is a coordinate system of drawing the object, and at the beginning, theinitial coordinate system is coincides with the coordinate system of the current drawing.After using the glTranslatef (), glRotatef (), and other functions to translate, scale, and rotatetransformation for the coordinate system of the current drawing, the initial coordinate systemis separated with the coordinate system of the current drawing.
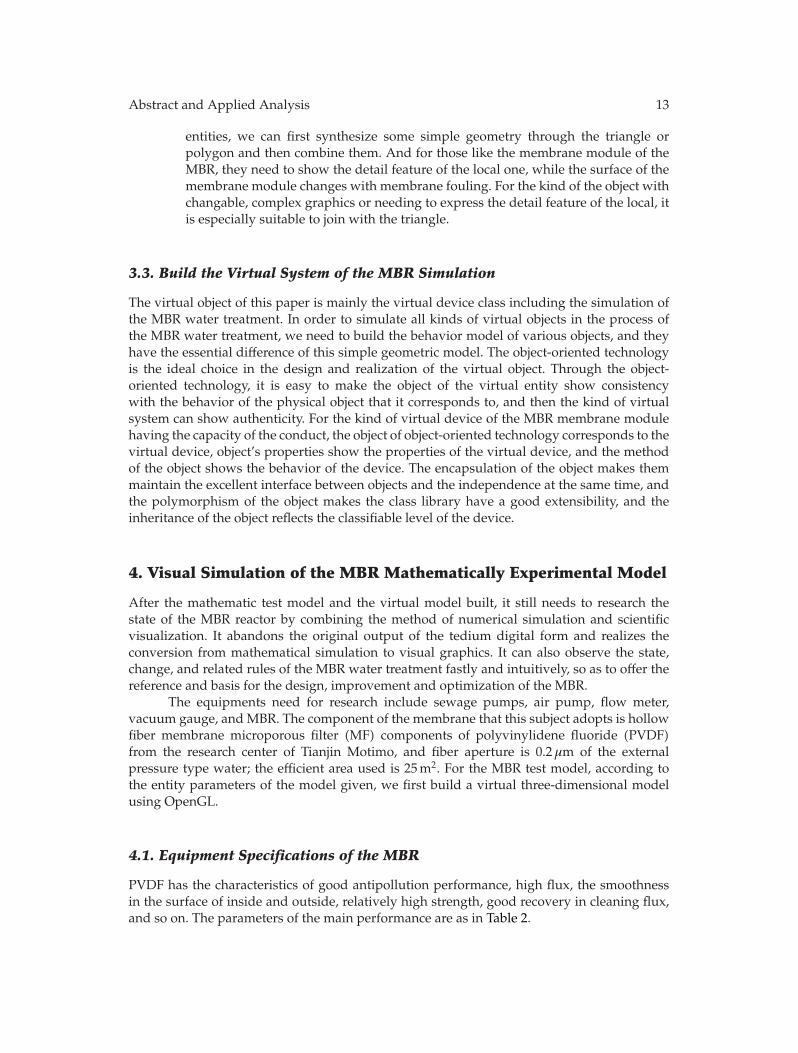
Abstract and Applied Analysis 15
MBR visualization
Appearancemodeling
Componentmodeling
Shapevisualization
Componentvisualization
Componenttransform
Figure 6: Process of the MBR visualization.
(2) Establishment of the Model
The establishment of the MBR reactor model requires the extraction, expression, andquantization of the data. The extraction of data is according to the parameters of the MBRequipment provided. And after extracting the parameter, we need the parameter to abstract,analyse and correct. Then we can quantify the data and model it.
(a) Establishment of the Framework
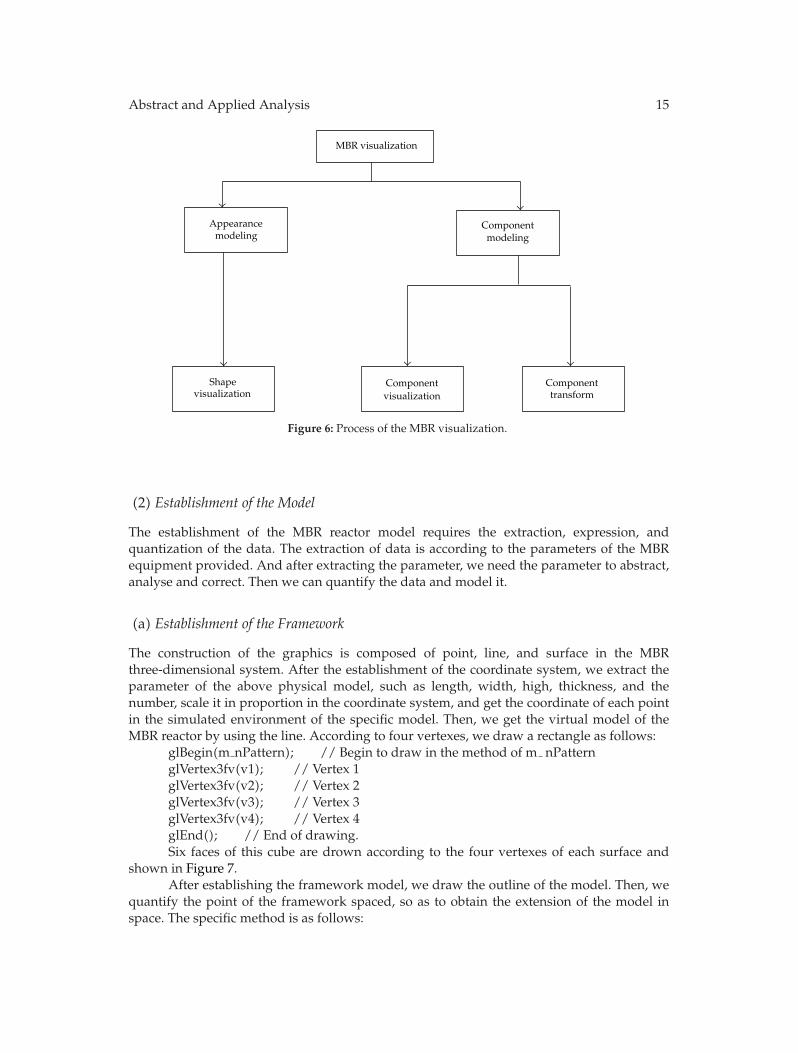
The construction of the graphics is composed of point, line, and surface in the MBRthree-dimensional system. After the establishment of the coordinate system, we extract theparameter of the above physical model, such as length, width, high, thickness, and thenumber, scale it in proportion in the coordinate system, and get the coordinate of each pointin the simulated environment of the specific model. Then, we get the virtual model of theMBR reactor by using the line. According to four vertexes, we draw a rectangle as follows:
glBegin(m nPattern); // Begin to draw in the method of m nPatternglVertex3fv(v1); // Vertex 1glVertex3fv(v2); // Vertex 2glVertex3fv(v3); // Vertex 3glVertex3fv(v4); // Vertex 4glEnd(); // End of drawing.Six faces of this cube are drown according to the four vertexes of each surface and
shown in Figure 7.After establishing the framework model, we draw the outline of the model. Then, we
quantify the point of the framework spaced, so as to obtain the extension of the model inspace. The specific method is as follows:
16 Abstract and Applied Analysis
Figure 7: Framework model of the MBR reactor.
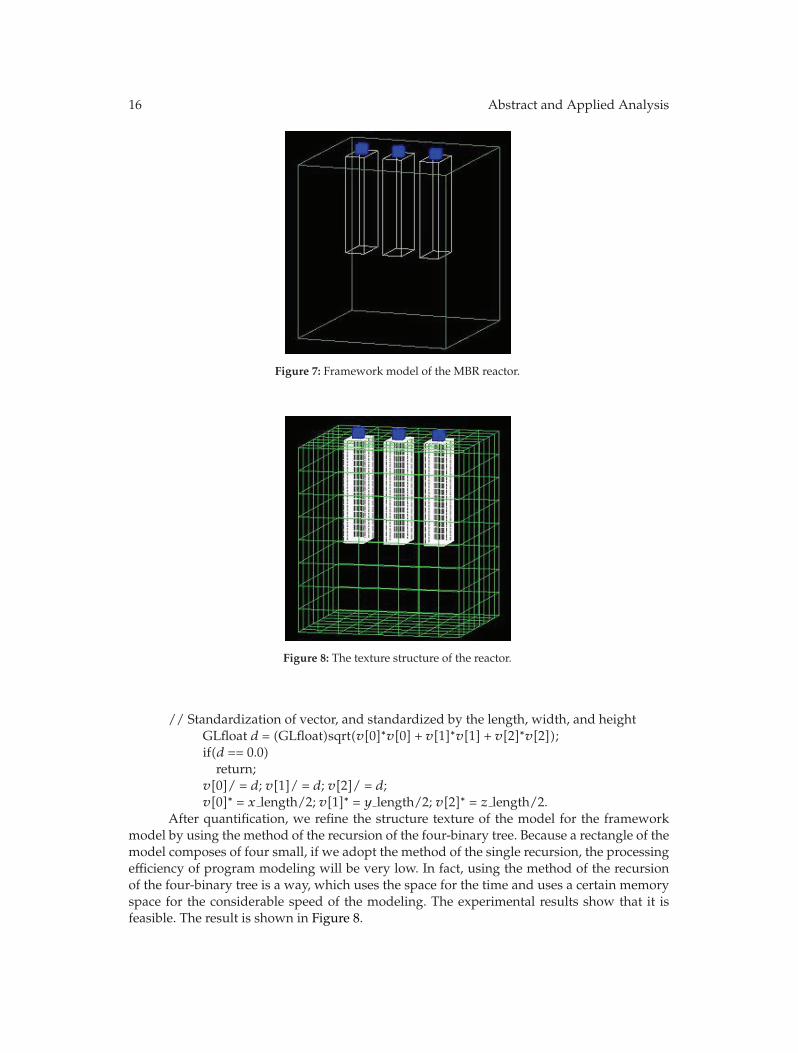
Figure 8: The texture structure of the reactor.
// Standardization of vector, and standardized by the length, width, and heightGLfloat d = (GLfloat)sqrt(v[0]∗v[0] + v[1]∗v[1] + v[2]∗v[2]);if(d == 0.0)return;
v[0]/ = d; v[1]/ = d; v[2]/ = d;v[0]∗ = x length/2; v[1]∗ = y length/2; v[2]∗ = z length/2.
After quantification, we refine the structure texture of the model for the frameworkmodel by using the method of the recursion of the four-binary tree. Because a rectangle of themodel composes of four small, if we adopt the method of the single recursion, the processingefficiency of program modeling will be very low. In fact, using the method of the recursionof the four-binary tree is a way, which uses the space for the time and uses a certain memoryspace for the considerable speed of the modeling. The experimental results show that it isfeasible. The result is shown in Figure 8.
Abstract and Applied Analysis 17
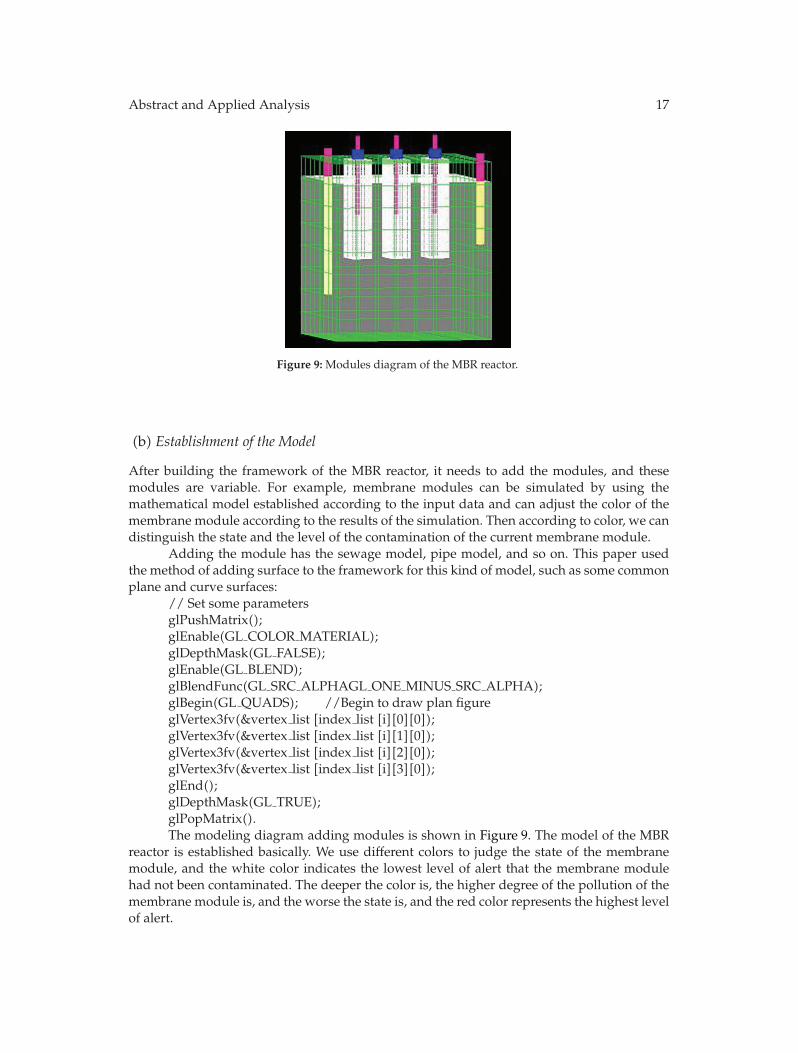
Figure 9: Modules diagram of the MBR reactor.
(b) Establishment of the Model
After building the framework of the MBR reactor, it needs to add the modules, and thesemodules are variable. For example, membrane modules can be simulated by using themathematical model established according to the input data and can adjust the color of themembrane module according to the results of the simulation. Then according to color, we candistinguish the state and the level of the contamination of the current membrane module.
Adding the module has the sewage model, pipe model, and so on. This paper usedthe method of adding surface to the framework for this kind of model, such as some commonplane and curve surfaces:
// Set some parametersglPushMatrix();glEnable(GL COLOR MATERIAL);glDepthMask(GL FALSE);glEnable(GL BLEND);glBlendFunc(GL SRC ALPHAGL ONE MINUS SRC ALPHA);glBegin(GL QUADS); //Begin to draw plan figureglVertex3fv(&vertex list [index list [i][0][0]);glVertex3fv(&vertex list [index list [i][1][0]);glVertex3fv(&vertex list [index list [i][2][0]);glVertex3fv(&vertex list [index list [i][3][0]);glEnd();glDepthMask(GL TRUE);glPopMatrix().The modeling diagram adding modules is shown in Figure 9. The model of the MBR
reactor is established basically. We use different colors to judge the state of the membranemodule, and the white color indicates the lowest level of alert that the membrane modulehad not been contaminated. The deeper the color is, the higher degree of the pollution of themembrane module is, and the worse the state is, and the red color represents the highest levelof alert.
18 Abstract and Applied Analysis
5. Conclusions
This paper proposed multiple linear regression models based on neural network. Though tocollect and analyse the real data, we draw the relationship chart of membrane flux, pressuredifference, MLSS, and total resistance and establish the three-dimensional simulation modelof the MBR reactor. After analyzing data relationship chart between the parameters, weknow the influence of various parameters for the membrane resistance using multiplelinear regression equation, and then we establish the mathematical model between eachparameter and membrane fouling by the relationship of the membrane resistance and flux.The membrane pollution index can be intuitive shown in the graphics of the MBR three-dimensional simulation model, which is obtained by the relationship of this experimentalmodel. The flexible application of the computer visualization technology in the MBR three-dimensional simulation system effectively shortened the researching cycle of the MBRsewage treatment and improved the efficiency of the work. The researching and designingidea has the inspiring and reference effect on the research, application, and development ofthe future about the MBR simulation technology.
References
[1] Y. Song and P. Wang, “An improved BP algorithm for FNN and its application,” Computer Engineering,vol. 29, no. 14, pp. 109–111, 2003.
[2] Z. Haiyan, H. Guangrui, and Z. Donghong, “A new BP algorithm of multiplayer neural network,”Communications Technology, no. 11, pp. 23–25, 2003.
[3] Dove of Peace Studios, Advanced Programming and Visual System Development by OpenGL, China WaterConservancy and Hydropower Press, Beijing, China, 2003.
[4] H. Wang and J. Cao, The Design and Application of Simulation Technology, Science Press, Beijing, China,2003.
[5] Q. Sun, Satellite Circulation Simulation with OpenGL, Huazhong University of Science and Technology,2004.
[6] B. Wu, H. Duan, and F. Xue, The Definitive Guide of OpenGL Programming, China Electric Power Press,Beijing, China, 2001.
[7] X. Zhang and P.-U. Liu, “Application OpenGL in 3D reconstruction of virtual reality,” ComputerEngineering and Design, vol. 29, no. 18, Article ID 487524877, 2008.
[8] Y. Li, B. Xue, and B. Zhu, Instances of the Essence of OpenGL Technology, Defense Press, Beijing, China,2001.

Submit your manuscripts athttp://www.hindawi.com
Hindawi Publishing Corporationhttp://www.hindawi.com Volume 2014
MathematicsJournal of
Hindawi Publishing Corporationhttp://www.hindawi.com Volume 2014
Mathematical Problems in Engineering
Hindawi Publishing Corporationhttp://www.hindawi.com
Differential EquationsInternational Journal of
Volume 2014
Applied MathematicsJournal of
Hindawi Publishing Corporationhttp://www.hindawi.com Volume 2014
Probability and StatisticsHindawi Publishing Corporationhttp://www.hindawi.com Volume 2014
Journal of
Hindawi Publishing Corporationhttp://www.hindawi.com Volume 2014
Mathematical PhysicsAdvances in
Complex AnalysisJournal of
Hindawi Publishing Corporationhttp://www.hindawi.com Volume 2014
OptimizationJournal of
Hindawi Publishing Corporationhttp://www.hindawi.com Volume 2014
CombinatoricsHindawi Publishing Corporationhttp://www.hindawi.com Volume 2014
International Journal of
Hindawi Publishing Corporationhttp://www.hindawi.com Volume 2014
Operations ResearchAdvances in
Journal of
Hindawi Publishing Corporationhttp://www.hindawi.com Volume 2014
Function Spaces
Abstract and Applied AnalysisHindawi Publishing Corporationhttp://www.hindawi.com Volume 2014
International Journal of Mathematics and Mathematical Sciences
Hindawi Publishing Corporationhttp://www.hindawi.com Volume 2014
The Scientific World JournalHindawi Publishing Corporation http://www.hindawi.com Volume 2014
Hindawi Publishing Corporationhttp://www.hindawi.com Volume 2014
Algebra
Discrete Dynamics in Nature and Society
Hindawi Publishing Corporationhttp://www.hindawi.com Volume 2014
Hindawi Publishing Corporationhttp://www.hindawi.com Volume 2014
Decision SciencesAdvances in
Discrete MathematicsJournal of
Hindawi Publishing Corporationhttp://www.hindawi.com
Volume 2014 Hindawi Publishing Corporationhttp://www.hindawi.com Volume 2014
Stochastic AnalysisInternational Journal of