multiple mechanisms mediating the starvation … · mediating the starvation induced activation of...
TRANSCRIPT
MULTIPLE MECHANISMS
MEDIATING THE STARVATION
INDUCED ACTIVATION OF
RECOMBINATION AT HIS4 IN
Saccharomyces cerevisiae
A thesis submitted for the degree of
Doctor of Philosophy
at the University of Leicester
by
Maryam Mohamed Rehan
Department of Genetics
University of Leicester
April 2012

i
Multiple Mechanisms Mediating the Starvation Induced
Activation of Recombination at HIS4 in
Saccharomyces cerevisiae
Maryam Mohamed Rehan
Department of Genetics, University of Leicester Thesis submitted for the degree of Doctor of Philosophy, April 2012
ABSTRACT
Meiotic recombination occurs at relatively high levels at specific regions in the genome called hotspots. The transcription factor-dependent hotspots (α-hotspots) have been widely studied in yeast, and are beginning to be elucidated in mammals. The HIS4 hotspot activity in Saccharomyces cerevisiae requires binding of Bas1p, Bas2p, Rap1p and Gcn4p. Bas1p acts in conjunction with Bas2p to regulate basal level of transcription of their target genes, and can be stimulated under conditions of adenine starvation and accumulation of metabolites AICAR and SAICAR from the purine biosynthesis pathway. Gcn4p activates transcription of yeast genes in response to starvation for amino acids and purines. This study focused on the influence of nutritional starvation on HIS4 hotspot activity, and different mechanisms mediating this effect. Our data suggests that deletion of genes known to accumulate AICAR/SAICAR can stimulate recombination at HIS4 in a Bas1p-dependent manner. Furthermore, intracellular and extracellular starvation for adenine and amino acids also activates recombination at HIS4. In addition, moderate levels of starvation only affect recombination when chromatin is already hyperacetylated, by the inactivation of the Set2p methyltransferase. Bas1p plays an essential role in mediating the effect of starvation and the set2 mutation on recombination. We showed that Gcn4p is not required for HIS4 hotspot activity, but plays a modest role in the effect of starvation in an adenine auxotrophic strain. Additionally, the starvation effect is also mediated by an as yet unknown factor independent from Bas1p/Bas2p and Gcn4p. This work provides additional information regarding the regulation of a transcription factor-dependent hotspot activity, and factors influencing its activation. Furthermore, data in this study indicate that BAS1, and not BAS2 exhibit haploinsufficiency with respect to its function in activating meiotic recombination. This implies that Bas1p is rate-limiting for HIS4 hotspot activity.

ii
ACKNOWLEDGEMENTS
It is a pleasure to thank the people who made this thesis possible. Firstly, I would like
to give my heartiest appreciation to my supervisor, Rhona, whose guidance and
support help me reach this stage. Thank you for your patience and efforts to explain
things clearly, and especially for providing me the opportunity to work with you.
I would like to thank Vicky and Rebecca, for your advice, encouragement and your time
to help me solve any mystery. I am also very grateful to Adrian and Andrew for
assisting me with the phospho-labelling experiment; Amit, for being the first person to
help me around the lab, and for teaching me the easy way of dissecting tetrads;
Christian and Daniel for helping me with my western blot experiment. I am also very
grateful to Gary, Kayoko, Lenny, Flav, Raff, Rob, Mathura, Rally, Trish, Shanow,
Mahdieh, Alex, Aysha, Mariaelena, Gurdeep, Patrick and all members of the lab, past
and present, for all your advice and for making the lab a nice place to work at.
Finally, this journey would not have been possible without the support from my
parents, Mohamed Rehan and Wan Ruzimas, my husband, Khairul, my whole family
(especially Banglong Saifuddin, Kakngah ‘Aisyah, Balqis, Hafidz, Sumayyah, Sofiyyah,
Kaklong Khadijah, Abangah Kamarul and Abangteh Yusri) and my friends. Thank you for
always being there for me, for your prayers and support throughout this journey and
for your never-ending faith in me.

iii
ABBREVIATIONS
5-FOA 5-fluoroorotic acid 10-HCO-THF 10-formyl tetrahydrofolate µM Micromolar AICAR 5'-phosphoribosyl-4-carboxamide-5-aminoimidazole
AIR 1-(5-phosphoribosyl)-5-aminoimidazole AS adenylosuccinate ATP Adenine triphosphate BIRD Bas1p Interaction and Regulatory Domain bp Base pairs
CAIR 1-(5-phosphoribosyl)-5-aminoimidazole-4-carboxylate CHEF gels Clamped homogenous electric field gels cM CentiMorgan dHJ Double Holliday junction DNA Deoxyribonucleic acid dNTP Deoxynucleoside triphosphate DSB Double-strand break DSBR Double-strand break repair EDTA Ethylenediaminetetraacetic acid
FAICAR 5-formamido-1-(5-phosphoribosyl)-imidazole-4-carboxyamide
FGAM 5-phosphoribosyl-N-formylglycinamidine
FGAR 5-phosphoribosyl-N-formylglycinamide
GAR 5-phosphoribosylglycinamide HAT Histone acetyltransferase HCl Hydrochloric acid HDAC Histone deacetylase hDNA Heteroduplex deoxyribonucleic acid HEPES 4-(2-hydroxyethyl)-1-piperazineethanesulfonic acid HJ Holliday junction KAc Potassium acetate kb Kilobases kDa KiloDaltons
IMP Inosine 5-monophosphate LB Luria-Bertani medium LMP Low melting point M Molar mM Millimolar MMS Methyl-methanosulfonate MRX Mre11p, Rad50p, Xrs2p M Wt Molecular weight ng Nanogram NMS Non-Mendelian segregation NPD Non-parental ditype OD Optical density

iv
ORF Open reading frame P Phosphate PCR Polymerase chain reaction PD Parental ditype PMS Post-meiotic segregation PMSF Phenylmethylsulfonyl fluoride PR 5-phosphoribosyl PRA 5-phosphorybosylamine PRPP 5-phosphoribosyl diphosphate PVDF Polyvinylidene fluoride RPA Replication protein A r.p.m Revolutions per minute
SAICAR 1-(5-phosphoribosyl)-4-(N-succinocarboxyamido)-5-aminoimidazole SC Synaptonemal complex SDS Sodium dodecyl sulphate SDS-PAGE Sodium dodecyl sulphate polyacrylamide gel electrophoresis SDSA Synthesis-dependent strand annealing SEI Single-end invasion SPS Supplemented pre-sporulation medium SSC 150 mM sodium chloride, 15 mM sodium citrate; pH7.0 TE 10 mM Tris-HCl, 1 mM EDTA; pH8.0 TBE 90 mM Tris, 90 mM Boric acid, 2 mM EDTA THF Tetrahydrofolate TT Tetratype UV Ultraviolet WT Wild type YEPD Yeast extract, peptone, dextrose medium YEPEG Yeast extract, peptone, ethanol, glycerol medium YPER Yeast protein extraction reagent ZMM Zip1, Zip2, Zip3, Zip4, Msh4, Msh5, Mer3, Spo16
1
Table of Contents
Chapter 1 : Introduction ........................................................................................... 7
1.1 An Overview of Meiosis ............................................................................ 7
1.2 Model for Meiotic Recombination ......................................................... 10
1.2.1 Recombination Initiation Proteins ............................................................ 10
1.2.2 Double-strand Break Repair Pathway ....................................................... 12
1.2.3 Synthesis-Dependent Strand Annealing ................................................... 17
1.3 Non-Mendelian Segregation in Yeast ..................................................... 19
1.4 Crossover Control ................................................................................... 20
1.5 Meiotic Recombination Hotspots ........................................................... 24
1.5.1 Factors Influencing Recombination Hotspots in S. cerevisiae .................. 25
1.5.2 Meiotic Recombination Hotspots in Other Organisms ............................. 30
1.5.3 The Regulation of HIS4 Transcription and Recombination ....................... 33
1.5.3.1 Transcription Factor Binding at HIS4 .................................. 33
1.5.3.2 Gene Regulation by Bas1p and Bas2p ................................ 37
1.5.3.3 General Amino Acid Control (GAAC) by Gcn4p .................. 38
1.5.4 Environmental Factors Influencing Hotspot Activity ................................ 38
1.6 Aims and Objectives................................................................................ 40
Chapter 2 : Materials and Methods ........................................................................ 41
2.1 Materials ................................................................................................. 41
2.1.1 Yeast Strains .............................................................................................. 41
2.1.2 Plasmids .................................................................................................... 41
2.1.3 Yeast Media .............................................................................................. 41
2.1.4 Bacterial Media ......................................................................................... 49
2.1.5 Oligonucleotides ....................................................................................... 49
2.1.6 Molecular Weight Markers ....................................................................... 50
2.2 Methods .................................................................................................. 50
2.2.1 Polymerase Chain Reaction (PCR) ........................................................... 50
2.2.1.1 Standard PCR Method ....................................................................... 50
2.2.1.2 Colony PCR ......................................................................................... 55
2.2.2 Agarose Gel Electrophoresis ................................................................... 55
2.2.3 DNA Precipitation ................................................................................... 56
2.2.4 Lithium Acetate Yeast Transformation ................................................... 56

2
2.2.5 Phenol-Chloroform DNA Extraction ........................................................ 57
2.2.6 Site Directed Mutagenesis ...................................................................... 58
2.2.6.1 PCR-Based Gene Disruption .............................................................. 58
2.2.6.2 Two-Step Gene Replacement ............................................................ 58
2.2.7 DNA sequencing ...................................................................................... 59
2.2.8 Preparation of Plasmid DNA ................................................................... 59
2.2.9 Restriction Enzyme Digestion ................................................................. 59
2.2.10 DNA and Protein Quantification ........................................................ 59
2.2.11 Genetic Procedures ........................................................................... 60
2.2.11.1 Mating and Sporulation ..................................................................... 60
2.2.11.2 Selection for Diploids ........................................................................ 60
2.2.11.3 Tetrad Dissection ............................................................................... 60
2.2.11.4 Mating Type Testing .......................................................................... 61
2.2.11.5 Recombination Analysis .................................................................... 61
2.2.12 Clamped Homogenous Electric Field (CHEF) Gel and Southern Blot Analysis ………………………………………………………………………………………………………63
2.2.12.1 CHEF Gel Analysis.............................................................. 64
2.2.12.2 Southern Blot Hybridisation ............................................. 65
2.2.12.2.1 DNA Transfer and Fixation .................................................. 65
2.2.12.2.2 DNA Probe Labelling ........................................................... 66
2.2.12.2.3 Hybridisation ....................................................................... 66
2.2.13 Statistical Analysis ............................................................................. 67
Chapter 3 : Modulating Metabolic Intermediates (AICAR/SAICAR) in the Purine and Histidine Biosynthetic Pathways ............................................................................. 69
3.1 Introduction ............................................................................................ 69
3.1.1 Regulation of the de novo Purine Biosynthesis Pathway ......................... 69
3.1.2 AICAR/SAICAR Accumulation and Adenine Starvation Promote Transcription of HIS4 via Bas1p and Bas2p Interaction and Binding Activity..... 73
3.1.3 Modulating the Metabolic Phenotypes of the Cell Influences Recombination Frequency .................................................................................. 79
3.1.4 Aims .......................................................................................................... 80
3.2 Materials and Methods........................................................................... 80
3.2.1 Production of Double Mutants .......................................................... 80
3.2.2 Assessing HIS4 Gene Conversion in Strains Auxotrophic for Histidine ………………………………………………………………………………………………………81
3.3 Results ..................................................................................................... 82
3.3.1 Verification of Double and Triple Mutations ..................................... 82

3
3.3.2 The ADE1 Null Mutant Exhibited Wild Type Level of HIS4 Hotspot Activity. ……………………………………………………………………………………………………………..82
3.3.3 Deletion of ade16 and ade17 Increases Recombination Activity at HIS4 84
3.3.4 Deletion of ade16 and ade17 Increases Crossing Over at the NAT-HYG Interval ................................................................................................................ 86
3.3.5 The Effect of Deletion of HIS1 from the Histidine Biosynthesis Pathway upon Recombination at HIS4 .............................................................................. 89
3.3.6 The Increase in Recombination at HIS4 in ade16Δ ade17Δ is Dependent on Bas1p.............................................................................................................. 93
3.4 Discussion ............................................................................................... 97
3.4.1 Purine Biosynthetic Intermediate AICAR/SAICAR is Likely Involved in Activating Bas1/2p-Mediated Recombination at HIS4 ....................................... 97
3.4.2 AICAR from the Histidine Biosynthesis Pathway may be Insufficient to Activate Recombination ............................................................................... 101
3.4.2 Why does ade1-1 Increases Recombination? ................................. 102
Chapter 4 : The Effect of Nutritional Starvation upon Meiotic Recombination at HIS4 ............................................................................................................................. 106
4.1 Introduction .......................................................................................... 106
4.1.1 Nutritional Conditions Affecting Meiotic Recombination at HIS4 .......... 106
4.1.2 Aims ...................................................................................................... 109
4.2 Materials ............................................................................................... 109
4.2.1 Sporulation Media .................................................................................. 109
4.3 Results ................................................................................................... 111
4.3.1 Nutritional Starvation Increases the Level of NMS at HIS4 in the Wild Type (Ade+) Strain only in Pre-selected Diploid Cells ....................................... 111
4.3.2 Nutritional Starvation during Sporulation Increases Crossing Over in the NAT-HYG Interval in the Selected, but not Unselected Wild Type (Ade+) Diploid Cells ...................................................................................................... 112
4.3.3 The Effect of Starvation on Recombination in the Selected Wild Type (Ade+) Cells is Dependent on Bas1p but not Gcn4p ......................................... 116
4.3.4 Starvation during Sporulation Increases Recombination in the ade1Δ Strain …………………………………………………………………………………………………….121
4.3.5 Modulating the Amount of Nutrients during Sporulation Affects Recombination in the ade1Δ Strain .................................................................. 125
4.3.6 Gcn4p is a Minor Contributor to the Starvation Effect on Recombination in a Strain Auxotrophic for Adenine (ade1Δ) .......................... 128
4.3.7 Bas1p is Required for the Starvation Induced Recombination at HIS4 in the ade1Δ Strain ........................................................................................... 131
4
4.3.8 AICAR from the Histidine Biosynthesis Pathway Partly Contributes to the Starvation Induced Recombination in the ade1Δ Strain ............................ 131
4.3.9 HIS4 Recombination Cannot be Further Increased in the ade16 ade17 Double Deletion ..................................................................................... 137
4.4 Discussion ............................................................................................. 139
4.4.1 Starvation Before and During Sporulation for Adenine and Amino Acids Activates Recombination at HIS4 in the Wild Type (Ade+) Strain ........... 139
4.4.2 Differences of GCN4 Deletion between Different Strain Backgrounds …………………………………………………………………………………………………….140
4.4.3 Elevation of HIS4 Recombination in the Absence of Gcn4p or Bas1p in Response to Starvation, in the Wild Type Strain Prototrophic for Adenine (Ade+) ……………………………………………………………………………………………………141
4.4.4 Starvation only during Sporulation Affects Recombination in Cells Auxotrophic for Adenine (ade1Δ) ..................................................................... 142
4.4.5 No Effect of Nutritional Starvation upon Accumulation of AICAR .. 144
4.4.6 Future Work .................................................................................... 145
Chapter 5 : The Influence of Nutrient Starvation on the Phosphorylation of Bas1p, and the Set2p-Mediated HIS4 Hotspot Activity ...................................................... 146
5.1 Introduction .......................................................................................... 146
5.1.1 Chromatin Modification Activities Associated with Meiotic Recombination .................................................................................................. 146
5.1.2 Post-Translational Modification Associated with Bas1p and Bas2p ...... 153
5.1.2.1 Phosphorylation of Swi5p and Pho4p (Bas2p Partner Proteins) Activates Transcription of the HO and PHO Genes Respectively ..................................................................................... 153
5.1.2.2 Phosphorylation Associated with Bas1p .......................... 155
5.1.3 Meiotic-Null Allele of Bas1p ................................................................... 157
5.1.4 Aims ........................................................................................................ 157
5.2 Materials and Methods......................................................................... 158
5.2.1 Materials .......................................................................................... 158
5.2.1.1 Media .................................................................................... 158
5.2.1.2 Antibodies ............................................................................ 158
5.2.2 Methods .......................................................................................... 159
5.2.2.1 PCR-Based Chromosomal Gene Modification .................. 159
5.2.2.2 Preparation of Protein Extracts ........................................ 160
5.2.2.3 Western Blot Analysis ....................................................... 161
5.2.2.4 Protein Immunoprecipitation ........................................... 162
5.2.2.5 [32P]-orthophosphate Labelling ........................................ 163

5
5.3 Results ................................................................................................... 165
5.3.1 Recombination Frequencies at HIS4 were Elevated in the set2Δ Strain ………………………………………………………………………………………………………….165
5.3.2 Bas1p is Required for the Increased Level of HIS4 Recombination in the set2Δ Strain ........................................................................................................ 168
5.3.3 Insertion of the HA3 and CLB2-HA3 Constructs Inactivates Bas1p ........ 171
5.3.4 BAS1-myc13 Exhibited Normal Vegetative Growth and Expression ...... 172
5.3.5 Potential Phosphorylation of Bas1p under Starvation and Non-starvation Conditions .......................................................................................................... 177
5.4 Discussion ............................................................................................. 181
5.4.1 Bas1p is Required to Stimulate HIS4 Hotspot Activity on the Loss of Set2p Methyltransferase under Starvation and Non-Starvation Conditions ... 181
5.4.2 Insertion of an HA3 Tag Inactivates the Function of Bas1p ............. 184
5.4.3 Phosphorylation State of Bas1p ...................................................... 185
5.4.4 Future work ..................................................................................... 186
Chapter 6 : Analysis of Haploinsufficiency of BAS1 and BAS2 ................................. 188
6.1 Introduction .......................................................................................... 188
6.1.1 Aims ........................................................................................................ 192
6.2 Results ................................................................................................... 192
6.2.1 Heterozygousity for BAS1 is Insufficient to Promote Normal Vegetative Growth on Media Lacking Histidine in the gcn4Δ Strain ................................... 192
6.2.2 BAS1 Exhibits Haploinsufficiency in Activating Recombination at HIS4193
6.2.3 BAS2 is not Haploinsufficient in Activating Recombination at HIS4 ..... 198
6.3 Discussion ............................................................................................. 201
Chapter 7 : Discussion ........................................................................................... 205
7.1 The Purine Biosynthetic Intermediate AICAR Positively Regulates Recombination at HIS4 by Promoting Bas1/2p Activity............................................ 205
7.2 Interaction between Bas1p and Bas2p can be Mediated by an AICAR-Independent Mechanism that is Sufficient for Recombination Activity ................... 208
7.3 Adenine and Amino Acid Starvation Increases Recombination at HIS4 ………………………………………………………………………………………………………….208
7.4 Gcn4p is not Required for HIS4 Hotspot Activity but Contributes to Activate Recombination in the ade1Δ Strain when Starved during Sporulation ...... 210
7.5 The Bas1p-Mediated HIS4 Hotspot Activity is Associated with Removal of Histone Deacetylation ........................................................................................... 212
7.6 How do Bas1p and Bas2p Induce Meiotic Recombination at HIS4? .... 213
7.7 Bas1p is Rate-Limiting for the HIS4 Hotspot Activity............................ 215
7.8 NMS and Crossover Events at HIS4 are Correlated .............................. 217

6
7.9 Conclusion ............................................................................................. 220
APPENDICES……………………….………………………..………………………..……………….…………..227
REFERENCES……………………….………………………..………………………..…….…………………..…228

7
Chapter 1 : Introduction
1.1 An Overview of Meiosis
Meiosis is a unique cell division that is essential in sexually reproducing organisms to
produce offspring. Products of meiosis include gametes (sperm and ovum) in
mammals, pollens in higher plants and spores in fungi. Unlike mitosis that produces
two identical daughter cells, a single meiotic event generates four non-identical
haploid progeny with each carrying half the amount of genetic material of the diploid
parents (Figure 1.1). In meiosis, pairs of sister chromatids are generated after one
round of DNA replication. This is followed by two rounds of cell division, without an
intervening round of DNA replication, hence reducing the chromosome number
(Petronczki et al., 2003). Homologous chromosomes segregate in meiosis I and the
sister chromatid pairs segregate in meiosis II (Petronczki et al., 2003). The
chromosome number is restored to diploid when two haploid gametes fuse together.
Therefore, halving of genetic material in meiosis is vital for maintaining the total
number of chromosomes.
A primary feature of meiosis is inter-homolog recombination which occurs during the
prophase stage in meiosis I (Figure 1.1). During prophase I, homologous chromosomes
of maternal and paternal origin pair and undergo synapsis. This occurs concurrently
with the polymerisation of a highly conserved proteinaceous structure, the
synaptonemal complex (SC) between paired homologs. Homologous chromosomes
then undergo reciprocal recombination (crossing over) that involves the physical
exchange of genetic material.

8
Genetic recombination intermediates in meiosis I provides a mechanical attachment
between homologous chromosomes, known as chiasmata, which hold homologous
chromosomes together (Roeder, 1997). The success of gamete formation lies in this
connection that directs coordinated segregation of homologs to the opposite spindle
poles in the first meiotic division. Therefore, at least one crossover per chromosome
pair is indispensable for ensuring accurate chromosome segregation into meiotic
products. Absence of a crossover in a homolog pair can result in chromosome non-
disjunction which leads to aneuploidy (Hassold et al., 2007). Crossover failure may also
be the cause of embryonic death, developmental defects and infertility in humans.
In the second meiotic division, sister chromatids are segregated in a manner similar to
mitosis. Ultimately, all four haploid gametes inherit a single set of chromosomes. New
combinations of DNA in daughter cells are also generated as a result of crossovers.
Indeed, the shuffling of genetic information between homologous chromosomes
creates genetic variation among the offspring. Additionally, non-reciprocal
recombination (gene conversion) which involves the transfer of genetic information
from one homologous chromosome to another, can also contribute to variation.
Conversion events can result in allelic changes due to the repair of mismatches in
heteroduplex DNA (Section 1.3). Hence meiosis also functions to produce genetic
diversity within the populations of organisms on which evolution can act.

9
Figure 1.1 : Meiosis produces four haploid daughter cells.
Prior to meiosis, DNA replication generates pairs of sister chromatids. During the prophase stage of meiosis I, homologous chromosomes align
and undergo recombination. Homologous chromosomes are segregated into two different cells at the end of meiosis I, and sister chromatids
are segregated at the end of meiosis II. In meiosis, four unique daughter cells are produced from a diploid parent.

10
1.2 Model for Meiotic Recombination
Early models for meiotic recombination pathway, such as the Holliday model and the
subsequent Meselson-Radding model, were mainly based upon initiation by nicking of
the DNA, followed by the formation of a Holliday junction (Holliday, 1964, Meselson
and Radding, 1975). Resolution of the Holliday junction can result in crossing over. The
Double-Strand Break Repair model (DSBR) was later suggested (Resnick and Martin,
1976) and expanded (Szostak et al., 1983), proposing that recombination is initiated by
the formation of DNA double-strand breaks (DSB). A novel feature of the DSBR model
is the formation of double Holliday junction (dHJ), whose resolution can generate
either crossover or non-crossover products. In numerous later studies of meiotic
recombination, several intermediates have been identified to confirm certain features
of the DSBR model including the appearance of dHJ (Schwacha and Kleckner, 1995).
However, other findings also indicate that crossovers and non-crossovers may not be
generated from the same pathway, contradicting the DSBR model (discussed in Section
1.2.3).
1.2.1 Recombination Initiation Proteins
Formation of DSBs are catalysed by the widely conserved Spo11p, a type II
topoisomerase-related enzyme (Keeney et al., 1997). In Saccharomyces cerevisiae,
Spo11p acts together with at least nine auxiliary proteins, including Mre11, Rad50p,
Xrs2p, Mei4p, Mer2p, Rec102p, Rec104p, Rec114p and Ski8p (Rec103p), to generate
DSBs (Hunter, 2006). Although the precise molecular roles of some of these proteins in
DSB formation have yet to be determined, several of them have been well-
characterised. These proteins can be divided into subgroups based on their physical
interactions and subcellular localisation behaviour (Cole et al., 2010). Mre11p, Rad50p

11
and Xrs2p (Nbs1p in higher organisms) form the evolutionarily conserved MRX
complex (Borde and Cobb, 2009). This complex plays a role in the early stages of DSB
initiation, as well as in the subsequent processing of DSBs. This was shown by studies
comparing phenotypes of complete deletions of the MRX components with specific
point mutations, such as mre11S or rad50S (Haber et al., 2004). Deletion of members
of the MRX complex eliminates DSB production, while these point mutations result in
the accumulation of unrepaired DSBs.
The proteins Rec102p, Rec104p and Rec114p have been shown to be directly required
for the association of Spo11p with the DSB site (Prieler et al., 2005). The interaction of
Spo11p with other recombination initiation proteins particularly Rec102p and
Rec104p, is facilitated by Ski8p (Arora et al., 2004). Furthermore, Ski8p was suggested
to be involved in promoting the recruitment of Spo11p and other cofactors to the
chromosome (Arora et al., 2004). The remaining proteins Mei4p, Mer2p and Rec114p
potentially interact with Rec102p/Rec104p via Rec114p (Maleki et al., 2007). In
addition, Rec102p/Rec104p also act as a mediator for the interaction of the
Mei4p/Mer2p/Rec114p complex with Spo11p/Ski8p (Maleki et al., 2007).
The function of Spo11p and some of the auxilliary proteins in the formation of meiotic
DSBs are conserved in other organisms. For example, Kumar et al. (2010) had
characterised the orthologs of Mei4p and Rec114p in mice. Deletion of mei4 results in
deficiency in the formation of meiotic DSBs, suggesting that Mei4p plays an essential
role in meiotic DSB formation in mice (Kumar et al., 2010). However, not all of the
Spo11p-associated proteins for S. cerevisiae are functionally conserved in other
organisms. In particular, Ski8p performs the same function in S. cerevisiae,

12
Schizosaccharomyces pombe and Sordaria (Tesse et al., 2003), but its meiotic function
has not been found in Arabidopsis thaliana (Jolivet et al., 2006). This observation
suggests that some of the specific details of DSB formation may vary between
organisms.
1.2.2 Double-strand Break Repair Pathway
Spo11p catalyses the formation of DSBs by creating a dimer that cleaves the DNA
duplex via a reaction similar to transesterification (Keeney, 2001). Following DSB
formation, Spo11p remains covalently attached to each of the 5’ termini of the DSB
(Keeney and Kleckner, 1995, Keeney et al., 1997). Spo11p then needs to be removed
from the DNA ends for DSB processing to occur. It has been demonstrated that Spo11p
is liberated through an endonucleolytic excision that also removes an oligonucleotide
attached to Spo11p (Neale et al., 2005). The MRX complex was suggested to be
involved in this process, since Mre11p possesses a single-stranded endonuclease
activity (Neale et al., 2005). Furthermore, several point mutations of the MRX
components (as stated above, Section 1.2.1) and a mutation that eliminates the Mre11
nuclease, results in prevention of further processing of DSBs, leaving Spo11p
covalently bound to the DSB ends (Tsubouchi and Ogawa, 1998, Moreau et al., 1999).
The Sae2 protein was also found to be required for the removal of the Spo11p-
oligonucleotide complex (Keeney and Kleckner, 1995, Uanschou et al., 2007, Manfrini
et al., 2010). It has been suggested that Sae2p acts in concert with the MRX complex to
promote removal of Spo11p, since Sae2p was shown to cooperate with the MRX
complex in vitro (Lengsfeld et al., 2007).

13
The 5’ termini of the DSB then undergo nucleolytic resection by several hundred base
pairs (Sun et al., 1991, Neale et al., 2005). A specific exonuclease, Exo1p has been
suggested to be responsible for the 5’ to 3’ DSB end processing to produce 3’ single
stranded overhangs (Khazanehdari and Borts, 2000, Tsubouchi and Ogawa, 2000,
Keelagher et al., 2010, Manfrini et al., 2010, Zakharyevich et al., 2010, Hodgson et al.,
2010). Deletion of EXO1 results in reduction in the extent of meiotic DSB resection
(Keelagher et al., 2010, Zakharyevich et al., 2010). In addition, Mre11p/Sae2p has also
been proposed to be responsible in catalysing the limited resection of DSBs in the
absence of Exo1p.
Following resection, one of the 3’ single-stranded overhangs then invades the intact
homologous duplex and primes DNA synthesis using the homologous sequence as a
template. Single end invasion (SEI) by the 3’ end subsequently displaces the
homologous DNA and forms a D-loop structure (Hunter and Kleckner, 2001). Two
eukaryotic homologues of bacterial RecA, Rad51p and Dmc1p, assemble at the 3’ tails
and form helical filaments (Sun et al., 1991, Keeney et al., 1997, Chen et al., 2008). The
nucleoprotein filaments function by searching for sequence homology that generates a
connection with the unbroken homologous chromosome and catalyse strand invasion
(Neale and Keeney, 2006) . However, the specific mechanism of action of Rad51p and
Dmc1p in meiotic DSB repair is still under investigation (Kagawa and Kurumizaka,
2010).

14
Figure 1.2 : The double-strand break repair model.
A) Formation of DSB. B) DNA is resected in a 5’ to 3’ direction to produce 3’ single-
stranded overhangs. C) One of the 3’ overhangs invades the double-stranded DNA
homolog forming a single end invasion (SEI) and a D-loop. D) DNA is synthesised using
the homologous DNA as template (dotted lines indicates the newly synthesised DNA
and arrowheads indicate direction of synthesis). E) Capture of the opposite DNA end
and ligation results in the formation of a double Holliday Junction (dHJ). Resolution of
the dHJ by cleaving in the opposite orientation (cutting by the same colour of
arrowheads) results in a crossover. Cleaving in the same orientation (green and black
arrowheads) generates non-crossover products. Adapted from Szostak et al. (1983)
and Paques and Haber (1999).
3’ B
C
D
E
Crossover Non-Crossover
A 5’
3’
3’
5’
DSB
5’
3’
5’
5’
3’

15
Sheridan et al. (2008) demonstrated that the filament produced by Dmc1p is similar to
those produced by Rad51p. This suggests that the functional difference between them
is not due to the intrinsic filament structure (Sheridan et al., 2008). Rather, the distinct
activities of Rad51p and Dmc1p are potentially attributed to the different accessory
proteins they interact with, that assist their functions (Bugreev et al., 2005, Kagawa
and Kurumizaka, 2010).
The major accessory factors of Rad51p include replication protein A (RPA), Rad52p,
Rad55p-Rad57p, Rad54p and Tid1p (a homolog of Rad54p). RPA is a single-stranded
DNA (ssDNA) binding protein that removes secondary structures to promote Rad51p
filament formation (Sugiyama and Kowalczykowski, 2002). However, RPA can also
inhibit the binding activity of Rad51p through direct competition for the ssDNA sites
(Neale and Keeney, 2006). This inhibitory effect is overcome by the proteins Rad52 and
the Rad55-Rad57 complex, thereby facilitating assembly of the Rad51p filament (Sung
et al., 2003). Rad54p and Tid1p are members of an ATP-dependent chromatin
remodelling activity, and are partially redundant (Shinohara et al., 1997). These
proteins have been suggested to promote co-localisation of Rad51p and Dmc1p to the
DNA, and blocking assembly of Dmc1p until Rad51p is present (Shinohara et al., 2000).
Dmc1p is assisted by a heterodimeric complex, Hop2p-Mnd1p, in accurate homology
searching by distinguishing between homologous and non-homologous sequences
(Tsubouchi and Roeder, 2003). This has been demonstrated by deletion of hop2 or
mnd1 that result in the formation of synaptonemal complex between the non-
homologous sequences (Tsubouchi and Roeder, 2003). Mei5p and Sae3p interact
specifically with Dmc1p, and mutation of these proteins eliminates the ability of

16
Dmc1p to bind near a DSB site (Hayase et al., 2004). Furthermore, Mei5p/Sae3p is also
required to overcome RPA inhibition of Dmc1p binding to the DNA (Ferrari et al.,
2009). These findings suggest that Mei5p and Sae3p are involved in promoting the
loading of Dmc1p to the RPA-coated single stranded DNA.
Further synthesis of the invading 3’ end extends the D-loop followed by ‘capture’ of
the other DSB end. Subsequent synthesis and ligation of both ends leads to the
formation of dHJ, which has been physically detected (Schwacha and Kleckner, 1995).
In the original DSBR model, it was thought that either crossovers or non-crossovers are
produced, depending on the direction of dHJ resolution (Figure 1.2). The eukaryotic
proteins that are involved in dHJ resolution remain elusive but studies have found
several proteins that function as the classical dHJ resolvases in Escherichia coli¸ such as
the RuvC and RusA endonucleases (West, 1997, Boddy et al., 2001). A potential
candidate is the Yen1 protein (human orthologue Gen1) in S. cerevisiae, which is
thought to give rise to crossovers and non-crossovers in equal efficiency (Ip et al.,
2008).
In S. pombe, it has been demonstrated that single HJs were mainly produced as meiotic
recombination intermediates, which can be resolved to produce crossovers (Cromie et
al., 2006). The Mus81p-Eme1p complex (Mus81p-Mms4p in S. cerevisiae) has been
suggested to function as the HJ resolvase in S. pombe (Boddy et al., 2001). This
hypothesis is supported by the observation that mus81 mutants that generate inviable
spores can be rescued by overexpression of the bacterial HJ resolvase, rusA (Boddy et
al., 2001). Therefore, it was thought that RusA can directly substitute for the Mus81p-
Mms4p activity. However, only modest reduction of crossovers was seen in the mms4

17
mutant in S. cerevisiae (de los Santos et al., 2001). It was also demonstrated that
expression of the bacterial dHJ resolvase in S. cerevisiae did not suppress the mus81
phenotypes (de los Santos et al., 2003). Additionally, the mms4 mutant does not
accumulate dHJs as would be expected if MMS4 is solely required for dHJ resolution
(Hollingsworth and Brill, 2004). These observations suggest that Mus81p-Mms4p is not
solely required for dHJ resolution in S. cerevisiae.
The proteins Msh4p and Msh5p, which act as a heterodimer, were also proposed to be
required in the formation of crossing over in S. cerevisiae, by binding to and stabilising
dHJ (Hollingsworth and Brill, 2004, Snowden et al., 2004). Furthermore, the Mlh1p and
Mlh3p heterodimer may be involved in catalysing dHJ resolution, since they were
found to act at a later step in recombination (Hunter and Borts, 1997, Wang et al.,
1999, Cotton et al., 2010). Mlh3p is also known to possess endonuclease activity, and
disruption of the putative endonuclease domain of Mlh3p led to a defect in crossover
formation (Nishant et al., 2008). This further supports the hypothesis that Mlh3p is
essential in the resolution of dHJ. Moreover, ATP binding by Mlh1p and Mlh3p were
shown to be required for crossing over (Hoffmann et al., 2003, Hoffmann and Borts,
2004, Cotton et al., 2010). This suggests that dHJ resolution may be facilitated by
conformational change of Mlh1p and Mlh3p by ATP binding.
1.2.3 Synthesis-Dependent Strand Annealing
Although many studies have confirmed the presence of DSBR pathway intermediates
including the formation of DSBs and HJs, several observations conflict with some ideas
of the canonical DSBR model. In particular, Schwacha and Kleckner (1995) detected the
existence of HJs before the formation of heteroduplex DNA (hDNA). This is contrary to

18
Figure 1.3 : The synthesis dependent strand annealing model
A - D) Steps similar to the DSBR model (Figure 1.2). E) Displacement of the invading
strand disrupted the D-loop. F) Annealing of the displaced 3’ end with the second end
of the break forming a non-crossover product. Adapted from Paques and Haber (1999).
5’
B
C
D
E
F
A 3’
5’ 3’
DSB
5’
3’
3’
5’

19
the DSBR model that proposed earlier generation of hDNA, during the time of strand
invasion. It has also been demonstrated that non-crossovers were produced at normal
levels in the mutation of ndt80, which accumulates unresolved dHJs and is defective in
crossover formation (Allers and Lichten, 2001). This implies that the dHJ is a precursor
only for crossover products whereas the non-crossover products are derived from a
different pathway. Therefore, an alternative model termed synthesis-dependent
strand annealing (SDSA) was proposed to explain the production of non-crossover
products (Figure 1.3) (Paques and Haber, 1999). In the SDSA model, DSBs are repaired
by strand invasion of the 3’ single stranded overhang into the unbroken homologous
duplex. Similar to the DSBR model, the 3’ end then acts as a primer for DNA synthesis
using the invaded duplex as template (Cromie and Smith, 2007). The newly synthesised
DNA is subsequently displaced from the invaded duplex and re-anneals with the other
end of the break. Both ends are then ligated to conclude the repair.
1.3 Non-Mendelian Segregation in Yeast
Meiotic recombination has been most extensively studied in model organisms
particularly in the budding yeast, S. cerevisiae. Being a single-celled organism, yeast
cells are easily manipulated. Additionally, S. cerevisiae is stable as both a diploid and a
haploid. The four meiotic products can easily be recovered and exploited for the study
of meiosis. Spores are enclosed in a sac called an ascus that can be digested to release
them. Thus, different classes of recombination including crossing over, gene
conversion and post-meiotic segregation (PMS) can be genetically analysed by micro-
dissection of yeast tetrads.

20
During strand exchange, mismatched DNA can be formed between two homologous
chromosomes (Petes, 2001). Repair of the mismatched DNA can give rise to gene
conversion or can be restored to the parental genotype. Failure to correct mismatches
can result in PMS event. The level of gene conversion and PMS can be monitored by
analysis of a single heterozygous marker (Figure 1.4). Normal Mendelian segregation of
a given heterozygous marker results in 2:2 segregation pattern in which 2 alleles from
each parents are recovered. For fungi such as Neurospora that contain eight spores in
an ascus due to mitotic duplication of each chromosome after meiosis, normal
Mendelian segregation is 4:4 (Figure 1.4). Restoration of the parental genotype
following mismatch repair also gives rise to a 4:4 pattern.
Gene conversion events have 6:2 or 2:6 segregation that represent 6 alleles from one
parent while 2 alleles from another. PMS give rise to 5:3 or 3:5 patterns, and are
characterised by sectored spore colonies in S. cerevisiae tetrads. Crossing over of the
chromosome can be determined using at least two heterozygous markers (Petes,
2001). Crossovers are reflected by the outcome of non-parental combinations of the
linked markers flanking a given segment in the chromosome (Lichten and Goldman,
1995).
1.4 Crossover Control
Crossing over between homologous chromosomes is essential for the success of
meiosis by ensuring faithful segregation in the first meiotic division. Hence, crossover
events need to be strictly regulated so that crossovers are properly distributed along
the chromosome. One regulatory mechanism observed in most eukaryotes for
accurate chromosome disjunction is the obligate crossover (Jones and Franklin, 2006).

21
4:4 6:2 2:6 5:3 3:5
8:0 Ab6:2 Ab1:7 Ab2:6 Ab7:1 Ab4:4 0:8
Common Events
Complex Events
Figure 1.4 : The patterns of segregation of a heterozygous marker observed from
tetrad analysis. Following meiosis, a diploid cell that is heterozygous for a single
marker can give rise to a number of common segregation patterns including normal
Mendelian segregation (4:4), gene conversion (6:2 or 2:6) and post-meiotic
segregation (5:3 or 3:5). Restoration events can also produce 4:4 segregation and are
undetectable. Occasionally some complex aberrant segregation events involving all
four chromatids can occur from the repair of mismatched DNA. These include two
gene conversion events (8:0 or 0:8), two independent PMS events (Ab6:2 or Ab2:6),
and simultaneous gene conversion and PMS (7:1 or 1:7).

22
This refers to the guaranteed event that each chromosome receives at least one cross-
over despite a low average crossover number per chromosome. Another manifestation
of crossover control is the process called crossover interference (Hillers, 2004).
Interference refers to the phenomenon in which a crossover at one chromosomal site
limits the probability that another event occurs simultaneously in the immediate
vicinity. The intensity of crossover interference is maximal over short distances and
reduces progressively with increasing distance from the crossover site (Malkova et al.,
2004). Hence, interference creates regularly spaced crossovers within a chromosome.
Crossover homeostasis is another mechanism of crossover control that has been
suggested to contribute to the production of an obligate crossover. It has been
observed that the number of crossovers is maintained at the expense of non-
crossovers even when the number of DSBs is reduced (Jones et al., 2006). This was
shown by analysing a series of Spo11p mutants with varying levels of activity, in which
reduction in DSB production did not result in a parallel decrease in crossovers (Martini
et al., 2006). In addition, crossover interference was also maintained when the DSB
frequency was reduced, implying an association between both mechanisms for
crossover control (Martini et al., 2006).
It is not yet well established how crossover control works. A ‘counting’ model posits
that each crossover event is separated by a fixed number of non-crossover outcomes
and thus exhibit interference (Foss et al., 1993). However, the observation that the
crossover/non-crossover ratio varied with changes in the level of DSBs appears to
contradict the counting theory (Martini et al., 2006). Another hypothesis to explain
interference is described by the condition that chromatin is under internal compaction

23
stress (Borner et al., 2004, Kleckner et al., 2004). Crossover formation releases this
stress for a certain chromosomal distance and prevents other crossovers from
occurring within the area (Borner et al., 2004, Kleckner et al., 2004).
The mechanism of crossover control was initially thought to be a consequence of the
synaptonemal complex (SC) polymerisation, which transmits an inhibitory signal
preventing the occurrence of a crossover within the area (Egel, 1978). This hypothesis
is supported by several observations from genetic assays that showed simultaneous
impairment of SC formation and crossover interference in certain zmm mutants (e.g.,
zip1 and msh4) (Sym and Roeder, 1994, Novak et al., 2001). The ZMM groups (also
known as the synapsis initiation complex; SIC) are the meiosis-specific proteins which
consists of Zip1, Zip2, Zip3, Zip4, Msh4, Msh5, Mer3 (Lynn et al., 2007) and the newly
characterised Spo16 protein (Shinohara et al., 2008). Mutation of these proteins are
known to disrupt strand exchange structure formation and the assembly of the SC
(Székvölgyi and Nicolas, 2009).
However, several other observations argue that the SC is not required for interference
(Bishop and Zickler, 2004). One such observation was obtained from cytological
analysis of the ZMM proteins (including the Zip2p and Zip3p), which are known to
localise with crossover-designated sites (Chua and Roeder, 1998, Agarwal and Roeder,
2000). Immunostaining of Zip2 foci revealed an interference distribution in the wild
type, zip1∆ and msh4∆ strains, indicating that interference can occur in the absence of
the SC (Fung et al., 2004). Consistent with these findings, mutants that lack the ZMM
proteins at high temperature are defective in SC formation and crossover production
while exhibiting normal levels of DSBs and non-crossovers (Borner et al., 2004). This

24
further implies that the crossover control is independent of SC and suggested that
crossover control is imposed at an early stage of recombination (Bishop and Zickler,
2004).
1.5 Meiotic Recombination Hotspots
Meiotic recombination is not uniform throughout the genome. There are areas in the
chromosome that exhibit relatively high levels of recombination compared to other
regions (Lichten and Goldman, 1995). These regions are called recombination
hotspots. Several hotspots have been examined in detail in S. cerevisiae; HIS4 (Detloff
et al., 1992, White et al., 1991, White et al., 1993), ARG4 (de Massy and Nicolas, 1993,
Sun et al., 1991) and HIS2 (Malone et al., 1994). Other hotspots include the Tn3-
derived transposable element (Stapleton and Petes, 1991) and the artificially created
HIS4-LEU2 hotspot, generated by insertion of a LEU2 segment adjacent to the HIS4
locus (Cao et al., 1990).
The site of recombination hotspots has been shown to be strongly associated with
local meiosis-specific DSBs (Sun et al., 1989, Cao et al., 1990). Moreover, deletions
which reduce the level of DSBs (e.g., rad50 and the promoter region of ARG4) also
result in decreased levels of recombination (Cao et al., 1990, de Massy and Nicolas,
1993, Fan et al., 1995). Association between DSBs and recombination has also been
suggested from genome-wide studies by mapping DSB sites across the genome. DSBs
were found to be clustered at localised preferential sites where most recombination
occurred within those regions (Petes, 2001, Pan et al., 2011).

25
1.5.1 Factors Influencing Recombination Hotspots in S. cerevisiae
A whole-genome DSB mapping analysis has been widely used to identify DSB hotspots
and to study factors influencing the pattern of DSB distribution in S. cerevisiae (Lichten,
2008). In early studies of genome-wide hotspots mapping, the rad50S mutant strain
was typically used (Gerton et al., 2000, Petes, 2001, Mieczkowski et al., 2006). In such
a mutant, the intermediate stage of meiotic prophase is blocked, and Spo11p remains
covalently attached to the DSB ends (Cao et al., 1990). Hence, regions with enriched
Spo11p could be detected by using Spo11p-DNA complexes as hybridisation probes for
yeast microarrays (Petes, 2001).
In these studies, genomic sites exhibiting low levels of recombination (coldspots) have
also been reported, including the centromeric and telomeric regions (Gerton et al.,
2000, Mieczkowski et al., 2006, Buhler et al., 2007). However, some of these ‘DSB
coldspot’ loci were observed in late replicating regions in the rad50S mutation,
suggesting that break formation at these sites occurs later than average (Borde et al.,
2000). Therefore, this raised a possibility that the level of DSBs is underrepresented in
maps from the rad50S mutant, hence might affect some of the interpretation of results
in these studies.
In order to overcome limitations in the previous studies, another method for mapping
DSB hotspots was then developed, using mutants lacking Dmc1p (Blitzblau et al., 2007,
Buhler et al., 2007). Dmc1p is the protein responsible to catalyse strand invasion of the
3’ single-stranded tails following DNA resection (Section 1.2.2). Therefore, the dmc1Δ
mutant is able to remove Spo11p, but is deficient for DSB repair. Hence the

26
accumulated single-stranded DNA was used to prepare microarray probes instead of
Spo11p.
In studies using the dmc1Δ mutation, high levels of DSB formation was observed at
known hotspots, and substantial DSBs were also found at regions previously reported
to lack DSB formation (Blitzblau et al., 2007, Buhler et al., 2007). This confirms that the
level of DSB is underrepresented in some regions of DSB coldspots in the rad50S
mutant. Recently, a quantitative and much higher resolution method were used for
mapping recombination hotspots, by direct sequencing of purified oligonucleotides
attached to Spo11p (Pan et al., 2011). The study provides a more detailed compilation
of DSB hotspots in S. cerevisiae and information underlying hotspot traits. From these
genome-wide screening, together with studies of individual hotspots, various cis- and
trans-acting factors influencing hotspots distribution have been suggested (discussed
below).
The status of chromatin structure has been suggested to influence preferred position
of DSBs and recombination hotspots in the genome. Studies in S. cerevisiae showed
that DSB sites exhibit hypersensitivity toward nucleases, particularly DNAse I and
micrococcal nuclease (MNase) (Wu and Lichten, 1994, Ohta et al., 1994, Fan and Petes,
1996). Mutations that disrupt the production of nucleosomes upstream of the PHO5
loci results in parallel increase in the level of DSBs (Wu and Lichten, 1994). Likewise,
increased levels of DSB formation correlate with increased sensitivity to MNase at
ARG4 (Ohta et al., 1994). Furthermore, sites with elevated DSBs at ARG4, LEU2-CEN3
and several other loci exhibited DNase I or MNase hypersensitivity even before the
onset of meiosis (Wu and Lichten, 1994, Ohta et al., 1994, Mizuno et al., 1997). These

27
observations suggest a requirement for an ‘open’ chromatin structure for
recombination hotspot activity. Consistent with this hypothesis, comparison between
the high-resolution maps of MNase-resistant nucleosomes with that of Spo11p-
oligonucleotides showed that DSBs tend to occur in nucleosome-depleted regions (Pan
et al., 2011).
However, nuclease-sensitive chromatin alone is not sufficient to create meiotic
recombination hotspot. In particular, Ohta et al. (1994) showed that not all of the
nuclease-hypersensitive regions are sites of meiosis-specific DSBs. Furthermore,
insertion of the ARG4 promoter sequence in other chromosomal locations did not
increase DSB formation even when these regions are hypersensitive to nucleases (Wu
and Lichten, 1995). Moreover, mutations that abolished HIS4 hotspot activity only
eliminate some but not all of the DNase I-hypersensitive sites (Fan and Petes, 1996).
These findings indicate that although an ‘open’ chromatin appears necessary, other
factors might play a more dominant role in initiating recombination.
It has also been suggested that hotspot activity requires specific chromatin
remodelling activity, particularly histone modifications (Mieczkowski et al., 2007,
Merker et al., 2008, Borde and Cobb, 2009). For example, trimethylation of histone H3
lysine 4 was demonstrated to mark hotspot sites prior to meiosis (Borde et al., 2009).
Furthermore, higher levels of recombination and DSB formation at HIS4 were found to
correlate with increased acetylation of histone H3 lysine 27 (Merker et al., 2008).
These histone modifications facilitate DSB formation potentially by providing a
favourable chromatin state, which permits access to the recombination machinery
(discussed in Chapter 5).

28
Three major categories of hotspots have been proposed in S. cerevisiae, α-, β- and γ-
(Kirkpatrick et al., 1999a). α-hotspots are defined as hotspots that require transcription
factor binding for activation (Kirkpatrick et al., 1999a). A genome-wide analysis showed
that Spo11p-oligonucleotide complexes were frequently mapped near binding sites of
numerous transcription factors (Pan et al., 2011). One example of an α-hotspot is the
widely studied HIS4, which requires the binding of transcriptional activators, Bas1p,
Bas2p, Rap1p and Gcn4p (Fan et al., 1995, White et al., 1993, White et al., 1991,
Abdullah and Borts, 2001). These transcription factors were among those whose
binding sites overlapped with the Spo11p-oligonucleotide hotspots (Pan et al., 2011).
Interestingly, the top ranked transcription factors based on their correlation with
Spo11p-oligonucleotide counts (Ino2p/Ino4p complex, Pho4p, Leu3p and Hap1p) were
not previously known to influence meiotic recombination (Pan et al., 2011). Therefore,
this observation suggests that the presence of transcription factor-associated hotspots
could be common for other regions in the genome.
The fact that most DSB sites are also located in the promoter region upstream of
coding sequences further indicate the association of transcription factors with
recombination hotspots (Wu and Lichten, 1994, Blitzblau et al., 2007, Buhler et al.,
2007, Pan et al., 2011). Furthermore, it has also been shown that DSBs occur
preferentially in intergenic regions rather than within genes (Baudat and Nicolas, 1997,
Lichten, 2008, Pan et al., 2011). However, the transcription factor-dependent hotspot
activity does not require high levels of transcription. This has been demonstrated by
White et al. (1992), in which the removal of the upstream TATAA promoter element of
HIS4 only reduces the level of transcription but has no effect on the level of
recombination. Instead, the binding of transcription factors is thought to maintain an

29
‘open’ state of chromatin to allow better access to the recombination machinery to
form DSBs (Kirkpatrick et al., 1999a). Another alternative hypothesis is that the
recombination factors are directly recruited to the chromatin in a manner facilitated
by the activation domain of bound transcription factors (Kirkpatrick et al., 1999a).
β-hotspots are defined as hotspots that occur at specific nuclease-sensitive
chromosomal regions without requiring the binding of transcription factors (Kirkpatrick
et al., 1999a). An example of a β-hotspot is the artificial insertion of 12 tandem repeats
of the 5’-CCGNN replacing the upstream regulatory sequences of HIS4 (Kirkpatrick et
al., 1999b). The (CCGNN)12 tract is hypersensitive to DNase I and results in elevation of
the recombination frequency of HIS4. Since no transcription factors are known to bind
to the (CCGNN)12 repeat, the hotspot is suggested to be created by the nucleosome-
excluding sequences (Petes, 2001). The HIS4-LEU2 hotspot was suggested to be
another possible β-hotspot since it contains a tandem repeat of four 5’-CGGATCCG
sequences (Xu and Kleckner, 1995).
Another group of hotspots, the γ-hotspots occur in regions that are associated with
high GC composition (Petes, 2001). Several global analyses showed that meiotic DSBs
tend to be clustered at regions with high GC content (Gerton et al., 2000, Blat et al.,
2002, Mieczkowski et al., 2006, Pan et al., 2011). The mechanism by which
recombination hotspots correlate with the GC-rich regions remains elusive. It has been
proposed that recombination may be controlled either directly by the GC content or by
a third unknown factor (e.g., transcription factors) that also affects the GC content
(Marsolier-Kergoat and Yeramian, 2009). These proteins could either interact with the
recombination machinery or induce chromosomal modifications to allow entry of the

30
recombination factors (Petes, 2001). Another alternative possibility is that the GC
content is directly associated with chromatin alterations that promote recombination
(Mieczkowski et al., 2006).
1.5.2 Meiotic Recombination Hotspots in Other Organisms
In Schizosaccharomyces pombe, the widely studied M26-related hotspots consist of
the well-characterised ade6-M26 and the sequence-dependent M26CS (M26 consensus
sequence) (Pryce and McFarlane, 2009). The ade6-M26 hotspot is a meiosis-specific
hotspot generated by a G to T transversion mutation within the ade6 gene, which
produces a sequence motif of 5’-ATGACTG-3’ (Gutz, 1971, Ponticelli et al., 1988). This
M26 heptamer provides binding sites for the heterodimeric transcription factors, Atf1p
and Pcr1p (Mts1p/Mts2p) (Wahls and Smith, 1994, Kon et al., 1997). Binding of these
transcription factors is required for the ade6-M26 hotspot activity, reflecting the
features of α-hotspots in S. cerevisiae (Wahls and Smith, 1994, Kon et al., 1997).
Similarly, activation of the ade6-M26 hotspot is not a consequence of increased levels
of ade6 transcription (Kon et al., 1997). An alteration in the structure of the chromatin
near the ade6-M26 hotspot has been demonstrated upon entry into meiosis (Mizuno
et al., 1997). In addition, mutations that result in loss of specific chromatin
modifications (including acetylation of histone H3 and H4) also reduced ade6-M26
hotspot activity (Yamada et al., 2004). These studies suggest that chromatin
remodelling activity is also required in the activation of the M26 hotspot.
A global screening of short nucleotide sequences for hotspot activity has been
performed in S. pombe, which identified many short motifs (at around 6 bp in length)
occurring multiple times in the genome (Steiner et al., 2009). At least five different

31
DNA sequence motifs found to activate hotspots, including the motif recognised by
Atf1p/Pcr1p, which appeared in at least 15% of the total pool of hotspot sequences.
Wahls and Davidson (2011) hypothesised that recombination hotspots are governed
by specific short DNA sequences, which can be generated in the genome by alteration
of a single nucleotide. These hotspot activating motifs may be targeted by sequence-
specific DNA binding proteins, which act redundantly to promote DSB formation
(Wahls and Davidson, 2011). This may involve epigenetic modification of chromatin
structure by the transcription factor binding, which promotes DSB formation.
Recombination hotspots in mouse were mainly identified in the major
histocompatibility complex (MHC) regions, including the proteasome subunit β type-9
(Pmsb9) hotspot (Guillon and de Massy, 2002), the Eβ-hotspot (Shenkar et al., 1991)
and the Pb hotspot (Isobe et al., 2002). Interestingly, the mouse Eβ-hotspot (located in
the second intron of the class II Eβ gene) imitates certain characteristics of the α-
hotspot in yeast. In particular, two DNase I hypersensitive sites were detected in the
Eβ intron, with one of them located adjacent to the putative transcription factor
binding sites (Shenkar et al., 1991). Similar to yeast, these hypersensitive sites alone
are not sufficient to produce hotspot activity, since not all DNase I hypersensitive sites
are associated with recombination hotspots (Shenkar et al., 1991). Additionally,
nuclease hypersensitive sites were not detected at another MHC-associated hotspot,
the Psmb9 gene (Arnheim et al., 2007). Therefore, the binding of specific transcription
factors could be essential for hotspot activity by generating chromatin status that is
more permissive to the formation of DSB.

32
In humans, several recombination hotspots have been identified including the MHC-
associated hotspots (DPA1, DNA1 and TAP2), the minisatellite-associated hotspot
MS32 and the male-specific SHOX hotspot within the pseudoautosomal region
(Arnheim et al., 2007). Detailed searches for a common sequence motif for
recombination hotspots in humans have result in the identification of a degenerate 13-
mer sequence, which is highly associated with the presence of hotspots (Myers et al.,
2008). This consensus motif corresponds to the zinc-finger domains of a PR domain-
containing 9 (Prdm9) protein, a transcription factor with histone H3 lysine 4 (H3K4)
methyltransferase activity (Baudat et al., 2010). Additionally, Grey et al. (2011)
demonstrated that Prdm9 binding at hotspots stimulates local H3K4 trimethylation,
which is correlated with the hotspot activity (discussed further in Chapter 5).
The existence of a putative α-hotspot has also been suggested in humans based on a
population genetics statistical analysis (Zhang et al., 2004). Using the European
population samples in the Seattle SNPs database, nearly half of the detected putative
hotspots were found in the promoter regions (Zhang et al., 2004). In addition, the
presence of transcription factor binding sites was also detected within recombination
hotspots in another genome-wide computational analysis (Mani et al., 2009). These
observations hint at a conserved existence of transcription factor-dependent hotspot
activity in humans, although genetic evidence of the α-hotspot is yet to be discovered.
Information on factors controlling the distribution of recombination hotspots can
provide great benefits. Understanding the molecular mechanisms determining hotspot
selection in humans could be beneficial for the study of genome evolution and the
analyses of complex diseases (Jeffreys et al., 2004). In specific, localisation of

33
recombination hotspots could provide explanations for haplotype patterns thus
facilitating mapping of disease related-loci by their association with other markers
(Hey, 2004). Furthermore, knowledge of factors influencing recombination hotspots in
yeast and other model organisms offers a means to learn about other recombination-
associated processes. The association between transcription factors with hotspot
activity has also become increasingly appreciated in different organisms. However, the
mechanism by which these proteins influence hotspot activity and factors controlling
this interaction are yet to be fully elucidated. In this study, we focused on
characterising factors influencing HIS4 hotspot activity in S. cerevisiae to further
understand the regulation of this transcription factor-dependent hotspot.
1.5.3 The Regulation of HIS4 Transcription and Recombination
The recombination hotspot associated with the HIS4 gene in S. cerevisiae is positioned
in the region between the 5’ end of HIS4 and the 3’ end of BIK1 (Detloff et al., 1992).
This region displayed high levels of DSBs and recombination (White et al., 1993, Detloff
et al., 1992, Fan et al., 1995). The HIS4 hotspot is extensively used in the study of
meiotic recombination in various strain backgrounds frequently Y55 (Hoffmann and
Borts, 2004, Cotton et al., 2009), SK1 (Keelagher et al., 2010) and S288C (White et al.,
1991, White et al., 1992).
1.5.3.1 Transcription Factor Binding at HIS4
The promoter region of HIS4 is bound by the transcription factors Bas1p/Bas2p (Basal),
Gcn4p (General Control Non-derepressible) and Rap1p (Repressor Activator Protein)
(White et al., 1993, Arndt et al., 1987). At the transcriptional level, the expression of
HIS4 is regulated by two control systems that operate independently from one another

34
(Tice-Baldwin et al., 1989). Gcn4p activates HIS4 via the general amino acid control
(GAAC) system while the Bas1p/Bas2p (Bas1/2p) complex is responsible for the basal
expression of the gene (Arndt et al., 1987). Strains with mutations of bas1, bas2 and
gcn4 require histidine for growth and only have modest level of transcription of HIS4
(Tice-Baldwin et al., 1989).
Bas1p binds to DNA sequences that include the 5’-TGACTC-3’ hexanucleotide motif
upstream of HIS4 (Tice-Baldwin et al., 1989, Daignan-Fornier and Fink, 1992, Høvring et
al., 1994). Similarly, the highly conserved 5’-TGACTC-3’ binding sequence is also the
core element of the recognition site for Gcn4p (Arndt and Fink, 1986). Gcn4p has five
binding sites upstream of HIS4, sites A to E (Figure 1.5) and binds them in a selective
manner (Arndt and Fink, 1986). Of these, Gcn4p binds with highest affinity to site C
(Arndt and Fink, 1986, Hope and Struhl, 1985). The common binding motif for Bas2p
was found at the position immediately adjacent to the Bas1p binding sites upstream of
HIS4 (Tice-Baldwin et al., 1989, Rolfes et al., 1997).
Rap1p is an essential DNA binding protein involved in either activating or repressing
transcription of many genes, in a context-dependent manner (Piña et al., 2003, Joo et
al., 2011). At HIS4, Rap1p binds adjacent to the Bas2p binding site, overlapping with
the high affinity Gcn4p binding site (Figure 1.5) (Devlin et al., 1991). It has been shown
that Rap1p and Gcn4p compete to bind at site C in vitro (Arndt and Fink, 1986), but
could likely bind simultaneously in vivo (Devlin et al., 1991). The binding of Rap1p does
not efficiently activate HIS4 transcription by itself, but is required for both Gcn4p- and
Bas1/2p-activation of HIS4 (Devlin et al., 1991). It has been shown that the presence of

35
Figure 1.5 : DNA binding sites for Bas1p, Bas2p, Gcn4p and Rap1p at the promoter region of HIS4. Gcn4p binds at sites A – E,; Bas1p also binds
at site A but is shown at site B, which it has highest affinity; Gcn4p binds with high affinity at site C. The binding site of Rap1p is overlaps with
site C. Adapted from Tice-Baldwin et al. (1989), Devlin et al. (1991) and Cotton (2007).

36
Rap1p binding site results in increased sensitivity to nucleases at the high affinity
Gcn4p binding site and the Bas1/2p binding sites (Devlin et al., 1991). Therefore, this
suggests that the function of Rap1p in activating the transcription of HIS4 is by
maintaining and enhancing the accessibility of binding sites for other transcription
factors.
With regard to meiosis, White et al. (1992 and 1993) showed that removing the
binding sites of Rap1p and Bas2p upstream of HIS4 reduces the level of recombination.
Mutating bas1 or bas2 also reduces DSB production and eliminates HIS4 hotspot
activity (White et al., 1993, Fan et al., 1995). Furthermore, the level of DSBs is strongly
decreased when binding sites of Rap1p were removed (Fan et al., 1995). These findings
indicate that the binding of Bas1p, Bas2p and Rap1p are required for hotspot activity
at the HIS4 locus. White et al. (1993) also demonstrated that in the absence of Bas1p
and Bas2p, insertion of two binding sites of Rap1p results in the wild-type level of
recombination. This suggests that additional binding of Rap1p can substitute for
recombination activity that depends on Bas1p and Bas2p.
Loss of Gcn4p binding activity was shown to have little effect on recombination (White
et al., 1992). However, Gcn4p has been demonstrated to be required and produce a
positive regulatory effect on HIS4 hotspot activity in a different strain background
(Cotton et al., 2009). Specifically, Abdullah and Borts (2001) demonstrated that
deletion of gcn4 reduces the level of recombination at HIS4 while overexpression of
Gcn4p results in an increased level of the NMS events. Therefore, Gcn4p could be
essential in regulating recombination, particularly in response to various stress
conditions known to affect Gcn4p activity.

37
1.5.3.2 Gene Regulation by Bas1p and Bas2p
Bas1p contains a Myb-related protein domain in its amino-terminal region that is
homologous to the proto-oncogene family (Tice-Baldwin et al., 1989, Høvring et al.,
1994). Bas2p (also known as Pho2p and Grf10p) is a DNA-binding protein that contains
an amino-terminal homeobox domain (Bürglin, 1988, Tice-Baldwin et al., 1989). Bas1p
and Bas2p are known to cooperatively regulate several genes involved in the pathways
of purine and histidine biosynthesis, and the one carbon metabolism pathway
(Daignan-Fornier and Fink, 1992, Arndt et al., 1987, Denis et al., 1998, Springer et al.,
1996, Denis and Daignan-Fornier, 1998). In addition to the interaction with Bas1p,
Bas2p also interacts with other partner proteins to regulate transcription of genes in
other metabolic pathways. Bas2p interacts with Pho4p (a basic helix-loop-helix
protein) to activate genes involved in the phosphate utilisation pathway (Barbarid et
al., 1996). Additionally, Bas2p interacts with Swi5p (a zinc finger protein) to regulate
the expression of the HO genes (Brazas and Stillman, 1993a).
The cooperative activation by Bas1p and Bas2p of their target genes has been shown
to be stimulated under adenine limitation (Arndt et al., 1987, Daignan-Fornier and
Fink, 1992, Denis et al., 1998). Furthermore, the interaction between Bas1p and Bas2p
is regulated by two intermediates from the purine biosynthesis pathway, 5'-
phosphoribosyl-4-carboxamide-5-aminoimidazole (AICAR) and 1-(5-phosphoribosyl)-4-
(N-succinocarboxyamido)-5-aminoimidazole (SAICAR) (Rebora et al., 2001, Rebora et
al., 2005, Pinson et al., 2009). It has been demonstrated that mutations that
accumulate AICAR/SAICAR results in increased transcription of HIS4 through the
activation of Bas1p and Bas2p interaction (Rebora et al., 2005, Pinson et al., 2009). A

38
more detailed explanation on the regulation of purine biosynthesis on HIS4
transcription is provided in Chapter 3.
1.5.3.3 General Amino Acid Control (GAAC) by Gcn4p
Gcn4p is a leucine zipper-related activator that was shown to regulate at least 500
genes, under the general amino acid control system (Natarajan et al., 2001). Gcn4p
regulates genes involved in the amino acid, purines, pyrimidines and vitamin
biosynthetic pathways and some genes involved in the metabolism of glycogen
(Hinnebusch and Natarajan, 2002). Additionally, genes from the mitochondrial carrier
family and the amino acid transporter family are also regulated by Gcn4p (Natarajan et
al., 2001).
The general amino acid control is a regulatory system adapted by cells in response to
the deprivation of amino acids (Hinnebusch, 1988). This response operates at the
translational level, increasing protein synthesis of Gcn4p when amino acids are limited.
In addition, the synthesis of Gcn4p can also be induced under purine limitation,
glucose deprivation and growth on a non-fermentable carbon source such as ethanol
(Rolfes and Hinnebusch, 1993, Yang et al., 2000). Other stimuli that were also found to
activate Gcn4p include methyl-methanosulfonate (MMS) and a high salinity growth
medium (Hinnebusch and Natarajan, 2002). Therefore, these findings imply that Gcn4p
is an essential transcriptional regulator in yeast, having a major role in metabolic cell
activities in response to various stress conditions.
1.5.4 Environmental Factors Influencing Hotspot Activity
In addition to the genetic factors, various environmental influences can also affect the
level of recombination in S. cerevisiae. In particular, the HIS4 hotspot was shown to be

39
affected by modulating temperature and the nutritional composition of sporulation
media. Fan et al. (1995) demonstrated substantial differences in the level of
recombination at HIS4 between cells that were sporulated at two different
temperatures. Specifically, the level of NMS at HIS4 was elevated when cells were
sporulated at 18°C relative to 25°C (Fan et al., 1995). Furthermore, cells exhibited a 7-
fold decrease in gene conversion and crossing over at his4-ATC (a G to C change at the
third base pair of the start codon) when sporulated at 37°C compared to 23°C (Cotton
et al., 2009). The influence of temperature on hotspot activity was also shown to affect
early steps of recombination. Specifically, the formation of crossovers in the zmm
mutants is reduced at 33°C compared to 23°C (Borner et al., 2004). These observations
indicate the ability of temperature to affect meiotic recombination, although its
mechanism is still poorly understood.
The effect of nutritional conditions on recombination at HIS4 has also been studied
(Cotton, 2007, Abdullah and Borts, 2001). Particularly, cells that were pre-grown and
sporulated on media with limited nutrients (specifically adenine and amino acids)
exhibited an approximately 1.6-fold increase in the levels of NMS and crossing over
compared to sporulation on fully supplemented media (Cotton, 2007). This effect is
likely associated with transcription factor binding activity since Bas1p, Bas2p and
Gcn4p are controlled by exogenous starvation and stress conditions (Borts, 2009).
Accordingly, these findings suggest a correlation between environmental factors with
the activity of the recombination hotspot (discussed in Chapter 4).

40
1.6 Aims and Objectives
This project aims to further elucidate the influence of nutritional status on meiotic
recombination at HIS4, and different mechanisms mediating this effect. More
specifically, we aim to explore the influence of nutritional starvation, particularly
adenine and amino acids, upon transcription factor-dependent recombination at HIS4
in Saccharomyces cerevisiae. We also aim to establish the role of Gcn4p in mediating
the starvation-induced activity at the HIS4 hotspot. Given that Gcn4p regulates more
than 500 genes in yeast through the general amino acid control system, the ability to
manipulate recombination via Gcn4p can provide a significant contribution in the study
of meiotic recombination.
The second objective is to determine the effect of AICAR and SAICAR, two
intermediates from the purine biosynthesis pathway, on recombination at HIS4.
Although AICAR/SAICAR were known to positively influence the transcription of HIS4
through activation of Bas1/2p, the effect of these metabolites on HIS4 recombination
is yet to be investigated. Specifically, we would like to examine if the HIS4 hotspot
activity mediated by Bas1/2p can be enhanced by deleting genes in the purine
biosynthesis pathway that were previously shown to increase the production of AICAR
and SAICAR. This can provide further understanding on the mechanism by which Bas1p
and Bas2p regulates recombination activity at HIS4.

41
Chapter 2 : Materials and Methods
2.1 Materials
2.1.1 Yeast Strains
All strains used in this study were derived from the Y55 background of S. cerevisiae
unless otherwise stated. The list of haploid strains used in this study is presented in
Table 2.1.
2.1.2 Plasmids
Plasmids used in this study are listed in Table 2.2.
2.1.3 Yeast Media
Rich growth medium, YEPD (Yeast Extract, Peptone and Dextrose) consisted of 1%
(w/v) Bacto yeast extract (BD), 2% (w/v) Bacto peptone (BD), 2% (w/v) dextrose (D-
glucose; Fisher Scientific) and 0.005% (w/v) adenine hemisulphate solution in 0.05 M
HCl. For selection against petite mutants, YEPEG (Yeast Extract, Peptone, Ethanol and
Glycerol) medium was used, consisting of 1% succinic acid (Fisher Scientific), 1% (w/v)
Bacto yeast extract, 2% (w/v) Bacto peptone, 2% (v/v) glycerol and 0.5% (w/v) adenine
hemisulphate in 0.05 M hydrochloric acid. The pH was adjusted to 5.5. After
autoclaving, 2% ethanol was added to the medium.
Synthetic minimal medium contained 0.68% (w/v) yeast nitrogen base without amino
acids (BD) and 2% (w/v) dextrose. Synthetic complete medium was prepared as the
minimal medium, with the addition of 870 mg/L nutrient mixture (Table 2.3). The
medium was also supplemented with 6.25 ml/L of 1% (w/v) leucine and 3 ml/L of 1%
(w/v) lysine solution. Synthetic ‘drop-out’ media was made as the synthetic complete

42
Table 2.1 : List of haploid strains
Strain name Key feature Genotype Source
FAH 559-4B* Wild-type
HIS4; LEU2; ADE1; MATa; TRP; CYH; MET; lys2-d; CANS; ura3 Abdullah and Borts (2001)
FAH 639-14B* Wild-type
his4:XhoI; leu2-r; ADE1; MATα; TRP; cyhR; met13-4; lys2-d; CANS; ura3 Abdullah and Borts (2001)
FAH 640-4D* Wild-type
HIS4; LEU2; ade1-1; MATa; trp5-1; CYH; METe; lys2-c; can1; ura3 Abdullah and Borts (2001)
FAD 640-8C* gcn4Δ
HIS4; LEU2; ade1-1; MATa; trp5-1; CYH; METe; lys2-c; can1; ura3; gcn4::KanMX4
Abdullah and Borts (2001)
FAH 913-6C* bas1Δ
his4: XhoI; leu2-r; ADE1; MATα; TRP; cyhR; met13-4; lys2-d; CANS; ura3; bas1::KanMX4
Abdullah and Borts (2001)
FAH 913-13B* bas1Δ
his4: XhoI; leu2-r; ADE1; MATa; TRP; cyhR; met13-4; lys2-d; CANS; ura3; bas1::KanMX4
Abdullah and Borts (2001)
VC 155 ade1-1 RRP7::NAT; his4-ATC; FUS1::HYG; LEU2; MATa; ade1-1; trp5-1; cyh2-1; MET13; lys2-c; ura3-1
Cotton (2007)
*Derived from the H390 x H330 (Y55-like) strain backround.

43
Strain name Key feature Genotype Source
VC 156 ade1-1 HIS4-HhaI; leu2-r; MATα; ade1-1; TRP5; CYH2; met13-2; lys2-d; CANS; ura3-1 Cotton (2007)
Y55 2830 Wild type HIS4-HhaI; leu2-r; MATa; TRP5; CYH2; met13-2; lys2-d; CANS; ura3-1 This study
Y55 3569 Wild type RRP7::NAT; his4-ATC; FUS1::HYG; LEU2; MATα; trp5-1; cyh2-1; MET13; lys2-c; ura3-1
This study
Y55 3549 ade1Δ HIS4-HhaI; leu2-r; MATa; TRP5; CYH2; met13-2; lys2-d; CANS; ura3-1; ade1::KanMX4
This study
Y55 3562 ade1Δ RRP7::NAT; his4-ATC; FUS1::HYG; LEU2; MATα; trp5-1; cyh2-1; MET13; lys2-c; ura3-1; ade1::KanMX4
This study
Y55 3593 ade16Δ HIS4-HhaI; leu2-r; MATa; TRP5; CYH2; met13-2; lys2-d; CANS; ura3-1; ade16::KanMX4
This study
Y55 3594 ade16Δ RRP7::NAT; his4-ATC; FUS1::HYG; LEU2; MATα; trp5-1; cyh2-1; MET13; lys2-c; ura3-1; ade16::KanMX4
This study
Y55 3571 ade17Δ HIS4-HhaI; leu2-r; MATa; TRP5; CYH2; met13-2; lys2-d; CANS; ura3-1; ade17::KanMX4
This study
Y55 3572 ade17Δ RRP7::NAT; his4-ATC; FUS1::HYG; LEU2; MATα; trp5-1; cyh2-1; MET13; lys2-c; ura3-1; ade17::KanMX4
This study
Y55 3602 ade16Δ ade17Δ
HIS4-HhaI; leu2-r; MATa; TRP5; CYH2; met13-2; lys2-d; CANS; ura3-1; ade16::KanMX4; ade17::KanMX4
This study

44
Strain name Key feature Genotype Source
Y55 3603 ade16Δ ade17Δ
RRP7::NAT; his4-ATC; FUS1::HYG; LEU2; MATα; trp5-1; cyh2-1; MET13; lys2-c; ura3-1; ade16::KanMX4; ade17::KanMX4
This study
Y55 3616 his1Δ HIS4-HhaI; leu2-r; MATa; TRP5; CYH2; met13-2; lys2-d; CANS; ura3-1; his1::KanMX4
This study
Y55 3617 his1Δ RRP7::NAT; his4-ATC; FUS1::HYG; LEU2; MATα; trp5-1; cyh2-1; MET13; lys2-c; ura3-1; his1::KanMX4
This study
Y55 3618 his1Δ ade1Δ HIS4-HhaI; leu2-r; MATa; TRP5; CYH2; met13-2; lys2-d; CANS; ura3-1; his1::KanMX4; ade1::KanMX4
This study
Y55 3619 his1Δ ade1Δ RRP7::NAT; his4-ATC; FUS1::HYG; LEU2; MATα; trp5-1; cyh2-1; MET13; lys2-c; ura3-1; his1::KanMX4; ade1::KanMX4
This study
Y55 3622 pClb2-HA3-BAS1 ade16Δ ade17Δ
HIS4-HhaI; leu2-r; MATa; TRP5; CYH2; met13-2; lys2-d; CANS; ura3-1; pClb2-HA3-BAS1 ade16::KanMX4; ade17::KanMX4
This study
Y55 3623 pClb2-HA3-BAS1 ade16Δ ade17Δ
RRP7::NAT; his4-ATC; FUS1::HYG; LEU2; MATα; trp5-1; cyh2-1; MET13; lys2-c; ura3-1; pClb2-HA3-BAS1; ade16::KanMX4; ade17::KanMX4
This study
Y55 3595 gcn4Δ HIS4-HhaI; leu2-r; MATa; TRP5; CYH2; met13-2; lys2-d; CANS; ura3-1; gcn4::KanMX4
This study

45
Strain name Key feature Genotype Source
Y55 3596 gcn4Δ RRP7::NAT; his4-ATC; FUS1::HYG; LEU2; MATα; trp5-1; cyh2-1; MET13; lys2-c; ura3-1; gcn4::KanMX4
This study
Y55 3599 pClb2-HA3-BAS1 HIS4-HhaI; leu2-r; MATa; TRP5; CYH2; met13-2; lys2-d; CANS; ura3-1; pClb2-HA3-BAS1
This study
Y55 3600 pClb2-HA3-BAS1
RRP7::NAT; his4-ATC; FUS1::HYG; LEU2; MATα; trp5-1; cyh2-1; MET13; lys2-c; ura3-1; pClb2-HA3-BAS1
This study
Y55 3612 bas1Δ HIS4-HhaI; leu2-r; MATa; TRP5; CYH2; met13-2; lys2-d; CANS; ura3-1; bas1::KanMX4
This study
Y55 3613 bas1Δ RRP7::NAT; his4-ATC; FUS1::HYG; LEU2; MATα; trp5-1; cyh2-1; MET13; lys2-c; ura3-1; bas1::KanMX4
This study
Y55 3626 gcn4Δ ade1Δ HIS4-HhaI; leu2-r; MATa; TRP5; CYH2; met13-2; lys2-d; CANS; ura3-1; gcn4::KanMX4; ade1::KanMX4
This study
Y55 3627 gcn4Δ ade1Δ RRP7::NAT; his4-ATC; FUS1::HYG; LEU2; MATα; trp5-1; cyh2-1; MET13; lys2-c; ura3-1; gcn4::KanMX4; ade1::KanMX4
This study
Y55 3620 gcn4Δ bas1Δ HIS4-HhaI; leu2-r; MATa; TRP5; CYH2; met13-2; lys2-d; CANS; ura3-1; gcn4::KanMX4; bas1::KanMX4
This study
Y55 3621 gcn4Δ bas1Δ RRP7::NAT; his4-ATC; FUS1::HYG; LEU2; MATα; trp5-1; cyh2-1; MET13; lys2-c; ura3-1; gcn4::KanMX4; bas1::KanMX4
This study
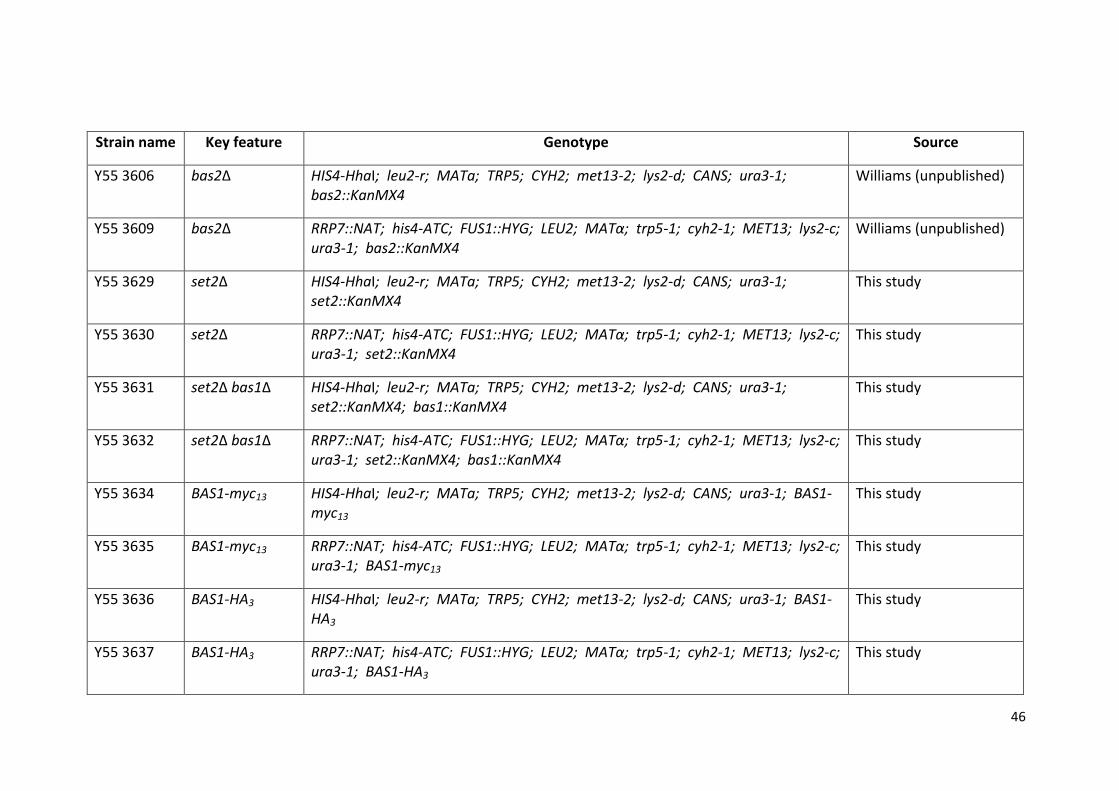
46
Strain name Key feature Genotype Source
Y55 3606 bas2Δ HIS4-HhaI; leu2-r; MATa; TRP5; CYH2; met13-2; lys2-d; CANS; ura3-1; bas2::KanMX4
Williams (unpublished)
Y55 3609 bas2Δ RRP7::NAT; his4-ATC; FUS1::HYG; LEU2; MATα; trp5-1; cyh2-1; MET13; lys2-c; ura3-1; bas2::KanMX4
Williams (unpublished)
Y55 3629 set2Δ HIS4-HhaI; leu2-r; MATa; TRP5; CYH2; met13-2; lys2-d; CANS; ura3-1; set2::KanMX4
This study
Y55 3630 set2Δ RRP7::NAT; his4-ATC; FUS1::HYG; LEU2; MATα; trp5-1; cyh2-1; MET13; lys2-c; ura3-1; set2::KanMX4
This study
Y55 3631 set2Δ bas1Δ HIS4-HhaI; leu2-r; MATa; TRP5; CYH2; met13-2; lys2-d; CANS; ura3-1; set2::KanMX4; bas1::KanMX4
This study
Y55 3632 set2Δ bas1Δ RRP7::NAT; his4-ATC; FUS1::HYG; LEU2; MATα; trp5-1; cyh2-1; MET13; lys2-c; ura3-1; set2::KanMX4; bas1::KanMX4
This study
Y55 3634 BAS1-myc13 HIS4-HhaI; leu2-r; MATa; TRP5; CYH2; met13-2; lys2-d; CANS; ura3-1; BAS1-myc13
This study
Y55 3635 BAS1-myc13 RRP7::NAT; his4-ATC; FUS1::HYG; LEU2; MATα; trp5-1; cyh2-1; MET13; lys2-c; ura3-1; BAS1-myc13
This study
Y55 3636 BAS1-HA3 HIS4-HhaI; leu2-r; MATa; TRP5; CYH2; met13-2; lys2-d; CANS; ura3-1; BAS1-HA3
This study
Y55 3637 BAS1-HA3 RRP7::NAT; his4-ATC; FUS1::HYG; LEU2; MATα; trp5-1; cyh2-1; MET13; lys2-c; ura3-1; BAS1-HA3
This study

47
Strain name Key feature Genotype Source
Y55 3638 BAS1-HA3 gcn4Δ
HIS4-HhaI; leu2-r; MATa; TRP5; CYH2; met13-2; lys2-d; CANS; ura3-1; BAS1-HA3; gcn4::KanMX4
This study
Y55 3639 BAS1-HA3 gcn4Δ
RRP7::NAT; his4-ATC; FUS1::HYG; LEU2; MATα; trp5-1; cyh2-1; MET13; lys2-c; ura3-1; BAS1-HA3; gcn4::KanMX4
This study
Y55 3641 pClb2-HA3-BAS1 gcn4Δ
RRP7::NAT; his4-ATC; FUS1::HYG; LEU2; MATα; trp5-1; cyh2-1; MET13; lys2-c; ura3-1; pClb2-HA3-BAS1; gcn4::KanMX4
This study
Y55 3642 BAS1-myc13 gcn4Δ
HIS4-HhaI; leu2-r; MATa; TRP5; CYH2; met13-2; lys2-d; CANS; ura3-1; BAS1-myc13 gcn4::KanMX4
This study
Y55 3643 BAS1-myc13 gcn4Δ
RRP7::NAT; his4-ATC; FUS1::HYG; LEU2; MATα; trp5-1; cyh2-1; MET13; lys2-c; ura3-1; BAS1-myc13; gcn4::KanMX4
This study
Y55 3644 bas1Δ ade1Δ HIS4-HhaI; leu2-r; MATa; TRP5; CYH2; met13-2; lys2-d; CANS; ura3-1; bas1::KanMX4; ade1::KanMX4
This study
Y55 3645 bas1Δ ade1Δ RRP7::NAT; his4-ATC; FUS1::HYG; LEU2; MATα; trp5-1; cyh2-1; MET13; lys2-c; ura3-1; bas1::KanMX4; ade1::KanMX4
This study
Y55 3646 Tester strain for ade16ade17
RRP7::NAT; his4-ATC; FUS1::HYG; LEU2; HO; cyh2-1; MET13; lys2-c; ura3-1; arg4-1; CanS
This study

48
Table 2.2 : List of plasmid used in this study
Plasmid Description Reference
pFa6-KanMX4 KanMX4 (Goldstein and McCusker, 1999)
pFA6a-pCLB2-HA3-KanMX6 Clb2 promoter (Lee and Amon, 2003)
pFA6a-HA3-KanMX6 3-HA tag (Longtine et al., 1998)
pFA6a-myc13-KanMX6 13-myc tag (Longtine et al., 1998)
pWJ 716 KlURA3 (Erdeniz et al., 1997)
PLB1 (pRED 739) ADE1 ORF Aldred and Borts (unpublished)
Table 2.3 : Composition of the nutrient mixture
Table 2.4 : Drugs
Drug Concentration (µg/ml) Supplier
Ampicillin 100 Melford
Cycloheximide 10 Sigma
Geneticin (G418) 200 / 400* Invitrogen
Hygromycin B 300 A.G. Scientific
Nourseothricin 100 Werner Bioagents
5’-FOA 1000 Apollo Scientific
* Different concentrations were used for initial selection of G418 resistant colonies (400 µg/ml), and subsequent selection to confirm G418 resistance (200 µg/ml).
Amino acid Quantity (mg)
Adenine 800
Arginine 800
Aspartic acid 4000
Histidine 800
Leucine 800
Lysine 1200
Methionine 800
Phenylalanine 2000
Threonine 8000
Tryptophan 800
Tyrosine 1200
Uracil 800

49
medium, with omission of appropriate amino acid or nutrient from the nutrient
mixture (Table 2.3). Antibiotic drugs including geneticin (G418), hygromycin B,
nourseothricin and cyclohexamide were added to YEPD after autoclaving. 5’-Fluoro-
orotic acid (5’-FOA) was added to uracil ‘drop-out’ medium, but supplemented with 50
µg/ml uracil.
Two types of sporulation media were used in this study. Complete sporulation (KAC)
medium contained 2% potassium acetate (Fisher Scientific), 0.22% Bacto yeast extract,
0.05% dextrose, and 0.088% (w/v) nutrient mixture (Table 2.3). For experiments that
involve starvation, minimal KAC medium containing 2% potassium acetate was used,
supplemented with only the nutrients that cells were auxotrophic for (Table 2.3).
All media was prepared using distilled water, and adjusted to pH 6.0-6.5 with either 1
M hydrochloric acid or 1 M sodium hydroxide, unless otherwise stated. To make solid
media, 2.5% Bacto agar (BD) was added.
2.1.4 Bacterial Media
Escherichia coli was grown in Luria-Bertani (LB) medium containing 0.5% (w/v) Bacto
yeast extract, 1% (w/v) Bacto peptone and 1% (w/v) NaCl with pH adjustment to 7.0.
The LB medium was supplemented with ampicillin (Table 2.4) for plasmid selection.
2.1.5 Oligonucleotides
All oligonucleotides used in this study were purchased from Fisher Scientific
(Invitrogen) (Table 2.5).

50
2.1.6 Molecular Weight Markers
The DNA marker that was typically used for agarose gel electrophoresis was λ
bacteriophage DNA digested with BstEII (New England Biolabs) at a concentration of 25
ng/µl. Precision plus protein marker (Biorad) was used as a molecular weight standard
for western blot analysis, at a concentration of approximately 20 μg per well.
2.2 Methods
2.2.1 Polymerase Chain Reaction (PCR)
2.2.1.1 Standard PCR Method
Taq Polymerase (KAPA Biosystems) was used for standard PCR reactions, which
typically had a final volume of 25 μl or 50 μl. PCR reactions contained 0.2 μM of each
primer, 1x PCR buffer from 11.1x stock (45 mM Tris-HCl pH8.8, 11 mM ammonium
sulphate, 4.5 mM magnesium chloride, 6.7 mM β-mercaptoethanol, 4.4 μM EDTA pH
8, 1 mM of each deoxynucleotide triphosphate and 113 μg/ml bovine serum albumin)
(Jeffreys et al., 1990) and 10 to 50 ng DNA as template. Phusion Polymerase
(Finnzymes) was used for PCR that required high-fidelity amplification. PCR reactions
using Phusion was performed according to the manufacturer’s guidelines.
Typical PCR conditions using Taq Polymerase involved initial denaturation at 95°C for 3
minutes followed by 35 cycles consisting of a denaturation step at 95°C for 30 seconds,
an annealing step at primer-independent temperature for 30 seconds and an

51
Table 2.5 : List of oligonucleotides
Key feature Sequence (5’ – 3’) Purpose
ADE1 F CATTGCTTACAAAGAATACACATACGAAATATTAACGATACGTACGCTGCAGGTCGAC
To amplify KanMX4 from pFa6-KanMX4 for deletion of ADE1
ADE1 R GAGGAGTTACACTGGCGACTTGTAGTATATGTAAATCACGATCGATGAATTCGAGCTCG
ADE1 A1 CACTTGCGGAAGTCTCATCA To verify insertion of cassette into ADE1
ADE1 A4 TGGTTTCAGATCACGATGGA
ADE16 F CATTCCAAACAAAGAATCCAAATATACCATAAATAGGGACAAAAAACAAAAGAGCTAAAACGTACGCTGCAGGTCGAC
To amplify KanMX4 from pFa6-KanMX4 for deletion of ADE16
ADE16 R ATATACACTTGTATTCAGCTATATATGTTGTTTCTGTTCTTCTCATAAAATGTACCCTACATCGATGAATTCGAGCTCG
ADE16 A1 AAACCCCTACCCCCTCTTCT To verify insertion of cassette into ADE16
ADE16 A4 ACTGGGCTAGCGTTTTTCAA
ADE17 F GCAACTAATAGCCCTTGAAGTAGTTTTGCTAGCTTGGACATCAAAGCACATATCACCATCAAATCGTACGCTGCAGGTCGAC
To amplify KanMX4 from pFa6-KanMX4 for deletion of ADE17
ADE17 R CTATACATCGATTTGCCGTCATTTCTGTATTTATGGCATATTGACTCTGAACTCATGCCATATCGATGAATTCGAGCTCG
ADE17 A1 CGTCGTGCTGCTAACTTGAG To verify insertion of cassette into ADE17
ADE17 A4 CTGGGGGATTCTGATGAAGA

52
Key feature Sequence (5’ – 3’) Purpose
BAS1 F TAAAACTTTTGTTGTAGCGTTTTTGCTCTTTTTTTTTTATCGCAGAATACATTTTATCGAGACGTACGCTGCAGGTCGAC
To amplify KanMX4 from pFa6-KanMX4 for deletion of BAS1
BAS1 R ATTACAAAACTAATATGTTAAACAATTGAAAGATTTGTGTTTTTTTTCGGCCTTGCCTTCATCGATGAATTCGAGCTCG
BAS1 A1 CACAGAATAAAGCCCCAGGA To verify insertion of cassette into BAS1
BAS1 A4 AAGGAATGGATGCTGACCAC
pClb2-Bas1 F4 GAGCAGCATGGTCTAACAATCCTCTTAAGTTCTTTAGCCGTAATTGCGAATAAAACTGTTGAATTCGAGCTCGTTTAAAC
Insertion of the CLB2 promoter with the HA3 tag at the N-terminal region of BAS1
pClb2-Bas1 R3-HA
ATCGAAGCCGGATCCTCTTTTTGGCTTACTTTTTCGTATATCTTTGGTACTTATATTCGAGCACTGAGCAGCGTAATCTG
pClb2-Bas1 A1 ACCCATCACGTGTTCGTCTT To verify insertion of the CLB2 promoter at BAS1
pClb2-Bas1 A4 TTGGGTCCAGAGATCCTGTC
BAS1 C-tag F2 GAGCATGATATGACGTCAGGAGGTTCTACCGATAATGGGTCAGTCCTGCCACTGAATCCTCGGATCCCCGGGTTATTAA
Insertion of the HA3 or myc13 tag from pFA6a-
HA3-KanMX6 or pFA6a-myc13-KanMX6 respectively into the C-terminal region of BAS1 BAS1 C-tag R1 GCTTATTACAAAACTAATATGTTAAACAATTGAAAGATTTGTGTTTTTTTTCG
GCCTTGCGAATTCGAGCTCGTTTAAAC
BAS1 C-tag A1 CGACGGCATCATATACAACG To verify insertion of the HA3 or myc13 tag into
BAS1 BAS1 C-tag A4 TGTGTTTGTGGGCGGAAAGA
BAS2 F AGACATTCAACAGGGCTAGACAAGTCACGGCTTACTGCTAAATAACGTATACAATACGCTCGTACGCTGCAGGTCGAC
To amplify KanMX4 from pFa6-KanMX4 for deletion of BAS2

53
Key feature Sequence (5’ – 3’) Purpose
BAS2 F AGACATTCAACAGGGCTAGACAAGTCACGGCTTACTGCTAAATAACGTATACAATACGCTCGTACGCTGCAGGTCGAC
To amplify KanMX4 from pFa6-KanMX4 for deletion of BAS2
BAS2 R TAGAGTAATATTTAGAGTTGAAAATGCAATCGCAAAAAAAAAAAAACAGAATTATTTTCACATCGATGAATTCGAGCTCG
To amplify KanMX4 from pFa6-KanMX4 for deletion of BAS2
BAS2 A1 GTGTGGGATTGTTTGTCGTC To verify insertion of cassette into BAS2
BAS2 A4 CGTGCTTTGTCCAGCAACTT
CLB2 F1 TAAGGTGCCTTAGGGGAT To verify insertion of the CLB2 promoter at BAS1 CLB2 F2 GAATCTTTCTGGTATTAATTTTTC
GCN4 F TCGGGGAATAAAGTGCATGAGCATACATCTTGAAAAAAAAAGATGAAAAATTTCCGACTTGAATTCGAGCTCGTTTAAAC
To amplify KanMX4 from pFa6-KanMX4 for deletion of GCN4
GCN4 R ACCATCCAATGGTGAGAAACCCATTGGATTTAAAGCAAATAAACTTGGCTGATATTCGGAGCACTGAGCAGCGTAATCTG
GCN4 A1 GCACAAAGCACCCATACCTT To verify insertion of cassette into GCN4
GCN4 A4 TCGAAGGGGTATCCTGTTTG
HIS1 F CGGTTTGAATCTTTGAAAATAGAAAAGAAAGGATAGGTTTCTAAAAAATTCAATAGAAAACGTACGCTGCAGGTCGAC
To amplify KanMX4 from pFa6-KanMX4 for deletion of HIS1
HIS1 R TTATTGCCTATAAAAAATACAAAATTAATCGGGATTTGGCTTCCCTTTTTCTGTTCTATCATCGATGAATTCGAGCTCG
HIS1 A1 ACCCGGCTAGAGAGGTTGTT To verify insertion of cassette into HIS1
HIS1 A4 GCGTTACGATCCCCAATCTA
HIS4 100R AATCTCTTCATTACTCAGGC To sequence the HIS4 promoter region to check for mutations in the Gcn4p binding sites

54
Key feature Sequence (5’ – 3’) Purpose
HIS4-1277F GGCTCACTAACCAGCTCTCTCC To sequence the HIS4 promoter region to check for mutations in the Gcn4p binding sites
HIS4-333F TGCGATACGATGGGTCATAA
HIS4+2541R CCCACTCTTGCTACTACCTCTCTT
K2 TTCAGAAACAACTCTGGCGCA Internal primers to the KanMX4 cassette to verify insertion
K3 CATCCTATGGAACTGCCTCGG
KanMX4 F CGTACGCTGCAGGTC To amplify KanMX4 DNA to be used as probe in Southern blotting to confirm double and triple gene deletions KanMX4 R ATCGATGAATTCGAGCTCG
SET2 F AGAAAACTGCATAGTCGTGCTGTCAAACCTTTCTCCTTTCCTGGTTGTTGTTTTACGTGA
To amplify KanMX4 from pFa6-KanMX4 for deletion of SET2
SET2 R ACAAGACTTCCTTTGGGACAGAAAACGTGAAACAAGCCCCAAATATGCATGTCTGGTTAA
SET2 A1 AACCGACGAGAAGAAGCTGA To verify insertion of cassette into SET2
SET2 A4 TTCAAGGGTTCTCATCGTTC

55
elongation step of 1 min/kilobase DNA at 72°C; and a final step of 10 minutes
elongation at 72°C. The annealing temperature typically ranged between 51°C to 60°C
and was optimised for specific primers by gradient PCR. Gradient PCR was used to
determine the optimal annealing temperature that is specific for the individual primer
pairs. The PCR cycling conditions were as described above, with gradual increment of
the annealing temperature. The cycling conditions for Phusion PCR were based on the
guidelines provided by the manufacturer. The PCR machine used was a PTC-225 Peltier
Thermal Cycler (MJ Research).
2.2.1.2 Colony PCR
Colony PCR was performed mainly for quick screening of transformants by directly
using yeast cells without purification of DNA. To prepare samples for colony PCR, a
small scrape of a yeast colony (approximately 0.2 mm2) was resuspended in 20 μl of
0.02 M NaOH (Fisher) and boiled at 95°C for 10 minutes. The cells were chilled on ice
for 5 minutes prior to centrifugation at 13,000 r.p.m for one minute. 2 μl supernatant
was added with a 25 μl PCR mixture. The PCR reaction and the PCR cycling conditions
were the same as stated in the standard PCR method (Section 2.2.1.1).
2.2.2 Agarose Gel Electrophoresis
Agarose gel electrophoresis was used to visualise the presence of DNA and to estimate
the size of PCR products. The concentration of agarose used was 1.0% to 1.5%
depending on the length of the DNA fragments to be visualised. Gels were prepared by
dissolving Seakem LE agarose powder (Lonza) in 1x TBE buffer (90 mM Tris-base, 90
mM Boric acid and 2mM EDTA), which was also used as the running buffer for gel
electrophoresis. 0.5 µg/ml ethidium bromide was used to stain the gel. DNA samples

56
were loaded with 0.2x their volume of 5x loading dye consisting of 10% (w/v) Ficoll
type 400, 0.1 M EDTA, 0.2% (v/v) bromophenol blue and 0.5% (w/v) SDS. Appropriate
DNA molecular weight markers were used (Section 2.1.6) to determine the size of the
DNA fragment. DNA was visualised under ultraviolet (UV) light using a Kodak 200L dark
chamber, and the image captured using the Kodak 1D Image analysis software.
2.2.3 DNA Precipitation
DNA was precipitated by adding one tenth of 3 M sodium acetate (pH 5.2) and twice
the volume of the DNA solution of 100% ice-cold ethanol. The mixture was centrifuged
for 30 minutes at 13,000 r.p.m and the supernatant was discarded. 70% ice-cold
ethanol was then added to the precipitated DNA followed by centrifugation for one
minute to isolate the DNA from the ethanol. The pelleted DNA was left to air-dry and
resuspended in the required amount of 1x TE buffer (10 mM Tris-HCl pH 8 and 1 mM
EDTA) before being heated at 65°C for 20 to 30 minutes until the DNA dissolved.
2.2.4 Lithium Acetate Yeast Transformation
The yeast transformation method used was adapted from (Gietz et al., 1992). Cells
were cultured in 5 ml liquid YEPD with shaking at 30°C for approximately 16 hours. The
cultures were diluted 1 in 10 into 5 ml fresh YEPD and allowed to grow further for 3 to
4 hours at 30°C. Cells were then harvested by centrifugation at 3,000 r.p.m for 5
minutes. 1 ml distilled water was used to wash the pellets before resuspending the
pellet in 1 ml 100 mM lithium acetate. The suspension was divided into two 1.5 ml
Eppendorf tubes and one was used as a negative control. These tubes were then
centrifuged for one minute at 13,000 r.p.m and the supernatant was removed. After
that, 240 μl (w/v) polyethylene glycol (50%, MW 3350), 36 μl 1 M lithium acetate, 50 μl

57
2 mg/ml salmon sperm DNA (heated at 95°C for 5 minutes and chilled on ice prior to
use) and 34 μl DNA that had previously been precipitated was added to the cell. The
DNA was substituted with water for the negative control. The tubes were thoroughly
vortexed until the yeast pellet had completely resuspended, and then incubated at
42°C for 40 minutes. Cells were then washed with distilled water three times with
gentle centrifugation at 5,000 r.p.m for 1 minute. Cells were subsequently
resuspended in distilled water and spread onto the appropriate selection media. For
selection of antibiotic resistance markers, the cell pellet was resuspended in 1 ml YEPD
and grown further for 3 to 4 hours with shaking at 30°C before plating. The plates were
incubated at 30°C for 2 to 3 days.
2.2.5 Phenol-Chloroform DNA Extraction
Yeast cells were grown overnight in 5 ml liquid YEPD, and harvested by centrifugation
at 3,000 r.p.m for 5 minutes. 0.5 ml solution A (1.2 M sorbitol, 0.2 M Tris-HCl pH 8.5,
0.02 M EDTA and 0.1% β-mercaptoethanol) and 50 μl of 10 mg/ml zymolyase solution
(made up in solution A without β-mercaptoethanol) was added to the cell. The cell
were incubated at 37°C for 20 minutes until become spheroplasted and then harvested
by centrifugation for one minute. The supernatant was then removed. Cells were
gently resuspended in 50 μl 1 M sorbitol (Sigma) and 0.5 ml solution B (50 mM Tris-HCl
pH 7.5, 100 mM NaCl, 100 mM EDTA, 0.5% SDS). Solution C, containing 50 μl 1 mg/ml
RNAse (Sigma) and 0.2 mg proteinase K (Roche) was also added to the mixture, and
then the cells were incubated at 65°C for at least 2 hours. The cells were then chilled
on ice for 5 minutes followed by addition of 0.5 ml phenol-chloroform (25 units phenol
: 24 units chloroform : 1 unit isoamyl alcohol). After 10 minutes centrifugation at

58
13,000 r.p.m, the top aqueous layer was transferred to a new Eppendorf tube. This
step was repeated twice more. DNA was precipitated using 100% ethanol and
centrifuging for 10 minutes. The DNA was then washed with 70% ethanol and left to
air-dry. The pellet was dissolved in 200 μl 1x TE buffer and incubated at 65°C for 30
minutes.
2.2.6 Site Directed Mutagenesis
2.2.6.1 PCR-Based Gene Disruption
Genes of interest were deleted by replacing the whole open reading frame with a
selectable cassette using a PCR-based method (Wach et al., 1994). Transformants were
verified using PCR (Section 2.2.1) and several strains were further confirmed by DNA
sequencing (Section 2.2.7). The oligonucleotides used for mutagenesis are presented
in Table 2.5.
2.2.6.2 Two-Step Gene Replacement
A two-step gene replacement method was used to incorporate genes that were
already present in an integrative plasmid into the yeast genome (Scherer and Davis,
1979). The plasmids contain a URA3 selectable marker that enables selection of
integrants (‘pop-in’) on the uracil ‘drop-out’ media and counter-selection of the URA3
marker (‘pop-out’) on 5’-FOA media. The plasmid was digested with an enzyme that
had a unique restriction site. The digested plasmid was transferred into yeast using
lithium acetate transformation (Section 2.2.4). The plasmid can integrate into the yeast
genes through homologous recombination. Successful integrants were first selected on
uracil ‘drop-out’ medium before being transferred to 5’-FOA media, which is toxic to
cells containing a functional URA3 gene. Therefore, only cells that have the URA3

59
cassette (pop-out event) are able to grow. The integrants were eventually confirmed
by sequencing.
2.2.7 DNA sequencing
Approximately 100 ng DNA was used as a template for sequencing reactions. The
sequencing reactions also consisted of 1 μl BigDye® Terminator v3.1 (PNACL), 3 μl 5 x
sequencing buffer (PNACL) and 3.2 pmol of the appropriate primer. The PCR conditions
consisted of an initial denaturation at 96°C for 1 minute followed by 29 cycles of 96°C
for 10 seconds, 50°C for 5 seconds and 60°C for 4 minutes. The reaction was purified
using Performa DTR Gel Filtration Cartridges (EDGE Biosystems) according to the
instructions provided, before being sent to the Protein Nucleic Acid Chemistry
Laboratory (PNACL) for samples to be analysed using an Applied Biosystems 3730
sequencer.
2.2.8 Preparation of Plasmid DNA
Plasmids were extracted from E. coli cells that were cultured overnight in 5 ml LB
media supplemented with ampicillin, using the E.Z.N.A. Plasmid Mini Kit I (Omega
Bio-tek) according to the manufacturer’s instructions.
2.2.9 Restriction Enzyme Digestion
All restriction enzymes and buffers were purchased from New England Biolabs (NEB)
and were used according to the manufacturer’s guidelines.
2.2.10 DNA and Protein Quantification
DNA and protein extracts were quantified using 2.0 µl of each sample on a
NanoDrop ND-1000 spectrophotometer according to manufacturer’s guidelines.

60
2.2.11 Genetic Procedures
2.2.11.1 Mating and Sporulation
Haploid strains of opposite mating types (MATa and MATα) were mated on a solid
YEPD medium and incubated at 30°C overnight (approximately 17 hours). Diploid cells
were induced to sporulate by starving cells of nitrogen. After mating, cells were either
directly replicated to sporulation media or were selected for diploids on synthetic
minimal medium prior to sporulation. Two types of KAc were used in this study;
complete KAc and minimal KAc. Minimal KAc medium was used for experiments
involving starvation and was supplemented with only nutrients that cells were unable
to synthesise (Table 2.3). This was necessary to enable sporulation of cells. Cells were
then incubated at 23°C for 3 to 5 days until tetrads were formed. Small samples of cells
were scraped off from the KAc media and visualised using a Swift M400D phase
contrast microscope (Swift Instruments) to confirm sporulation.
2.2.11.2 Selection for Diploids
Diploid cells were selected by replicating mated cells to a synthetic minimal medium
supplemented with the appropriate nutrients that neither haploid could synthesise.
Therefore, only cells that were unable to synthesise nutrients not supplemented in the
medium would be unable to grow. Hence, only diploid cells were able to grow on the
medium.
2.2.11.3 Tetrad Dissection
To prepare tetrads for dissection, cells were scraped from solid sporulation medium
and resuspended in 100 µl cold dissecting buffer (1 M sorbitol, 10 mM EDTA, 10 mM
NaPO4; pH 7.2) supplemented with 5 l 5 mg/ml zymolyase (Seikagaku Biobusiness).

61
Samples were then incubated at 37°C for 30 minutes. A further 400 µl dissecting buffer
was added to the sample which was then stored at 4°C. Tetrads were dissected on
YEPD medium using a Zeiss Axioscope microscope fitted with a micromanipulator
needle (Singer Instruments). Spores that had been separated were allowed to
germinate at 30°C for 2 days.
2.2.11.4 Mating Type Testing
To test the mating type of a particular strain, cells were replicated to a YEPD plate
covered with either a MATa or MATα tester strain and incubated overnight at 30°C.
The following day, the YEPD plate was replicated to a synthetic minimal medium and
incubated overnight at 30°C to select for diploids. The tester strains contained ura2
and tyr1 mutations, which are not present in any other strains used in this study.
Therefore, only strains that have mated and formed diploids can grow on the minimal
medium due to complementation of the auxotrophic genotypes. Thus, strains that
grow on the minimal medium when mated with the MATa tester strain will have α
mating type. Likewise, strains that were able to grow when mated with the MATα
tester strain were MATa.
2.2.11.5 Recombination Analysis
Diploid strains used in this study were heterozygous at HIS4 and several other loci in
chromosome III and VII (Table 2.1; Figure 2.1). Therefore, meiotic recombination
events that include non-Mendelian segregation (NMS; Section 1.3) at these loci and
crossing over in different gene intervals can be evaluated. Genetic intervals analysed in
this study include the NAT-HYG region flanking HIS4, marked with a nourseothricin
resistance cassette (natMX4; or NAT), 5130 bp downstream of the start codon of HIS4

62
Figure 2.1 : All relevant genetic markers in both haploid wild type strains, Y55 2830 (top) and Y55 3569 (bottom) on chromosome III (a) and VII (b) are presented. Genetic markers used for recombination analysis in this study are shown in blue, and the block arrow indicates the direction of transcription. a) The HIS4 gene in the Y55 3569 strain contains a silent mutation that destroys a HhaI restriction site (C to G change at position 1605 downstream of the start codon). The mutated HIS4 in the Y55 2830 strain (his4-ATC) is a G to C change at the third base pair of the start codon. The small black arrow represents the position of the DSB at HIS4, approximately 300 bp downstream of the start of the ORF. The cassettes natMX4 (NAT) and hphMX4 (HYG) were inserted into the Y55 2830 strain, adding an interval flanking HIS4 (Hoffmann et al., 2005). The LEU2 locus in the Y55 3569 strain contains a specific mutation at the EcoRI restriction site at position 637, which disrupts the gene function. b) The MET13 locus in Y55 3569 has a C to A mutation at position 278. The TRP5 gene in Y55 2830 has a single A to T change at position 2039. cyh2 in Y55 2830 is an uncharacterised mutation. Adapted from (Hoffmann et al., 2005), (Abdullah, 2002) and (Abdullah et al., 2004) not drawn to scale.
trp5 cyh2R MET13
TRP5 CYH2 met13
b)
a)
ATC
leu2 BIK1 RNQ1 FUS1 RRP7 STE50
NAT R
RRP7 his4 BIK1
DSB
STE50 RNQ1 FUS1 LEU2
HYG R
HIS4

63
and a hygromicin B resistance cassette (hphMX4; or HYG) 3804 bp downstream of HIS4
(Hoffmann et al., 2005). Other intervals included HYG-LEU2 and LEU2-MAT on
chromosome III and MET13-CYH2 and CYH2-TRP5 on chromosome VII (Figure 2.1).
Dissected tetrads were replicated to various synthetic ‘drop-out’ or drug-containing
media followed by overnight incubation at 30°C. The segregation pattern of
heterozygous markers was then determined from the media, and only tetrads with
four viable spores were used for analysis. The data was entered into a Microsoft Excel
worksheet and analysed using MacTetrad 6.9 software (Greene, 1994). This software
scored the number of normal Mendelian segregation (2:2) and non-Mendelian
segregation (NMS; non-2:2) events at each genetic marker.
The MacTetrad 6.9 software was also used to calculate map distances for each genetic
interval (in centiMorgans; cM) according to the formula of Perkins (1949):
cM = ½ (TT + 6NPD) / (TT + NPD + PD)
TT is the number of tetratypes, NPD is the number of non-parental ditypes and PD is
the number of parental ditypes (Perkins, 1949).
2.2.12 Clamped Homogenous Electric Field (CHEF) Gel and Southern Blot
Analysis
CHEF gel and Southern blot assay were used for further confirmation of double or
triple gene deletions after verification by PCR (Section 2.2.1.1). Double or triple
mutants were generated by crossing two single mutant strains that were previously
mutated by replacing relevant genes with the KanMX4 cassette (Section 2.2.4). These

64
genes were located on different chromosomes allowing the presence of individual
KanMX4 cassettes to be detected.
2.2.12.1 CHEF Gel Analysis
CHEF gels separate the large individual chromosomes by changing the orientation of
the electric field during electrophoresis. For this experiment, DNA was extracted and
prepared in agarose plugs. Yeast cells were cultured overnight in 3 ml YEPD medium at
30°C. Cells were then harvested by centrifugation at 3,000 r.p.m for 5 minutes. The
pellet was then resuspended in 1 ml 50 mM EDTA and centrifuged at 13,000 r.p.m for
30 seconds. The supernatant was discarded before adding a further 200 µl of 50 mM
EDTA. To make the CHEF plugs, 100 µl SCE solution (1 M sorbitol, 0.1 M sodium citrate,
10 mM EDTA, 10 mg/ml zymolyase and 5% (w/v) β-mercaptoethanol) was added to the
cells, followed by 0.5 ml low melting point (LMP) agarose (prepared by melting 1%
(w/v) Seakem LMP agarose [Cambrex Bio Science] in 0.125 M EDTA).
The mixture was then pipetted immediately into plug formers (Bio-Rad) that were
placed on ice. Once set, the CHEF plugs were transferred into sterile Eppendorf tubes,
and 0.5 ml EDTA solution (0.5 M EDTA, 1 M Tris-HCl pH 8 and 5% (w/v) β-
mercaptoethanol) was then added. The CHEF plugs were subsequently incubated at
37°C for a minimum of 4 hours. The EDTA solution was then removed before adding
0.5 ml proteinase K solution (1 mg/ml proteinase K, 0.5 M EDTA, 1% (w/v) sodium
sarkosyl and 0.1 mg/ml RNAse) to the plugs and incubating for a further 6 hours at
37°C. The proteinase K solution was then discarded and 1x TE buffer (0.1 M Tris-HCl pH
8 and 1 mM EDTA) was used to wash the plugs by incubating for one hour at room
temperature. The plugs were stored in 1 ml Tris/EDTA solution (0.5 M EDTA and 0.1 M

65
Tris-HCl pH 8) at 4°C. For running the CHEF gel, approximately one third of the CHEF
plug was loaded into the well of 1% agarose gel (prepared by dissolving LE agarose
powder in 0.5 x TBE running buffer). The running buffer was cooled to 14°C before
running the CHEF gel for 24 hours at 6 volts/cm with a reorientation angle of 120°. The
program that was used to separate the chromosomes is as follows:
Stage 1: Initial Switch Time: 60 seconds Final Switch Time: 60 seconds Run Time: 15 hours
Stage 2: Initial Switch Time: 90 seconds Final Switch Time: 90 seconds Run Time: 9 hours Pump speed: 80
For staining, the CHEF gel was submerged in 0.5x TBE running buffer with 0.5 µg/ml
ethidium bromide added and gently agitated for 20 minutes. Visualisation of the gel
was done under UV light as described in Section 2.2.2.
2.2.12.2 Southern Blot Hybridisation
2.2.12.2.1 DNA Transfer and Fixation
Subsequent to visualisation, the CHEF gel was then immersed in denaturing solution
(0.5 M NaOH and 1 M NaCl) for 30 minutes with gentle shaking at room temperature,
then washed with neutralising solution (0.5 M Tris-HCl pH 7.5 and 3 M NaCl) for 30
minutes, followed by 20 x SSC buffer (3 M NaCl, 0.3 M sodium citrate) for 10 minutes.
The DNA was transferred to a positively charged nylon membrane (Roche) using an
upward capillary system. The gel was placed on a wick of Whatman 3MM paper on top
of a tray filled with 20 x SSC buffer, followed by the membrane, another Whatman
paper, a stack of paper towels and a weight to apply pressure. DNA was left to transfer

66
overnight. Afterward, the DNA was fixed to the membrane by UV cross-linking at
120 mJ/cm2.
2.2.12.2.2 DNA Probe Labelling
The DNA probe was prepared by PCR-amplifying the KanMX4 gene from the pFa6-
KanMX4 plasmid (Table 2.2) using a DIG Probe Synthesis Kit (Roche). The PCR reaction
was carried out according to the manufacturer’s guidelines. Verification of the labelled
probe was performed by comparing its size with the unlabelled KanMX4 DNA using
agarose gel (1% w/v) electrophoresis (Section 2.2.2).
2.2.12.2.3 Hybridisation
Following DNA fixation, the membrane was placed in a glass cylinder and incubated
with 10 ml DIG Easy Hyb (Roche) at 42°C for 30 minutes with gentle agitation. Prior to
membrane hybridisation, 50 µl distilled water was added to the labelled probe, and
heated at 95°C for 5 minutes to denature the DNA before quickly chilling on ice. Fresh
hybridisation solution (3.5 ml DIG Easy Hyb) with the 100 µl DNA probe, was then
added to the membrane immediately and left to incubate overnight at 42°C with
continuous rotation.
After hybridisation, the membrane was twice washed with 200 ml low stringency
buffer (2x SSC, 0.1% SDS) for 5 minutes with gentle rotation at room temperature. The
membrane was then washed twice with 200 ml preheated high stringency buffer (0.5x
SSC, 0.1% SDS) for 15 minutes at 60°C. The membrane was then transferred into a
plastic tray containing 100 ml washing buffer (0.1 M maleic acid, 0.15 M NaCl pH 7.5
and 0.3% (w/v) Tween 20) and incubated for 2 minutes at room temperature with
gentle shaking. The washing buffer was then discarded, and the membrane was

67
incubated in 100 ml blocking solution (1 g Roche blocking reagent dissolved in 100 ml
maleic acid buffer containing 0.1 M maleic acid and 0.15 M NaCl pH7.5) for 30 minutes.
This was followed by incubation of the membrane in 20 ml antibody solution (75
mU/ml anti-digoxigenin-AP diluted 1:10,000 in blocking solution) at room temperature
for 30 minutes. The membrane was then washed twice with 100 ml washing buffer for
15 minutes at room temperature. The washing buffer was then discarded. This was
followed by adding 20 ml detection buffer (0.1 M Tris-HCl and 0.1 M NaCl pH 9.5) to
the membrane for 3 minutes at room temperature. The membrane was then covered
with 0.25 mM CSPD (Roche) diluted 1:100 in detection buffer and left in a cling film for
5 minutes at room temperature, followed by 10 minutes incubation at 37°C to increase
the luminescence reaction. The membrane was exposed to an X-ray film (Fujifilm) for
one hour before the film was being processed and visualised.
2.2.13 Statistical Analysis
The G-test of homogeneity (Sokal and Rohlf, 1969), an equivalent to the chi-squared
(2) test for goodness of fit was used in this study to determine any significant
differences between datasets. In this study, a P-value of less than 0.05 was considered
to reject the null hypothesis, hence the difference between data was said to be
statistically significant. For comparison of multiple datasets, the P-value considered
significant was corrected according to the number of datasets being analysed using the
Benjamini-Hochberg false discovery rate (Benjamini and Hochberg, 1995). Corrections
were made to minimise the chance of type I errors (false rejection of the null
hypothesis even when it is true). The Benjamini-Hochberg multiple testing in a given
comparison was carried out by first ranking the P-values of each sample from smallest

68
to largest. Except for the largest P-value, all other P-values were then corrected using
the formula below (N is the total number of samples in a specific comparison and is
divided by the rank of the sample to be corrected):
Corrected P-value = P-value x (N / N-1)

69
Chapter 3 : Modulating Metabolic Intermediates (AICAR/SAICAR) in the
Purine and Histidine Biosynthetic Pathways
3.1 Introduction
3.1.1 Regulation of the de novo Purine Biosynthesis Pathway
The regulation of both Bas1/2p activity and the purine biosynthesis pathway are
interrelated. Bas1/2p plays a major role as a transcriptional activator of ADE1, ADE2,
ADE4, ADE5,7, ADE6, ADE8, ADE12, ADE13 and ADE17 genes from the purine
biosynthesis pathway (Figure 3.1) (Daignan-Fornier and Fink, 1992). In addition,
Bas1/2p also regulate the expression of HIS1, HIS4 and HIS7 genes in the histidine
biosynthesis pathway (Arndt et al., 1987, Denis et al., 1998, Springer et al., 1996) and
SHM2, GLN1 and MTD1 genes from the glycine, glutamate and 10-
formyltetrahydrofolate (10-formyl THF) synthesis pathways respectively (Denis and
Daignan-Fornier, 1998).
Moreover, these Bas1/2p-regulated pathways are interconnected (Figure 3.1). The
production of one molecule of ATP from the purine biosynthesis pathway consumes
two molecules of glutamine, two molecules of 10-formyl THF and one molecule of
glycine supplied from one carbon metabolism. ATP is also utilised in the histidine
biosynthesis pathway for the production of phosphoribosyl-ATP. In fact, a purine
metabolite AICAR is also synthesised via the histidine biosynthesis pathway as a by-
product of the metabolism of phosphoribosylformimino AICAR phosphate (Rebora et
al., 2005).

70
ATP HIS1
10-HCO-THF
THF
THF
THF
5,10-CH2-THF
5,10-CH2-THF
5,10-CH-THF 10-HCO-THF
5,10-CH-THF 10-HCO-THF
serine
glycine
serine
glycine
SHM2
SHM1
THF
NH4 + CO2
MIS3 MIS3
ADE3 ADE3
formate
formate
MIS3
ADE3
MTD1
PR-ATP PR-AMP PR-formimino AICAR-P
PR-formimino AICAR-P
Imidazole-glycerol-P
Imidazole-acetol-P
histidinol-P
histidinol
histidine
HIS4 HIS4 HIS6 HIS7 HIS3
HIS5
HIS2
HIS4
ADE13
ADE16
ADE17
PRPP GAR FGAR PRA FGA
M
AIR CAIR SAICAR
AICAR
FAICAR
IMP
AS
AMP ADP
ATP
ADE5 ADE8 ADE6 ADE7 ADE2 ADE1
ADE16
ADE17
ADE12
ADE13
ADE4
glutamine
glutamate
THF 5,10-CH-THF
GLN1 GLN1
glutamine
glutamate

71
Figure 3.1 : Schematic representation of the connection between the purine biosynthesis, histidine biosynthesis and one carbon metabolism
pathways. The purine biosynthesis pathway is highlighted in blue while the histidine biosynthesis pathway is depicted in purple. The red lines
represent feedback inhibition of PRPP amidotransferase, the first enzyme of the purine biosynthesis pathway encoded by ADE4, by ADP and
ATP. Several co-substrates from one carbon metabolism are supplied to the purine pathway. Genes encoding enzymes are italicised. Genes
regulated by Bas1p and Bas2p are highlighted in red.
PRPP, 5-phosphoribosyl diphosphate; PRA, 5-phosphorybosylamine; GAR, 5-phosphoribosylglycinamide; FGAR, 5-phosphoribosyl-N-
formylglycinamide; FGAM, 5-phosphoribosyl-N-formylglycinamidine; AIR, 1-(5-phosphoribosyl)-5-aminoimidazole; CAIR, 1-(5-
phosphoribosyl)-5-aminoimidazole-4-carboxylate; SAICAR, 1-(5-phosphoribosyl)-4-(N-succinocarboxyamido)-5-aminoimidazole; AICAR, 5-
amino-1-(5-phosphoribosyl)-imidazole-4-carboxyamide; FAICAR, 5-formamido-1-(5-phosphoribosyl)-imidazole-4-carboxyamide; IMP, inosine
5-monophosphate; AS, adenylosuccinate; THF, tetrahydrofolate; 10-HCO-THF, 10-formyl tetrahydrofolate; PR, 5-phosphoribosyl; P, Phosphate.
Adapted from Mieckowski et al. (2006), Denis and Daignan-Fornier (1998) and Cotton (2007).
72
Studies to date have characterised factors controlling the ability of Bas1/2p to activate
transcription of genes under their regulation. Under normal rich growth conditions,
Bas1/2p were shown to regulate the basal expression of many of their target genes
(Daignan-Fornier and Fink, 1992). Under starvation for adenine, expression of these genes
was up-regulated in a manner dependent on Bas1/2p (Daignan-Fornier and Fink, 1992,
Arndt et al., 1987, Springer et al., 1996, Denis et al., 1998).
Two intermediates from the purine biosynthesis pathway, AICAR and SAICAR have been
found to be essential to promote the expression of Bas1/2p target genes (Figure 3.1)
(Rebora et al., 2001, Rebora et al., 2005, Pinson et al., 2009). This was demonstrated by
studies that monitored the expression of the ADE1-lacZ and ADE17-lacZ fusion constructs
in strains bearing various mutations impairing different steps of the pathway (Rebora et
al., 2001, Rebora et al., 2005). Mutation of any of the genes involved in the steps
preceding AICAR synthesis led to the loss of expression of ADE1-lacZ and ADE17-lacZ
fusions, even when the cells were starved for adenine (Figure 3.1) (Rebora et al., 2001,
Rebora et al., 2005). In contrast, inactivation of genes downstream of AICAR and SAICAR
production, including the functionally redundant ADE16 and ADE17 genes (Figure 3.1),
resulted in increased expression of ADE1-lacZ and ADE17-lacZ fusions (Rebora et al.,
2001). Furthermore, it has been demonstrated that mutation of the ADE16 and ADE17
genes led to the accumulation of both AICAR and SAICAR to the concentration of 1.6 mM
and 0.3 mM respectively, whilst it was below the level of detection in the wild type (< 10
µM) (Pinson et al., 2009). Therefore, these findings indicate that AICAR and SAICAR are
important for the activation of the purine regulon genes.

73
The influence of AICAR/SAICAR and extracellular adenine upon transcription of Bas1/2p-
target genes is related to a feedback mechanism of the purine biosynthesis pathway. The
pathway is negatively regulated as its end-products, ADP and ATP, inhibit the activity of
the first enzyme, PRPP amidotransferase encoded by ADE4 (Figure 3.1) (Rebora et al.,
2001). In cells supplemented with adenine, ADP and ATP are continuously present, leading
to the inhibition of Ade4p activity (Rebora et al., 2001). This inhibition results in reduced
synthesis of AICAR/SAICAR, which leads to the lack of Bas1/2p activation. Consequently,
transcription of the ADE regulon genes is reduced, decreasing adenine synthesis.
When cells are starved for extracellular adenine, Ade4p is activated and the production of
AICAR/SAICAR increased (Rebora et al., 2001). This stimulates Bas1/2p to promote
transcription of their target genes, thus activating purine biosynthesis and increasing the
production of adenine. Therefore, the synthesis of the purine biosynthetic intermediates
is maintained by this feedback loop of the purine biosynthesis pathway.
3.1.2 AICAR/SAICAR Accumulation and Adenine Starvation Promote Transcription
of HIS4 via Bas1p and Bas2p Interaction and Binding Activity
It has been shown that increased transcription of Bas1/2p-regulated genes, in response to
adenine starvation, does not require a high expression level of either BAS1 or BAS2 (Tice-
Baldwin et al., 1989, Daignan-Fornier and Fink, 1992). Instead, several studies suggested
that adenine starvation and AICAR/SAICAR accumulation stimulate transcription of
Bas1/2p target genes by inducing physical interaction between Bas1p and Bas2p and their
binding to gene promoters (Zhang et al., 1997, Pinson et al., 2000, Pinson et al., 2009).

74
This was initially suggested by Zhang et al. (1997) using an assay that monitored the ability
of LexA-Bas1p (Bas1p fused to the DNA binding domain of the bacterial LexAp) to activate
the transcription of the lexAop-lacZ reporter (a bacterial lacZ reporter containing a lexA
operator sites upstream of the TATA box) in the presence and absence of adenine. They
found that the lexAop-lacZ reporter was activated by LexA-Bas1p only when the native
Bas2p was present, and reporter activation was inhibited when adenine was added to the
medium (Zhang et al., 1997). In addition, LexA-Bas1p could also promote activation of the
lexAop-lacZ reporter in conjuction with Bas2p even when the DNA binding ability of Bas2p
was abolished (Zhang et al., 1997). This suggests that Bas2p is recruited to the promoter
by interacting with LexA-Bas1p.
Furthermore, Pinson et al. (2000) demonstrated that a covalent fusion between Bas1p and
Bas2p led to transcriptional activation of the ADE regulon even in the presence of
adenine, similar to the level seen under starvation for adenine. This confirmed that
interaction between Bas1p and Bas2p is essential to activate expression of the ADE genes
in response to the absence of external adenine.
In another assay based on the two-hybrid method, AICAR/SAICAR accumulation was also
demonstrated to promote the interaction of Bas1p and Bas2p (Pinson et al., 2009).
Specifically, LexA-Bas1p strongly stimulated the transcription of the lexAop-lacZ reporter
in strains that accumulated AICAR/SAICAR compared to wild type, in a Bas2p-dependent
manner. Similarly, a LexA-Bas2p fusion also activated the lexAop-lacZ reporter when
AICAR/SAICAR was accumulated, but only when Bas1p was present (Pinson et al., 2009).
These observations indicate that complex formation between the two factors is necessary

75
for the transcriptional regulation of their target genes in response to adenine starvation
and AICAR/SAICAR accumulation.
A model for Bas1/2p-mediated activation of the ADE genes and HIS4, in response to
adenine deprivation, has been proposed (Figure 3.2). This model involved unmasking of
the trans-activation domain of Bas1p upon interaction with Bas2p, and is based primarily
on findings from two-hybrid experiments (Zhang et al., 1997, Pinson et al., 2000, Som et
al., 2005). Truncation of the amino- and carboxy- termini flanking a central region of LexA-
Bas1p led to the activation of the lexAop-lacZ reporter, independently of Bas2p and
adenine availability (Zhang et al., 1997). This suggests that the activation domain of Bas1p
is located in the central region.
From the truncation experiment, another region between residues 630 and 664 in Bas1p
termed BIRD (Bas1p Interaction and Regulatory Domain), was shown to inhibit the Bas1p
trans-activation domain, and is critical for the interaction with Bas2p (Pinson et al., 2000).
When Bas2p was absent, inclusion of the BIRD region adjacent to the trans-activation
domain of Bas1p led to loss of activation of the ADE1-lacZ, ADE17-lacZ and HIS4-lacZ
reporters (Pinson et al., 2000). These reporters were only activated under adenine
deprivation and in the presence of Bas2p. However, when adenine was supplemented in
the media and Bas2p was present, HIS4-lacZ activity was significantly elevated upon
inclusion of the BIRD region, while only basal activity was seen in ADE1-lacZ and ADE17-
lacZ (Pinson et al., 2000). Therefore, it has been suggested that BIRD has an additional
effect as the transcriptional activator at the HIS4 promoter when adenine is present. This
also suggests that the BIRD domain acts in a promoter-dependent manner.

76
Figure 3.2 : Model of the promoter-specific regulation of Bas1p and Bas2p interaction in response to adenine. The presence and absence of adenine is indicated by + and – respectively. Adapted from Pinson et al., (2000), Som et al., (2005) and Cotton (2007). A) ADE1 : In the presence of adenine, only Bas1p binds to the promoter while Bas2p is not recruited. The trans-activation domains are masked, resulting in repressed activity. In the absence of adenine, interaction between Bas1p and Bas2p is stimulated. Trans-activation domain of Bas1p is exposed, inducing high expression. B) HIS4 : In the presence of adenine, low level of interaction and binding of Bas1/2p to the promoter. Though the trans-activation domain of Bas1p is still masked by BIRD, the binding of both proteins resulted in high basal expression. In the absence of adenine, fuller interaction between Bas1p and Bas2p is stimulated, exposing the trans-activation domain of Bas1p, hence increasing expression.
+ Adenine
A
- Adenine
- Adenine + Adenine
B
No expression
ADE
1
Bas2
p
Bas1
p
Bas1
p
Bas2
p
Increased
expression
ADE
1
Trans-activation
Domain
Bas1p Interaction
and Regulatory
Domain (BIRD)
Bas1
p
Bas2
p
Increased expression
HIS4 Bas1
p
Bas2
p
Basal expression
HIS4

77
It has been proposed that BIRD acts as an internal repressor that functionally blocks the
central activation domain of Bas1p under normal conditions when adenine is present
(Figure 3.2) (Pinson et al., 2000). At the ADE gene promoters, Bas1p binds constitutively in
a conformation where its trans-activation domain is masked unless it interacts with Bas2p
(Som et al., 2005). Bas2p binds poorly to the ADE gene promoters in the presence of
adenine, resulting in basal transcription of the ADE genes (Figure 3.2A) (Pinson et al.,
2000, Som et al., 2005). In contrast, neither Bas1p nor Bas2p alone can bind efficiently
upstream of HIS4 (Figure 3.2B) (Pinson et al., 2000). However, BIRD plays an additional
role at the HIS4 promoter by activating interaction and cooperative binding of Bas1/2p in
the presence of adenine, promoting a high basal expression of HIS4 (Pinson et al., 2000).
In the absence of adenine, interaction between Bas1p and Bas2p is promoted, leading to a
conformational change of Bas1p that exposes its trans-activation domain (Zhang et al.,
1997). This increases the binding of Bas1/2p to the ADE genes and HIS4 promoter, hence
up-regulating gene expression (Som et al., 2005).
As stated before, AICAR is also generated from the histidine biosynthesis pathway. It has
been shown that AICAR from this pathway is insufficient to produce enough adenine
required for cells to grow in the absence of extracellular adenine (Rebora et al., 2005).
Apart from interaction between Bas1p and Bas2p, AICAR accumulation can also promote
Bas2p and Pho4p interaction, as well as activating expression of genes in the phosphate
utilisation pathway (Pinson et al., 2009). This suggests that the purine biosynthesis
pathway and phosphate consumption are co-regulated, in addition to the histidine
biosynthesis pathway and one carbon metabolism (Pinson et al., 2009). Since the

78
regulation of the phosphate regulon by Bas2p/Pho4p is independent of Bas1p, it has been
proposed that Bas2p plays the main role in mediating the AICAR response (Pinson et al.,
2009). This hypothesis was further confirmed by the observation that AICAR can interact
directly with Bas2p and Pho4p in vitro (Pinson et al., 2009), although how AICAR can
promote interaction between Bas1p and Bas2p is not yet well understood (discussed in
Section 3.4.1).
Bas1p and Bas2p are also required for recombination at HIS4 (White et al., 1993, Fan et
al., 1995). Mutation of bas1 and/or bas2, or the DNA binding site of Bas1p and Bas2p
significantly reduced recombination at HIS4 (White et al., 1993, White et al., 1991).
However, HIS4 transcription and recombination activities are not directly correlated to
one another (White et al., 1992). A genome-wide analysis by Mieckzkowski et al. (2006)
showed that the rate of recombination at nine of the Bas1p-bound loci was reduced by
BAS1 deletion. Only six of these genes are known to be transcriptionally regulated by
Bas1p (Mieczkowski et al., 2006). This indicates possible differences in the regulatory
properties of Bas1/2p on the transcription and recombination activity at some loci.
Although extensive research has been performed to study the influence of AICAR/SAICAR
from the purine and histidine biosynthesis pathways on the transcription of HIS4, their
effect on recombination is yet to be elucidated. In this study, we sought to determine if
recombination at HIS4 also responds to AICAR/SAICAR from the purine and histidine
biosynthesis pathways as was observed for the transcription activity.

79
3.1.3 Modulating the Metabolic Phenotypes of the Cell Influences Recombination
Frequency
Mutation of the ADE1 gene from the purine biosynthesis pathway (Figure 3.1) has been
demonstrated to elevate non-Mendelian segregation (NMS) events at HIS4 (Abdullah and
Borts, 2001). At the time of the study by Abdullah and Borts (2001), the ade1 mutant
(ade1-1) was presumed to be null based on the adenine auxotrophy displayed by the
strain. In particular, the ade1 mutant appeared red in colour due to the production of a
pigment from the polymerisation of 1-(5-phosphoribosyl)-5-aminoimidazole (AIR)
(Myasnikov et al., 1991). Cells with an ade1 mutation would inhibit the conversion of AIR
into subsequent intermediates, hence accumulate AIR and exhibit red appearance (Figure
3.1). At that time, it was also thought that adenine had a direct inhibitory effect on the
interaction between Bas1p and Bas2p (Rolfes et al., 1997). Therefore, it was hypothesised
that the stimulation of HIS4 recombination in the ade1 mutant was due to the activation
of Bas1/2p in the absence of intracellular adenine (Abdullah and Borts, 2001).
Furthermore, deprivation of extracellular adenine was also known to activate
transcription of HIS4 via Bas1/2p (Daignan-Fornier and Fink, 1992, Rolfes and Hinnebusch,
1993). However, as described in the previous section, subsequent studies revealed that
AICAR/SAICAR is essential to induce interaction between Bas1p and Bas2p (Rebora et al.,
2001, Rebora et al., 2005). Since ADE1 is involved in the step prior to AICAR/SAICAR
production (Figure 3.1), mutating ADE1 should obstruct the production of these
metabolites, hence recombination activity should be reduced.

80
3.1.4 Aims
1. To investigate the effect of an ade1 null mutation on meiotic recombination at
HIS4 in comparison with the ade1-1 mutant.
2. To investigate the association between the levels of AICAR and meiotic
recombination at HIS4. This is to determine if recombination at HIS4 is mediated
by the same regulation that affects transcription.
3. To determine if the effect of AICAR and SAICAR accumulation on meiotic
recombination is dependent on Bas1p.
3.2 Materials and Methods
3.2.1 Production of Double Mutants
Double or triple mutants were generated by crossing two single mutant strains together
and subsequent tetrad dissection. For example, in order to produce an ade16Δ ade17Δ
double mutant, ade16::KanMX4 and ade17::KanMX4 strains were mated on YEPD and
induced to sporulate (Y55 3602 and Y55 3603; Section 2.2.11.1). Following tetrad
dissection, the germinated spores were replicated to G418-200 and the segregation
pattern of KanMX4 was scored. Since ade16::KanMX4 and ade17::KanMX4 are located on
different chromosomes (chromosome XII and XIII respectively), the deletions were either
transmitted together or separately into the meiotic products. Consequently, the
segregation patterns of tetrad will mainly be 3:1 and occasionally 2:2 or 4:0. The two
KanMX4 resistant spores from a tetrad segregating KanMX4 2:2 were selected as they
should have both disrupted genes. The candidate double mutants were confirmed by PCR

81
or Southern blot hybridisation (Section 2.2.12) before being used in subsequent
experiments. A similar technique was applied for generating other double and triple
mutants in this study.
3.2.2 Assessing HIS4 Gene Conversion in Strains Auxotrophic for Histidine
Strains with an ade16Δ ade17Δ double deletion exhibit auxotrophy for histidine (Tibbetts
and Appling, 2000). Consequently, the segregation of HIS4 (HIS4 / his4-ATC) could not be
evaluated using histidine omission media. To analyse the NMS events at HIS4 in the
ade16Δ ade17Δ deletion, the dissected spore colonies were crossed to a haploid ‘tester
strain’ carrying the his4-ATC allele and wild type ADE16 and ADE17 genes (Table 2.1). The
tester strain also contained a functional HO gene that permits self-diploidisation, and the
arg4 mutation, which is not present in other strains used in this study.
The self-diploidisation tester strain was induced to sporulate, then mated with the ade16Δ
ade17Δ colonies on a YEPD plate and grown overnight. Since the sporulated cells contain
both MATa and MATα, the cells are able to mate with all spore colonies in the tetrad. The
following day, these mated cells were replicated to a synthetic minimal medium
supplemented with appropriate nutrients and grown overnight at 30°C. Only diploids that
have a functional copy of HIS4 were able to grow on the minimal medium while the ones
carrying the his4-ATC allele did not grow. Therefore the segregation pattern of the HIS4
marker in a tetrad can be observed and the frequency of NMS recorded. The same
technique was used to analyse HIS4 gene conversion in the his1Δ strain.
82
3.3 Results
3.3.1 Verification of Double and Triple Mutations
Southern blot hybridisation and CHEF gels were used to verify strains with multiple
mutations including pCLB2-bas1::KanMX6 ade16::KanMX4 ade17::KanMX4 (Y55 3622 and
Y55 3623), his1::KanMX4 ade1::KanMX4 (Y55 3618 and Y55 3619), gcn4::KanMX4
ade1::KanMX4 (Y55 3626 and Y55 3627) and bas1::KanMX4 gcn4::KanMX4 (Y55 3620 and
Y55 3621). The KanMX gene was used to probe the blot. The strains were confirmed by
analysing the size of each band related to the predicted size of the chromosomes (Figure
3.3). In addition, one of the parental haploid wild-type strains (Y55 3569) also contains
NatMX and HphMX markers on chromosome III, that share some homology with KanMX.
As expected, an extra band of the size of chromosome III was also detected for the haploid
strains containing these markers (Y55 3621, Y55 3623 and Y55 3627).
3.3.2 The ADE1 Null Mutant Exhibited Wild Type Level of HIS4 Hotspot Activity.
As discussed in the introduction, the ade1-1 point mutation was previously demonstrated
to elevate the level of NMS at HIS4 in the ‘H390 x H330’ (Y55-like) strain background, from
27% in the wild type to 40% (Abdullah and Borts, 2001). However, subsequent findings
relating to the regulation of Bas1/2p suggested that the ade1-1 mutant should not exhibit
increased level of recombination at HIS4 due to the lack of activation of Bas1/2p by
AICAR/SAICAR. A similar increase in NMS was also demonstrated in the Y55 strain
background, from 14.3% in the wild type to 26.7% in the ade1-1 mutant (Table 3.1; P = 6.7
x 10-7, G-test) (Cotton, 2007)

83
Figure 3.3 : Southern blot analysis of the KanMX4 gene on different chromosomes.
Analysis of both haploids from four different mutant strains is shown: gcn4Δ ade1Δ (Y55
3626 and Y55 3627), pCLB2-bas1 ade16Δ ade17Δ (Y55 3622 and Y55 3623), his1Δ ade1Δ
(Y55 3618 and Y55 3619) and bas1Δ gcn4Δ (Y55 3620 and Y55 3621). The genomic
location of each gene is as follows: ADE1, chromosome I; ADE16, chromosome XII; ADE17,
chromosome XIII; BAS1, chromosome XI; GCN4, chromosome V; HIS1, chromosome V.
XIII
XII
XI
V
III
I
Chromosome Number
IV
VII/XV
Strains 3627
bas1Δ
gcn4Δ
pCLB2-bas1 ade16Δade17Δ
his1Δ
ade1Δ
bas1Δ
gcn4Δ
3626
gcn4Δ
ade1Δ
3622
3623
3618
3620
2830
3621
WT
XIII
II
XIV
X
IX
VI

84
Therefore, in order to test the effect of an ade1 complete deletion on recombination, the
function of ADE1 was completely obliterated by replacing the whole open reading frame
of the gene with the KanMX4 cassette (Section 2.2.4). The ADE1 null mutant (ade1Δ)
exhibited a 2.4-fold lower level of NMS (11.1%) as compared to the ade1-1 point mutant
(Table 3.1). Furthermore, the level of NMS in ade1Δ was not significantly different to the
wild type (12.9%). This is more consistent with the model of how purine biosynthesis
influences HIS4 transcription than the data from the ade1-1 mutant (discussed in Section
3.4.1).
3.3.3 Deletion of ade16 and ade17 Increases Recombination Activity at HIS4
Given that AICAR/SAICAR is predicted to affect NMS at HIS4 via Bas1/2p, we wanted to
investigate if accumulation of the metabolites could increase the level of NMS. To
investigate this, we disrupted the genes involved downstream of AICAR and SAICAR
production in the purine biosynthesis pathway (Figure 3.1). ADE16 and ADE17 genes are
functionally redundant, encoding AICAR transformylase and IMP cyclohydrolase isozymes
that catalyse the conversion of AICAR to IMP (Tibbetts and Appling, 1997). Deletion of
both genes is needed to inhibit progression of the biosynthetic pathway and consequently
accumulate AICAR and SAICAR. Therefore, we created an ade16Δ ade17Δ double mutant
(Section 3.2.1) and analysed the level of NMS at HIS4. The data revealed a highly
significant 4-fold increase of NMS events at HIS4 in the ade16Δ ade17Δ double mutant
(53%) compared to that in the wild type Ade+ strain (12.9%; P = 2.69 x 10⁻³⁵) (Table 3.1).

85
Table 3.1 : The level of NMS at HIS4 in different ADE gene mutations
Strain Genotype NMS§ Total Tetrads % NMS at HIS4
Wild type (ADE) 50 388 12.9
ade1Δ 28 252 11.1
ade1-1* 113 423 26.7‡
ade16Δ ade17Δ 221 417 53.0‡
§NMS is non-Mendelian Segregation events that include gene conversion and post-meiotic
segregation. The percentage of NMS (%) was calculated as the number of NMS events /
total tetrads x 100. *The ade1-1 data was taken from Cotton (2007). ‡Represents data that
is significantly different compared to the corresponding wild type. The G-test of
homogeneity was used for the comparison.

86
3.3.4 Deletion of ade16 and ade17 Increases Crossing Over at the NAT-HYG
Interval
We also monitored the effect of deletions of the ADE1Δ and ADE16Δ ADE17Δ genes from
the purine biosynthesis pathways on reciprocal crossing over at five different intervals on
chromosomes III and VII. This included the NAT-HYG interval, which flanks HIS4 (Figure
2.1). No significant increase in crossing over was seen in the ade1Δ strain at NAT-HYG and
the adjacent HYG-LEU2 region compared to the wild type (Table 3.2, P = 0.79 and 0.95
respectively). In comparison, the ade1-1 point mutant was shown to significantly increase
crossing over at the NAT-HYG interval compared to the wild type (P = 6.72 x 10⁻⁷). These
data revealed further differences between the complete ade1Δ and the ade1-1 point
mutant strains.
The ade16Δ ade17Δ strain showed a significant elevation in crossover events in the NAT-
HYG interval as compared to the wild type (45.8 cM compared with 11.4 cM respectively;
P = 3.41 x 10-42). This increase was in conjunction with the NMS events at HIS4 in the
ade16Δ ade17Δ strain which presumably accumulates AICAR/SAICAR. These data
demonstrated a correlation between the levels of reciprocal crossing over at the NAT-HYG
interval with HIS4 gene conversion. The neighbouring interval HYG-LEU2 showed a
concomitant 2.3-fold reduction of the map distance compared to the wild-type (4.8 cM
compared with 11.1 cM respectively; P = 2.94 x 10⁻⁵) (discussed in Section 7.8). Crossing
over was also analysed at three other intervals that were not expected to be affected by
the ADE gene mutations, LEU2-MAT, MET13-CYH and CYH-TRP (Table 3.3). No statistically

87
Table 3.2 : Map distances in different genetic intervals on chromosome III in strains with different ADE gene mutations
Strain Genotype Genetic intervals
NAT – HYG HYG – LEU2 LEU2 – MAT
PD NPD TT cM§ PD NPD TT cM PD NPD TT cM
Wild type (ADE) 307 3 68 11.4 305 2 72 11.1 162 15 205 38.6
ade1Δ 194 3 47 13.3 195 1 48 11.1 124 5 116 29.8
ade1-1* 273 5 130 19.6‡ 362 0 45 5.5‡ 186 9 208 32.5
ade16Δ ade17Δ 140 21 253 45.8‡ 380 1 34 4.8‡ 199 10 206 32.0
*The ade1-1 data was taken from Cotton (2007). §Map distances were calculated in centiMorgan (cM) according to Perkins (1949). PD is
parental ditype, NPD is non-parental ditype and TT is tetratype. ‡Represent values that are significantly different compared to the
corresponding wild type. G-test of homogeneity was used for comparing the distributions of PD, NPD and TT between different samples.

88
Table 3.3 : Map distances in different genetic intervals on chromosome VII in strains with different ADE gene mutations
Strain Genotype Genetic intervals
MET13-CYH2 CYH2-TRP5
PD NPD TT cM§ PD NPD TT cM
Wild type (ADE) 233 1 125 18.2 85 24 273 54.6
ade1Δ 146 1 83 19.3 70 14 166 50.0
ade1-1* 300 1 118 14.8 84 44 289 66.3
ade16Δ ade17Δ 241 3 142 20.7 92 25 291 54.0
*The ade1-1 data was taken from Cotton (2007). §Map distances were calculated in centiMorgan (cM) according to Perkins (1949). PD is
parental ditype, NPD is non-parental ditype and TT is tetratype.

89
significant difference was observed between crossing over at these intervals in all strains
and conditions tested in this section and in the following chapters unless otherwise
stated.
3.3.5 The Effect of Deletion of HIS1 from the Histidine Biosynthesis Pathway upon
Recombination at HIS4
In addition to the purine biosynthetic pathway, AICAR is also generated from histidine
biosynthesis as a byproduct of HIS7 (Figure 3.1). We then deleted the HIS1 gene, which is
involved in the first step of the histidine biosynthesis pathway, to determine if the level of
recombination at HIS4 can be affected by blocking the production of AICAR from this
pathway (Figure 3.1). As mutating the gene results in auxotrophy for histidine, NMS
events at HIS4 were analysed by mating dissected spores with a his4-ATC tester strain
(Section 3.2.2). There was no significant difference in the level of NMS between his1Δ and
the wild type strains (14.4% and 12.9% respectively; Table 3.4). Furthermore, no
significant effect was detected upon crossing over at the NAT-HYG interval as compared to
the wild type (Table 3.5). This suggests that mutating the HIS1 gene, which should prevent
AICAR production from the histidine biosynthesis pathway, did not appear to affect the
level of recombination at HIS4.
Next, we analysed recombination at HIS4 in a his1Δ ade1Δ double mutant to determine if
the level of recombination could be further reduced by blocking AICAR synthesis from
both adenine and histidine biosynthesis pathways. We discovered that the his1Δ ade1Δ
double deletion did not affect the level of NMS at HIS4 and crossing over at NAT-HYG
more severely than either single mutant (Table 3.4 and Table 3.5).

90
Table 3.4 : The levels of NMS at HIS4 in the his1Δ, ade1Δ and his1Δ ade1Δ strains
Strain Genotype NMS Total % NMS at HIS4
Wild type (HIS1 ADE1) 50 388 12.9
his1Δ 61 423 14.4
his1Δ ade1Δ 25 287 8.7
ade1Δ 28 252 11.1
*There was no statistically significant difference in the levels of NMS between all strains
tested.

91
Table 3.5 : Map distances in different genetic intervals on chromosome III in the his1Δ and his1Δ ade1Δ strains
Strain Genotype Genetic intervals
NAT – HYG HYG – LEU2 LEU2 – MAT
PD NPD TT cM§ PD NPD TT cM PD NPD TT cM
Wild type (HIS1 ADE1) 307 3 68 11.4 305 2 72 11.1 162 15 205 38.6
his1Δ 342 2 72 10.1 345 1 65 8.6 175 11 228 35.5
his1Δ ade1Δ 232 0 44 8.0 224 0 57 10.1 141 8 133 32.1
ade1Δ 194 3 47 13.3 195 1 48 11.1 124 5 116 29.8
§Map distances were calculated in centiMorgan (cM) according to Perkins (1949). PD is parental ditype, NPD is non-parental ditype and TT is
tetratype. There was no statistical significance difference between the map distances at NAT-HYG, HYG-LEU2 and LEU2-MAT between all
strains tested.

92
Table 3.6 : Map distances in different genetic intervals on chromosome VII in the his1Δ and his1Δ ade1Δ strains
Strain Genotype Genetic intervals
MET13-CYH2 CYH2-TRP5
PD NPD TT cM PD NPD TT cM
Wild type (HIS1 ADE1) 233 1 125 18.2 85 24 273 54.6
his1Δ 264 1 129 17.1 92 32 297 58.1
his1Δ ade1Δ 189 1 82 16.2 64 29 192 64.2
ade1Δ 146 1 83 19.3 70 14 166 50.0
*There was no statistically significant difference between the map distances at MET13-CYH2 and CYH2-TRP5 between all strains tested.

93
3.3.6 The Increase in Recombination at HIS4 in ade16Δ ade17Δ is Dependent on
Bas1p
The accumulation of AICAR/SAICAR was previously shown to stimulate transcription of
HIS4 through Bas1/2p activation (Pinson et al., 2009). Here, we examined if the increase in
the NMS events observed at HIS4 in the ade16Δ ade17Δ mutant was also mediated by
Bas1p. To test this hypothesis, we crossed a strain in which BAS1 was under control of the
meiotic-repressed CLB2 promoter (pCLB2-BAS1) with an ade16Δ ade17Δ mutant. As
discussed later in Chapter 5, the insertion of the CLB2 promoter (pCLB2-3HA) at the N-
terminus of Bas1p resulted in a non-functional BAS1 gene. The pCLB2-BAS1 strain
exhibited similar level of NMS events as that of the bas1Δ strain (Table 3.7).
Our data showed that the level of NMS was reduced from 53% in the ade16Δ ade17Δ
strain to 4.6% in the pCLB2-BAS1 ade16Δ ade17Δ strain (Table 3.7; P = 4.39 x 10-40).
Furthermore, the level of NMS in the pCLB2-BAS1 ade16Δ ade17Δ strain was not different
from that of pCLB2-BAS1 or bas1Δ. These results indicate that the increase in the level of
NMS in the ade16Δ ade17Δ strain is dependent on a functional BAS1 gene.
Concomitantly, the occurrence of crossover events in the NAT-HYG region was
significantly lower in the pCLB2-BAS1 ade16Δ ade17Δ strain than in the ade16Δ ade17Δ
strain (P = 4.16 x 10-45) (Table 3.8). In addition, the level of crossing over at NAT-HYG was
significantly reduced in the pCLB2-BAS1 ade16Δ ade17Δ strain compared to the wild type
(P = 0.005).

94
Table 3.7 : Loss of Bas1p activity results in reduced level of NMS at HIS4 in the ade16Δ
ade17Δ strain
Strain Genotype NMS Total % NMS at HIS4
Wild type 50 388 12.9
pCLB2-BAS1 ade16Δ ade17Δ 10 219 4.6‡†
pCLB2-BAS1 8 201 3.9‡†
ade16Δ ade17Δ 221 417 53.0‡
bas1Δ 6 331 1.8‡†
‡Represent data that are significantly different compared to the corresponding wild type. †Represent data that are significantly different compared to the corresponding ade16Δ
ade17Δ strain.

95
Table 3.8 : Map distances in different genetic intervals on chromosome III in bas1 mutant strains
Strain Genotypes Genetic intervals
NAT – HYG HYG – LEU2 LEU2 – MAT
PD NPD TT cM§ PD NPD TT cM PD NPD TT cM
Wild type 307 3 68 11.4 305 2 72 11.1 162 15 205 38.6
pCLB2-bas1 ade16Δ ade17Δ 193 0 21 4.9‡† 158 0 54 12.7† 87 11 118 42.6
pCLB2-bas1 180 0 18 4.5‡† 137 2 52 16.8† 92 2 98 28.6
ade16Δ ade17Δ 140 21 253 45.8‡ 380 1 34 4.8‡ 199 10 206 32.0
bas1Δ 297 0 28 4.3‡† 234 1 81 13.8† 179 10 130 29.8
§Map distances were calculated in centiMorgan (cM) according to Perkins (1949). PD is parental ditype, NPD is non-parental ditype and TT is
tetratype. ‡Represent data that are significantly different compared to the corresponding wild type. †Represent data that are significantly
different compared to the corresponding ade16Δ ade17Δ strain.

96
Table 3.9 : Map distances at different genetic intervals on chromosome VII in bas1 mutant strains
Strain Genotype Genetic intervals
MET13-CYH2 CYH2-TRP5
PD NPD TT cM§ PD NPD TT cM
Wild type 233 1 125 18.2 85 24 273 54.6
pCLB2-bas1 ade16Δ ade17Δ 134 1 66 17.9 56 16 144 55.6
pCLB2-bas1 118 2 67 21.1 39 26 130 73.3
ade16Δ ade17Δ 241 3 142 20.7 92 25 291 54.0
bas1Δ 225 0 88 14.1 67 19 240 54.3
§Map distances were calculated in centiMorgan (cM) according to Perkins (1949). PD is parental ditype, NPD is non-parental ditype and TT is
tetratype.

97
3.4 Discussion
3.4.1 Purine Biosynthetic Intermediate AICAR/SAICAR is Likely Involved in
Activating Bas1/2p-Mediated Recombination at HIS4
We have investigated the effect of mutating ADE16 and ADE17, the purine biosynthetic
genes involved in steps downstream of AICAR and SAICAR production, on recombination
at HIS4. Both gene conversion and crossover events were strongly up-regulated in the
ade16Δ ade17Δ strain (Tables 3.7 and 3.8). Since AICAR and SAICAR have been shown to
accumulate in the deletion of ade16Δ ade17Δ (Pinson et al., 2009), we hypothesised that
increased activity of recombination in the ade16Δ ade17Δ strain is caused by high levels of
AICAR/SAICAR.
The effect of deleting ADE16 and ADE17 genes on recombination correlates with the
transcriptional response of HIS4 to the level of AICAR/SAICAR (Rebora et al., 2001, Rebora
et al., 2005, Pinson et al., 2009). Together with our data, this suggests that the amount of
AICAR and SAICAR could be an important regulator for both transcription and
recombination activity of HIS4. We also demonstrated that loss of Bas1p leads to a
reduction in the level of recombination at HIS4 in the ade16Δ ade17Δ strain (11.5-fold and
9.3-fold reduction respectively). This indicates that Bas1p is necessary for the effects of
ade16 ade17 deletion on recombination at HIS4. Since AICAR/SAICAR has been suggested
to stimulate interaction and binding of Bas1/2p to gene promoters (Section 3.1.2), we
propose that AICAR/SAICAR positively activate recombination at HIS4 by mediating
Bas1/2p activity.

98
Interestingly, the study by Pinson et al. (2009) suggested a difference in the influence of
SAICAR between the transcription of the ADE genes and HIS4 in the ade13-42 mutant. The
gene ADE13 encodes enzyme adenylosuccinate lyase that converts SAICAR to AICAR in the
purine biosynthesis pathway (Figure 3.1). SAICAR was shown to accumulate in the
ade13-42 mutant, while the amount of AICAR was undetectable, presumably due to the
inhibition of AICAR synthesis (Pinson et al., 2009). Although SAICAR accumulation was
shown to induce expression of the ADE genes, the transcript levels of HIS4 appeared to be
reduced in the ade13-42 mutant compared to the wild type (Pinson et al., 2009).
Furthermore, the abundance of HIS4 transcripts in the ade13-42 mutant was comparable
to that seen in a bas1 or bas2 deletion. This suggests that AICAR may be solely responsible
for the induced transcription of HIS4.
Moreover, the binding ability of Bas1/2p also differs at the promoters of the ADE genes
and HIS4 (Section 3.3.2) (Pinson et al., 2000). In particular, Bas1p alone can bind to the
ADE gene promoters, while the interaction between Bas1p and Bas2p is required for
binding upstream of HIS4 (Pinson et al., 2000, Som et al., 2005). Therefore, one possible
model to explain these observations is that the SAICAR-induced interaction of Bas1p and
Bas2p is insufficient to promote the conformation required for Bas1/2p to be recruited to
the HIS4 promoter (Figure 3.4B). In contrast, AICAR may have the ability to promote this
conformational change of Bas1/2p.
Consistent with this, Pinson et al. (2009) demonstrated that the accumulation of AICAR
alone is sufficient to activate the purine regulon. However, in promoters of the ADE gene,
SAICAR alone can promote the Bas1/2p-mediated activation of the genes, perhaps due to

99
the ability of Bas1p to bind constitutively to the DNA (Pinson et al., 2000). If that is the
case, in the ade13-42 mutant, it is possible that Bas2p has better access to promoters of
the ADE gene by interacting with the already bound Bas1p in a manner facilitated by
SAICAR (Figure 3.4A). Based on this model, it is possible that the increased level of
transcription and recombination at HIS4 in the ade16Δ ade17Δ strain is mediated only by
AICAR, and not SAICAR.
What is the mechanism by which AICAR stimulates Bas1/2p-mediated transcription and
recombination at HIS4? Bas2p has been proposed to play a major role in the
transcriptional activation of the purine and phosphate regulons in response to AICAR
(Pinson et al., 2009). This hypothesis is based on findings that AICAR binds Bas2p in vitro
and that the interaction of Bas2p with another partner protein, Pho4p was also stimulated
in response to a high level of AICAR (Section 3.1.2) (Pinson et al., 2009).
Furthermore, accumulation of AICAR has been shown to enhance the occupancy of Bas1p
and Bas2p at the promoter region of the ADE genes (Pinson et al., 2009). This suggests a
direct role of AICAR in promoting the interaction of Bas2p with Bas1p, and therefore could
also facilitate their binding to the HIS4 promoter. Moreover, it is possible that the AICAR-
mediated interaction between Bas1p and Bas2p occurs in the BIRD region of Bas1p
(Section 3.1.2). Consequently, the conformation of Bas1p may be altered to expose its
latent trans-activation domain, leading to the activation of HIS4 transcription (Figure 3.4).
In terms of recombination, accumulation of AICAR leads to an increased binding of
Bas1/2p to the HIS4 promoter, hence stimulating DSB formation in an unknown manner.
Several possibilities are discussed in Chapters 5 and 7.

100
Figure 3.4 : A model for the cooperative activation of Bas1p and Bas2p at the promoter of HIS4 and ADE1 in response to AICAR and/or SAICAR
accumulation. See text for details.
High SAICAR, no AICAR (ade13-42) A
High AICAR & SAICAR (ade16Δ ade17Δ)
High expression High expression
High AICAR & SAICAR (ade16Δ ade17Δ) High SAICAR, no AICAR (ade13-42)
B
ADE
1
Bas1
p
Bas2
p ADE
1
Bas1
p
Bas2
p
Bas2
p
Bas1
p
No expression
HIS4 High expression
Bas1
p
Bas2
p HIS4
Bas1p Interaction
and Regulatory
Domain (BIRD)
Trans-activation
Domain
AICAR
SAICAR

101
3.4.2 AICAR from the Histidine Biosynthesis Pathway may be Insufficient to
Activate Recombination
In this study, we also investigated the contribution of AICAR synthesised from the histidine
biosynthesis pathway upon recombination activity at HIS4. Our data suggest that AICAR
produced from this pathway may be insufficient to activate the HIS4 hotspot activity. This
was indicated by the unchanged level of recombination observed in a his1Δ strain
compared to the wild type and ade1Δ strains. The data is consistent with the
transcriptional study by Rebora et al. (2005), which showed that AICAR produced from the
histidine biosynthesis pathway is insufficient to allow cells to grow in the absence of
adenine. Furthermore, double deletion of his1 and ade1 also caused no significant effect
on recombination as compared to the wild type and ade1Δ strains. Since a his1Δ ade1Δ
deletion should block the production of AICAR from both pathways, this further indicates
that AICAR from the histidine biosynthesis pathway is not enough to promote
recombination.
Interestingly, the levels of recombination in the absence of AICAR from both biosynthesis
pathways (his1Δ ade1Δ strain) are significantly higher than that of the bas1Δ or bas2Δ
strains (bas1Δ in tables 3.8 and 3.9; bas2Δ in tables 6.3 and 6.4). This suggests that Bas1p
and Bas2p are able to interact without AICAR at a certain level that might not be sufficient
to stimulate transcription but enough to stimulate recombination activity. Therefore, an
AICAR-independent mechanism may be present to promote the Bas1/2p-mediated
recombination activity at HIS4.
102
3.4.2 Why does ade1-1 Increases Recombination?
This study demonstrates that the effect of ADE16 ADE17 deletion on HIS4 recombination
is consistent with the current model for AICAR-mediated activation of Bas1/2p.
Specifically, accumulation of AICAR in the ade16Δ ade17Δ strain led to an up-regulation of
HIS4 recombination, in a manner mediated by Bas1/2p. Deletion of ADE1, which should
block the production of AICAR/SAICAR from the purine biosynthesis pathway, has no
effect on the level of recombination at HIS4 compared to the wild type. This may be due
to the low level of recombination in the wild type strain as a result of low amount of
AICAR. Consistent with this, Pinson et al., (2009) demonstrated that the amount of AICAR
in the wild type strain is below the level of detection (< 10 µM). This may be caused by
feedback inhibition of the purine biosynthesis pathway, or that AICAR produced in the
wild type strain may be immediately processed hence not sufficient to promote Bas1/2p-
mediated recombination. Therefore, it remains a possibility that the synthesis of AICAR
from the purine biosynthesis pathway is inhibited in the ade1Δ strain.
The significantly higher level of recombination in the ade1-1 point mutant (Cotton, 2007)
compared to the wild type does not fit with the hypothesis that AICAR positively regulates
Bas1/2p-mediated recombination. The fact that this increased level of recombination at
HIS4 was observed in three different strain backgrounds indicates that this effect is not
strain-specific (Abdullah and Borts, 2001, Keelagher et al., 2010, Cotton, 2007). It was
previously thought that ade1-1 is a leaky mutation and might produce a certain amount of
AICAR that can stimulate Bas1/2p activity (Cotton, 2007). This is because the point
mutation is located towards the end of the ADE1 gene and might not interfere with the

103
Figure 3.6 : Structure of the Ade1 protein (SAICAR synthetase) from two different angles.
The position of the T to C missense mutation in the ade1-1 strain is in the middle of an α-
helix (indicated in small yellow circles), adjacent to putative protein active site. The figure
is a computer-modelled structure using the FirstGlance software at
http://molvis.sdsc.edu/fgij/ and is adapted from the study by Aronson et al. (2009).

104
active site of Ade1p (SAICAR synthetase). Specifically, ade1-1 is a T to C missense
mutation (changes the amino acid leucine to proline) at position 799 of the 921 base
pairs of the ADE1 gene (Abdullah et al., 2004).
However, an analysis of the Ade1 protein structure showed that the point mutation is
located in the middle of an α-helix, adjacent to the putative active site of the protein
(Figure 3.6) (Aronson and Silveira, 2009). Moreover, the amino acid proline contains a
side chain that typically interferes with the conformation of the α-helix, and usually
creates breaks or kinks in the helical structure (Richardson, 1981). Therefore, it is likely
that the point mutant ade1-1 disrupts the active site of Ade1p, hence making the
protein non-functional. Furthermore, the growth phenotypic behaviour shown by
ade1-1 also disagrees with it being a leaky mutation. In particular, both the ade1-1 and
ade1 deletion shared similar adenine auxotrophic characteristics that indicate a
disrupted function of the ADE1 gene (Section 3.1.3). Therefore, this suggests that both
the ade1-1 and ade1Δ null mutants should block the production of AICAR from the
purine biosynthesis pathway.
Nevertheless, it is also possible that the ade1-1 mutant can produce a different form of
AICAR than the one normally synthesised in the wild type. Perhaps the type of AICAR
produced in the ade1-1 strain is unable to be metabolised but function normally to
promote interaction between Bas1p and Bas2p. This may result in accumulation of the
different form of AICAR in the ade1-1 strain, consequently activating recombination at
HIS4.
Apart from that, we cannot rule out the possibility that the Bas1/2p-mediated
recombination activities at HIS4 in the ade16Δ ade17Δ and ade1Δ strains were not

105
mediated by AICAR. It is possible that the physical presence of the Ade1 protein affects
interaction between Bas1p and Bas2p via an unknown response. Alternatively, the
physical alteration of Ade1p that was induced by the ade1-1 point mutation might lead
to a protein conformation that enables interaction with other factors. This could be
other transcription factors such as Gcn4p or Rap1p, which may be able to promote
recombination initiation at HIS4. Another possible explanation is that both the ade1-1
and ade16Δ ade17Δ mutations have something in common that directly or indirectly
stimulates DSB formation, and this feature might not be acquired by the ade1 null
mutant. This could be some unique properties that have the ability to stimulate
Bas1/2p and/or other transcription factors (e.g., Gcn4p and Rap1p).
It would be of interest to determine if the frequency of recombination in the ade1-1
mutant strain would be reduced in the absence of Bas1p and/or Gcn4p. This could be
achieved by analysing recombination in a double mutant of bas1Δ ade1-1 and gcn4Δ
ade1-1. The outcome from this experiment would provide an indication whether
Bas1/2p and Gcn4p are responsible for the increase in recombination at HIS4 in the
ade1-1 strain.

106
Chapter 4 : The Effect of Nutritional Starvation upon Meiotic
Recombination at HIS4
4.1 Introduction
4.1.1 Nutritional Conditions Affecting Meiotic Recombination at HIS4
The influence of the intracellular nutritional environment upon recombination hotspot
activity has been demonstrated in a study by Abdullah and Borts (2001).
Recombination rates were shown to be significantly affected by metabolically altering
the ability of the cell to synthesise adenine and different amino acids; specifically
lysine and leucine. Cells that were unable to synthesise lysine (lys2 genotype) exhibited
the highest level of NMS at the his4-xho allele (96 base pairs from the start codon)
when combined with prototrophy for leucine and adenine (Lys- Leu+ Ade+). In contrast,
cells prototrophic for lysine and an auxotrophic for leucine (leu2 genotype; Lys+ Leu-
Ade+) displayed the lowest level of NMS events.
Furthermore, Abdullah and Borts (2001) demonstrated that an auxotrophy for adenine
results in stimulation of the HIS4 hotspot. This hypothesis is based on the observation
that an ade1-1 mutant allele strongly increases the level of recombination regardless
of the cell’s ability to synthesise leucine or lysine (Abdullah and Borts, 2001). A
similarly increased recombination level at HIS4 in an ade1-1 strain was also reported in
another strain background (Cotton, 2007). The ade1-1 allele exhibits a similar degree
of adenine auxotrophy as the complete ade1 deletion (discussed in Chapter 3) (Cotton,
2007). Since this deletion did not increase the level of HIS4 recombination (Chapter 3),
this suggests that auxotrophy for adenine alone is not sufficient to stimulate
recombination.

107
Abdullah and Borts (2001) also showed that the influence of these metabolic
phenotypes on recombination was mediated by the transcription factor Gcn4p
(Abdullah and Borts, 2001). In particular, deletion of GCN4 in all cells studied reduces
the NMS events to the level of the Lys+ Leu- Ade+ cells, suggesting that this represents
the basal level of recombination that takes place without Gcn4p activation (Abdullah
and Borts, 2001). In contrast, overproduction of Gcn4p results in an approximately 3.7-
fold increase in the level of NMS at HIS4 (Abdullah and Borts, 2001). These intriguing
observations indicate that Gcn4p may be required to activate recombination at HIS4, a
suggestion that contradicts an earlier study by White and colleagues (1992). In the
study by White et al. (1992), it was demonstrated that the level of NMS at HIS4 was
not significantly affected by deletion of GCN4. Since these two experiments were
performed using different strain backgrounds, it is possible that the extent of a Gcn4p
effect is strain-dependent (discussed in Section 4.4.2).
More direct evidence of the nutritional influence on recombination was provided by
Cotton (2007) in which the level of recombination at HIS4 was influenced by altering
the composition of extracellular nutrients, specifically adenine and amino acids. The
continuous deprivation of these nutrients before and during sporulation elevated the
recombination level, compared to cells that were pre-grown and sporulated in
nutrient-supplemented conditions (Cotton, 2007). In particular, the influence of
starvation on recombination was analysed using diploid cells that were freshly mated
and selected on a nutrient-limited growth medium. These diploid cells were then
sporulated on a potassium acetate (KAc) medium that was only supplemented with
nutrients that cells were unable to synthesise (‘minimal’ KAc) (Figure 4.1B). Therefore,

108
these cells were continuously starved for adenine and amino acids even before
sporulation.
Recombination levels were subsequently compared with cells that were sporulated
with complete nutrient supplements (‘complete’ KAc), using diploid cells that were
pre-grown on rich medium (YEPD; Section 2.1.3; Figure 4.1A). Hence, recombination
events were compared between two extreme cases, the continuously starved cells and
the constantly supplemented cells. In this study, we further investigated HIS4 hotspot
activity by using constant pre-meiotic cell preparation techniques, and only varied the
nutrient composition during sporulation. This is to investigate the possibility that only
the different cell conditions prior to meiosis contributed to the apparent effect of
starvation on recombination.
Complete KAc medium differs from minimal KAc by the presence of a nutrient mixture
containing 0.003% (w/v) adenine and 0.008% (w/v) amino acids (Table 2.4, Figure
4.1B). The rich vegetative growth medium, YEPD, differs from synthetic minimal
medium by containing 0.005% (w/v) adenine in addition to yeast extract and peptone
(Section 2.1.3). Since Gcn4p is a transcriptional up-regulator of HIS4 that acts in
response to amino acid and purine starvation, it was hypothesised that the starvation
induced recombination was being promoted via Gcn4p (Cotton, 2007). Gcn4p is also an
essential regulator of various genes involved in overcoming other stress stimuli such as
glucose deprivation and a high salinity growth medium (Hinnebusch and Natarajan,
2002). When triggered by amino acid limitation, Gcn4p is up-regulated via the general
amino acid control system, hence activating transcription of its target genes including
HIS4.

109
4.1.2 Aims
1. To confirm the effect of nutritional starvation on recombination at HIS4.
2. To investigate the role of Gcn4p and Bas1p/Bas2p in the starvation influenced
level of meiotic recombination.
4.2 Materials
4.2.1 Sporulation Media
Cells were sporulated on solid KAc media, which include the complete nutrient-
supplemented KAc and minimal KAc (Section 2.1.3). In addition, a ‘half complete’ KAc
medium was produced with ingredients similar to complete KAc except for the
addition of only half amounts of the nutrient mixture (0.044% (w/v); Table 2.4). For
sporulation on minimal KAc, two populations of cells were used; either ‘selected’
diploids (Section 2.2.11.2) or ‘unselected’ diploids (Figure 4.1). Since diploids that were
pre-selected on minimal medium (‘selected’) were unable to sporulate on minimal
KAc, relevant nutrients were supplemented to the medium. These nutrients include
amino acid and nucleotide that cells were auxotrophic for (0.003% (w/v) uracil and
0.004% (w/v) lysine for the wild type cells).

110
Figure 4.1 : Different methods of sporulation and pre-sporulation used in this study for the wild type strain. The amount of specific nutrients
supplemented in each medium is indicated. A) Sporulation of unselected diploid cells that were vegetatively grown on rich medium (YEPD). The
unselected diploids were able to sporulate on minimal KAc without nutrient supplements. B) Sporulation of diploid cells that were selected on
partially supplemented synthetic minimal medium. Cells selected this way were unable to sporulate on minimal KAc without added
supplements as indicated.
A) ‘Unselected’ / YEPD-grown diploids
B) ‘Selected’ / minimal media -grown diploids
YEPD-grown cells Yeast extract, peptone & 0.005 % (w/v) adenine
Complete KAc 0.003 % (w/v) adenine, 0.003 % (w/v) uracil & 0.008 % (w/v) amino acids
Minimal KAc No supplements
YEPD-grown cells Yeast extract, peptone & 0.005 % (w/v) adenine
Complete KAc 0.003 % (w/v) adenine, 0.003 % (w/v) uracil & 0.008 % (w/v) amino acids
Minimal KAc 0.003 % (w/v) uracil & 0.004 % (w/v) lysine
Minimal-grown cells 0.003 % (w/v) uracil & 0.004 % (w/v) lysine

111
4.3 Results
4.3.1 Nutritional Starvation Increases the Level of NMS at HIS4 in the Wild
Type (Ade+) Strain only in Pre-selected Diploid Cells
As stated in the introduction, it has been demonstrated that recombination activity at
HIS4 was elevated when the wild type cells were sporulated in nutrient-limiting
conditions (Cotton, 2007). In the study by Cotton (2007), recombination events at HIS4
were monitored in cells sporulated on two different media, complete KAc and minimal
KAc (Section 4.2.1). Prior to sporulation on minimal KAc, diploids were selected on
synthetic minimal medium that was supplemented with nutrients that both haploids
were auxotrophic for (0.003% (w/v) uracil and 0.004% (w/v) lysine; Figure 4.1B)
(Cotton, 2007). In addition, 0.003% (w/v) uracil and 0.004% (w/v) lysine were further
added onto minimal KAc medium to enable sporulation of cells. This is due to the
inability of selected diploid cells to sporulate without supplementation of the required
nutrients.
In this study, we used two different experimental approaches to evaluate the effect of
nutritional starvation on recombination at HIS4 in the wild type (Ade+) strain (Figure
4.1). The first method involved selecting diploid cells on a partially supplemented
growth medium prior to sporulation on either complete KAc or minimal KAc
(supplemented with uracil and lysine), as described above. The second method used
another slightly modified version of this technique that eliminated the diploid selection
step (Figure 4.1A). This was carried out by direct replication of mated cells from YEPD
medium onto the sporulation media. Since diploids that were pre-grown on YEPD were
able to sporulate on minimal KAc even without supplements, no additional nutrients

112
were added to the medium. Cells that were subjected to these techniques are going to
be termed ‘selected’ (pre-grown on minimal medium plus supplements; Figure 4.1B)
and ‘unselected’ (pre-grown on YEPD; Figure 4.1A) hereafter.
Using diploids that were selected on minimal medium (Figure 4.1B), sporulation of the
wild type (Ade+) cells on minimal KAc increased the level of NMS up to 2-fold
compared to sporulation on complete KAc (P = 0.003; Table 4.1). Comparing between
diploids selected on minimal medium with non-selected (YEPD-grown) diploid cells,
sporulation of these cells with complete nutrients did not result in significantly
different levels of NMS (Table 4.1). However, when sporulated on minimal KAc,
diploids pre-selected on minimal media exhibited significantly higher levels of NMS
than that of the non-selected cells (P = 0.025). Additionally, when the non-selected
diploids were sporulated on complete and minimal KAc, no significant difference was
observed in the level of NMS. These data suggest that the nutritional starvation only
affects the NMS events when diploid cells were continuously starved before and
during sporulation.
4.3.2 Nutritional Starvation during Sporulation Increases Crossing Over in the
NAT-HYG Interval in the Selected, but not Unselected Wild Type (Ade+) Diploid Cells
We also monitored the influence of nutritional starvation on crossing over in different
regions on chromosomes III and VII. Crossing over in the NAT-HYG interval was
increased in the selected diploids sporulated on minimal KAc compared to the YEPD-
grown diploids sporulated on complete KAc (P = 1.22 x 10⁻⁵; Table 4.2). This elevated
level of crossing over in the region flanking HIS4 correlates with the increased level of
NMS observed at the HIS4 hotspot site (Table 4.2). In other intervals examined,

113
crossing over was unaffected in response to nutritional starvation in both selected and
unselected cells (Tables 4.2 and 4.3).
Interestingly, sporulation of selected cells on minimal KAc did not result in reduction in
the level of crossing over at HYG-LEU2 compared to the YEPD-grown cells sporulated
on minimal KAc. This observation did not correlate with the increased level of crossing
over at NAT-HYG between selected cells sporulated on minimal KAc compared to non-
selected cells, inconsistent with the hypothesis of crossover interference. However,
since map distance between these two conditions are low (5.8 cM and 5.6 cM), it is
possible that the amount of samples collected (202 and 218 tetrads) may not be
enough to detect a significant difference between these conditions. Therefore, it is
possible that crossover interference could be observed between these conditions if
more tetrads were collected.
Table 4.1 : The level of NMS at HIS4 for different sporulation conditions using the wild
type (Ade+) selected and unselected diploid cells
Strain Genotype
Sporulation Condition Pre-growth Media $ NMS / Total Tetrads
% NMS at HIS4
Wild type Complete KAc YEPD 50 / 388 12.9
Wild type Complete KAc Minimal (+ura, lys) 24 / 193 12.4
Wild type Minimal KAc YEPD 30 / 202 14.9
Wild type Minimal KAc (+ura, lys) Minimal (+ura, lys) 51 / 218 23.4‡
$YEPD –Unselected diploid cells that were pre-grown on YEPD medium; Minimal –
Diploids that were pre-selected on minimal medium added with relevant nutrients. ‡Significantly different compared to data from other conditions studied. The G-test of
homogeneity was used for comparison.

114
Table 4.2 : Map distances in different genetic intervals on chromosome III for different sporulation conditions using the wild type (Ade+)
selected and unselected diploid cells
Sporulation
Condition
Pre-growth Media Genetic intervals
NAT – HYG HYG – LEU2 LEU2 – MAT
PD NPD TT cM§ PD NPD TT cM PD NPD TT cM
Complete KAc YEPD 307 3 68 11.4 305 2 72 11.1 162 15 205 38.6
Complete KAc Minimal (+ura, lys) 155 1 32 10.1 153 0 36 9.5 93 4 93 38.6
Minimal KAc YEPD 161 2 34 11.7 176 0 23 5.8 96 4 101 31.1
Minimal KAc
(+ura, lys)
Minimal (+ura, lys) 131 3 80 22.9‡ 192 0 24 5.6 94 2 120 30.6
§Map distances were calculated in centiMorgan (cM) according to Perkins (1949). PD is parental ditype, NPD is non-parental ditype and TT is
tetratype. ‡Represent values that are statistically significant compared to other conditions tested. G-test of homogeneity was used to compare
the distributions of PD, NPD and TT between different samples.

115
Table 4.3 : Map distances in different genetic intervals on chromosome VII for different sporulation conditions using the wild type selected and
unselected diploid cells
Sporulation Condition Pre-growth Media Genetic intervals
MET13 - CYH2 CYH2 – TRP5
PD NPD TT cM§ PD NPD TT cM
Complete KAc YEPD 233 1 125 18.2 85 24 273 54.6
Complete KAc Minimal (+ura, lys) 129 1 56 16.7 42 12 136 54.7
Minimal KAc YEPD 123 0 57 15.8 46 11 140 52.3
Minimal KAc (+ura, lys) Minimal (+ura, lys) 131 3 63 20.6 41 17 157 60.2
§Map distances were calculated in centiMorgan (cM) according to Perkins (1949). PD is parental ditype, NPD is non-parental ditype and TT is
tetratype.

116
4.3.3 The Effect of Starvation on Recombination in the Selected Wild Type
(Ade+) Cells is Dependent on Bas1p but not Gcn4p
Gcn4p is the transcriptional activator known to be required for overcoming amino acid
limiting conditions in yeast. Both a previous study (Cotton, 2007) and our data (Table
4.1 and 4.2) showed that starvation before and during sporulation for adenine and
amino acids activates HIS4 hotspot activity. Since the absence of these same nutrients
stimulates Gcn4p activity (Section 1.5.3.3), this prompted us to investigate if the effect
of starvation is facilitated by Gcn4p. Therefore, we analysed the levels of NMS and
crossing over under two different conditions in the presence and absence of Gcn4p.
The data obtained demonstrated that even in the absence of Gcn4p (gcn4Δ), the level
of NMS was increases when pre-selected diploids were sporulated with limited
nutrients, compared to that of non-selected gcn4Δ diploid cells sporulated with
complete nutrients (Table 4.4; P = 6.9 x 10⁻⁷). Similarly, crossover events increases at
NAT-HYG in gcn4Δ cells that were starved both during and prior to sporulation,
compared to the gcn4Δ cells fully supplemented with nutrients (P = 0.003; Table 4.5).
As the level of NMS and crossing over still increase in the absence of Gcn4p, this
suggests that the effect is not dependent on Gcn4p.
Since most of the recombination activity at HIS4 is dependent on Bas1p (Chapter 3),
we then asked if the HIS4 hotspot can be activated by starvation in the absence of
Bas1p. When the selected diploids of bas1Δ were sporulated on minimal KAc, the
strain exhibited 5.4% NMS, which is significantly higher than that of the non-selected
bas1Δ cells sporulated on complete KAc (1.8% NMS; P = 0.02). This data suggests that

117
although the majority of NMS events at HIS4 are dependent on Bas1p, the level of
NMS can still be induced by continuous starvation in the absence of Bas1p.
In the NAT-HYG region spanning HIS4, we found a subtle increase in the level of
crossing over when bas1Δ cells were continuously starved as opposed to the
supplemented cells. However, the difference is not statistically significant (P > 0.05).
The observation did not correlate with the significantly increased level of NMS at HIS4
when bas1Δ cells were starved during sporulation. This is inconsistent with other
observations in our study that showed concomitant changes of the NMS events at HIS4
with crossing over of flanking markers under various conditions (discussed in Section
7.8, Chapter 7).
However, the sample size tested in this experiment (467 and 212 tetrads for complete
and minimal sporulation conditions respectively) may be too small to detect a
significant difference and therefore may be subjected to a type II error (failure to
reject null hypothesis even when it is false). Therefore, we used a method (inference
for proportion, http://www.stat.ubc.ca/~rollin/stats/ssize/b2.html) to statistically
estimate the sample size necessary to provide a significant difference between these
populations. Approximately 650 tetrads for each sample would be sufficient to give an
80% chance that the data would be significantly different. Hence, we speculate that
crossing over events at NAT-HYG in bas1Δ may also be elevated under starvation
before and during sporulation, as was observed for the level of NMS at HIS4.

118
Table 4.4 : The level of NMS at HIS4 in the gcn4Δ and bas1Δ strains under different
sporulation and pre-sporulation conditions
Strain Genotype
Sporulation Condition
Pre-growth Media NMS / Total Tetrads
% NMS at HIS4
Wild type Complete KAc YEPD 50 / 388 12.9
Wild type Minimal KAc (+ura, lys)
Minimal (+ura, lys) 51 / 218 23.4‡
gcn4Δ Complete KAc YEPD 45 / 467 9.6
gcn4Δ Minimal KAc (+ura, lys)
Minimal (+ura, lys) 52 / 212 24.5‡
bas1Δ Complete KAc YEPD 6 / 331 1.8
bas1Δ Minimal KAc (+ura, lys)
Minimal (+ura, lys) 11 / 203 5.4‡
‡Represent data that are significantly different compared to the same strain that were
sporulated on complete KAc. The G-test of homogeneity was used for the comparison.

119
Table 4.5 : Map distances in different genetic intervals on chromosome III in the gcn4Δ and bas1Δ strains under different sporulation and pre-
sporulation conditions
Strain
Genotype
Sporulation
Condition
Pre-growth
Media
Genetic intervals
NAT – HYG HYG – LEU2 LEU2 – MAT
PD NPD TT cM§ PD NPD TT cM PD NPD TT cM
Wild type Complete KAc YEPD 307 3 68 11.4 305 2 72 11.1 162 15 205 38.6
Wild type Minimal KAc
(+ura, lys)
Minimal
(+ura, lys)
131 3 80 22.9* 192 0 24 5.6* 94 2 120 30.6
gcn4Δ Complete KAc YEPD 382 0 76 8.3 362 0 88 9.8 219 13 220 33.0
gcn4Δ Minimal KAc
(+ura, lys)
Minimal
(+ura, lys)
159 3 50 16.0* 191 0 19 4.5* 85 2 123 32.1
bas1Δ Complete KAc YEPD 297 0 28 4.3 234 1 81 13.8 179 10 130 29.8
bas1Δ Minimal KAc
(+ura, lys)
Minimal
(+ura, lys)
175 0 27 6.7 162 1 34 10.2 106 9 82 34.5
§Map distances were calculated in centiMorgan (cM) according to Perkins (1949). PD is parental ditype, NPD is non-parental ditype and TT is
tetratype. *Significantly different compared to the same strain sporulated on the complete KAc. G-test of homogeneity was used to compare
the distributions of PD, NPD and TT between different samples.

120
Table 4.6 : Map distances in different genetic intervals on chromosome VII in the gcn4Δ and bas1Δ strains under different sporulation and pre-
sporulation conditions
Strain
Genotype
Sporulation
Condition
Pre-growth
Media
Genetic intervals
MET13 - CYH2 CYH2 – TRP5
PD NPD TT cM§ PD NPD TT cM
Wild type Complete KAc YEPD 233 1 125 18.2 85 24 273 54.6
Wild type Minimal KAc
(+ura, lys)
Minimal
(+ura, lys)
131 3 63 20.6 41 17 157 60.2
gcn4Δ Complete KAc YEPD 271 5 151 21.2 105 39 313 59.8
gcn4Δ Minimal KAc
(+ura, lys)
Minimal
(+ura, lys)
130 2 66 19.7 48 22 141 64.7
bas1Δ Complete KAc YEPD 225 0 88 14.1 67 19 240 54.3
bas1Δ Minimal KAc
(+ura, lys)
Minimal
(+ura, lys)
134 1 59 16.8 43 17 142 60.4

121
4.3.4 Starvation during Sporulation Increases Recombination in the ade1Δ
Strain
Previous studies have reported that a point mutation of ADE1, ade1-1, increases the
level of recombination at HIS4 (Chapter 3) (Abdullah and Borts, 2001, Cotton, 2007).
Cotton (2007) demonstrated an elevated level of recombination in the ade1-1 strain,
when selected diploids were used for sporulation on minimal KAc (supplemented with
adenine, uracil and amino acids) compared to unselected diploids sporulated on
complete KAc. We extended the study by analysing the effect of full starvation during
sporulation upon recombination in the ade1 null mutant (ade1Δ) strain, using non-
selected (YEPD-grown) diploids for sporulation on complete and minimal KAc.
Surprisingly, without prior selection, the ade1Δ cells that were starved during
sporulation exhibited a 3.8-fold increased level of NMS (41.9%; Table 4.7) relative to
the cells sporulated on complete KAc (11.1%; P = 6.3 x 10⁻¹⁶). These data indicate that
complete starvation for adenine, uracil and amino acids during sporulation increases
recombination levels in the ade1 deletion strain, even when the cells were pre-grown
on rich medium. Similarly, a concomitant increase in crossing over at NAT-HYG was
observed in the ade1Δ cells when sporulated on minimal KAc, compared to sporulation
on complete KAc (P = 9.6 x 10⁻¹⁴; Table 4.8). Crossing over in other intervals remained
unaffected under nutrient limiting condition.

122
Table 4.7 : The level of NMS at HIS4 in the ade1Δ strain under different sporulation
conditions using YEPD-grown diploids
Strain Genotype
Sporulation Condition NMS / Total Tetrads
% NMS at HIS4
Wild type Complete KAc 50 / 388 12.9
Wild type Minimal KAc 30 / 202 14.9
ade1Δ Complete KAc 28 / 252 11.1
ade1Δ Minimal KAc 109 / 260 41.9‡*
‡Significantly different compared to the corresponding wild type. *Significantly
different compared to the same strain sporulated on the complete KAc

123
Table 4.8 : Map distances in different genetic intervals on chromosome III in the ade1Δ strain under different sporulation conditions using the
non-selected (YEPD-grown) diploids
Strain
Genotype
Sporulation
Condition
Genetic intervals
NAT – HYG HYG – LEU2 LEU2 – MAT
PD NPD TT cM§ PD NPD TT cM PD NPD TT cM
Wild type Complete KAc 307 3 68 11.4 305 2 72 11.1 162 15 205 38.6
Wild type Minimal KAc 161 2 34 11.7 176 0 23 5.8 94 6 101 31.1
ade1Δ Complete KAc 194 3 47 13.3 195 1 48 11.1 124 5 116 29.8
ade1Δ Minimal KAc 119 8 129 34.6‡# 237 2 21 6.3# 132 5 123 29.4
§Map distances were calculated in centiMorgan (cM) according to Perkins (1949). PD is parental ditype, NPD is non-parental ditype and TT is
tetratype. ‡Significantly different compared to the corresponding wild type. #Significantly different compared to the same strain sporulated on
complete KAc.

124
Table 4.9 : Map distances in different genetic intervals on chromosome VII in the wild type and ade1Δ strains under different sporulation
conditions using the YEPD-grown diploids
Strain
Genotype
Sporulation
Condition
Genetic intervals
MET13 - CYH2 CYH2 – TRP5
PD NPD TT cM§ PD NPD TT cM
Wild type Complete KAc 233 1 125 18.2 85 24 273 54.6
Wild type Minimal KAc 123 0 57 15.8 46 11 140 52.3
ade1Δ Complete KAc 146 1 83 19.6 70 14 166 50.0
ade1Δ Minimal KAc 166 1 70 16.0 62 22 171 59.6
§Map distances were calculated in centiMorgan (cM) according to Perkins (1949).

125
4.3.5 Modulating the Amount of Nutrients during Sporulation Affects
Recombination in the ade1Δ Strain
We further evaluated the nutritional effect on recombination at HIS4 in the ade1Δ
strain, by varying the amount of nutritional supplements (containing adenine, uracil
and amino acids) in the sporulation media. To achieve this, the level of recombination
was compared between cells sporulated on different KAc media containing different
amounts of the nutrient mixture (complete KAc, half complete KAc and minimal KAc).
Our data demonstrated a correlation between the quantity of the nutrient mixture and
the level of NMS (Figure 4.2). By supplying half the amount of nutrients during
sporulation, the level of NMS was elevated (25.6%) compared to complete
supplementation (11.1%; P = 5.3 x 10⁻⁵). Additionally, this level of NMS in cells
sporulated on the partially starved KAc, is significantly lower compared to the cells that
were completely starved of the nutrient mixture (41.9%; P = 2.0 x 10⁻⁴).
Cells that were sporulated on ‘half-complete’ KAc also exhibited an increased level of
crossing over in the NAT-HYG interval compared to sporulation with complete
nutrients (P = 0.008). This reduction is concomitant with the elevated level of NMS
events at HIS4. Similarly, crossing over was decreased in cells sporulated on ‘half-
complete’ KAc relative to the total starvation condition (P = 1.5 x 10⁻⁵). This further
confirms previous data that adenine, uracil and amino acids in the nutrient mixture
(Table 2.3) are the determining factors whose absence influences the enrichment of
HIS4 recombination events in minimal KAc medium.

126
Figure 4.2 : A negative correlation between the level of NMS at HIS4 in the ade1Δ strain with the amount of nutrients supplemented in
sporulation media; ‘minimal’ KAc (0% of the nutrient mixture), ‘half complete’ KAc (50% of the nutrient mixture) and ‘complete’ KAc
(100% of the nutrient mixture). Linear regression curves are represented, with R2 corresponding to the square of Pearson’s product
moment correlation coefficient and was conducted using Excel (Microsoft Corporation).

127
Table 4.10 : Map distances in different genetic intervals on chromosome III for different sporulation conditions in the ade1Δ strains
Sporulation
Condition
Genetic intervals
NAT – HYG HYG – LEU2 LEU2 – MAT
PD NPD TT cM§ PD NPD TT cM PD NPD TT cM
Complete KAc 194 3 47 13.3 195 1 48 11.1 124 5 116 29.8
Half complete KAc 131 1 62 17.5‡# 164 0 35 8.8 113 5 84 28.2
Minimal KAc 119 8 129 34.6‡ 237 2 21 6.3‡ 132 5 123 29.4
§Map distances were calculated in centiMorgan (cM) ‡Represent values that are significantly different to the sporulation on complete KAc. #Significantly different than sporulation on minimal KAc.

128
4.3.6 Gcn4p is a Minor Contributor to the Starvation Effect on Recombination
in a Strain Auxotrophic for Adenine (ade1Δ)
The interesting observation in which depletion of nutrient mixture stimulates
recombination activity in the non-selected ade1Δ cells, led us to investigate if this
response is mediated by Gcn4p. Hence, we analysed recombination activity at HIS4 in
the gcn4Δ ade1Δ double deletion strain under starvation conditions. Our data
demonstrated that the level of NMS in the gcn4Δ ade1Δ strain is slightly but
significantly reduced under starvation, compared to the ade1Δ strain (P = 0.03; Figure
4.3). Consistent with this, a significant reduction was also observed for crossing over in
NAT-HYG in the gcn4Δ ade1Δ strain compared to the ade1Δ strain, in cells that were
sporulated on minimal KAc (P = 0.043). These observations suggest that Gcn4p plays a
role in activating recombination in the ade1Δ strain under starvation (during
sporulation).
However, we also found a 2-fold increase in the level of NMS in the gcn4Δ ade1Δ strain
for cells sporulated on minimal KAc medium (32.7%) relative to sporulation on
complete KAc (16.4%; P = 1.4 x 10⁻⁵) (Figure 4.3). Correspondingly, similar increased of
crossing over was also observed in the NAT-HYG interval in the gcn4Δ ade1Δ strain
under starvation during sporulation, compared to the non-starved sporulation
condition (P = 9 x 10⁻⁴; Table 4.11). This suggests that even in the absence of Gcn4p,
the level of recombination at HIS4 was still stimulated in response to the nutritional
starvation in the ade1Δ strain. Based on these data, the Gcn4p-dependent NMS
activity in response to starvation is only approximately 22%, which is much lower than
the starvation induced activity of NMS that is independent of Gcn4p (78%; Figure 4.3).

129
Figure 4.3 : The level of NMS at HIS4 under different sporulation conditions in the
ade1Δ and gcn4Δ ade1Δ strains using non-selected (YEPD-grown) diploids. *Pair wise
comparisons showing data that are significantly different from each other; a) P value =
6.3 x 10⁻¹⁶; b) P value = 0.03; c) P value = 9 x 10⁻⁴
*a
*c
*b

130
Table 4.11: Map distances in different genetic intervals on chromosome III for different sporulation conditions in the ade1Δ and gcn4Δ ade1Δ
strains using YEPD-grown diploids
Strain
genotype
Sporulation
Condition
Genetic intervals
NAT – HYG HYG – LEU2 LEU2 – MAT
PD NPD TT cM§ PD NPD TT cM PD NPD TT cM
ade1Δ Complete KAc 194 3 47 13.3 195 1 48 11.1 124 5 116 29.8
ade1Δ Minimal KAc 119 8 129 34.6# 237 2 21 6.3# 132 5 123 29.4
gcn4Δ ade1Δ Complete KAc 200 3 69 16.0 225 0 48 8.8 138 5 131 29.4
gcn4Δ ade1Δ Minimal KAc 139 5 96 26.3‡# 201 0 42 8.6 121 4 119 29.3
§Map distances were calculated in centiMorgan (cM) according to Perkins (1949). PD is parental ditype, NPD is non-parental ditype and TT is
tetratype. ‡Represent values that are significantly different compared to the corresponding wild type. #Significantly different compared to the
same strain sporulated on the complete KAc.

131
Taken together, these observations suggest that Gcn4p makes a modest contribution
towards mediating the effect of starvation (during sporulation) on recombination in
the ade1Δ strain, while most of the activity is mediated by a Gcn4p-independent
factor.
4.3.7 Bas1p is Required for the Starvation Induced Recombination at HIS4 in
the ade1Δ Strain
Since a significant proportion of the starvation effect on recombination at HIS4 in the
ade1Δ strain is independent of Gcn4p, we next looked at the involvement of Bas1p in
the starvation induced recombination. Our data demonstrated that in the absence of
Bas1p, the level of NMS in the ade1Δ strain was strongly reduced under starvation
conditions (12-fold; P = 3.62 x 10⁻²⁷; Table 4.12). Similarly, crossing over in the NAT-
HYG interval was decreased in the bas1Δ ade1Δ strain compared to the ade1Δ strain
(P = 5.33 x 10⁻²⁸; Table 4.13). This implies a major requirement for Bas1p in mediating
the increased levels of recombination at HIS4 in the ade1Δ strain in response to
starvation during sporulation.
4.3.8 AICAR from the Histidine Biosynthesis Pathway Partly Contributes to the
Starvation Induced Recombination in the ade1Δ Strain
As stated above, Bas1p is required for the elevated levels of recombination at HIS4 in
the ade1Δ strain when cells were sporulated under starvation conditions. Bas1p likely
mediates this starvation effect in conjunction with Bas2p, since interaction of both
proteins is needed for binding to the HIS4 promoter (Chapter 3). The purine metabolic
intermediate, AICAR, is known to be important in activating Bas1/2p interaction, and is
also produced via the histidine biosynthesis pathway (Figure 3.1; Chapter 3).

132
Table 4.12 : The level of NMS at HIS4 in the ade1Δ, bas1Δ ade1Δ and bas1Δ strains
sporulated on minimal KAc using non-selected (YEPD-grown) diploids
Strain
Genotype
Sporulation Condition NMS / Total
Tetrads
% NMS at
HIS4
ade1Δ Minimal KAc 109 / 260 41.9
bas1Δ ade1Δ Minimal KAc 8 / 232 3.45‡
bas1Δ Minimal KAc 12 / 354 3.39‡
‡Represent data that are significantly different compared to the corresponding ade1Δ
cells.

133
Table 4.13 : Map distances in different genetic intervals on chromosome III in the ade1Δ, bas1Δ ade1Δ and bas1Δ strains sporulated on minimal
KAc using YEPD-grown diploids
Strain
Genotype
Sporulation
Condition
Genetic intervals
NAT – HYG HYG – LEU2 LEU2 – MAT
PD NPD TT cM§ PD NPD TT cM PD NPD TT cM
ade1Δ Minimal KAc 119 8 129 34.6 237 2 21 6.3 132 5 123 29.4
bas1Δ ade1Δ Minimal KAc 208 0 19 4.2‡ 191 0 36 7.9‡ 128 3 99 25.4
bas1Δ Minimal KAc 313 1 33 5.6‡ 282 0 61 8.9‡ 190 8 149 28.4
§Map distances were calculated in centiMorgan (cM) according to Perkins (1949). PD is parental ditype, NPD is non-parental ditype and TT is
tetratype. ‡Represent values that are significantly different compared to the corresponding ade1Δ cells.

134
Since Bas1/2p-activated recombination in the ade1Δ strain in response to starvation is
not stimulated by AICAR from the purine biosynthesis pathway, we asked if AICAR
produced from the histidine biosynthesis pathway is responsible for this activation. To
address this, recombination activity was analysed in a his1Δ ade1Δ strain where the
production of AICAR from both adenine and histidine biosynthesis pathways is blocked
(Figure 3.1; Chapter 3).
The levels of NMS and crossing over were significantly decreased in the his1Δ ade1Δ
strain compared to ade1Δ, when both strains were sporulated under starvation
conditions (P = 8.3 x 10⁻⁶ and P = 5.1 x 10⁻⁷; Table 4.14 and 4.15 respectively). These
data may suggest that the recombination increase in the ade1Δ strain in response to
starvation is partially reliant upon AICAR produced via the histidine biosynthesis
pathway. However, significantly higher levels of NMS and crossing over were observed
when the his1Δ ade1Δ cells were sporulated on minimal KAc as opposed to complete
KAc (P = 1.7 x 10⁻⁵ and P = 0.001; Table 4.14 and 4.15 respectively). These data suggest
that the starvation induced recombination at HIS4 occurs even when AICAR synthesis
is completely blocked. Thus, although AICAR from the histidine biosynthesis pathway is
partly responsible for mediating recombination in the ade1Δ strain in response to
starvation, there are factors other than AICAR stimulation on recombination yet to be
identified.

135
Table 4.14 : The level of NMS at HIS4 in the ade1Δ and his1Δ ade1Δ strains under
different sporulation conditions using YEPD-grown diploids
Strain
Genotype
Sporulation Condition NMS / Total
Tetrads
% NMS at
HIS4
ade1Δ Complete KAc 28 / 252 11.1
ade1Δ Minimal KAc 109 / 260 41.9#
his1Δ ade1Δ Complete KAc 25 / 287 8.7
his1Δ ade1Δ Minimal KAc 47 / 208 22.6‡#
‡Significantly different compared to the ade1Δ cells sporulated under starvation
condition. #Significantly different compared to the same strain sporulated on the
complete KAc.

136
Table 4.15 : Map distances in different genetic intervals on chromosome III in the ade1Δ and his1Δ ade1Δ strains under different sporulation
conditions using YEPD-grown diploids
Strain
Genotype
Sporulation
Condition
Genetic intervals
NAT – HYG HYG – LEU2 LEU2 – MAT
PD NPD TT cM§ PD NPD TT cM PD NPD TT cM
ade1Δ Complete KAc 194 3 47 13.3 195 1 48 11.1 124 5 116 29.8
ade1Δ Minimal KAc 119 8 129 34.6# 237 2 21 6.3# 132 5 123 29.4
his1Δ ade1Δ Complete KAc 232 0 44 8.0 224 0 57 10.1 141 8 133 32.1
his1Δ ade1Δ Minimal KAc 143 1 59 16.0‡# 183 0 22 5.4# 102 4 102 30.3
§Map distances were calculated in centiMorgan (cM) according to Perkins (1949). PD is parental ditype, NPD is non-parental ditype and TT is
tetratype. ‡ Significantly different compared to the ade1Δ cells sporulated under starvation condition. # Significantly different compared to the
same strain sporulated on the complete KAc.

137
4.3.9 HIS4 Recombination Cannot be Further Increased in the ade16 ade17
Double Deletion
Even when nutrients were plentiful during sporulation, the ade16Δ ade17Δ cells
exhibited very high levels of recombination (53% NMS events; 45.8 cM; Chapter 3). We
hypothesised that this effect is due to the accumulation of AICAR which activates
interaction between Bas1p and Bas2p. We wished to determine if the HIS4 hotspot
activity could be further increased in the ade16Δ ade17Δ strain by subjecting it to
starvation of adenine, uracil and amino acids during sporulation. We found unchanged
levels of both the NMS at HIS4 and crossing over in the NAT-HYG interval in both
sporulation conditions (Table 4.16). Furthermore, no effect of starvation was detected
at other intervals in the ade16Δ ade17Δ strain.
Table 4.16 : The level of NMS at HIS4 in the ade1Δ and ade16Δ ade17Δ strains under
different sporulation conditions using YEPD-grown diploids
Strain Genotype Sporulation Condition NMS / Total Tetrads % NMS at HIS4
ade16Δ ade17Δ Complete KAc 221 / 417 53.0
ade16Δ ade17Δ Minimal KAc 233 / 259 47.4
There was no statistical significance in the frequency of NMS between the conditions
tested.
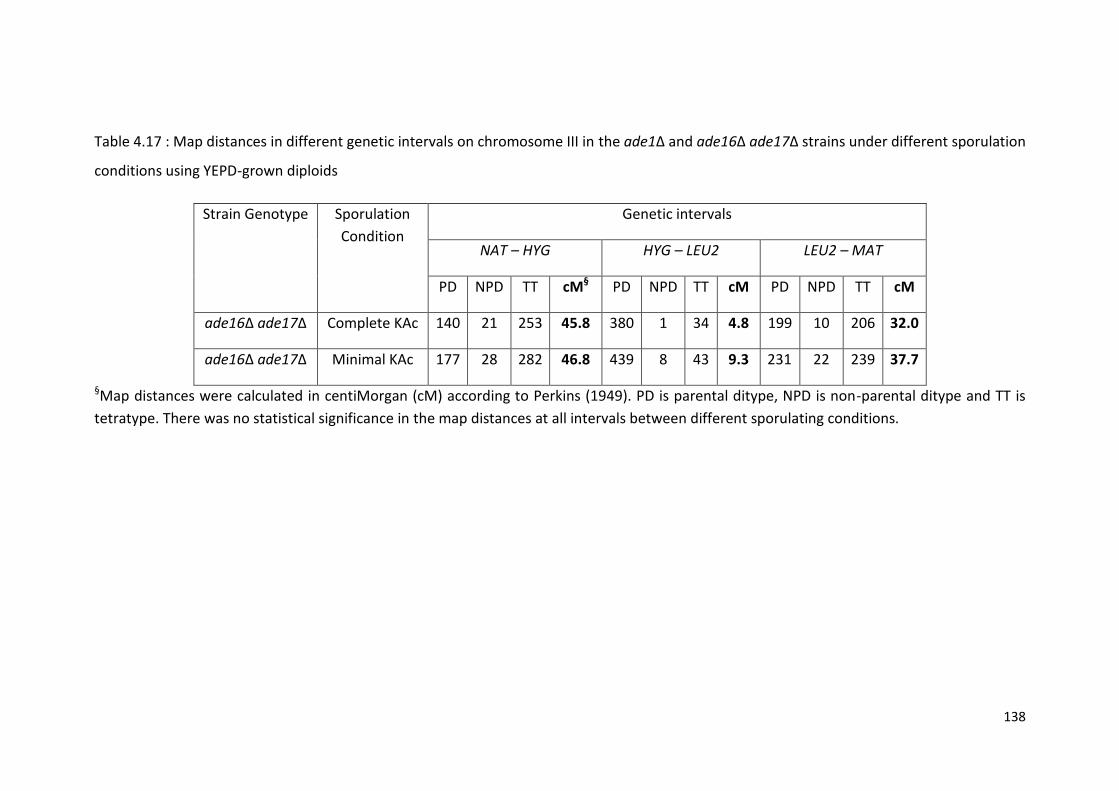
138
Table 4.17 : Map distances in different genetic intervals on chromosome III in the ade1Δ and ade16Δ ade17Δ strains under different sporulation
conditions using YEPD-grown diploids
Strain Genotype Sporulation
Condition
Genetic intervals
NAT – HYG HYG – LEU2 LEU2 – MAT
PD NPD TT cM§ PD NPD TT cM PD NPD TT cM
ade16Δ ade17Δ Complete KAc 140 21 253 45.8 380 1 34 4.8 199 10 206 32.0
ade16Δ ade17Δ Minimal KAc 177 28 282 46.8 439 8 43 9.3 231 22 239 37.7
§Map distances were calculated in centiMorgan (cM) according to Perkins (1949). PD is parental ditype, NPD is non-parental ditype and TT is
tetratype. There was no statistical significance in the map distances at all intervals between different sporulating conditions.

139
4.4 Discussion
4.4.1 Starvation Before and During Sporulation for Adenine and Amino Acids
Activates Recombination at HIS4 in the Wild Type (Ade+) Strain
In this study, we found no effect of adenine and amino acid starvation (during
sporulation) on HIS4 hotspot activity when cells were pre-grown on a rich medium
(YEPD) prior to sporulation (‘unselected diploids’; Figure 4.1). In contrast, by selecting
diploid populations on a synthetic minimal medium prior to meiosis, sporulation on
minimal KAc led to a two-fold increase in the level of recombination compared to
sporulation on complete KAc (Table 4.1; Figure 4.1). These data are consistent with the
previously reported observation, in which nutritional starvation during and prior to
sporulation influence the recombination level at HIS4 (Cotton, 2007).
We hypothesised that the differences in the effect of starvation on HIS4 hotspot
activity between selected and unselected diploids is the result of different degrees of
starvation for adenine and amino acids. Particularly, diploid cells were already
deprived of adenine and amino acids when selected on the synthetic minimal medium
prior to sporulation (Figure 4.1). Therefore, further starvation throughout meiosis
might maintain or enhance the activity of regulators responsible for inducing
recombination in response to nutritional limitations (discussed in Section 4.4.3).
Furthermore, the activity of these starvation-induced factors may return to the non-
activated state when sufficient nutrients are supplemented in the sporulation media.
This could explain the lower level of recombination obtained when cells were starved
during vegetative growth but sporulated with complete nutrients (Table 4.1 and 4.2).
In cells that were supplemented with complete nutrients prior to sporulation, the

140
regulators that respond to starvation may be in an inactivated state. Therefore,
starvation during sporulation may not provide adequate time for these regulators to
be activated in a manner that can stimulate DSB formation. These results indicate that
being continuously starved for adenine and amino acids (pre-sporulation and during
sporulation) is necessary to increase the level of recombination at HIS4, likely by
activating as yet unknown factors to induce DSB production.
4.4.2 Differences of GCN4 Deletion between Different Strain Backgrounds
This study showed that deletion of GCN4 did not affect the levels of NMS and crossing
over at HIS4 compared to the wild type, under both starvation and non-starvation
conditions (Table 4.4 and 4.5). These data suggested that the transcription factor
Gcn4p is not required for recombination at HIS4 in the Y55 strain, consistent with a
previous observation by White et al. (1992) in the S288C strain background. However,
these data contrast with another previous observation in which recombination events
at HIS4 were reduced when GCN4 is deleted (Abdullah and Borts, 2001).
The experiment by Abdullah and Borts (2001) was performed in the H390 x H330 strain
background, which is the Y55-related strain. One possibility could have been that the
difference between these strains is due to a possible mutation of Gcn4p binding sites
at the HIS4 promoter in one of the strains. However, DNA sequencing of the promoter
regions of HIS4 in the Y55 and H390 x H330 strains ruled out this possibility. Therefore,
it is possible that the requirement of Gcn4p for recombination at HIS4 is strain-specific
for unknown reasons.
Furthermore, the haploid gcn4Δ cells of H390 x H330 have aberrant growth
phenotypes that include a slower growth on synthetic omission media, and aberrant

141
germination of some of its spores following tetrad dissection (M.F.F. Abdullah,
personal communication). However, no aberrant growth phenotype for the gcn4Δ cells
was observed in the Y55 strain background used in this study (Appendix I). This
observation supports the suggestion that the Y55 and H390 x H330 strains respond
differently in the absence of Gcn4p.
4.4.3 Elevation of HIS4 Recombination in the Absence of Gcn4p or Bas1p in
Response to Starvation, in the Wild Type Strain Prototrophic for Adenine (Ade+)
We have demonstrated that both levels of gene conversion and crossing over in the
gcn4Δ strain were increased in response to starvation during and prior to sporulation
for adenine and amino acids (2.6- and 1.9-fold respectively; Table 4.4 and 4.5). This
observation suggests that Gcn4p is not required for the effect of starvation upon
recombination in adenine prototrophic cells.
Cells also exhibited low levels of recombination (5.4% NMS, 6.7 cM) in response to
starvation before and during sporulation for adenine and amino acids, when BAS1 was
deleted (Table 4.4 and 4.5). However, the level of NMS in the bas1Δ strain was
significantly elevated under starvation before and during sporulation, as opposed to
that pre-grown and sporulated with complete nutrient supplements (Table 4.4 and
4.5). These data argue that although the vast majority of gene conversion events at
HIS4 are dependent on Bas1p, nutrient starvation can still stimulate the NMS events
independently of Bas1p. This also suggests that there may be an unknown component
that can activate gene conversion at HIS4 in response to continuous starvation.
One possibility is that Rap1, a protein that also binds to the HIS4 promoter, is involved
in this recombination activation in response to starvation. Rap1p is a context-

142
dependent transcriptional activator and repressor, which is involved in various cellular
processes including telomere lengthening and shortening, as well as controlling
transcription of genes involved in the glycolytic pathway and ribosomal proteins
(Sussel and Shore, 1991, Piña et al., 2003, Joo et al., 2011). At HIS4, Rap1p functions as
a ‘chromatin opener’ by preventing the formation of nearby nucleosomes specifically
at regions containing Bas1/2p binding sites and the high affinity Gcn4p binding site
(Section 1.5.3.1) (Devlin et al., 1991). Therefore, it has been suggested that Rap1p
facilitates binding of Bas1/2p and Gcn4p to the promoter region, and the chromatin
status is maintained by the transcription factors (Devlin et al., 1991, Kirkpatrick et al.,
1999a).
The presence of Rap1p binding site has also been reported to be required for HIS4
recombination (White et al., 1993, Fan et al., 1995). Therefore, it is possible that the
starvation induced recombination activity at HIS4, which is independent of Bas1p and
Gcn4p, is mediated by Rap1p. This could involve a Rap1p-mediated chromatin
organisation that directly promotes access to recombination machinery to generate
DSBs under starvation condition. It is also possible that nutrient starvation affect
specific alterations in the chromatin structure by stimulating factors other than Rap1p,
such as a chromatin remodelling protein that responds to starvation. This then creates
an optimal environment for recombination initiating factors to form DSBs.
4.4.4 Starvation only during Sporulation Affects Recombination in Cells
Auxotrophic for Adenine (ade1Δ)
As mentioned above, no effect on recombination was detected in the wild type Ade+
strain when the non-selected (YEPD-grown) diploid cells were starved for adenine,

143
amino acids and uracil only during sporulation. However, we found an intriguing
observation in which the ade1Δ strain exhibited an elevated level of recombination
when non-selected diploids were sporulated on minimal KAc (Table 4.7 and 4.8). In
addition, this starvation effect in the ade1Δ strain requires Bas1p with little
contribution of Gcn4p (Section 4.3.6 and 4.3.7). This suggests that although Gcn4p is
not required for the effect of nutrient starvation before and during sporulation on
recombination in the wild type Ade+ strain, the effect of starvation (during sporulation)
in the ade1Δ strain is partly dependent on Gcn4p. These data also suggest that Bas1p
plays a major role in the effect of starvation during sporulation in cells auxotrophic for
adenine (ade1Δ). Furthermore, this activation of Bas1/2p is independent of AICAR
from the purine biosynthesis pathway, since complete deletion of ADE1 should inhibit
the synthesis of AICAR from the pathway (Figure 3.1).
We also demonstrated a significant reduction in the level of recombination in the
his1Δ ade1Δ strain relative to the ade1Δ strain (Table 4.14 and 4.15). This result
suggests that AICAR from the histidine biosynthesis pathway is partially involved in
activating recombination in the ade1Δ strain in response to starvation. Gcn4p may be
involved in this activation of the histidine biosynthesis pathway in response to nutrient
starvation during sporulation, in cells auxotrophic for adenine. This is because Gcn4p is
known to activate transcription of genes in the histidine biosynthesis pathways
including HIS4 and HIS7 (Arndt et al., 1987, Denis et al., 1998, Springer et al., 1996).
Thus, when AICAR production was blocked from the purine biosynthesis pathway (in
the ade1Δ strain), starvation for adenine and amino acids might activate the histidine
biosynthesis pathway via Gcn4p for unknown reasons. Therefore, it would be of
interest to determine if Gcn4p is involved in activating recombination in the his1Δ

144
ade1Δ strain under nutrient starvation during sporulation. To do this, the level of
recombination in a triple deletion of his1, ade1 and gcn4 would need to be compared
with the his1Δ ade1Δ strain.
We also found a significant increase in the level of recombination when the his1Δ
ade1Δ cells were starved during sporulation compared to sporulation on complete KAc
(Table 4.14 and 4.15). These data suggest that nutrient starvation could increase
recombination at HIS4 even in the absence of AICAR from both the purine and
histidine biosynthesis pathways. This indicates that an AICAR-independent factor is
also responsible for activating recombination in response to extracellular and
intracellular nutrient starvation. One possible mechanism is that starvation potentially
promotes phosphorylation of Bas1p, which leads to either increased binding of
Bas1/2p to the HIS4 promoter or direct recruitment of recombination initiating factors
(discussed in Section 7.6). Alternatively, unknown chromatin remodelling protein could
also respond to the starvation signals and thus increase binding of Bas1/2p to the
promoter.
4.4.5 No Effect of Nutritional Starvation upon Accumulation of AICAR
In Chapter 3, we demonstrated that the accumulation of AICAR in the ade16Δ ade17Δ
strain elevates the HIS4 hotspot activity in a manner mediated by Bas1/2p. We initially
expected that by starving the cells during sporulation, the level of recombination could
be further increased due to an up-regulation of Bas1/2p and/or other factors.
However, the unchanged level of recombination in the ade16Δ ade17Δ strain in
response to starvation does not support this hypothesis. One possibility is that the
level of recombination in the ade16Δ ade17Δ strain was at a very high level even under

145
non-starvation conditions (Table 4.16 and 4.17). Therefore the activity of Bas1/2p
could already be at the maximum level (40% to 54% NMS), in which starvation does
not further activate Bas1/2p. In addition, it is also possible that the formation of DSBs
is already at the highest possible level, so that even if Bas1/2p were further activated,
there would be no further production of DSBs.
4.4.6 Future Work
Since the activation of recombination at HIS4 in response to starvation can be
mediated by an AICAR-independent factor(s) that may stimulate Bas1p and Bas2p
interaction, it is of interest to determine what these other mechanisms are. We could
do this by testing if the effect of Bas1/2p on the HIS4 hotspot activity involves specific
chromatin alterations and/or post-translational modifications of Bas1p. Therefore, in
Chapter 5, we attempted to investigate the influence of starvation in meiosis on
specific histone modification activities using genetic analysis. In addition, we also
attempted to evaluate the phosphorylation status of Bas1p in both starvation and non-
starvation conditions using phospho-labelling (discussed in Chapter 5). In addition, it
would also be of interest to distinguish between the components in the nutrient
mixture (adenine, uracil and amino acids) to determine the effect of starvation for
individual nutrient on recombination at HIS4.

146
Chapter 5 : The Influence of Nutrient Starvation on the Phosphorylation
of Bas1p, and the Set2p-Mediated HIS4 Hotspot Activity
5.1 Introduction
5.1.1 Chromatin Modification Activities Associated with Meiotic
Recombination
In yeast and higher eukaryotes, the position and activity of many meiotic
recombination hotspots have been demonstrated to be influenced, at least partly, by
the status of local chromatin structure. It has been shown that some hotspots are
associated with an ‘open’ chromatin configuration, which presumably makes the DNA
more accessible to recombination initiating factors. In addition, local and global
genomic studies have also characterised several histone post-translational
modification activities that correspond with recombination hotspots.
Trimethylation of lysine 4 of histone 3 (H3K4me3) has been reported to be associated
with recombination hotspots in several organisms. In mice, a high level of H3K4me3 is
correlated with elevated levels of recombination activity at Psmb9 and Hlx1 hotspots
(Buard et al., 2009). It has also been reported that a H3K4 trimethylase, Prdm9, is
responsible for the distribution of a subset of recombination hotspots in mice and
humans (Baudat et al., 2010). Prdm9 contains a zinc-finger domain that binds to a
degenerate 13-mer motif which is associated with a substantial group of
recombination hotspots in humans (Section 1.5.2) (Myers et al., 2010 268, Hochwagen
and Marais, 2010 265). Therefore, it has been suggested that the enrichment of
H3K4me3 at hotspot regions results from Prdm9 activity (Muers, 2010). Furthermore,
a modification of the Prdm9 zinc-finger domain of transgenic mice was shown to affect

147
the activity of the Psmb9 and Hlx1 hotspots, as well as the level of H3K4me3 at these
hotspot regions (Grey et al., 2011). This further indicates that the Prdm9-catalysed
H3K4me3 is important in regulating the distribution of hotspots in mammals. The
binding of Prdm9 may promote recruitment of other proteins or chromatin
remodelling factors, which could lead to chromatin alterations that favour DSB
formation (Figure 5.1c.i) (Grey et al., 2011).
The link between H3K4me3 and recombination hotspots has also been reported in S.
cerevisiae. Deletion of SET1, which encodes the only H3K4 methyltransferase in yeast,
severely reduces DSB formation at the CYS3 and YCR047C loci (Sollier et al., 2004).
Similarly, Borde et al. (2009) demonstrated that inactivation of Set1p
methyltransferase reduces the rate of DSBs at 84% of S. cerevisiae hotspots genome-
wide, including the HIS4 hotspot. A constitutively higher level of H3K4me3 was also
found near DSB regions (Borde et al., 2009).
Furthermore, it has been shown that H3K4me3 already exists in vegetative cells at
higher levels at the DSB-preferred sites relative to regions with few or no DSBs (Borde
et al., 2009). This implies that H3K4me3 serves to mark the chromatin sites for future
recombination initiation (Székvölgyi and Nicolas, 2009). However, whilst the Set1p-
mediated H3K4me3 was enriched at the majority of recombination hotspots in yeast,
the formation of DSBs at some other loci was strongly stimulated in the absence of
Set1p (Borde et al., 2009). This suggests that recombination initiation is not completely
dependent on H3K4me3, and could imply a requirement for other factors (e.g., other
chromatin features). Moreover, not all regions that contains elevated levels of
H3K4me3 are recombination hotspots, suggesting that additional factors may also be

148
a) Acetylation
b) Deacetylation
c) Methylation
i. H3K4me3
Unknown protein partner of prdm9 or Set1p
H3K4me3 Prdm9 or Set1p
Spo11
Spo11
Unknown histone post-translational modification
Histone acetylation
Unstable nucleosome
HDAC complex
Stable nucleosome
HAT complex

149
ii. H3K36me3
Figure 5.1 : Models for the association of several histone post-translational
modifications with meiotic recombination hotspots in S. cerevisiae and other
organisms.
a) Histone acetylation (e.g., H3K27ac at HIS4) is mediated by HATs (e.g., Gcn5p and
Ada2p), and provides a chromatin structure that favours access of recombination
factors.
b) Histone deacetylation (e.g., H4K16 near telomeres), mediated by HDACs (e.g.,
Hda1p, Rpd3p and Sir2p), stabilises nucleosomes hence ‘closing-up’ the chromatin.
c) Trimethylation of histones:
i) H3K4me3, mediated by Set1p in S. cerevisiae and Prdm9 in humans and mice. Prdm9
recognise its target DNA motif (the 13-mer motif), and binds the DNA through the zinc
finger domain. Histone trimethylation mediated by Prdm9 or Set1p may promote
other proteins that can modify the chromatin structure to favour access of Spo11p, or
proteins that can directly recruit recombination machinery.
ii) The Set2p-mediated H3K36me3 at the HIS4 locus in S. cerevisiae. The Rpd3 HDAC
binds to the H3K36-methylated nucleosomes via its Eaf3p chromodomain subunit, and
stabilises the nucleosome.
Set2p H3K36me3 Rpd3p

150
involved in hotspot specification (Hochwagen and Marais, 2010).
Several other histone post-translational modification activities have also been reported
to influence recombination in yeast. These suggestions came primarily from studies
that manipulate enzymes involved in modifications of histones and chromatin
remodelling. In another genome-wide analysis of S. cerevisiae, deletion of SIR2, which
encodes a histone deacetylase (HDAC), elevates the DSB formation in 5% of the genes
(most of which are located near telomeres and the rRNA genes) and reduces them in
7% of the genes (Mieczkowski et al., 2007). Moreover, the increased level of DSB
formation near telomeres was suggested to be the result of hyperacetylation of
histones, since Sir2p deacetylates H4K16 near telomeres (Robyr et al., 2002).
Histone acetylation has often been associated with transcriptionally active regions
potentially by mediating an ‘unravelling’ of chromatin, hence making it more
accessible for proteins that mediate transcription (Kouzarides, 2007). Consistent with
this, histone deacetylation by HDAC has the opposite effect ‘closing-up’ the chromatin,
hence repressing transcription (Kouzarides, 2007). Therefore, the effect of histone
acetylation on meiotic recombination may be regulated via a similar mechanism as
transcription, by promoting an accessible state of chromatin for recombination
machinery (Figure 5.1a).
A correlation between DSB formation and histone acetylation has also been
demonstrated in S. pombe, in which hyperacetylation of histones H3 and H4 were
observed near the region of the ade6-M26 hotspot (Yamada et al., 2004). This
hyperacetylation at H3 and H4 is also dependent on transcription factors Atf1/Pcr1 and

151
the ‘M26 sequence’ (a heptameric DNA sequence created by the M26 mutation),
suggesting a site-specific chromatin effect (Yamada et al., 2004). Furthermore, deletion
of both gcn5 and ada2, members of the SAGA family of histone acetyltransferases
(HAT) in S. pombe, significantly reduces M26 hotspot activity and histone H3
acetylation (Pryce and McFarlane, 2009). A more severe effect was observed on DSB
formation and chromatin remodelling in the ade6-M26 hotspot as a result of
inactivation of Snf22p (a putative Swi2/Snf2 ATP-dependent Chromatin Remodelling
Factors; ADCR) (Yamada et al., 2004). These findings suggest that both the ADCR-
mediated chromatin remodelling and histone acetylation influence ade6-M26 hotspot
activity, perhaps by providing preferential loading sites for DSB machinery (Yamada et
al., 2004).
At HIS4 in S. cerevisiae, Merker et al. (2008) demonstrated that loss of Set2p histone
methyltransferase (HMT) and Rpd3 deacetylase activities strongly stimulate
recombination and DSB formation. Set2p mediates trimethylation of histone H3 lysine
36 (H3K36), which is known to recruit a repressive Rpd3 complex, Rpd3C(S), via its
chromodomain subunit Eaf3p (Figure 5.1c.ii) (Keogh et al., 2005). Therefore, the effect
of SET2 deletion on the HIS4 hotspot activity was suggested to be due to the loss of
Set2p-dependent recruitment of Rpd3 deacetylase, leading to a hyperacetylation of
local chromatin (Merker et al., 2008). Indeed, inactivation of Rpd3p has been shown to
increase acetylation at many lysine residues of histone H3 and H4 at several loci
including INO1 and IME2 (Rundlett et al., 1996, Suka et al., 2001, Robyr et al., 2002).
Similarly, mutation of SET2 was demonstrated to induce histone H3 and H4 acetylation
including H3K9, H3K14 and H4K5 at many different locations in the genome (Carrozza

152
et al., 2005, Keogh et al., 2005, Lin et al., 2010). Therefore, it has been hypothesised
that the recombination increase at HIS4 in the absence of Set2p and Rpd3p is a
consequence of increased acetylation of histones.
Consistent with this hypothesis, Merker et al. (2008) also demonstrated an elevated
acetylation level of histone H3 lysine 27 (H3K27) in the set2Δ and rpd3Δ strains
adjacent to the meiosis-specific DSB site of HIS4. Specifically, the levels of H3K27
acetylation were analysed at four regions flanking the DSB site, within approximately
200 bp and 1 kb of both upstream and downstream of the DSB site (Merker et al.,
2008). All four regions were hyperacetylated at the H3K27 sites in set2Δ and rpd3Δ,
and stronger enrichments were observed at regions nearer to the DSB sites (Merker et
al., 2008). These observations suggest a link between increased levels of histone
acetylation with the HIS4 hotspot activity.
The regulation of Bas1/2p on the transcription of HIS4 and other Bas1/2p-target genes
has also been demonstrated to be associated with histone acetylation and the
presence of HAT activity. Valerius et al. (2003) demonstrated that the activation of
HIS7 transcription by Bas1/2p, under adenine starvation condition, requires the Gcn5p-
mediated acetylation of histones. GCN5 encodes a HAT protein that targets lysine
residues of H2B and H3 including H3K27, and exists predominantly as a subunit of
chromatin-modifying complexes including SAGA and ADA (Lee and Young, 2000). Yu et
al. (2006) demonstrated that the transcription of HIS4 is dependent on Gcn5p since
deleting GCN5 results in a significant reduction of HIS4 expression (Yu et al., 2006).
Furthermore, point mutations of H3K14 and H3K18, which are the important targets of
Gcn5p, also led to a strong reduction of HIS4 transcription activity (Yu et al., 2006). In

153
the ADE5,7 promoter, it has been reported that an increased occupancy of Bas1/2p in
response to adenine deprivation requires chromatin remodelling complexes SAGA and
SWI/SNF (Koehler et al., 2007). Taken together, these observations may suggest that
Bas1/2p regulate transcription of their target genes through the activity of specific HAT
complexes.
As with other hotspots, it has been hypothesised that histone hyperacetylation
(resulted from loss of Set2p and Rpd3p) stimulates recombination at HIS4 by
promoting an accessibility of chromatin to recombination machinery (Merker et al.,
2008). It has also been suggested that the transcription factors Bas1/2p and/or Rap1p
could be involved in recruiting histone modifying proteins to the hotspot site (Merker
et al., 2008). In this chapter, we aimed to investigate if Bas1p is involved in the
activation of the HIS4 hotspot in the absence of Set2p. The effect of adenine and
amino acid starvation upon recombination at HIS4 in the set2Δ strain was also
investigated. This is to determine if the HIS4 hotspot activity can be stimulated further
by modulating extracellular nutrient composition during sporulation when the Set2p
methyltransferase is inactivated.
5.1.2 Post-Translational Modification Associated with Bas1p and Bas2p
5.1.2.1 Phosphorylation of Swi5p and Pho4p (Bas2p Partner Proteins) Activates
Transcription of the HO and PHO Genes Respectively
Bas2p regulates transcription of several groups of genes in conjunction with at least
three different co-activators, Bas1p, Pho4p and Swi5p (Section 1.5.3.2). Bas2p/Pho4p
activates the expression of PHO5 gene encoding a secreted acid phosphatase in
response to deprivation for inorganic phosphate (Barbarid et al., 1996). Bas2p/Swi5p
154
mediates the expression of the HO endonuclease, which initiates mating type
switching, in response to cell cycle signals (Brazas and Stillman, 1993a).
The regulation of Pho4p and Swi5p in activating their target genes upon interaction
with Bas2p involved phosphorylation (Nasmyth et al., 1990, O'Neill et al., 1996). The
mechanisms by which phosphorylation regulates the activity of several transcription
factors in response to internal or external signals includes conformational changes,
altering their subcellular localisation, DNA binding activity or interaction with co-
regulators (Locker, 2000). Swi5p and Pho4p are examples of transcription factors that
are regulated through subcellular localisation by phosphorylation.
The activation of PHO5 by Bas2p/Pho4p in response to deprivation of inorganic
phosphate is regulated by dephosphorylation of Pho4p (Komeili and O'Shea, 1999, Liu
et al., 2000). In high phosphate conditions, Pho80p/Pho85p (a cyclin/cyclin-dependent
kinase complex) mediates phosphorylation of Pho4p which inhibits its nuclear entry,
promotes its nuclear export, and prevents interaction with Bas2p (Schneider et al.,
1994, Komeili and O'Shea, 1999). Under starvation for inorganic phosphate,
Pho80/Pho85 are inactivated, leading to an increased interaction of Pho4p and Bas2p,
hence stimulates the expression of PHO5 (Schneider et al., 1994, Kaffman et al., 1994).
The activation of PHO5 transcription by Bas2p/Pho4p also requires phosphorylation of
Bas2p, possibly by Cdc28 kinase (Liu et al., 2000).
The transcriptional regulation of the HO gene by Swi5p is more complex, and is known
to require phosphorylation of Swi5p by the Cdc28 kinase (Moll et al., 1991).
Phosphorylation of Swi5p inhibits its nuclear entry at the G2 phase of the cell cycle,
while inactivation of the Cdc28 kinase facilitates entry into nucleus on the start of the

155
G1 phase and activates HO gene expression (Moll et al., 1991). In addition, Swi5p needs
to interact with Bas2p to facilitate binding specificity of Swi5p and stimulate high level
of HO transcription (Brazas and Stillman, 1993a, Brazas and Stillman, 1993b). Since
both Pho4p and Swi5p are co-partners with Bas2p, it has been thought that the
regulation of Bas1/2p on the expression of their target genes also involved subcellular
localisation of Bas1p. However, Som et al. (2005) showed that Bas1p does not exhibit
changes in subcellular localisation even when its interaction with Bas2p is stimulated
by adenine deprivation (Som et al., 2005). Nevertheless, whether the interaction
between Bas1p and Bas2p can be regulated by phosphorylation of Bas1p is yet to be
determined.
5.1.2.2 Phosphorylation Associated with Bas1p
In Chapter 4, we have demonstrated that starvation for adenine and amino acids
during sporulation elevates HIS4 recombination even when the production of AICAR
was completely blocked from both the purine and histidine biosynthesis pathways. The
observation suggests that some of the starvation-induced recombination activity that
was mediated by Bas1/2p can occur in an AICAR-independent manner. This raises the
question of what promotes interaction between Bas1p and Bas2p without AICAR.
One of the possibilities considered is that the formation of Bas1/2p complex is partially
mediated via phosphorylation of Bas1p which alters its conformation, hence facilitates
its interaction with Bas2p (Section 4.4.4). Furthermore, a system-wide analysis of
phosphorylation in S. cerevisiae had identified a phosphorylation site at the amino acid
653 of Bas1 protein when cells were grown in a complete-supplemented growth

156
condition (Bodenmiller et al., 2010). This suggests that Bas1p can be phosphorylated
under a normal growth condition.
Bas1p has also been suggested to be a substrate of the Snf1 protein kinase based on a
regulatory network of Snf1p (Usaite et al., 2009). The interaction map was constructed
by measuring the abundance of genes, proteins and metabolites in the absence of
SNF1, followed by integration with previously compiled data (Usaite et al., 2009). The
study suggested that Bas1p can be positively regulated by Snf1 kinase, since deleting
SNF1 results in significantly lower abundance of BAS1 expression relative to the wild
type (Usaite et al., 2009). Snf1 kinase plays essential functions in metabolic control in
response to various nutrients and environmental stress conditions including glucose
and nitrogen deprivation, and oxidative stress (Orlova et al., 2006, Hong and Carlson,
2007). In addition, Snf1p also plays an important role in regulating entry into meiosis,
presumably by controlling cell adaptation for growth on media with acetate as the
carbon source (Honigberg and Lee, 1998).
Interestingly, the mammalian homolog of SNF1 is the AMP-activated kinase (AMPK),
which is known to be activated by AICAR (Stefanelli et al., 1998). However, a genome-
wide study of gene transcription by Pinson et al. (2009) suggested that AICAR has no
effect on Snf1 kinase activity in S. cerevisiae. This was based on the observation that
modulating the amount of AICAR did not appear to affect expression of genes that
were known to be strongly regulated by Snf1p. Nevertheless, an AICAR-independent
activation of Snf1 kinase on Bas1p may be possible. In this chapter, we attempted to
investigate the phosphorylation status of Bas1p under different nutritional conditions,
including intracellular and extracellular starvation for adenine.

157
5.1.3 Meiotic-Null Allele of Bas1p
In Chapter 4, we showed that the HIS4 hotspot activity was elevated in response to
constant starvation before and during sporulation for adenine and amino acids. This
effect is mediated by Bas1p. Here, we wished to determine if the Bas1p-mediated
changes leading to elevated recombination would persist in meiosis, in the absence of
further expression of Bas1p. In order to test this, we wanted to generate a meiotic-null
allele of BAS1.
The promoter of the CLB2 gene is often used to generate meiotic-null alleles of various
genes, including SGS1 (Lee and Amon, 2003, Amin et al., 2010) and SCC3 (Lin et al.,
2011). This is because the CLB2 promoter does not facilitate gene expression in meiosis
but functions only during vegetative growth (Grandin and Reed, 1993). The expression
of SGS1 during meiosis has been shown to be switched off when CLB2 was used to
replace the endogenous promoter of SGS1 (Lee and Amon, 2003). Therefore, we
sought to create a meiotic-null allele of BAS1 by controlling its expression using the
CLB2 promoter. We would then determine the effect of pre-meiotic growth conditions
on recombination at HIS4. These include nutritional starvation conditions, the Set2p-
mediated histone hyperacetylation, and other modifications of the chromatin
structure.
5.1.4 Aims
1. To determine the effect of adenine and amino acid starvation during
sporulation on recombination at HIS4 in the absence of the Set2p
methyltransferase.

158
2. To investigate the influence of nutritional starvation on phosphorylation state
of Bas1p.
3. To create and analyse a meiotic-null mutant of BAS1.
5.2 Materials and Methods
5.2.1 Materials
5.2.1.1 Media
Low phosphate growth medium (LP-YEPD) was prepared by mixing 1% (w/v) Bacto
yeast extracts, 2% (w/v) Bacto peptone, 0.24% (w/v) magnesium sulphate (BDH) and 1
in 100th volume of ammonium hydroxide (Fisher Scientific). The mixture was then
incubated at room temperature to allow precipitation of phosphate. The mixture was
twice vacuum-filtered using a 0.22 µm filter circle (Milipore) before adding 2% (w/v)
glucose. The medium was then adjusted to pH 6.5 to 7.0 with 6 M HCl before
autoclaving, and stored at 4°C.
5.2.1.2 Antibodies
For immunoblotting experiments, a mouse anti-HA monoclonal antibody (Santa Cruz)
or mouse anti-Myc monoclonal antibody (Santa Cruz) were used as primary antibodies.
A rabbit anti-mouse antibody (Santa Cruz) was used as the secondary antibody. For
immunoprecipitation of Myc-tagged proteins, immobilised Myc-Tag mouse
monoclonal antibody (Cell Signaling Technology) was used following manufacturer’s
guidelines. For the loading control, rat monoclonal α-tubulin antibody (Santa Cruz) was
used as the primary antibody, and a goat anti-rabbit antibody conjugated to
horseradish peroxidase (Santa Cruz) was used as the secondary antibody.

159
5.2.2 Methods
5.2.2.1 PCR-Based Chromosomal Gene Modification
The PCR-mediated technique for chromosomal gene modification was used to
generate a meiotic-null allele of BAS1, as well as for epitope tagging of endogenous
BAS1 (Longtine et al., 1998). To generate the meiotic-null allele, a pFA6a-pCLB2-HA3-
KanMX6 plasmid was used as the PCR template for insertion of the CLB2 promoter into
BAS1. PCR primers were designed to contain 60 bp sequence complementary to
regions immediately upstream and downstream of the start codon of BAS1, and 20 bp
sequence homologous to the plasmid (Table 2.2). Subsequent transformation of the
PCR product into genomic DNA will replace the native ATG start codon with the pCLB2-
HA3-KanMX6 construct. Transformants were selected on a G418-400 medium to select
for cell colonies that contains the KanMX6 marker (Table 2.4; Section 2.1.3).
A similar method was used for epitope tagging of BAS1. In particular, the carboxyl
terminal region of Bas1p was tagged with either thirteen copies of a Myc epitope or
three copies of an HA epitope using the PCR-mediated approach. As above, PCR
primers were designed with additional sequences that were homologous to the
sequence immediately upstream and downstream of the stop codon of BAS1. The
pFA6a-HA3-KanMX6 and pFA6a-myc13-KanMX6 plasmids were used as PCR templates
for generating BAS1-HA3 and BAS1-myc13 strains respectively. These tags were
transformed into yeast chromosomal locations by homologous recombination and
selected on the G418-400 medium. Successful integrants were confirmed by PCR and
DNA sequencing using primers listed in Table 2.5 (Section 2.2.7).

160
5.2.2.2 Preparation of Protein Extracts
The following method was used for all protein experiments except for the [32P]-
orthophosphate labelling (Section 5.2.2.5). For protein expression analysis of the
vegetatively grown cells, diploids were streaked as single colonies on a solid YEPD
medium and incubated overnight at 30°C. A single colony was then inoculated in 5 ml
liquid growth media, either YEPD or synthetic minimal medium, and incubated
overnight at 30°C with shaking. The following day, the culture was diluted 1:10 by
transferring into a 250 ml conical flask containing 45 ml of the same media and further
grown at 30°C with shaking.
Cells that were grown in minimal medium were left to grow overnight, while cells
grown in YEPD medium were cultured for five hours until the culture reached an ODλ600
of 1.0 to 2.0. Phenylmethylsulfonyl fluoride (PMSF [Sigma]; dissolved in isopropanol)
was added to cultures at a final concentration of 1 mM and incubated for 30 seconds
with shaking at 30°C. Cells were then harvested in a 50 ml Falcon tube by
centrifugation at 3500 r.p.m for 5 minutes at 4°C. 40 ml ice-cold Tris-buffered saline
(TBS) solution (20 mM Tris-HCl pH 7.5 and 150 mM NaCl) was used to wash the cells
before pelleted again by centrifugation at 3500 r.p.m for 5 minutes at 4°C. Prior to cell
lysis, the residual solution was completely removed from the pellet.
For lysis, the pellet was resuspended in 400 µl cold B60 buffer (50 mM Hepes-KOH pH
7.3, 60 mM K-Acetate, 5 mM Mg-Acetate, 0.1% (w/v) Triton-X 100, 10% (w/v) glycerol,
1 mM sodium fluoride, 20 mM glycerophosphate, 1 mM DTT, a capsule of proteinase
inhibitor [Roche] and 1 mM PMSF). Cells were then transferred into a fresh tube
containing approximately 250 µl of glass beads (Sigma). A Bead Beater was used at

161
maximum speed for 1 minute to shear cells before pelleted by centrifugation for 5
minutes at 4°C (13,000 r.p.m). The supernatant was transferred to a fresh tube and
centrifuged again for 20 minutes at 4°C to remove any remaining cell debris.
Approximately 300 µl (50 mg/ml) of the cleared protein lysate in the supernatant were
transferred to a new tube. Each protein samples were quantified using 2.0 µl of each
sample on a NanodropTM ND-1000 spectrophotometer according to manufacturer’s
instructions (Section 2.2.10). The protein extracts were then incubated with 0.2
volumes 5x Laemmli-buffer (60 mM Tris-HCl pH 6.8, 2% (w/v) SDS, 10% (v/v) glycerol,
5% (v/v) β-mercaptoethanol, 0.1% (w/v) bromophenol blue) at 95°C for 5 minutes prior
to run on SDS-PAGE.
5.2.2.3 Western Blot Analysis
Proteins were separated on the Sodium Dodecyl Sulphate Polyacrylamide Gel
Electrophoresis (SDS-PAGE). A standard 8% (w/v) separating gel (0.38 M Tris (pH 8.8),
8% (w/v) acrylamide mix (Protogel), 0.1% (w/v) SDS (Fisher Scientific), 0.1% (w/v)
ammonium persulfate and 9 μl TEMED) was used unless otherwise stated. A thin layer
of approximately 200 μl isopropanol was used to level the gel. After the gel set and
isopropanol removed, approximately 2 ml stacking gel (0.125 M Tris-HCl pH 6.8, 0.1%
(w/v) SDS, 6% (w/v) acrylamide mix, 0.2% ammonium persulfate and 5 µl TEMED) was
poured and left to polymerise. Protein samples (normalised to contain the same
amount of proteins) were loaded in each lane, together with an appropriate marker
(Section 2.1.6). Electrophoresis was carried out for 45 minutes at 200 volts in running
buffer (25 mM Tris-HCl, 0.2 M glycine (Fisher Scientific) and 0.1% (w/v) SDS, pH 8) until
sufficient separation was obtained.

162
The proteins were then transferred to a Polyvinylidene fluoride (PVDF) membrane
(Millipore) treated with 100% methanol using wet or semi-dry electrophoresis transfer
methods. Typical wet transfer was mediated by electrophoresis at 100 volts for one
hour and buffered by cold blotting buffer A (25 mM Tris-HCl, 0.2 M glycine, 0.1% (w/v)
SDS and 2% (v/v) methanol). Semi-dry transfer was carried out at room temperature
using blotting buffer B (192 mM glycine, 0.2 (v/v) methanol, 0.1% (w/v) SDS and 0.3%
(w/v) Tris-HCl) mediated by electrophoresis at 25 volts for one hour. The PVDF
membrane was then incubated in blocking solution (5% (w/v) milk solution in 1x TBST)
for 30 minutes.
Following blocking, the membrane was incubated in primary antibody diluted 1 in
1000 in blocking solution and incubated on rocker for 2 hours at room temperature.
The primary antibody was washed off from the membrane three times in 1x TBST. The
membrane was then incubated in secondary antibody diluted 1 in 1000 in blocking
solution and incubated on rocker for 2 hours at room temperature. The membrane
was washed three times in 1x TBST. The band was visualised with ECL reagent
(Biological industries) and X-ray film (Fujifilm).
5.2.2.4 Protein Immunoprecipitation
Protein extracts (2 mg/ml) were immunoprecipitated with 10 μl immobilised Myc-Tag
mouse monoclonal antibody at 4°C with rotation overnight. The following day, beads
were pelleted by centrifugation at 5,000 r.p.m for one minute. Immunoprecipitates
were then washed with 1 ml TBS buffer (20 mM Tris pH 7.4, 150 mM NaCl, 3 mM EDTA
and 0.5% Nonidet P-40) and harvested again by gentle centrifugation as above. The
washing step was repeated twice more. 0.2 volumes 5x Laemmli buffer (section 5.2.2.2)

163
was mixed with the remaining beads and subsequently boiled at 95°C for 5 minutes.
Approximately 2 mg of the immunoprecipitated protein sample was separated on 8%
(w/v) SDS gel, and western blot was performed as described above (Section 5.2.2.3).
5.2.2.5 [32P]-orthophosphate Labelling
[32P]-orthophosphate labelling is a radioactive method to detect protein
phosphorylation. Yeast cells were grown in 5 ml YEPD overnight at 30°C with shaking.
The next day, the culture was diluted 1:10 by transferring into a flask containing 45 ml
YEPD and further grown for 4 to 5 hours. 5 ml of the culture were transferred to a
Falcon tube and cells were harvested. Cells were then resuspended in 2 ml low
phosphate growth medium (Section 5.2.1.1). The culture was added with 100 µCi/ml
[32P]-orthophosphate (GE Healthcare) and incubated for 2 hours on a rotating wheel at
room temperature. Reaction mixtures were then lysed with an YPER lysis solution
(Yeast Protein Extraction Reagent [Thermo Fisher Scientific]) and treated according to
the manufacturer’s guidelines. Proteins were quantified by Bradford assay (Bradford
reagent, BioRad), and immunoprecipitated with 10 μl immobilised Myc-Tag mouse
monoclonal antibody.
The immunoprecipitated proteins were then added with 0.2 volumes 5x Laemmli buffer
and heating at 95°C for 5 minutes before resolved by 8% SDS-PAGE gel for 45 minutes.
Proteins were then transferred to a nitrocellulose membrane (Milipore) using a semi-
dry electrophoresis transfer method for one hour (Section 5.2.2.3). The presence of
protein phosphorylation was first determined by visualising the signal of radioactive
phosphate using a STORM phosphor-imager (GE Healthcare). Once phosphorylation

164
signal was detected, the membrane was subsequently exposed to autoradiographic
film (Fujifilm) for two to seven days at -80°C.
Following exposure to autoradiography, the membrane was subsequently incubated in
blocking solution (Section 5.2.2.3) for 30 minutes followed by incubation with rabbit
anti-Myc polyclonal antibody (1:1000 dilution in blocking solution) for 2 hours. The
membrane was then washed three times with 1x TBST, and incubated in secondary
antibody (1:1000 dilution in blocking solution) for 2 hours. The membrane was then
washed three times with 1x TBST. The band was visualised with ECL reagent (Biological
industries) and X-ray film (Fujifilm).

165
5.3 Results
5.3.1 Recombination Frequencies at HIS4 were Elevated in the set2Δ Strain
It has previously been reported that the HIS4 hotspot activity was increased by the
deletion of SET2 in the S288C strain background (Merker et al., 2008). This is
presumably due to the loss of deacetylation by Rpd3p, which results in
hyperacetylation of histone H3 lysine 27 (H3K27). Here, we asked if the effect of SET2
inactivation on recombination is similar in the Y55 strain background, and whether
nutritional starvation can further activate recombination in the set2Δ strain.
As expected, the level of NMS increased in the set2Δ strain (28.6%) as opposed to the
wild type under non-starvation condition (12.9%; P = 2.4 x 10⁻⁶; Figure 5.2). Under
starvation for adenine, uracil and amino acids during sporulation, the level of NMS was
further elevated (41.4%) compared to the non-starvation condition (P = 0.002; Figure
5.1 and 5.2). Correspondingly, crossovers at NAT-HYG flanking HIS4 were also elevated
in the set2Δ strain relative to the wild type, and further increased in response to
starvation (P = 9.5 x 10⁻⁷ and 0.02 respectively; Table 5.1). These data suggest that
starvation for adenine, uracil and amino acids can further increase recombination at
HIS4 in the absence of Set2p methyltransferase activity.
Interestingly, we found that crossing over in the HYG-LEU2 interval were unaffected in
set2Δ cells sporulated on complete KAc compared to the wild type strain. Similarly, no
effect was observed in crossing over when the set2Δ cells were starved during
sporulation as opposed to that sporulated with complete nutrients. These
observations did not correspond to significant changes of crossing over in the adjacent

166
Figure 5.2 : The level of NMS at HIS4 in the wild type and set2Δ strains sporulated with
complete and minimal (without adenine, uracil and amino acid) nutritional
supplements. *P-value of pair wise comparisons of data that are significantly different
from each other; a) P = 5 x 10⁻⁴, b) P = 0.002 and c) P = 2.4 x 10⁻⁶.
*b
*c
*a

167
Table 5.1 : Map distances in different genetic intervals on chromosome III in the set2Δ strain under different sporulation conditions
Strains Sporulation
Condition
Genetic intervals
NAT – HYG HYG – LEU2 LEU2 – MAT
PD NPD TT cM§ PD NPD TT cM PD NPD TT cM
Wild type Complete KAc 307 3 68 11.4 305 2 72 11.1 162 15 205 38.6
Wild type Minimal KAc 161 2 34 11.7 176 0 23 5.8 94 6 101 31.1
set2Δ Complete KAc 133 4 80 24.0‡ 172 0 44 10.2 102 3 112 30.0
set2Δ Minimal KAc 155 7 152 30.9#‡ 281 0 40 6.2 147 12 163 36.5
§Map distances were calculated in centiMorgan (cM) according to Perkins (1949). PD is parental ditype, NPD is non-parental ditype and TT is
tetratype. ‡Represent values that are significantly different compared to the wild type sporulated on complete KAc. #Significantly different
compared to the set2Δ strain sporulated on complete KAc.

168
NAT-HYG interval under similar conditions. These data may suggest that crossover
interference does not occur when the SET2 gene is inactivated.
5.3.2 Bas1p is Required for the Increased Level of HIS4 Recombination in the
set2Δ Strain
As shown above, our data supports the previous observation by Merker et al. (2008) in
which the HIS4 hotspot activity is stimulated by deleting the SET2 gene. In addition, the
level of recombination at HIS4 in the absence of Set2p was further increased in
response to starvation during sporulation. We then asked if the starvation effect on
recombination in the set2Δ strain is mediated by Bas1p.
Our data demonstrated that the level of NMS in the set2Δ bas1Δ strain was
significantly reduced compared to the single set2Δ strain, both under non-starvation
and starvation conditions (P = 1.3 x 10⁻¹² and 6.7 x 10⁻³¹; Figure 5.3). Similarly,
crossovers in the NAT-HYG region were reduced in set2Δ bas1Δ as compared to set2Δ
under both non-starvation and starvation conditions (P = 5.4 x 10⁻¹¹ and P = 3.8 x 10⁻¹⁸
respectively; Table 5.2). These data suggested that Bas1p is involved in the activation
of recombination at HIS4 in the absence of SET2.

169
Figure 5.3 : The level of NMS at HIS4 in the set2Δ and set2Δ bas1Δ strains sporulated
with complete and minimal nutritional supplements. *P-value of pair wise comparisons
of data that are significantly different from each other; a) P = 6.7 x 10⁻³¹, b) P = 1.3 x
10-12 and c) P = 0.002.
*c
*a
*b

170
Table 5.2 : Map distances in different genetic intervals on chromosome III in the set2Δ, set2Δ bas1Δ and bas1Δ strains under different
sporulation conditions
Strains Sporulation
Condition
Genetic intervals
NAT – HYG HYG – LEU2 LEU2 – MAT
PD NPD TT cM PD NPD TT cM PD NPD TT cM
set2Δ Complete KAc 133 4 80 24.0 172 0 44 10.2 102 3 112 30.0
set2Δ Minimal KAc 155 7 152 30.9# 281 0 40 6.2 147 12 163 36.5
set2Δ bas1Δ Complete KAc 280 0 45 6.9‡ 246 0 82 12.5 148 16 165 39.7
set2Δ bas1Δ Minimal KAc 252 0 55 9.0‡ 238 0 68 11.1‡ 153 5 150 29.2
‡Represent values that are significantly different compared to the corresponding set2Δ. #Significantly different compared to the same strain
sporulated on complete KAc.

171
5.3.3 Insertion of the HA3 and CLB2-HA3 Constructs Inactivates Bas1p
In this study, we generated two different constructs of the HA-tagged Bas1p; one was
tagged at the carboxyl terminus (BAS1-HA3), whilst another construct contains a CLB2
promoter that was inserted in the amino terminus of Bas1p (pCLB2-HA3-BAS1). The
pCLB2-HA3-BAS1 strain was generated with the aim to generate a meiotic-null allele of
Bas1p, using the CLB2 promoter to lead expression only during mitosis. In contrast, the
BAS1-HA3 strain was generated for experiments that involved analysing Bas1p
expression (e.g., radioactive labelling of Bas1p, Section 5.3.5).
Following addition of the epitopes into BAS1, it is important to determine whether the
altered Bas1p retains its function as in the wild type strain. We first investigated if
Bas1p is functional during mitotic growth in the pCLB2-HA3-BAS1 and BAS1-HA3 strains
by determining if they could support growth in the absence of Gcn4p. It has been
shown that cells wild type for histidine biosynthesis (His+) were unable to grow in the
absence of histidine, if they lack both Bas1p and Gcn4p (Section 1.5.3.1) (Arndt et al.,
1989). Therefore, we analysed the growth of pCLB2-HA3-BAS1 and BAS1-HA3 cells with
a wild type His+ phenotype and mutated gcn4, on media lacking histidine (Figure 5.4).
The pCLB2-HA3-BAS1 gcn4Δ and the BAS1-HA3 gcn4Δ cell colonies did not grow on the
histidine omission medium after two days of incubation, similar to the phenotype of a
bas1Δ gcn4Δ double deletion (Figure 5.4). This result indicates that the pCLB2-HA3-
BAS1 strain is inactivated in mitotic growth. Together with the observation of lack of
growth of BAS1-HA3 gcn4Δ, this may suggest that insertion of the HA3 construct can
disrupt normal Bas1p function.

172
Genetic analysis of the homozygous pCLB2-HA3-BAS1 and BAS1-HA3 strains
demonstrated significantly lower levels of NMS as compared to the wild type (P = 2.3 x
10-4 and 9 x 10⁻⁴ respectively). Furthermore, the levels of NMS in these strains were
not significantly different compared to bas1Δ (Table 5.3). Therefore, this suggests that
Bas1p in the pCLB2-HA3-BAS1 and BAS1-HA3 strains is not functional in meiosis.
Interestingly, heterozygosity of BAS1-HA3 (BAS1-HA3 / wild type) results in reduced
level of NMS compared to the homozygous wild type (BAS1) strain (P = 2 x 10⁻⁴; Table
5.3). In addition, this level of NMS in the heterozygous BAS1-HA3 strain was not
significantly different than the homozygous bas1Δ strain. These observations raised
the possibilities that BAS1-HA3 may be a dominant negative mutant or that the BAS1
gene is haploinsufficient. Therefore, in Chapter 6, we tested the possibility that BAS1
may exhibit haploinsufficiency.
5.3.4 BAS1-myc13 Exhibited Normal Vegetative Growth and Expression
It is important to generate a functional epitope-tagged Bas1p for experiments
involving Bas1p phospho-labelling. Since the HA-tagged Bas1p strains were not
functional, a BAS1-myc13 strain construct was generated and the functionality of Bas1p
analysed. We first evaluated the growth phenotype of BAS1-myc13 strain in the
absence of Gcn4p on histidine omission medium (Figure 5.4B.i). The BAS1-myc13 gcn4Δ
strain was able to grow on the medium after two days of incubation at 30°C, indicating
that Bas1p is functional in the BAS1-myc13 strain construct. A single band of
approximately 120 kDa was also detected from immunoblot analysis which correlates
to the size of BAS1-myc13 protein, confirming that Bas1p is present (Figure 5.6).

173
Figure 5.4 : Growth phenotype of various strains (all containing a His+ phenotype except the wild type Y55 3569 strain which contains a His-
phenotype) on the histidine omission medium (A and B); and on the synthetic complete medium (C and D) after two days of incubation at 30°C.
Strains shown in the figure are as follows:
A and C: i) pCLB2-HA3-BAS1 gcn4Δ ii) bas1Δ gcn4Δ iii) gcn4Δ iv) bas1Δ v) wild type (Y55 2830) vi) wild type (Y55 3569) B and D: i) BAS1-myc13 gcn4Δ ii) bas1Δ gcn4Δ iii) wild type (Y55 2830) iv) BAS1-HA3 gcn4Δ v) gcn4Δ vi) bas1Δ
A C
B D
i) ii)
iii)
iv
)
v
)
vi
)
i) ii
)
iii
)
iv) v
)
vi)
i) ii)
iii)
iv
)
v
)
vi
)
i) ii
)
iii
)
iv
)
v
)
vi
)

174
Table 5.3 : Reduction in the level of NMS at HIS4 in the pCLB2-HA3-BAS1 and BAS1-HA3
strains
Strain Genotype NMS Total % NMS at HIS4
BAS1 / BAS1 50 388 12.9
pCLB2-HA3-BAS1 / pCLB2-HA3-BAS1 8 201 3.9‡
BAS1-HA3 / BAS1-HA3 9 195 4.6‡
BAS1-HA3 / BAS1 9 218 4.2‡
bas1Δ / bas1Δ 6 331 1.8‡
‡Represent data that are significantly different compared to the corresponding wild
type. The G-test of homogeneity was used for the comparison.

175
To determine if Bas1p remains active for recombination in meiosis, the level of NMS at
HIS4 in the BAS1-myc13 strain was also examined (Table 5.4). For the homozygous
BAS1-myc13 diploid, the level of NMS remained unchanged compared to the wild type
strain. Similarly, no significant difference in the level of NMS was observed for strains
that are heterozygous for BAS1-myc13, as opposed to the homozygous wild type
diploid. These data indicate that Bas1p retains its meiotic function in the BAS1-myc13
construct, and that no dominant negative effect of BAS1-myc13 was observed on gene
conversion at HIS4.
Table 5.4 : Comparison between the levels of NMS at HIS4 in the homozygous BAS1-
myc13, heterozygous BAS1-myc13 and the homozygous bas1Δ Strains
Strain Crosses (Y55) Relevant Genotype NMS / Total Tetrads
% NMS
2830 x 3569 BAS1 / BAS1 50 / 388 12.9
3634 x 3635 BAS1-myc13 / BAS1-myc13 31 / 216 14.4
3635 x 2830 BAS1-myc13 / BAS1 28 / 222 12.6
3634 x 3569 BAS1-myc13 / BAS1 24 / 224 10.7
3612 x 3613 bas1Δ / bas1Δ 6 / 331 1.8‡
‡Represent data that are significantly different compared to the corresponding wild
type. The G-test of homogeneity was used for the comparison.

176
Figure 5.6 : Western blot analysis of mitotic expression of BAS1-myc13 (first lane)
showed a single band of approximately 120 kDa, the expected size of BAS1-myc13. No
band was detected at the corresponding position in the second lane of the untagged
wild type strain.
BAS1-myc13
BAS1
130
170
95
72
55
43
34
M Wt (kDa)

177
5.3.5 Potential Phosphorylation of Bas1p under Starvation and Non-starvation
Conditions
In this study, we attempted to investigate if BAS1-myc13 is phosphorylated during
vegetative growth under different nutritional conditions. A preliminary test included
the wild type and BAS1-myc13 strains grown in liquid YEPD medium, as well as the
BAS1-myc13 and BAS1-myc13 ade1∆ grown in synthetic minimal medium. The study
aimed to determine if there is any alteration in the level of expression and
phosphorylation of BAS1-myc13 when cells were grown in rich and minimal nutritional
conditions (deprived of adenine and amino acids), and when auxotrophic for adenine
(ade1Δ).
We initially carried out western blotting of proteins prepared from BAS1-myc13, BAS1-
myc13 ade1∆ and wild type strains that were sheared using the bead beater and B60
buffer (Section 5.2.2.2) to see if BAS1-myc13 were present in these strains. Bands of
approximately 120 kDa were observed for BAS1-myc13 and BAS1-myc13 ade1∆ samples
under both starvation and non-starvation conditions, which correlate with the
expected size of BAS1-myc13 (Figure 5.7A). No band was observed for the untagged
wild type strain that was used as a negative control. This suggests that BAS1-myc13 is
normally expressed under rich and minimal vegetative growth conditions.
Since the protocols involving the bead beater cannot be used for shearing
radioactively-labelled cells, another method needs to be used. Therefore, a YPER lysis
buffer (Yeast Protein Extraction Reagent [Thermo Fisher Scientific]) was used to extract

178
Figure 5.7 : A. Western blot showing expressions of BAS1-myc13 and BAS1-myc13 ade1∆
vegetatively grown in YEPD and synthetic minimal media. No bands were observed for
untagged wild type strain under both conditions. B. α-tubulin antibody was used as the
loading control. C. Western blotting of immunoprecipitated BAS1-myc13 that were
prepared using YPER lysis method. Precision plus protein marker (Biorad) was used as
the molecular weight standard in this experiment.
C
BAS1-myc13
BAS1
130
170
95
72
55
43
34
A
B
YEPD Minimal
BAS1-myc13
BAS1 BAS1-myc13
BAS1-myc13
ade1Δ
BAS1 BAS1-myc13
ade1Δ
M Wt (kDa)

179
labelled proteins (Section 5.2.2.5). To determine if this is sufficient for the
phosphorylation experiment, we first performed immunoprecipitation and subsequent
western blotting of BAS1-myc13 prepared from unlabelled cells that were purified using
YPER. A band of the expected size of BAS1-myc13 was observed, suggesting that lysis
was successful (Figure 5.7C).
To determine the phosphorylation status of Bas1 protein, a radioactive labelling was
obtained by incorporating [32P]-orthophosphate. The labelled proteins were
immunoprecipitated with the immobilised Myc-Tag mouse monoclonal antibody to
pull-down Bas1p, before being separated by SDS-PAGE, and transfer to nitrocellulose
membrane and visualised by a STORM phosphor-imager and autoradiography. A
preliminary experiment showed a phosphorylated band with the size of approximately
120 kDa for all samples with BAS1-myc13, grown with complete nutrients and under
starvation conditions (Figure 5.8A). Approximately three to four other bands of varying
sizes were also observed, possibly the product of protein degradation.
Subsequent immunoblotting of the same membrane with rabbit polyclonal anti-Myc
antibody recognised faint bands at approximately the size that also correlates with
BAS1-myc13 (Figure 5.8B). Furthermore, no band was detected for the negative control
in both the western blot and autoradiography when the Myc-tag was absent (Figure
5.8A). Since no band was also observed in the western blot for the expected heavy
chain of immunoglobulin (approximately 50 kDa) at the second lane of the negative
control, this suggests that no protein extract is present in the second lane.

180
Figure 5.8: A. Potential phosphorylation of Bas1 protein. Autoradiograph of samples
immunoprecipitated from [32P]-orthophosphate labelled cells prepared from strains
grown in liquid YEPD medium (wild type and BAS1-myc13) and synthetic minimal
medium (BAS1-myc13 and BAS1-myc13 ade1∆). Bands of approximately 120 kDa were
recognised, correlated with the size of BAS1-myc13. B. Western blot analysis of the
same membrane showed bands with size that correlates with BAS1-myc13 and the
phosphorylated bands. No bands were detected on the second lane of untagged wild
type which serves as negative control. Bands of the size of heavy chain (HC) IgG were
only detected in lane 1, 3 and 4 suggesting that proteins may not be present on lane 2
of the negative control.
150
100
75
50
25
Bas1p
HC IgG
B
BAS1-myc13
BAS1-myc13
ade1Δ BAS1-myc13
BAS1
YEPD Minimal
M Wt (kDa)
M Wt (kDa)
150
100
75
50
25
Potential phosphorylation of Bas1 proteins
A
BAS1-myc13
BAS1-myc13
ade1Δ BAS1-myc13
BAS1
YEPD Minimal

181
5.4 Discussion
5.4.1 Bas1p is Required to Stimulate HIS4 Hotspot Activity on the Loss of Set2p
Methyltransferase under Starvation and Non-Starvation Conditions
In this study, we confirmed previous observation by Merker et al. (2005) that deletion
of Set2p methyltransferase increases the level of recombination (Figure 5.2 and Table
5.1). Loss of Set2p and Rpd3p deacetylase has also been shown to elevate the
formation of DSBs and hyperacetylates H3K27 at regions near the DSB site (Merker et
al., 2008). Therefore, it has been proposed that the increased recombination activity in
set2Δ is the result of histone acetylation, which provides a favourable chromatin
condition to recombination machinery.
A strong reduction in the level of recombination at HIS4 in the set2Δ bas1Δ strain was
also observed compared to the set2Δ strain (Figure 5.3 and Table 5.2). These data
suggest that Bas1p is required in the stimulation of HIS4 hotspot activity even when
Set2p is inactivated. This also implies that the potential ‘open’ chromatin structure,
mediated by inactivating Set2p, is not enough to activate recombination without the
presence of Bas1p. Moreover, we also found that by starving the set2Δ cells for
adenine and amino acids during sporulation, a further elevation of recombination
activity was observed (Figure 5.2 and Table 5.1). Similar experiments have not been
performed on RPD3 because mutation of the gene results in sporulation defect of cells.
However, it is possible that inactivating Rpd3p will have similar effect as the set2Δ
strain.
Note that the effect of extracellular starvation in set2Δ occurs in a strain prototrophic
for adenine (Ade+), which was unaffected by starvation during sporulation when Set2p

182
is active (Table 4.1 and 4.2; Chapter 4). This may suggest that nutrient starvation can
stimulate recombination activity in the wild type (Ade+) strain when chromatin is in a
highly ‘opened’ state. Furthermore, this effect also requires Bas1p, since the highly
activated recombination in set2Δ under nutrient starvation was repressed in the set2Δ
bas1Δ strain.
The mechanism by which Bas1p affects recombination in the absence of Set2p is
unclear. We speculate that the hyperacetylation of histones, resulting from loss of
Set2p, may lead to the unravelling of nucleosomes at the HIS4 promoter, particularly
at the binding sites of Bas1/2p (Figure 5.8). This leads to an increased occupancy of
Bas1/2p to their binding sites, which then promotes DSB formation in an as yet
unknown manner. One possibility is that Bas1p or Bas2p can recruit other histone
modifying proteins, which can further remodel the chromatin organisation into a
structure that favour better access for recombination factors (Figure 5.8).
Alternatively, Bas1p or Bas2p may have the ability to directly interact with components
of the recombination initiating factors (Section 1.2.1), hence recruiting the complex to
the DSB site at HIS4 (discussed further in Section 7.6).
It is also unclear how extracellular starvation for adenine and amino acids during
sporulation further activates the level of recombination in the set2Δ strain. It is
possible that nutrient starvation promotes an unknown chromatin modification other
than the H3K27 acetylation, which increases Bas1/2p binding activity. Another
possibility is that nutrient starvation can induce phosphorylation of Bas1p via an as yet
unknown protein kinase, which may affect conformational alteration of Bas1p. This
may lead to an increased interaction between Bas1p and Bas2p, and stimulate their

183
Figure 5.8 : A model for the influence of Set2p inactivation on recombination activity at
HIS4.
A) Loss of the Set2p-dependent H3K36 trimethylation and Rpd3 deacetylation lead to
hyperacetylation of H3K27. Nucleosomes become unstable, and promote better access
of Bas1/2p to their binding sites.
B1) Bas1p or Bas2p may recruit unknown histone modifying enzymes that catalyse
another modification of histone, which promote a favourable condition for DSB
formation.
B2) Alternatively, recombination initiation factors (Spo11p complex) are recruited by
either Bas1p or Bas2p to the DSB site.
Unknown histone modifying protein complex
Set2p
H3K36me3
Histone
acetylation
Bas1/2p
Bas1/2p
Spo11p
A
B1
Stable nucleosome
Unstable nucleosome
Unknown histone post-translational modification
B2
Bas1/2p
Recombination initiating complex
OR
Rpd3p

184
binding at HIS4. Alternatively, if the hypothesis that Bas1p or Bas2p can interact with
the recombination machinery is true, perhaps this direct contact can be further
stimulated by the starvation signal.
5.4.2 Insertion of an HA3 Tag Inactivates the Function of Bas1p
This study showed that insertion of HA3 and pCLB2-HA3 constructs at the carboxyl- and
amino- termini of Bas1p respectively, led to a reduction in the level of NMS at HIS4 to
the level of the bas1 deletion strain (Table 5.3). Furthermore, the His+ strains
homozygous for pCLB2-HA3-BAS1 and BAS1-HA3 were unable to grow normally on the
histidine omission media in the absence of Gcn4p (Figure 5.4). These observations
suggest that Bas1p is defective in the pCLB2-HA3-BAS1 and BAS1-HA3 strains.
Since the pCLB2-HA3 construct inactivates Bas1p function in mitosis, it was not possible
to generate a conditional meiotic-null allele of Bas1p. It would be of interest to use a
Myc13 epitope with the pCLB2-BAS1 construct in the future, since insertion of the
Myc13 epitope did not appear to affect Bas1p function. This construct would then be
used to confirm the effect of Bas1p-mediated starvation conditions prior to meiosis on
recombination (Chapter 4).
Furthermore, we have shown that in the set2 deletion strain, in which histones were
already hyperacetylated, recombination can be further elevated by starvation for
nutrients during sporulation. This effect is mediated by Bas1p. Therefore, using the
pCLB2-BAS1 construct, we would be able to support the hypothesis that Bas1p is
required throughout meiosis even when the chromatin configurations were already
fixed prior to meiosis.

185
5.4.3 Phosphorylation State of Bas1p
We used phospho-labelling method to investigate the phosphorylation state of Bas1p
under different nutrient conditions in terms of the composition of growth media, as
well as adenine auxotrophy. Vegetatively grown cells of the wild type, BAS1-myc13 and
BAS1-myc13 ade1∆ strains were first labelled, immunoprecipitated with anti-Myc
antibody, and visualised by autoradiography.
From the phospho-labelling experiment, some phosphorylated bands were observed
including the one that corresponds to the expected size of BAS1-myc13, which was
present in all strains tested except the negative control (Figure 5.8A). Similar bands
with the size of BAS1-myc13 were also observed in all strains containing BAS1-myc13 in
a subsequent western blot analysis of the same immunoprecipitated protein samples
(Figure 5.8B). However, in the negative control lane, no bands were detected at all
including the band of the expected heavy chain immunoglobulin, suggesting that the
negative control was invalid. This negative control is a sample prepared from the wild
type strain which does not contain a Myc-tagged protein, and subjected to
immunoprecipitation as in other samples. Therefore, it is not to be ruled out the
possibility that the phosphorylated bands were non-specific.
However, similar bands of BAS1-myc13 were also observed in a repeated experiment in
all lanes of proteins that contain BAS1-myc13 (data not shown), suggesting that these
phosphorylated bands may be real. By taking these observations into consideration,
one explanation is that BAS1-myc13 is phosphorylated under both rich and deprived
nutrient conditions, and in the auxotrophy for adenine. However, given that the
resolution of these bands was very low, the relative amounts of phosphorylation

186
between these conditions could not be evaluated. Therefore, it remains a possibility
that the levels of phosphorylation between these samples were different.
Our result of the presence of Bas1p phosphorylation is consistent with the previously
found phosphorylated peptide of Bas1 when cells were grown with complete nutrients
(Bodenmiller et al., 2010). Potential kinases involved in this phosphorylation activity
include Snf1p, although the amino acid sequence of the phosphopeptide found by
Bodenmiller et al. (2010) does not correlate with Snf1p binding site. However, Bas1p
has at least three potential binding sites of Snf1 kinase, and phosphorylation activities
of these sites have not yet been documented.
While the preliminary observations might provide some hints on the phosphorylation
activity of Bas1p prior to meiosis, more experiments are needed to confirm this
hypothesis. Additionally, an investigation of Bas1p phosphorylation in meiotic cells
could also provide a clue whether Bas1p is dephosphorylated during meiosis under
adenine deprivation. A specific antibody targeted against Bas1p or specific to the
known phosphorylation site in Bas1p can be used in future experiment for detecting
Bas1p phosphorylation in response to different nutrient conditions. This would be
useful to get a higher sensitivity of the western blot, and higher specificity for Bas1p,
or the particular phosphorylation site in Bas1p.
5.4.4 Future work
Acetylation of histones H3 and H4 potentially plays an important role in regulating the
activation of recombination at the HIS4 hotspot in response to nutrient stress
conditions. A chromatin immunoprecipitation (ChIP) technique using antibodies
directed against specific histone modifications could provide a more detailed

187
explanation on the position of histones in which acetylation occurs and specific
modifications associated with the HIS4 hotspot. The enrichment of these modifications
for meiotic cells that were subjected to different nutritional conditions would also be
measured.
It would be of interest to use a ChIP-sequencing (ChIP-seq) method (Johnson et al.,
2007) to analyse the enrichment of different histone modifications at HIS4 in response
to various conditions. The ability of the ChIP-seq technique to sequence millions of
short DNA fragments in a single run would provide more information of other genomic
locations that were also affected under different nutrient conditions. Therefore, we
would be able to determine if the same modification of histones occurred at other
Bas1p-regulated genes in these conditions, as was observed at HIS4. Comparison of
enrichments in histone modifications with the level of Bas1p activity can also provide
indications if the changes of the specific histone modifications at HIS4 is associated
with the changes in Bas1p.

188
Chapter 6 : Analysis of Haploinsufficiency of BAS1 and BAS2
6.1 Introduction
Haploinsufficiency refers to a detectable phenotype observed in diploid organisms that
results from inactivation of a single allele at a given locus. Haploinsufficiency can also
be defined as a phenomenon in which one copy of a gene in a diploid organism is not
sufficient to maintain a wild type function. In Chapter 5 (Table 5.3), we have shown
that strains containing one copy of the HA-tagged BAS1 (BAS1-HA3 / BAS1) exhibit a
reduced level of NMS compared to the homozygous wild type strain (BAS1 / BAS1). The
level of NMS in the BAS1-HA3 / BAS1 strain was not significantly different to that of the
homozygous bas1 deletion strain (bas1Δ / bas1Δ; 4.2% and 1.8% respectively). One
explanation for this observation is that BAS1 is haploinsufficient. Therefore, these
interesting data prompted us to investigate if the reduced level of recombination in
the BAS1-HA3 / BAS1 strain is due to haploinsufficiency of BAS1.
In humans, haploinsufficiency has been suggested to be associated with tumour-
suppressor genes including BRCA1 and PTEN (Santarosa and Ashworth, 2004). Staff et
al. (2003) demonstrated that loss of one copy of the BRCA1 gene in sporadic breast
tumours is highly correlated with reduced expression of the mRNA. This suggests that
BRCA1 exhibits haploinsufficiency in sporadic breast cancer (Staff et al., 2003). It has
also been reported that mice that are heterozygous for the BRCA1 gene (BRCA1+/-)
have shortened life span with 70% tumour incidence (Jeng et al., 2007). These mice
also had a 3- to 5-fold increased rate of ovarian tumour when exposed to ionising
radiation, compared to the BRCA1+/+ mice (Jeng et al., 2007). This indicates that mice
with haploinsufficiency of BRCA1 gene have an increased risk of cancer.

189
Haploinsufficiency in tumour-suppressor genes has also been suggested to facilitate
tumour progression (Quon and Berns, 2001). One example was shown by Kwabi-Addo
et al. (2001) in which one copy of the PTEN gene was unable to prevent the
progression of prostate cancer. In particular, a significantly higher rate of
tumorigenesis was detected in mice containing a single PTEN allele compared to mice
that retained two wild type copies of PTEN (Kwabi-Addo et al., 2001).
In S. pombe, it has been demonstrated that the ATF1 gene, which encodes the
transcription factor Atf1p, is haploinsufficient with respect to its function in meiotic
recombination at the ade6-M26 hotspot (Gao et al., 2009). Specifically, recombination
at the ade6-M26 hotspot in strains that were heterozygous for ATF1 (ATF1 / atf1Δ) had
an intermediate frequency between the homozygous wild type and homozygous
deletion strains (Gao et al., 2009). This indicates that genes which encode transcription
factors required for a specific recombination hotspot can exhibit haploinsufficiency in
meiotic diploid cells.
In S. cerevisiae, a genome-wide profiling study has previously been carried out to
determine genes that exhibit haploinsufficiency in terms of growth in YEPD medium
(Deutschbauer et al., 2005). Specifically, parallel fitness profiling (Giaever et al., 2002)
was used to quantitatively assess the relative growth of all the heterozygous and
homozygous deletion strains in YEPD medium (Deutschbauer et al., 2005). BAS1 and
BAS2 were not included among the 184 heterozygous strains that were detected to
exhibit haploinsufficient growth defects. However, the study by Deutschbauer et al.
(2005) focused on their fitness profiling in terms of vegetative growth activity.
Therefore, BAS1 and BAS2 may exhibit haploinsufficiency with respect to meiotic

190
recombination. Furthermore, it is also possible that this assay was not sensitive
enough to detect the fitness defect of BAS1 and BAS2, and that heterozygosity of these
genes may still exhibit a subtle reduction in growth activity.
In meiotic recombination studies which require analysis of point mutants that are
difficult to construct, experiments often involve modifications of only one copy of the
gene to determine the effect of these mutations on recombination activity.
Specifically, experiments were typically carried out on diploids generated by crossing a
haploid strain containing the modified gene, with another haploid strain containing the
gene deletion (‘point mutant / Δ’). The activity of recombination in this heterozygous
point mutant strain was then compared with the homozygous wild type (‘WT / WT’)
and homozygous deletion (‘Δ / Δ’) strains.
One potential problem that can arise from such an experiment is if the tested gene
exhibits haploinsufficiency. Since haploinsufficient genes might generate only partial
activity compared to the wild type or be similar to that of gene deletion, this can
interfere with interpretation of results. For example, if the level of recombination in
the ‘point mutant / Δ’ strain is significantly reduced compared to that of the ‘WT / WT’,
one explanation is that this reduction may be the consequence of the point mutation.
However, it is also possible that the point mutant has no effect on recombination
activity, but one copy of the gene in a diploid is not enough to exhibit a wild type level
of recombination activity. Therefore, in such experiment, it is important to analyse a
control strain of heterozygous wild type (‘WT / Δ’) to ensure that these genes do not
exhibit haploinsufficiency. The activity of recombination in the ‘WT / Δ’ strain should
be equal to that of the homozygous wild type (WT / WT), before the reduced activity of

191
recombination in the ‘point mutant / Δ’ strain can be considered as likely to be the
effect of the mutation.
Examples of this type of experiment in previous studies include recombination analysis
in point mutant of the mismatch repair genes, MLH1 and MLH3 (Hoffmann et al., 2003,
Cotton, 2007). These point mutants disrupted the ATP binding or ATP hydrolysis
activities of Mlh1p and Mlh3p, and were used to investigate the functional
requirements of the Mlh1p and Mlh3p ATPase domains in meiosis (Cotton et al., 2010).
Crossing over and gene conversion activities were analysed in strains heterozygous for
the point mutants (e.g., mlh3-N35A / MLH3; Cotton, 2007), and compared with the
homozygous wild type and homozygous deletion strains. In these studies,
recombination analyses were also carried out in heterozygous wild type strains (e.g.,
MLH3 / mlh3Δ), which were found to exhibit similar level of activities as the
homozygous wild type strain (e.g., MLH3 / MLH3). Therefore, these observations
confirmed that the MLH1 and MLH3 genes were not haploinsufficient, hence the
heterozygous point mutant diploids were used for recombination analyses (Hoffmann
et al., 2003, Cotton et al., 2010).
An example of such experiment designed for our future studies is the analysis of
recombination activities in the pCLB2-BAS1 strain, a meiotic-null allele of BAS1
(Chapter 5). Due to the difficulty of creating the mutant strain, recombination activity
may have to be analysed in a strain generated by crossing between the pCLB2-BAS1
and bas1Δ strains.
Another example is a study aimed to verify the hypothesis that interaction of Bas1p
and Bas2p is the essential mechanism involved in promoting recombination under

192
various stimulatory factors. This would be tested by evaluating recombination activity
at HIS4 in a strain with a disrupted domain in Bas2p for interaction with Bas1p.
Therefore, the effect of starvation on recombination at HIS4, in the absence of Bas1p
and Bas2p interaction, could be determined. The experiment was designed using a
point mutation of the specific domain in Bas2p that has been proposed to be essential
for interaction with Bas1p (Bhoite et al., 2002). Subsequently, the HIS4 hotspot activity
in a diploid strain containing the BAS2 point mutant over bas2Δ would be evaluated
under different nutrient conditions during sporulation.
6.1.1 Aims
This project aimed to determine if BAS1 and BAS2 exhibit haploinsufficiency with
respect to vegetative growth on media lacking histidine and meiotic recombination at
HIS4.
6.2 Results
6.2.1 Heterozygousity for BAS1 is Insufficient to Promote Normal Vegetative
Growth on Media Lacking Histidine in the gcn4Δ Strain
Cells wild type for histidine (His+), and lacking both Bas1p and Gcn4p, lost their ability
to grow in the absence of extracellular histidine (Section 1.5.3.1). To test if BAS1
exhibited haploinsufficiency with respect to its function in promoting vegetative
growth, we analysed the growth phenotype of a diploid His+ strain, which was
homozygous for gcn4Δ and heterozygous for BAS1 (BAS1 / bas1Δ), on a histidine ‘drop-
out’ medium. This was then compared to the growth phenotype of the homozygous
wild type strain (BAS1 / BAS1, GCN4 / GCN4) and homozygous deletion strain (bas1Δ /
bas1Δ, gcn4Δ / gcn4Δ).

193
The BAS1 / bas1Δ strain appeared to grow much slower on the histidine omission
medium compared to strains with homozygous BAS1, when gcn4 was deleted (Figure
6.1). This observation suggests that the presence of only one copy of BAS1 in a diploid
is not sufficient to promote normal vegetative growth on media lacking histidine in the
absent of Gcn4p. This also implies that BAS1 is haploinsufficient with respect to its
function in facilitating transcription of HIS4.
6.2.2 BAS1 Exhibits Haploinsufficiency in Activating Recombination at HIS4
In order to determine if BAS1 exhibits haploinsufficiency with respect to HIS4 hotspot
activity, the level of recombination in strains containing a single chromosomal copy of
BAS1 were analysed (Table 6.1). Our data showed that heterozygosity for bas1Δ
correlates with reduced levels of NMS and crossing over compared to the homozygous
wild type (Tables 6.1 and 6.3; P values between 3 x 10⁻⁴ and 0.02). In addition, the
levels of NMS and crossing over were not significantly different as compared to the
homozygous bas1Δ. These data indicate that a single chromosomal copy of BAS1 is not
sufficient to generate normal levels of recombination at HIS4, suggesting that BAS1 is
haploinsufficient. We also analysed the NMS events at HIS4 in strains heterozygous for
BAS1 in the H390 x H330 (Y55-like) strain background (Table 6.2). Strains with the BAS1
/ bas1Δ genotype exhibited significantly reduced levels of NMS compared to the wild
type strain (Table 6.2; P = 0.0097 and 3 x 10⁻⁴). This observation in the H390 x H330
strain background is consistent with that in Y55, suggesting that this experiment is
reproducible.

194
Figure 6.1 : Growth phenotype of strains wild type for histidine (His+) on (A) the
histidine omission medium and (B) the synthetic complete medium after two days of
incubation at 30°C. The genotype of strains shown in the figure is as follows:
i) BAS1 / bas1Δ, gcn4Δ / gcn4Δ ; ii) bas1Δ / bas1Δ, gcn4Δ / gcn4Δ;
iii) BAS1 / bas1Δ, GCN4 / gcn4Δ; iv) BAS1 / BAS1, GCN4 / GCN4.
i) ii)
iv) iii)
ii)
iv) iii)
i)
A B

195
Table 6.1 : The level of NMS at HIS4 in different crosses of BAS1 and bas1Δ strains in
the Y55 strain background
Strain Crosses (Y55) Relevant Genotype NMS§ / Total Tetrads % NMS
2830 x 3569 BAS1 / BAS1 50 / 388 12.9
3613 x 2830 bas1Δ / BAS1 9 / 214 4.9‡
3612 x 3569 bas1Δ / BAS1 10 / 219 4.6‡
3612 x 3613 bas1Δ / bas1Δ 6 / 331 1.8‡
§NMS is the non-Mendelian segregation events that include meiotic gene conversion
and post-meiotic segregation activity. ‡Represent data that are significantly different
compared to the corresponding wild type. The G-test of homogeneity was used for the
comparison.
Table 6.2 : The level of NMS at HIS4 in different crosses of BAS1 and bas1Δ strains in
the H390 x H330 strain background
Strain Crosses (H390 x H330)
Relevant Genotype NMS / Total Tetrads % NMS
640-4D x 639-14B BAS1 / BAS1 33 / 167 19.8
913-6C x 640-4D bas1Δ / BAS1 10 / 154 6.5‡
639-14B x 559-4B bas1Δ / BAS1 21 / 205 10.2‡
‡Represent data that are significantly different compared to the corresponding wild
type.
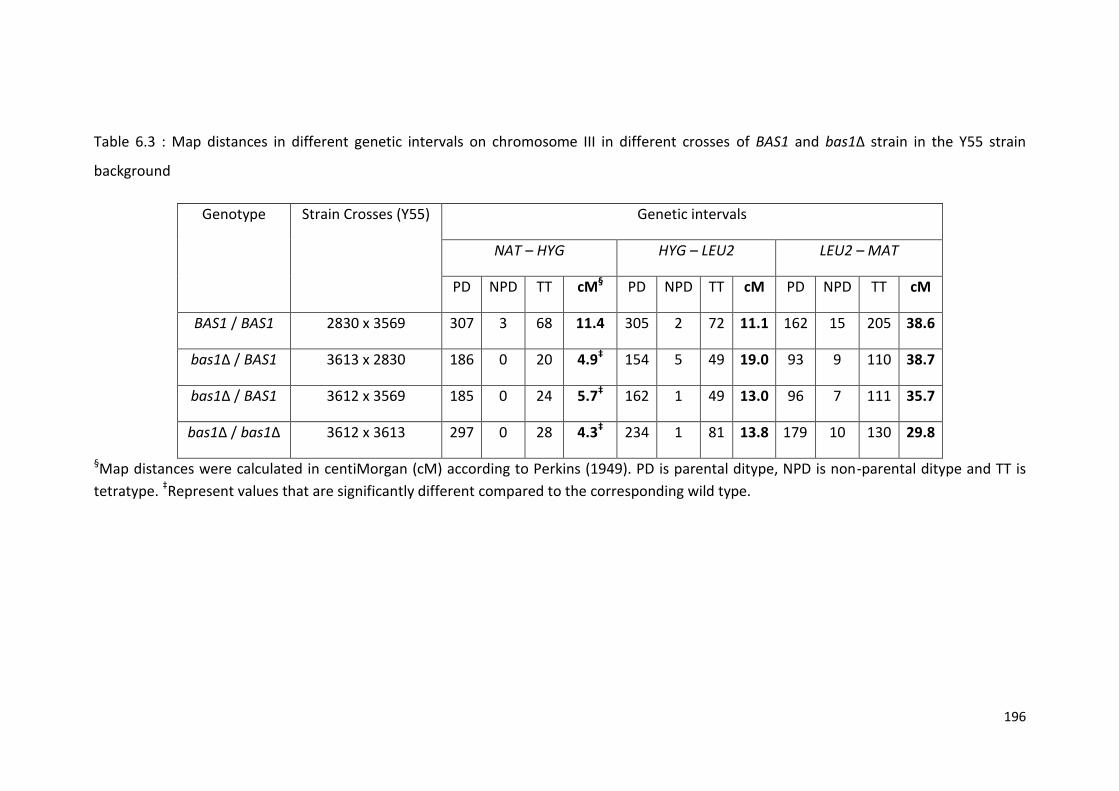
196
Table 6.3 : Map distances in different genetic intervals on chromosome III in different crosses of BAS1 and bas1Δ strain in the Y55 strain
background
Genotype Strain Crosses (Y55) Genetic intervals
NAT – HYG HYG – LEU2 LEU2 – MAT
PD NPD TT cM§ PD NPD TT cM PD NPD TT cM
BAS1 / BAS1 2830 x 3569 307 3 68 11.4 305 2 72 11.1 162 15 205 38.6
bas1Δ / BAS1 3613 x 2830 186 0 20 4.9‡ 154 5 49 19.0 93 9 110 38.7
bas1Δ / BAS1 3612 x 3569 185 0 24 5.7‡ 162 1 49 13.0 96 7 111 35.7
bas1Δ / bas1Δ 3612 x 3613 297 0 28 4.3‡ 234 1 81 13.8 179 10 130 29.8
§Map distances were calculated in centiMorgan (cM) according to Perkins (1949). PD is parental ditype, NPD is non-parental ditype and TT is
tetratype. ‡Represent values that are significantly different compared to the corresponding wild type.

197
Table 6.4 : Map distances in different genetic intervals on chromosome VII for different crosses of BAS1 and bas1Δ strain he Y55 strain
background.
Genotype Strain Crosses (Y55) Genetic intervals
MET13 - CYH2 CYH2 – TRP5
PD NPD TT cM§ PD NPD TT cM
BAS1 / BAS1 2830 x 3569 233 1 125 18.2 85 24 273 54.6
bas1Δ / BAS1 3613 x 2830 139 0 64 15.8 52 21 140 62.4
bas1Δ / BAS1 3612 x 3569 145 1 61 16.2 53 16 148 56.2
bas1Δ / bas1Δ 3612 x 3613 225 0 88 14.1 67 19 240 54.3
§Map distances were calculated in centiMorgan (cM) according to Perkins (1949). PD is parental ditype, NPD is non-parental ditype and TT is
tetratype. There was no statistical significance between the map distances at MET13-CYH2 and CYH2-TRP5 between all strains tested.

198
6.2.3 BAS2 is not Haploinsufficient in Activating Recombination at HIS4
To determine if BAS2 exhibits haploinsufficiency, similar experiments were carried out
as performed in BAS1 (Section 6.2.2). No significant difference was observed in the
level of NMS at HIS4 and crossovers at NAT-HYG for all strains containing only one
functional copy of BAS2 compared to the homozygous BAS2 strain (Tables 6.5 and 6.6).
These observations suggest that BAS2 does not exhibit haploinsufficiency for its
function in recombination at HIS4, in contrast to what was observed in BAS1.
Table 6.5 : The level of NMS at HIS4 in different crosses of BAS2 and bas2Δ strains
Strain Crosses (Y55) Relevant Genotype NMS / Total Tetrads % NMS
2830 x 3569 BAS2 / BAS2 50 / 388 12.9
3609 x 2830 bas2Δ / BAS2 22 / 206 10.7
3606 x 3569 bas2Δ / BAS2 15 / 208 7.2
3606 x 3609 bas2Δ / bas2Δ 8 / 209 3.8‡
‡Significantly different compared to the corresponding homozygous and heterozygous
BAS2 crosses.

199
Table 6.6 : Map distances at different genetic intervals in chromosome III in different strain crosses of BAS2 and bas2Δ strain
Genotype Strain Crosses (Y55) Genetic intervals
NAT – HYG HYG – LEU2 LEU2 – MAT
PD NPD TT cM§ PD NPD TT cM PD NPD TT cM
BAS2 / BAS2 2830 x 3569 307 3 68 11.4 305 2 72 11.1 162 15 205 38.6
bas2Δ / BAS2 3609 x 2830 174 0 27 6.7 160 1 42 11.8 104 5 96 30.7
bas2Δ / BAS2 3606 x 3569 170 1 29 8.8 164 0 36 9.0 100 1 100 26.4
bas2Δ / bas2Δ 3606 x 3609 184 0 22 5.3‡ 165 0 33 8.3 95 2 101 28.5
§Map distances were calculated in centiMorgan (cM) according to Perkins (1949). PD is parental ditype, NPD is non-parental ditype and TT is
tetratype. ‡Represent value that is significantly different compared to the corresponding homozygous and heterozygous BAS2 crosses.

200
Table 6.7 : Map distances in different genetic Intervals on chromosome VII in different crosses of BAS2 and bas2Δ strain.
Genotype Strain Crosses (Y55) Genetic intervals
MET13 - CYH2 CYH2 – TRP5
PD NPD TT cM§ PD NPD TT cM
BAS2 / BAS2 2830 x 3569 233 1 125 18.2 85 24 273 54.6
bas2Δ / BAS2 3609 x 2830 135 0 59 15.2 51 15 135 56.0
bas2Δ / BAS2 3606 x 3569 123 2 67 20.6 49 14 140 55.2
bas2Δ / bas2Δ 3606 x 3609 126 2 65 19.9 45 13 144 55.0
§Map distances were calculated in centiMorgan (cM) according to Perkins (1949). PD is parental ditype, NPD is non-parental ditype and TT is
tetratype. There was no statistical significance between the map distances at MET13-CYH2 and CYH2-TRP5 between all strains tested.

201
6.3 Discussion
In this study, we have shown that strains which contain only one functional copy of
BAS1 (BAS1 / bas1Δ) exhibited significantly lower levels of recombination at HIS4
compared to strains containing two copies of BAS1 (Section 6.2.2). This indicates that
BAS1 is haploinsufficient with respect to its function in promoting the HIS4 hotspot
activity. Therefore, this observation suggests that the low level of NMS observed in the
BAS1-HA3 / BAS1 strain (Chapter 5) is caused by haploinsufficiency of BAS1.
Furthermore, we showed that a diploid strain heterozygous for BAS1 had a slower
growth rate on histidine omission media in the absence of Gcn4p, compared to the
homozygous bas1 deletion strain (Figure 6.1). This suggests that BAS1 also exhibits
haploinsufficiency in promoting HIS4 transcription.
However, these findings contradict with a genome-wide study conducted by
Deutschbauer et al. (2005), which demonstrated that BAS1 did not exhibit
haploinsufficiency in terms of growth in YEPD medium. Specifically, heterozygous
deletion of BAS1 was not found among the strains that exhibited a fitness defect, while
the homozygous deletion of BAS1 was detected among the slow growing strains
(Deutschbauer et al., 2005). One possible explanation for the differences is that BAS1
haploinsufficiency could be context-dependent. Specifically, BAS1 may exhibit
haploinsufficiency in activating transcription and recombination at HIS4¸ but not in
promoting cell growth in complete media.
What is the underlying cause of BAS1 haploinsufficiency? It has been shown that
proteins encoded by genes that exhibit haploinsufficiency tend to be involved in
protein complexes (Papp et al., 2003). Therefore one theory for gene

202
haploinsufficiency, the ‘balance hypothesis’ proposed by Papp et al. (2003), argues
that the relative amount of subcomponents in a protein complex is in a stoichiometric
balance, and deviations of the normal balance can be deleterious. Hence,
underexpression and overexpression of a protein subunit complex could exhibit a
functional defect. Since overexpression of Bas1p is toxic for cell viability (Valerius et al.,
2003), our result of BAS1 haploinsufficiency appears to support the balance
hypothesis. Furthermore, the current model of Bas1p regulation on the HIS4 hotspot
activity includes the requirement for Bas1p to form a complex with Bas2p, and their
cooperative binding at the HIS4 promoter (Chapter 3). Therefore, the production of
Bas1p may be in a tight regulation in order to get the right balance of Bas1p molecules
to form a complex with Bas2p.
However, the ‘balance hypothesis’ may not be applied to all genes exhibiting
haploinsufficiency. Deutschbauer et al. (2005) showed that overexpression of
haploinsufficient genes, even those whose products are members of protein
complexes, did not exhibit a similar fitness reduction as seen in the heterozygous
deletion. Hence, an opposing theory has been proposed, stating that a
haploinsufficient phenotype is simply the result of reduced levels of protein produced
in the heterozygous state, and overexpression is not expected to be deleterious
(Deutschbauer et al., 2005). Therefore, it is possible that haploinsufficiency of BAS1 in
recombination at HIS4 is not the consequence of a tight requirement for balance in the
amount of Bas1p to interact with Bas2p, but simply due to the low number of Bas1p
molecules available for interaction.

203
We speculate that in a heterozygous state of BAS1, the production of Bas1p molecules
was reduced to the level that is not sufficient to promote wild type activity of HIS4
recombination. It is possible that even the normal expression of Bas1p is low and the
amount of Bas1p produced in the homozygous wild type (BAS1 / BAS1) strain is
limited, most of which become active and interacts with Bas2p. These Bas1/2p
complexes then bind to the HIS4 promoter and stimulate the wild type level of
recombination. In the heterozygous deletion (BAS1 / bas1Δ) strain, even less Bas1p
molecules are produced, therefore only a few active Bas1p molecules are available and
form complexes with Bas2p. Hence, recombination activity at HIS4 is reduced.
Interestingly, our data showed that unlike BAS1, BAS2 did not exhibit
haploinsufficiency in its function in meiosis. This suggests that Bas2p may be expressed
at a high enough level in the heterozygous strain (BAS2 / bas2Δ), and interaction with
Bas1p can occur at a normal level to promote recombination. Since Bas2p is also
involved in the regulation of other genes by partnering with other transcription
factors, we would predict that the production of Bas2p should be high. Consistent with
this, there are approximately 6420 Bas2p molecules per cell during log-phase growth in
rich media, while only 861 molecules of Bas1p are present per cell (Ghaemmaghami et
al., 2003). This suggests that Bas2p molecules are produced far in excess compared to
Bas1p, consistent with our observation that BAS2 is not haploinsufficient. From these
haploinsufficiency data, we conclude that Bas1p is the rate-limiting factor for
recombination activity at the HIS4 hotspot.
There have been no previous reports of BAS1 haploinsufficiency with respect to
meiotic recombination activity at HIS4. Previous studies on the effect of Bas1p on HIS4

204
hotspot activity were carried out using strains homozygous for mutations of BAS1
(White et al., 1993, Fan et al., 1995). Therefore, the knowledge of BAS1
haploinsufficiency in this study could provide a significant contribution for future
experiments on meiotic recombination at HIS4 and other hotspots, especially for
experiments that involved crossing between modified genes with gene deletions.

205
Chapter 7 : Discussion
7.1 The Purine Biosynthetic Intermediate AICAR Positively Regulates
Recombination at HIS4 by Promoting Bas1/2p Activity
The data presented in Chapter 3 suggest a positive influence of AICAR on gene
conversion and crossing over frequencies at the HIS4 hotspot. This finding is consistent
with the model of Bas1/2p-mediated transcription of HIS4, in which transcription was
activated in response to AICAR accumulation (Rebora et al., 2001, Rebora et al., 2005,
Pinson et al., 2009). Our data showed that deletion of the functionally redundant
ADE16 ADE17 genes, which accumulate AICAR (Pinson et al., 2009), strongly up-
regulates the level of recombination. We also found that this effect is dependent on
Bas1p. Furthermore, both levels of NMS and crossing over observed in the ADE16
ADE17 deletion strain were among the highest obtained compared to other strains and
conditions tested in this study. This suggests that AICAR plays an essential role as an
internal activator for the HIS4 hotspot activity in a manner mediated by Bas1p.
The influence of AICAR on transcription and recombination at HIS4 is likely attributed
to its role in stimulating interaction between Bas1p and Bas2p, and their binding ability
to the HIS4 promoter (Section 3.4.1) (Pinson et al., 2009). The mechanism by which
AICAR potentiates interaction of Bas1p and Bas2p is not completely understood. Since
AICAR is known to bind Bas2p in vitro (Pinson et al., 2009), this direct contact with
AICAR might induce conformational change of Bas2p that promotes its interaction with
Bas1p. This AICAR-mediated interaction between Bas1p and Bas2p then facilitates
their binding to the DNA (model in Figure 3.4). Furthermore, this interaction may also
lead to subsequent alteration of Bas1p conformation, which results in unmasking of its

206
latent trans-activation domain (Section 3.4.1). Hence, this domain may interact with
transcriptional machinery and activates transcription of HIS4. With respect to
recombination, increased occupancy of Bas1/2p at the promoter region may create a
chromatin state that favours access for recombination initiating complex to form DSB.
Another possible mechanism is that the recombination complex is directly recruited by
Bas1p or Bas2p, hence increasing DSB formation (discussed in Section 7.6).
Does AICAR activate transcription and recombination activities genome-wide? A
microarray study by Pinson et al. (2009) demonstrated that transcription of a subset of
yeast genes were activated in strains that accumulate AICAR. The vast majority of
these genes were known to be transcriptionally regulated by Bas1/2p and
Bas2p/Pho4p (phosphate regulon). Since Bas1/2p has varying binding ability between
the HIS4 promoter and the ADE gene promoters (Section 3.1.2) (Pinson et al., 2000), it
is also possible that the degree by which AICAR affects transcription varies between
different loci.
In terms of recombination activity, it is as yet unknown whether accumulation of
AICAR can activate recombination at genes other than HIS4. A genome-wide analysis
has been performed by Mieczkowski et al. (2006) to map all genomic Bas1p binding
sites and to determine the effect of bas1 deletion on the level of DSBs globally. The
genome-wide mapping of Bas1p binding sites was performed using chromatin
immunoprecipitation for isolating Bas1p-associated DNA, followed by DNA microarray
analysis (ChIP-chip method). In samples derived from sporulating cells, 56 binding sites
of Bas1p were detected, while only nine sites were identified in vegetative cells grown
in rich media. They proposed that the higher number of Bas1p binding sites detected

207
in sporulating cells may be the consequence of adenine deprivation in the sporulation
media (Mieczkowski et al., 2006). This may lead to an increase production of AICAR,
which promotes interaction between Bas1p and Bas2p, hence stimulating occupancy
of Bas1p at the promoter. Therefore, this observation implies that adenine starvation
and increased level of AICAR could stimulate Bas1p binding activity to its target gene
promoters globally.
Furthermore, the genome-wide analysis by Mieczkowski et al. (2006) also showed that
the formation of DSBs at some regions with Bas1p binding sites was strongly reduced
by BAS1 deletion, while DSB formation at other genes was increased or unaffected.
Most of the genes that require Bas1p for DSB formation were known to be
transcriptionally regulated by Bas1/2p. Therefore, it is possible that recombination
activity at these loci also responds to a high level of AICAR, as was observed at HIS4.
The finding by Mieczkowski et al. (2006) also suggested that Bas1p is not required for
recombination activity, indeed even inhibits DSB formation, at several genes
containing Bas1p binding sites, some of which were known to be transcriptionally
dependent on Bas1/2p. This suggests that the effect of Bas1p on recombination
activity is context-dependent. However, AICAR can activate transcription of other
genes unrelated to Bas1p (Pinson et al., 2009) as discussed above. Therefore, it
remains a possibility that recombination activity at these loci and other genes without
Bas1p binding sites can be activated in response to AICAR accumulation.

208
7.2 Interaction between Bas1p and Bas2p can be Mediated by an AICAR-
Independent Mechanism that is Sufficient for Recombination Activity
AICAR is produced from the purine and histidine biosynthesis pathways. The data in
Chapter 3 suggested that a certain level of recombination can be stimulated even
when AICAR synthesis was completely inhibited from both pathways, in the his1Δ
ade1Δ deletion. The level of recombination from this double deletion strain was
significantly higher compared to that found in the absence of Bas1p or Bas2p (up to 4-
fold in NMS and 2-fold for crossovers).
Therefore, one possible explanation is that there is an AICAR-independent mechanism
that can promote interaction of Bas1p and Bas2p, and is sufficient to activate
recombination at HIS4. Given that sporulating cells were also subjected to various
nutrient starvation including glucose and nitrogen, it is possible that these nutrient
signals modestly contribute to the cooperative binding of Bas1/2p to the DNA by an as
yet unknown factor. Perhaps other metabolic molecules can promote interaction
between Bas1p and Bas2p, or that conformation of either protein can be altered by
post-translational modification such as phosphorylation. This conformational change
might then induce interaction and binding of Bas1/2p to the HIS4 promoter.
7.3 Adenine and Amino Acid Starvation Increases Recombination at HIS4
This study provides further evidence supporting the hypothesis that constant
deprivation for adenine and amino acids stimulates meiotic recombination activity at
HIS4. We have demonstrated that by modulating the nutrient composition both in the
growth and sporulation media, an elevated level of meiotic recombination can be
obtained. Wild-type cells prototrophic for adenine (Ade+) exhibit approximately 1.8-

209
fold increase in recombination level when subjected to starvation for adenine and
amino acids during and prior to sporulation (Tables 4.1 and 4.2). This suggests that
continuous nutrient starvation can increase recombination activity even in the wild
type Ade+ strain.
When cells were starved only during sporulation, the recombination level was only
activated in cells that were auxotrophic for adenine (ade1Δ). This elevated level of
recombination was up to 3.7-fold higher than in cells sporulated with complete
nutrient supplements, and 1.8-fold higher than cells prototrophic for adenine that
were continuously starved (Tables 4.7 and 4.8). We hypothesised that the greater
degree of starvation, which include extracellular nutrient limitation and the inability of
cells to synthesise adenine, contributes to this induced recombination activity.
The increased level of recombination in response to the high nutrient stress conditions
may be contributed by a combination of different factors and mechanisms. Deletion
analysis showed that most of the starvation response on recombination is highly
dependent on Bas1p (Tables 4.4, 4.5, 4.12 and 4.13). Furthermore, AICAR from the
histidine biosynthesis pathway also plays a role to activate recombination in the
adenine auxotrophic strain, in response to starvation. This is based on the data that
showed significant reduction in the level of recombination in the his1Δ ade1Δ strain
relative to the ade1Δ strain under starvation during sporulation (Tables 4.14 and 4.15).
In addition, the his1Δ ade1Δ strain also exhibited a 2.5-fold increase in recombination
when cells were subjected to starvation during sporulation, as opposed to cells
sporulated with complete nutrients. This suggests that starvation can also promote
Bas1p to activate recombination independently of AICAR. This data supports the

210
hypothesis that interaction between Bas1p and Bas2p can be stimulated by factors
other than AICAR, and these factors respond to starvation.
Gcn4p is also required for the effect of starvation during sporulation in cells
auxotrophic for adenine, but not for the effect of continuous starvation in cells
containing the Ade+ phenotype (discussed below in Section 7.4). Furthermore, in the
absence of Bas1p, a significant increase in the level of NMS was also observed in the
Ade+ strain in response to continuous starvation (Table 4.4). These data indicate that
there may be factors other than Bas1p and Gcn4p, which can activate recombination
under starvation for adenine and amino acids before and during sporulation. This may
be proteins involved in chromatin modifications or other transcription factors such as
Rap1p (discussed in Section 4.4.3 and 7.5).
Alternatively, the nutrient stress signals may induce a yet unknown protein kinase to
phosphorylate Bas1p, and changed its conformation which promotes interaction with
Bas2p and binding to the HIS4 promoter. Our preliminary experiment to determine
phosphorylation of Bas1p under starvation and non-starvation conditions suggests that
Bas1p may be phosphorylated in all conditions. However, differences in the level of
phosphorylation between these conditions have not yet been studied. Therefore, it
remains a possibility that Bas1p is phosphorylated or dephosphorylated under
different nutrient conditions.
7.4 Gcn4p is not Required for HIS4 Hotspot Activity but Contributes to
Activate Recombination in the ade1Δ Strain when Starved during Sporulation
Our initial expectation in this study was that Gcn4p is required for the HIS4 hotspot
activity particularly in response to starvation. This is because Gcn4p was shown to be

211
necessary for meiotic recombination at HIS4, and was required to activate
recombination in response to intracellular starvation for adenine and amino acids
(Abdullah and Borts, 2001). In S. cerevisiae, Gcn4p is involved in the general amino acid
control system that activates transcription of its target genes in response to various
stress conditions including purine and amino acid starvation. This system acts by
increasing Gcn4p production when cells were subjected to a stress condition, which
subsequently activates transcription of genes under its regulation.
The data in Chapter 4 demonstrated that Gcn4p is not essential for recombination
activity at HIS4. As described above (Section 7.3), Gcn4p also appeared to have no role
on recombination activity in response to starvation for adenine and amino acids before
and during sporulation, in cells prototrophic for adenine (Ade+). However, in cells
auxotrophic for adenine (ade1Δ), Gcn4p has a small contribution for activating
recombination in response to starvation (during sporulation). This suggests that Gcn4p
can influence recombination activity at HIS4 when cells were subjected to both
extracellular and intracellular nutrient starvation.
It is not clear why continuous nutrient starvation did not stimulate Gcn4p for activating
recombination in the wild type Ade+ strain. Perhaps the amount of Gcn4p produced in
response to the external nutrient starvation signals was not sufficient to provide
conditions that can activate recombination, but enough to stimulate transcription. This
could be due to the chromatin factors recruited by Gcn4p, which favour more access of
transcription machinery than recombination initiating factors.
Furthermore, Gcn4p may also act in conjunction with Bas1/2p to activate
recombination under starvation condition in the adenine auxotrophic cells. This

212
combinatorial effect may explain the greater activation of recombination activity
observed under starvation condition in cells unable to produce adenine, compared to
the Ade+ strain. Moreover, no effect of starvation in the adenine auxotrophic cells was
observed in other control genes (e.g., MET13 and TRP5) that were expected to respond
to Gcn4p but have no binding sites of Bas1/2p. This further suggests that the activity of
Gcn4p and Bas1/2p in activating recombination at HIS4 under starvation could be
combinatorial.
7.5 The Bas1p-Mediated HIS4 Hotspot Activity is Associated with Removal of
Histone Deacetylation
The data presented in Chapter 5 is consistent with previous observations by Merker et
al. (2008) in which removal of Set2p-dependent histone deacetylation increases the
level of recombination at HIS4. Furthermore, inactivation of Set2p methyltransferase
and Rpd3p deacetylase also stimulated the formation of DSBs and elevated the level of
H3K27 acetylation (Merker et al., 2008). Therefore, it has been hypothesised that
removal of histone deacetylase Rpd3p and subsequent acetylation of H3K27 in the
set2Δ strain provides a chromatin configuration that favours recombination initiation
at HIS4.
The inactivation of Set2p may also stimulate recombination activity through
hyperacetylation of histone H3 and H4 at sites other than H3K27. This is because
deletions of SET2 or RPD3 were found to acetylate many lysine residues at histone H3
and H4 including H3K9, H3K14, H4K5 and H4K8 (Lin et al., 2010). Furthermore, loss of
Hda1p, a deacetylase of histone H3 and H2B also showed a small stimulatory effect on
the HIS4 hotspot activity (Merker et al., 2008). This suggests that histone deacetylase

213
complexes (HDAC) other than Rpd3p might also have a negative effect on
recombination at HIS4.
We have also established that Bas1p is required for the effect of hyperacetylation on
recombination activity in the set2Δ strain (Figure 5.3 and Table 5.2). This finding
indicates that the highly opened chromatin structure resulting from histone
hyperacetylation has no effect on recombination activity without the activity of Bas1p.
In addition, our data demonstrated a further up-regulation of recombination level in
the hyperacetylated cells when subjected to starvation for adenine and amino acids
during sporulation. Bas1p is also required for this effect on recombination.
Furthermore, the effect of starvation during sporulation, in cells prototrophic for
adenine, was only observed when the chromatin was already hyperacetylated. As
discussed above (Section 7.3), no effect of starvation during sporulation was detected
in the wild type (Ade+) strain in the presence of Set2p, presumably when the chromatin
was not in a highly opened state. Perhaps this chromatin structure provides better
condition for starvation-induced Bas1p and/or other yet unidentified factors to
activate recombination initiation.
7.6 How do Bas1p and Bas2p Induce Meiotic Recombination at HIS4?
This study showed that Bas1p is an essential factor for the effect of modulating various
environmental conditions including nutrient starvation and removal of Set2p-mediated
histone deacetylation. In previous studies of the HIS4 hotspot, two models have been
proposed to explain the mechanism by which the binding of transcription factors
Bas1p, Bas2p and Rap1p stimulate recombination activity (White et al., 1993,
Kirkpatrick et al., 1999a, Petes, 2001). First, the binding of Bas1/2p and Rap1p

214
upstream of HIS4 may promote alteration of chromatin configuration into an ‘open
structure’, which promotes entry of recombination machinery. Second, the
transcription factors may have the ability to interact with recombination initiating
proteins, hence tethering the recombination complex to the DSB site at HIS4.
As stated above (Section 7.5), we have shown that the elevated level of recombination
in the set2Δ strain, presumably caused by an ‘open’ chromatin structure via
hyperacetylation of histones, was repressed when BAS1 was deleted. Therefore, this
raised a possibility supporting the second model, in which Bas1/2p may have a direct
effect in activating recombination initiation. This also suggests that the influence of
chromatin on recombination was mediated by modulating Bas1/2p occupancy at HIS4.
Given that various proteins are involved in the formation of DSB, one of these proteins
may be able to interact with Bas1/2p or Rap1p and be recruited to the DSB site. These
recombination proteins include Mre11p, Rad50p, Xrs2p, Mei4p, Mer2p, Rec102p,
Rec104p, Rec114p and Ski8p (Section 1.2.1), which act together with Spo11p to initiate
recombination.
However, if Bas1p has the ability to recruit recombination proteins, it would be
predicted that the level of DSBs at all of Bas1p-regulated loci globally would be
significantly reduced in the absence of Bas1p. The genome-wide study of BAS1
deletion by Mieczkowski et al. (2006) demonstrated that this was not the case. One
explanation for this observation is that Bas1/2p and Rap1p were acting together in
mediating the recombination initiation. Thus, chromosomal regions which contain
both Bas1/2p and Rap1p binding sites will probably have the same effect as was
observed at HIS4. Possibly Rap1p has the ability to recruit the recombination complex,

215
and this effect may be strengthened by Bas1/2p binding in a yet unknown manner.
This hypothesis seems to be consistent with a previous finding in which insertion of
two Rap1p binding sites could retain the wild type level of recombination in the
absence of Bas1p and Bas2p (White et al., 1993). This suggests that Rap1p may be the
main player responsible for recruiting recombination proteins, and requires Bas1/2p to
stimulate its activity.
For future experiments, it would be of interest to determine if Bas1p, Bas2p or Rap1p
can interact with any members of the recombination initiation complex. One way to
test this would be using yeast two-hybrid analysis by fusing the transcription factor
(e.g., Bas1p) to the DNA binding domain of E. coli LexAp, while its activation domain
would be fused onto a library of genes encoding recombination initiating proteins.
Potential interaction between these proteins will be analysed by testing for reporter
gene activity. Additionally, co-immunoprecipitation would also be used for validating
the result of possible interaction between transcription factors and recombination
proteins in meiosis. This will be carried out by immunoprecipitation of Bas1p at
different stages of meiosis, and analysing the presence of other proteins (a
recombination initiating protein) using western blot. Therefore, potential interaction
between Bas1p and the protein members of recombination complex can be detected.
7.7 Bas1p is Rate-Limiting for the HIS4 Hotspot Activity
The data in Chapter 6 suggests that BAS1 is haploinsufficient in terms of its function in
meiotic recombination at HIS4 (Tables 6.1, 6.2 and 6.3). We hypothesised that under
normal conditions (in a strain with two copies of BAS1), a limited number of Bas1p
molecules are produced, and not all of them are able to interact with Bas2p. This

216
results in a wild type basal level of recombination. In the heterozygous BAS1 strain
(containing only one copy of the gene), the amount of Bas1p is reduced, and even
fewer molecules are able to interact with Bas2p, hence reducing the level of
recombination. This implies that Bas1p is the rate-limiting factor for recombination
activity at HIS4.
This observation of BAS1 haploinsufficiency in meiosis provides additional explanation
to other findings in this study on how Bas1/2p regulates HIS4 hotspot activity. In this
study, strains that were used for testing the effect of other gene deletions and
conditions on recombination activity were mostly homozygous for BAS1. In the model
of HIS4 recombination (Figure 3.4), AICAR is mainly responsible to mediate interaction
between Bas1p and Bas2p, presumably by direct binding to Bas2p, followed by
activation of Bas1p in a yet unknown manner (Section 3.4.1 and 7.1). Therefore, under
normal conditions when the synthesis of AICAR is low (due to feedback inhibition of
the purine biosynthesis pathway; Chapter 3), the amount of AICAR that was available
to bind to Bas2p may not be sufficient to mediate interaction with the limited number
of Bas1p molecules. In conditions where AICAR is highly synthesised (in the ade16∆
ade17∆ strain and nutrient starvation), it is possible that maximum amount of Bas1p
molecules, produced in the state of homozygous BAS1, becomes activated. Specifically,
when the quantity of AICAR is high, all of Bas1p molecules may become activated by
the AICAR-Bas2p complex. This leads to an increased interaction and occupancy of
Bas1/2p at HIS4.
The data of BAS1 haploinsufficiency in this study may also indicate an additional
characteristic for the transcription factor-dependent hotspot (α-hotspot) activity. It is

217
possible that a specific transcription factor required for the activity of a given meiotic
recombination hotspot can be rate-limiting for recombination. Consistent with the
hypothesis, genes encoding the transcription factor Atf1p in S. pombe, which is
required for the ade6-M26 hotspot, also exhibit haploinsufficiency (Gao et al., 2009).
Therefore, this may be a conserved characteristic of the α-hotspot.
Haploinsufficiency is also becoming an important phenomenon especially in humans,
since haploinsufficient genes are increasingly implicated with cancer (Section 6.1).
Therefore, identification of haploinsufficient genes in model organisms and further
understanding of genetic mechanisms underlying this phenotype could provide
important insights into the association between haploinsufficiency and human
diseases.
7.8 NMS and Crossover Events at HIS4 are Correlated
In all experiments, our data consistently exhibit a correlation between the level of NMS
at HIS4 and crossover events of markers flanking HIS4 (Figure 7.1). The same
correlation between both events was also reported in previous studies for various
mutations affecting Bas1/2p-mediated HIS4 hotspot (Fan et al., 1995, Cotton, 2007,
White et al., 1993). In our analysis, strains that elevate or reduced the level of NMS at
the HIS4 hotspot (e.g., ade16Δ ade17Δ) also showed a concomitant increase or
reduction of crossing over in the region flanking HIS4 (NAT-HYG interval).
The reason for this correlation between NMS at HIS4 and crossing over of flanking
markers is likely due to the initiation of both events from the same DSBs. For example,
mutations that were expected to reduce interaction of Bas1p and Bas2p, as well as
bas1 deletion repressed both levels of NMS and crossing over, since both events were

218
potentially initiated by the same Bas1/2p-influenced DSB. It has also been shown that
deletion of BAS1 strongly reduces both the levels of DSBs and recombination at HIS4
(M.F.F. Abdullah, personal communication). This further confirms the hypothesis that
the effect of modulating Bas1/2p activity on HIS4 recombination was a consequence of
alteration in the rate of DSBs.
However, the linear correlation between crossovers and NMS (and likely DSBs; Figure
7.1) in our data does not fit with the principal of crossover homeostasis. This aspect of
crossover control proposed by Martini et al. (2006) demonstrated that the number of
crossovers was maintained at the expense of non-crossovers regardless of reduced
level of DSBs. However, they monitored global rates of DSB initiation by directly
altering Spo11p activity, while we studied a locus specific event by modulating DSBs
under different stimulatory conditions. Moreover, Martini et al. (2006) also reported
that the artificial interval HIS4-LEU2 exhibited little or no evidence of crossover
homeostasis at the strong DSB site even when surrounding regions displayed the
phenomenon. Therefore, factors that influence crossover homeostasis globally might
not apply regionally as was shown in the regions flanking HIS4.
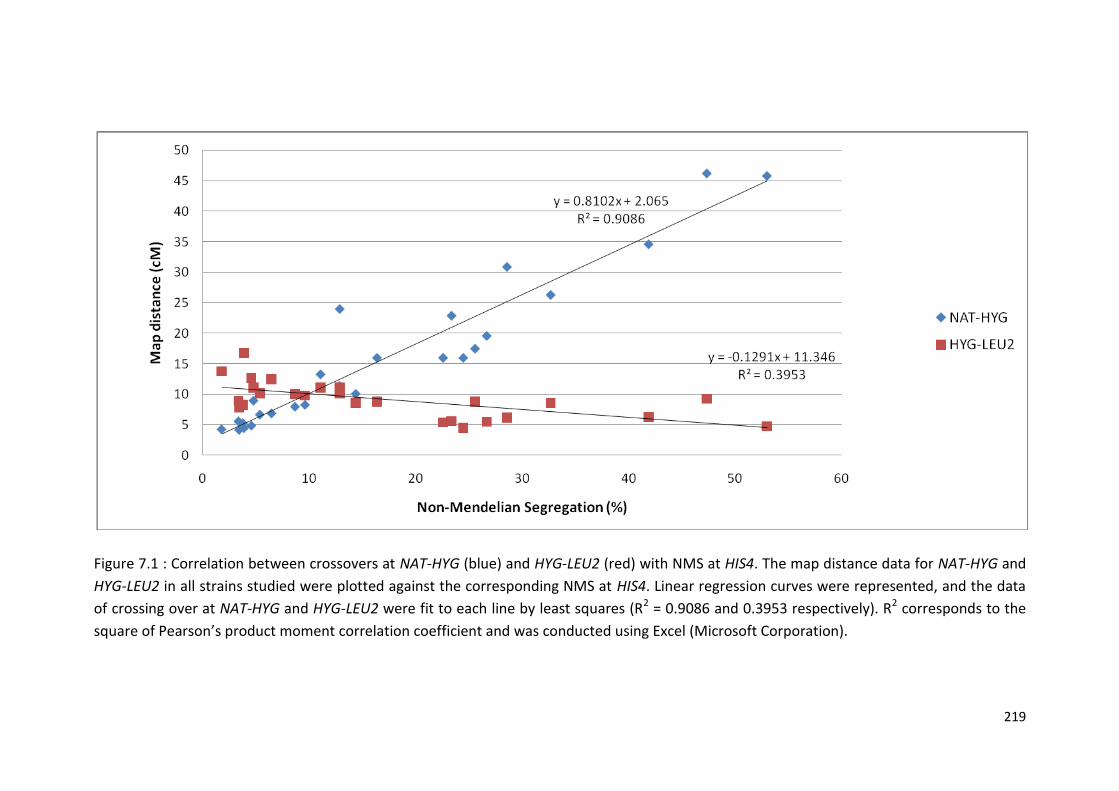
219
Figure 7.1 : Correlation between crossovers at NAT-HYG (blue) and HYG-LEU2 (red) with NMS at HIS4. The map distance data for NAT-HYG and
HYG-LEU2 in all strains studied were plotted against the corresponding NMS at HIS4. Linear regression curves were represented, and the data
of crossing over at NAT-HYG and HYG-LEU2 were fit to each line by least squares (R2 = 0.9086 and 0.3953 respectively). R2 corresponds to the
square of Pearson’s product moment correlation coefficient and was conducted using Excel (Microsoft Corporation).

220
In this study, we also observed concomitant changes in the level of crossing over at
HYG-LEU2 in response to the changes in crossover rates in the adjacent NAT-HYG
interval (Figure 7.1; Tables 3.3, 3.6 and 3.9). For example, a 4-fold increase in
crossovers at NAT-HYG in the ade16Δ ade17Δ deletion under a normal condition
resulted in a 2.3-fold decrease in crossing over at HYG-LEU2 (Table 3.3). This
observation can be explained by the phenomenon of crossover interference in which
the occurrence of one crossover limits another event in the immediate vicinity.
Another explanation is that the presence of DSBs in one region suppresses another
DSB in the nearby region (Wu and Lichten, 1995). Therefore, increasing DSBs in the
HIS4 region could reduce the presence of DSBs at the adjacent interval HYG-LEU2.
7.9 Conclusion
In S. cerevisiae, the knowledge of how cells adapt to environmental stress conditions in
the regulation of cellular processes such as gene expression has long been studied
(Gasch and Werner-Washburne, 2002). The influence of environmental factors,
specifically temperature and nutritional starvation, on meiotic recombination has only
beginning to be elucidated. Our study provides further evidence on the effect of
nutritional environment upon recombination hotspot at HIS4, which is mediated by a
variety of different mechanisms (Table 7.1).
We showed that the level of gene conversion at HIS4 and crossing over of flanking
markers can be manipulated by modulating intracellular and extracellular nutrients,
specifically adenine and amino acids. Bas1/2p plays an essential role in regulating the
effect of starvation and chromatin alteration on recombination, while Gcn4p also
partly contributes for starvation-induced activation of recombination. Furthermore, we

221
suggest that the level of the purine biosynthetic intermediate AICAR is the major factor
influencing Bas1/2p-dependent activity of the HIS4 hotspot.
Information regarding environmental modulation upon the level of recombination is
useful for meiotic recombination studies for generating a high starting level of
recombination. Substantial comparison between different tested conditions or gene
modifications can be obtained, when a ‘wild type’ condition is at a relatively high level.
For example, experiments on the effect of a specific gene mutation on meiotic
recombination can be compared to the wild type, by consistently sporulated under
starvation conditions.
Observations obtained in this study can also provide significant implication in
understanding different aspect of meiotic recombination. If the environmental
influences on recombination activity can be seen at other Bas1/2p and Gcn4p target
genes genome-wide, this can provide information of the controlling factors mediating
global distribution of recombination hotspots in yeast. Furthermore, the data in this
study also demonstrated that an unknown factor(s) also plays a role in activating
recombination in response to starvation, independently of Bas1/2p and Gcn4p. If
genes other than HIS4 can be found to respond to this same effect, analysis of these
loci may provide clues to predict this unknown factor. The data from this study can
also contribute for the understanding of the regulation of transcription factor-
dependent hotspot activity, which is conserved in higher eukaryotes.

222
APPENDICES
Appendix I: Factors affecting Meiotic Recombination Activity at the HIS4 Hotspot in S.
cerevisiae
1. AICAR, an intermediate from the purine and histidine biosynthesis pathways.
2. Continuous starvation for adenine and amino acids before and during
sporulation.
3. Starvation for adenine and amino acids during sporulation in cells auxotrophic
for adenine.
4. Inactivation of the Set2 methyltransferase activity, presumably due to
hyperacetylation of histones near the region of DSB at HIS4.

223
Appendix II: Growth phenotype of gcn4Δ cells (Met+ and Leu+ phenotypes) in the Y55
and the H390 x H330 strain background (FAD 640 strains) after one day of incubation
at 30°C. A: Growth on the methionine ‘drop-out’ medium. B: Growth on the leucine
‘drop-out’ medium.
A
Y55 3595
FAD 640-3C
FAD 640-8C
B FAD 640-3C
FAD 640-8C
Y55 3595

224
REFERENCES
ABDULLAH, M. F. & BORTS, R. H. (2001) Meiotic recombination frequencies are affected by nutritional states in Saccharomyces cerevisiae. Proc Natl Acad Sci U S A, 98, 14524-9.
ABDULLAH, M. F., HOFFMANN, E. R., COTTON, V. E. & BORTS, R. H. (2004) A role for the MutL homologue MLH2 in controlling heteroduplex formation and in regulating between two different crossover pathways in budding yeast. Cytogenet Genome Res, 107, 180-90.
ABDULLAH, M. F. F. (2002) Transcription factors and mismatch repair proteins in meiotic recombination. Ph.D. Thesis, University of Oxford, Oxford.
AGARWAL, S. & ROEDER, G. S. (2000) Zip3 provides a link between recombination enzymes and synaptonemal complex proteins. Cell, 102, 245-55.
ALLERS, T. & LICHTEN, M. (2001) Differential timing and control of noncrossover and crossover recombination during meiosis. Cell, 106, 47-57.
AMIN, A. D., CHAIX, A. B. H., MASON, R. P., BADGE, R. M. & BORTS, R. H. (2010) The roles of the Saccharomyces cerevisiae RecQ helicase SGS1 in meiotic genome surveillance. PLoS ONE, 5, e15380.
ARNDT, K. & FINK, G. R. (1986) GCN4 protein, a positive transcription factor in yeast, binds general control promoters at all 5' TGACTC 3' sequences. Proc Natl Acad Sci U S A, 83, 8516-8520.
ARNDT, K. T., STYLES, C. & FINK, G. R. (1987) Multiple global regulators control HIS4 transcription in yeast. Science, 237, 874-80.
ARNDT, K. T., STYLES, C. A. & FINK, G. R. (1989) A suppressor of a HIS4 transcriptional defect encodes a protein with homology to the catalytic subunit of protein phosphatases. Cell, 56, 527-537.
ARNHEIM, N., CALABRESE, P. & TIEMANN-BOEGE, I. (2007) Mammalian meiotic recombination hotspots. Annu Rev Genet, 41, 369-399.
ARORA, C., KEE, K., MALEKI, S. & KEENEY, S. (2004) Antiviral protein Ski8 is a direct partner of Spo11 in meiotic DNA break formation, independent of its cytoplasmic role in RNA metabolism. Mol Cell, 13, 549-59.
BARBARID, S., MÜNSTERKÖTTER, M., SVAREN, J. & HÖRZ, W. (1996) The homeodomain protein Pho2 and the basic-helix-loop-helix protein Pho4 bind DNA cooperatively at the yeast PHO5 promoter. Nucl Acids Res, 24, 4479-4486.
BAUDAT, F., BUARD, J., GREY, C., FLEDEL-ALON, A., OBER, C., PRZEWORSKI, M., COOP, G. & DE MASSY, B. (2010) PRDM9 is a major determinant of meiotic recombination hotspots in humans and mice. Science, 327, 836-840.
BAUDAT, F. & NICOLAS, A. (1997) Clustering of meiotic double-strand breaks on yeast chromosome III. Proc Natl Acad Sci U S A, 94, 5213-8.
BENJAMINI, Y. & HOCHBERG, Y. (1995) Controlling the false discovery rate: A practical and powerful approach to multiple testing. Journal of the Royal Statistical Society. Series B (Methodological), 57, 289-300.

225
BHOITE, L. T., ALLEN, J. M., GARCIA, E., THOMAS, L. R., GREGORY, I. D., VOTH, W. P., WHELIHAN, K., ROLFES, R. J. & STILLMAN, D. J. (2002) Mutations in the Pho2 (Bas2) transcription factor that differentially affect activation with its partner proteins Bas1, Pho4, and Swi5. J Biol Chem, 277, 37612-37618.
BISHOP, D. K. & ZICKLER, D. (2004) Early decision; meiotic crossover interference prior to stable strand exchange and synapsis. Cell, 117, 9-15.
BLAT, Y., PROTACIO, R. U., HUNTER, N. & KLECKNER, N. (2002) Physical and functional interactions among basic chromosome organizational features govern early steps of meiotic chiasma formation. Cell, 111, 791-802.
BLITZBLAU, H. G., BELL, G. W., RODRIGUEZ, J., BELL, S. P. & HOCHWAGEN, A. (2007) Mapping of meiotic single-stranded DNA reveals double-strand-break hotspots near centromeres and telomeres. Curr Biol, 17, 2003-2012.
BODDY, M. N., GAILLARD, P. H., MCDONALD, W. H., SHANAHAN, P., YATES, J. R., 3RD & RUSSELL, P. (2001) Mus81-Eme1 are essential components of a Holliday junction resolvase. Cell, 107, 537-48.
BODENMILLER, B., WANKA, S., KRAFT, C., URBAN, J., CAMPBELL, D., PEDRIOLI, P. G., GERRITS, B., PICOTTI, P., LAM, H., VITEK, O., BRUSNIAK, M.-Y., ROSCHITZKI, B., ZHANG, C., SHOKAT, K. M., SCHLAPBACH, R., COLMAN-LERNER, A., NOLAN, G. P., NESVIZHSKII, A. I., PETER, M., LOEWITH, R., VON MERING, C. & AEBERSOLD, R. (2010) Phosphoproteomic analysis reveals interconnected system-wide responses to perturbations of kinases and phosphatases in yeast. Sci. Signal., 3, rs4-.
BORDE, V. & COBB, J. (2009) Double functions for the Mre11 complex during DNA double-strand break repair and replication. Int J Biochem Cell Biol, 41, 1249-1253.
BORDE, V., GOLDMAN, A. S. & LICHTEN, M. (2000) Direct coupling between meiotic DNA replication and recombination initiation. Science, 290, 806-9.
BORDE, V., ROBINE, N., LIN, W., BONFILS, S., GELI, V. & NICOLAS, A. (2009) Histone H3 lysine 4 trimethylation marks meiotic recombination initiation sites. Embo J, 28, 99-111.
BORNER, G. V., KLECKNER, N. & HUNTER, N. (2004) Crossover/noncrossover differentiation, synaptonemal complex formation, and regulatory surveillance at the leptotene/zygotene transition of meiosis. Cell, 117, 29-45.
BORTS, R. H. (2009) The new yeast is a mouse. PLoS Biol, 7, e1000106. BRAZAS, R. M. & STILLMAN, D. J. (1993a) Identification and purification of a protein
that binds DNA cooperatively with the yeast SWI5 protein. Mol Cell Biol, 13, 5524-5537.
BRAZAS, R. M. & STILLMAN, D. J. (1993b) The Swi5 zinc-finger and Grf10 homeodomain proteins bind DNA cooperatively at the yeast HO promoter. Proc Natl Acad Sci USA, 90, 11237-11241.
BUARD, J., BARTHES, P., GREY, C. & DE MASSY, B. (2009) Distinct histone modifications define initiation and repair of meiotic recombination in the mouse. Embo J, 28, 2616-2624.
BUGREEV, D. V., GOLUB, E. I., STASIAK, A. Z., STASIAK, A. & MAZIN, A. V. (2005) Activation of human meiosis-specific recombinase Dmc1 by Ca2+. J Biol Chem, 280, 26886-26895.

226
BUHLER, C., BORDE, V. & LICHTEN, M. (2007) Mapping meiotic single-strand DNA reveals a new landscape of DNA double-strand breaks in Saccharomyces cerevisiae. PLoS Biol, 5, e324.
BÜRGLIN, T. R. (1988) The yeast regulatory gene PHO2 encodes a homeo box. Cell, 53, 339-340.
CAO, L., ALANI, E. & KLECKNER, N. (1990) A pathway for generation and processing of double-strand breaks during meiotic recombination in S. cerevisiae. Cell, 61, 1089-101.
CARROZZA, M. J., LI, B., FLORENS, L., SUGANUMA, T., SWANSON, S. K., LEE, K. K., SHIA, W.-J., ANDERSON, S., YATES, J., WASHBURN, M. P. & WORKMAN, J. L. (2005) Histone H3 methylation by Set2 directs deacetylation of coding regions by Rpd3S to suppress spurious intragenic transcription. Cell, 123, 581-592.
CHEN, Z., YANG, H. & PAVLETICH, N. P. (2008) Mechanism of homologous recombination from the RecA-ssDNA/dsDNA structures. Nature, 453, 489-494.
CHUA, P. R. & ROEDER, G. S. (1998) Zip2, a meiosis-specific protein required for the initiation of chromosome synapsis. Cell, 93, 349-59.
COLE, F., KEENEY, S. & JASIN, M. (2010) Evolutionary conservation of meiotic DSB proteins: more than just Spo11. Genes Dev, 24, 1201-1207.
COTTON, V. E. (2007) A structural and functional analysis of mismatch repair proteins in meiosis. Ph.D Thesis, Department of Genetics, University of Leicester.
COTTON, V. E., HOFFMANN, E. R., ABDULLAH, M. F. & BORTS, R. H. (2009) Interaction of genetic and environmental factors in Saccharomyces cerevisiae meiosis: the devil is in the details. Methods Mol. Biol, 557, 3-20.
COTTON, V. E., HOFFMANN, E. R. & BORTS, R. H. (2010) Distinct regulation of Mlh1p heterodimers in meiosis and mitosis in Saccharomyces cerevisiae. Genetics, 185, 459-467.
CROMIE, G. A. & SMITH, G. R. (2007) Branching out: meiotic recombination and its regulation. Trends Cell Biol, 17, 448-55.
DAIGNAN-FORNIER, B. & FINK, G. R. (1992) Coregulation of purine and histidine biosynthesis by the transcriptional activators BAS1 and BAS2. Proc Natl Acad Sci USA, 89, 6746-6750.
DE LOS SANTOS, T., HUNTER, N., LEE, C., LARKIN, B., LOIDL, J. & HOLLINGSWORTH, N. M. (2003) The mus81/mms4 endonuclease acts independently of double-holliday junction resolution to promote a distinct subset of crossovers during meiosis in budding yeast. Genetics, 164, 81-94.
DE LOS SANTOS, T., LOIDL, J., LARKIN, B. & HOLLINGSWORTH, N. M. (2001) A role for MMS4 in the processing of recombination intermediates during meiosis in Saccharomyces cerevisiae. Genetics, 159, 1511-25.
DE MASSY, B. & NICOLAS, A. (1993) The control in cis of the position and the amount of the ARG4 meiotic double-strand break of Saccharomyces cerevisiae. Embo J, 12, 1459-66.
DENIS, V., BOUCHERIE, H., MONRIBOT, C. & DAIGNAN-FORNIER, B. (1998) Role of the myb-like protein Bas1p in Saccharomyces cerevisiae: a proteome analysis. Mol Microbiol, 30, 557-66.

227
DENIS, V. & DAIGNAN-FORNIER, B. (1998) Synthesis of glutamine, glycine and 10-formyl tetrahydrofolate is coregulated with purine biosynthesis in Saccharomyces cerevisiae. Mol Gen Genet, 259, 246-55.
DETLOFF, P., WHITE, M. A. & PETES, T. D. (1992) Analysis of a gene conversion gradient at the HIS4 locus in Saccharomyces cerevisiae. Genetics, 132, 113-23.
DEUTSCHBAUER, A. M., JARAMILLO, D. F., PROCTOR, M., KUMM, J., HILLENMEYER, M. E., DAVIS, R. W., NISLOW, C. & GIAEVER, G. (2005) Mechanisms of haploinsufficiency revealed by genome-wide profiling in yeast. Genetics, 169, 1915-1925.
DEVLIN, C., TICE-BALDWIN, K., SHORE, D. & ARNDT, K. T. (1991) RAP1 is required for BAS1/BAS2- and GCN4-dependent transcription of the yeast HIS4 gene. Mol Cell Biol, 11, 3642-51.
EGEL, R. (1978) Synaptonemal complex and crossing-over: structural support or interference? Heredity, 41, 233-237.
ERDENIZ, N., MORTENSEN, U. H. & ROTHSTEIN, R. (1997) Cloning-free PCR-based allele replacement methods. Genome Res, 7, 1174-83.
FAN, Q. & PETES, T. (1996) Relationship between nuclease-hypersensitive sites and meiotic recombination hot spot activity at the HIS4 locus of Saccharomyces cerevisiae. Mol Cell Biol, 16, 2037-2043.
FAN, Q., XU, F. & PETES, T. D. (1995) Meiosis-specific double-strand DNA breaks at the HIS4 recombination hot spot in the yeast Saccharomyces cerevisiae: control in cis and trans. Mol Cell Biol, 15, 1679-88.
FERRARI, S. R., GRUBB, J. & BISHOP, D. K. (2009) The Mei5-Sae3 protein complex mediates Dmc1 activity in Saccharomyces cerevisiae. J Biol Chem, 284, 11766-11770.
FOSS, E., LANDE, R., STAHL, F. W. & STEINBERG, C. M. (1993) Chiasma interference as a function of genetic distance. Genetics, 133, 681-91.
FUNG, J. C., ROCKMILL, B., ODELL, M. & ROEDER, G. S. (2004) Imposition of crossover interference through the nonrandom distribution of synapsis initiation complexes. Cell, 116, 795-802.
GAO, J., DAVIDSON, M. K. & WAHLS, W. P. (2009) Phosphorylation-independent regulation of Atf1-promoted meiotic recombination by stress-activated, p38 kinase Spc1 of fission yeast. PLoS ONE, 4, e5533.
GASCH, A. & WERNER-WASHBURNE, M. (2002) The genomics of yeast responses to environmental stress and starvation. Functional & Integrative Genomics, 2, 181-192.
GERTON, J. L., DERISI, J., SHROFF, R., LICHTEN, M., BROWN, P. O. & PETES, T. D. (2000) Inaugural article: global mapping of meiotic recombination hotspots and coldspots in the yeast Saccharomyces cerevisiae. Proc Natl Acad Sci U S A, 97, 11383-90.
GHAEMMAGHAMI, S., HUH, W.-K., BOWER, K., HOWSON, R. W., BELLE, A., DEPHOURE, N., O'SHEA, E. K. & WEISSMAN, J. S. (2003) Global analysis of protein expression in yeast. Nature, 425, 737-741.
GIAEVER, G., CHU, A. M., NI, L., CONNELLY, C., RILES, L., VERONNEAU, S., DOW, S., LUCAU-DANILA, A., ANDERSON, K., ANDRE, B., ARKIN, A. P., ASTROMOFF, A., EL BAKKOURY, M., BANGHAM, R., BENITO, R., BRACHAT, S., CAMPANARO, S., CURTISS, M., DAVIS, K., DEUTSCHBAUER, A., ENTIAN, K.-D., FLAHERTY, P.,

228
FOURY, F., GARFINKEL, D. J., GERSTEIN, M., GOTTE, D., GULDENER, U., HEGEMANN, J. H., HEMPEL, S., HERMAN, Z., JARAMILLO, D. F., KELLY, D. E., KELLY, S. L., KOTTER, P., LABONTE, D., LAMB, D. C., LAN, N., LIANG, H., LIAO, H., LIU, L., LUO, C., LUSSIER, M., MAO, R., MENARD, P., OOI, S. L., REVUELTA, J. L., ROBERTS, C. J., ROSE, M., ROSS-MACDONALD, P., SCHERENS, B., SCHIMMACK, G., SHAFER, B., SHOEMAKER, D. D., SOOKHAI-MAHADEO, S., STORMS, R. K., STRATHERN, J. N., VALLE, G., VOET, M., VOLCKAERT, G., WANG, C.-Y., WARD, T. R., WILHELMY, J., WINZELER, E. A., YANG, Y., YEN, G., YOUNGMAN, E., YU, K., BUSSEY, H., BOEKE, J. D., SNYDER, M., PHILIPPSEN, P., DAVIS, R. W. & JOHNSTON, M. (2002) Functional profiling of the Saccharomyces cerevisiae genome. Nature, 418, 387-391.
GIETZ, D., ST JEAN, A., WOODS, R. A. & SCHIESTL, R. H. (1992) Improved method for high efficiency transformation of intact yeast cells. Nucleic Acids Res, 20, 1425.
GOLDSTEIN, A. L. & MCCUSKER, J. H. (1999) Three new dominant drug resistance cassettes for gene disruption in Saccharomyces cerevisiae. Yeast, 15, 1541 - 1553.
GRANDIN, N. & REED, S. I. (1993) Differential function and expression of Saccharomyces cerevisiae B-type cyclins in mitosis and meiosis. Mol Cell Biol, 13, 2113-2125.
GREENE, J., VOTH, W., AND STILLMAN, D. (1994) MacTetrad 6.9 and MacTetrad 6.7.3, in Gopher, from www.merlot.welch.jhu.edu.
GREY, C., BARTHÈS, P., CHAUVEAU-LE FRIEC, G., LANGA, F., BAUDAT, F. & DE MASSY, B. (2011) Mouse PRDM9 DNA-binding specificity determines sites of histone H3 lysine 4 trimethylation for initiation of meiotic recombination. PLoS Biol, 9, e1001176.
GUILLON, H. & DE MASSY, B. (2002) An initiation site for meiotic crossing-over and gene conversion in the mouse. Nat Genet, 32, 296-299.
GUTZ, H. (1971) Site specific induction of gene conversion in Schizosaccharomyces pombe Genetics, 69, 317-337.
HABER, J. E., IRA, G., MALKOVA, A. & SUGAWARA, N. (2004) Repairing a double-strand chromosome break by homologous recombination: revisiting Robin Holliday's model. Philosophical transactions of the Royal Society of London. Series B, Biological sciences, 359, 79-86.
HASSOLD, T., HALL, H. & HUNT, P. (2007) The origin of human aneuploidy: where we have been, where we are going. Hum Mol Genet, 16, R203-R208.
HAYASE, A., TAKAGI, M., MIYAZAKI, T., OSHIUMI, H., SHINOHARA, M. & SHINOHARA, A. (2004) A protein complex containing Mei5 and Sae3 promotes the assembly of the meiosis-specific RecA homolog Dmc1. Cell, 119, 927-40.
HEY, J. (2004) What's so hot about recombination hotspots? PLoS Biol, 2, e190. HILLERS, K. J. (2004) Crossover interference. Curr Biol, 14, R1036-7. HINNEBUSCH, A. G. (1988) Mechanisms of gene regulation in the general control of
amino acid biosynthesis in Saccharomyces cerevisiae. Microbiol Rev, 52, 248-73.
HINNEBUSCH, A. G. & NATARAJAN, K. (2002) Gcn4p, a master regulator of gene expression is controlled at multiple levels by diverse signals of starvation and stress. Eukaryotic Cell, 1, 22-32.

229
HOCHWAGEN, A. & MARAIS, GABRIEL A. B. (2010) Meiosis: A PRDM9 guide to the hotspots of recombination. Curr Biol, 20, R271-R274.
HODGSON, A., TERENTYEV, Y., JOHNSON, R. A., BISHOP-BAILEY, A., ANGEVIN, T., CROUCHER, A. & GOLDMAN, A. S. H. (2010) Mre11 and Exo1 contribute to the initiation and processivity of resection at meiotic double-strand breaks made independently of Spo11. DNA Repair, 10, 138-148.
HOFFMANN, E. R. & BORTS, R. H. (2004) Meiotic recombination intermediates and mismatch repair proteins. Cytogenet Genome Res, 107, 232-48.
HOFFMANN, E. R., ERIKSSON, E., HERBERT, B. J. & BORTS, R. H. (2005) MLH1 and MSH2 promote the symmetry of double-strand break repair events at the HIS4 hotspot in Saccharomyces cerevisiae. Genetics, 169, 1291-303.
HOFFMANN, E. R., SHCHERBAKOVA, P. V., KUNKEL, T. A. & BORTS, R. H. (2003) MLH1 mutations differentially affect meiotic functions in Saccharomyces cerevisiae. Genetics, 163, 515-526.
HOLLIDAY, R. (1964) A mechanism for gene conversion in fungi. Genet Res, 5, 282-304.
HOLLINGSWORTH, N. M. & BRILL, S. J. (2004) The Mus81 solution to resolution: generating meiotic crossovers without Holliday junctions. Genes Dev, 18, 117-25.
HONG, S.-P. & CARLSON, M. (2007) Regulation of Snf1 protein kinase in response to environmental stress. J Biol Chem, 282, 16838-16845.
HONIGBERG, S. M. & LEE, R. H. (1998) Snf1 kinase connects nutritional pathways controlling meiosis in Saccharomyces cerevisiae. Mol Cell Biol, 18, 4548-4555.
HOPE, I. A. & STRUHL, K. (1985) GCN4 protein, synthesize in vitro, binds HIS3 regulatory sequences: Implications for general control of amino acid biosynthetic genes in yeast. Cell, 43, 177-188.
HØVRING, I., BOSTAD, A., ORDING, E., MYRSET, A. H. & GABRIELSEN, O. S. (1994) DNA-binding domain and recognition sequence of the yeast BAS1 protein, a divergent member of the Myb family of transcription factors. J Biol Chem, 269, 17663-17669.
HUNTER, N. (2006) Meiotic recombination. IN AGUILERA, A. & ROTHSTEIN, R. (Eds.) Homologous recombination. Heidelberg, Springer-Verlag.
HUNTER, N. & BORTS, R. H. (1997) Mlh1 is unique among mismatch repair proteins in its ability to promote crossing-over during meiosis. Genes Dev, 11, 1573-1582.
HUNTER, N. & KLECKNER, N. (2001) The single-end invasion: an asymmetric intermediate at the double-strand break to double-holliday junction transition of meiotic recombination. Cell, 106, 59-70.
IP, S. C. Y., RASS, U., BLANCO, M. G., FLYNN, H. R., SKEHEL, J. M. & WEST, S. C. (2008) Identification of Holliday junction resolvases from humans and yeast. Nature, 456, 357-361.
ISOBE, T., YOSHINO, M., MIZUNO, K.-I., LINDAHL, K. F., KOIDE, T., GAUDIERI, S., GOJOBORI, T. & SHIROISHI, T. (2002) Molecular characterization of the Pb recombination hotspot in the mouse major histocompatibility complex class II region. Genomics, 80, 229-235.
JEFFREYS, A. J., HOLLOWAY, J. K., KAUPPI, L., MAY, C. A., NEUMANN, R., SLINGSBY, M. T. & WEBB, A. J. (2004) Meiotic recombination hot spots and human DNA

230
diversity. Philosophical Transactions of the Royal Society of London. Series B: Biological Sciences, 359, 141-152.
JEFFREYS, A. J., NEUMANN, R. & WILSON, V. (1990) Repeat unit sequence variation in minisatellites: a novel source of DNA polymorphism for studying variation and mutation by single molecule analysis. Cell, 60, 473-85.
JENG, Y. M., CAI-NG, S., LI, A., FURUTA, S., CHEW, H., CHEN, P. L., LEE, E. Y. H. & LEE, W. H. (2007) Brca1 heterozygous mice have shortened life span and are prone to ovarian tumorigenesis with haploinsufficiency upon ionizing irradiation. Oncogene, 26, 6160-6166.
JOHNSON, D. S., MORTAZAVI, A., MYERS, R. M. & WOLD, B. (2007) Genome-wide mapping of in vivo protein-DNA interactions. Science, 316, 1497-1502.
JOLIVET, S., VEZON, D., FROGER, N. & MERCIER, R. (2006) Non conservation of the meiotic function of the Ski8/Rec103 homolog in Arabidopsis. Genes to Cells, 11, 615-622.
JONES, G. H., FRANKLIN, F. & CHRIS, H. (2006) Meiotic crossing-over: Obligation and interference. Cell, 126, 246-248.
JOO, Y. J., KIM, J.-H., KANG, U.-B., YU, M.-H. & KIM, J. (2011) Gcn4p-mediated transcriptional repression of ribosomal protein genes under amino-acid starvation. Embo J, 30, 859-872.
KAFFMAN, A., HERSKOWITZ, I., TJIAN, R. & O'SHEA, E. (1994) Phosphorylation of the transcription factor PHO4 by a cyclin-CDK complex, PHO80-PHO85. Science, 263, 1153-1156.
KAGAWA, W. & KURUMIZAKA, H. (2010) From meiosis to postmeiotic events: Uncovering the molecular roles of the meiosis-specific recombinase Dmc1. FEBS Journal, 277, 590-598.
KEELAGHER, R. E., COTTON, V. E., GOLDMAN, A. S. H. & BORTS, R. H. (2010) Separable roles for Exonuclease I in meiotic DNA double-strand break repair. DNA Repair (Amst), 10, 126-137.
KEENEY, S. (2001) Mechanism and control of meiotic recombination initiation. Curr Top Dev Biol, 52, 1-53.
KEENEY, S., GIROUX, C. N. & KLECKNER, N. (1997) Meiosis-specific DNA double-strand breaks are catalyzed by Spo11, a member of a widely conserved protein family. Cell, 88, 375-84.
KEENEY, S. & KLECKNER, N. (1995) Covalent protein-DNA complexes at the 5' strand termini of meiosis-specific double-strand breaks in yeast. Proc Natl Acad Sci U S A, 92, 11274-8.
KEOGH, M.-C., KURDISTANI, S. K., MORRIS, S. A., AHN, S. H., PODOLNY, V., COLLINS, S. R., SCHULDINER, M., CHIN, K., PUNNA, T., THOMPSON, N. J., BOONE, C., EMILI, A., WEISSMAN, J. S., HUGHES, T. R., STRAHL, B. D., GRUNSTEIN, M., GREENBLATT, J. F., BURATOWSKI, S. & KROGAN, N. J. (2005) Cotranscriptional Set2 methylation of histone H3 lysine 36 recruits a repressive Rpd3 complex. Cell, 123, 593-605.
KHAZANEHDARI, K. A. & BORTS, R. H. (2000) EXO1 and MSH4 differentially affect crossing-over and segregation. Chromosoma, 109, 94-102.
KIRKPATRICK, D. T., FAN, Q. & PETES, T. D. (1999a) Maximal stimulation of meiotic recombination by a yeast transcription factor requires the transcription activation domain and a DNA-binding domain. Genetics, 152, 101-15.

231
KIRKPATRICK, D. T., WANG, Y. H., DOMINSKA, M., GRIFFITH, J. D. & PETES, T. D. (1999b) Control of meiotic recombination and gene expression in yeast by a simple repetitive DNA sequence that excludes nucleosomes. Mol Cell Biol, 19, 7661-71.
KLECKNER, N., ZICKLER, D., JONES, G. H., DEKKER, J., PADMORE, R., HENLE, J. & HUTCHINSON, J. (2004) A mechanical basis for chromosome function. Proc Natl Acad Sci USA.
KOEHLER, R. N., RACHFALL, N. & ROLFES, R. J. (2007) Activation of the ADE genes requires the chromatin remodeling complexes SAGA and SWI/SNF. Eukaryot Cell, 6, 1474-1485.
KOMEILI, A. & O'SHEA, E. K. (1999) Roles of phosphorylation sites in regulating activity of the transcription factor Pho4. Science, 284, 977-980.
KON, N., KRAWCHUK, M., WARREN, B., SMITH, G. & WAHLS, W. (1997) Transcription factor Mts1/Mts2 (Atf1/Pcr1, Gad7/Pcr1) activates the M26 meiotic recombination hotspot in Schizosaccharomyces pombe. Proc Natl Acad Sci USA 94, 13765 - 13770.
KOUZARIDES, T. (2007) Chromatin modifications and their function. Cell, 128, 693-705.
KUMAR, R., BOURBON, H.-M. & DE MASSY, B. (2010) Functional conservation of Mei4 for meiotic DNA double-strand break formation from yeasts to mice. Genes Dev, 24, 1266-1280.
KWABI-ADDO, B., GIRI, D., SCHMIDT, K., PODSYPANINA, K., PARSONS, R., GREENBERG, N. & ITTMANN, M. (2001) Haploinsufficiency of the Pten tumor suppressor gene promotes prostate cancer progression. Proc Natl Acad Sci USA, 98, 11563-11568.
LEE, B. H. & AMON, A. (2003) Role of polo-like kinase CDC5 in programming meiosis I chromosome segregation. Science, 300, 482-486.
LEE, T. I. & YOUNG, R. A. (2000) Transcription of eukaryotic protein-coding genes Annu Rev Genet, 34, 77-137.
LENGSFELD, B. M., RATTRAY, A. J., BHASKARA, V., GHIRLANDO, R. & PAULL, T. T. (2007) Sae2 Is an endonuclease that processes hairpin DNA cooperatively with the Mre11/Rad50/Xrs2 complex. Mol Cell, 28, 638-651.
LICHTEN, M. (2008) Meiotic chromatin: The substrate for recombination initiation recombination and meiosis. IN EGEL, R. & LANKENAU, D.-H. (Eds.). Springer Berlin /
Heidelberg. LICHTEN, M. & GOLDMAN, A. S. (1995) Meiotic recombination hotspots. Annu Rev
Genet, 29, 423-44. LIN, L.-J., MINARD, L. V., JOHNSTON, G. C., SINGER, R. A. & SCHULTZ, M. C. (2010)
Asf1 can promote trimethylation of H3 K36 by Set2. Mol Cell Biol, 30, 1116-1129.
LIN, W., WANG, M., JIN, H. & YU, H.-G. (2011) Cohesin plays a dual role in gene regulation and sister-chromatid cohesion during meiosis in Saccharomyces cerevisiae. Genetics, 187, 1041-1051.
LIU, C., YANG, Z., YANG, J., XIA, Z. & AO, S. (2000) Regulation of the yeast transcriptional factor PHO2 activity by phosphorylation. J Biol Chem, 275, 31972-31978.
LOCKER, J. (2000) Transcription factors, Oxford, , GBR, BIOS Scientific Publishers.

232
LONGTINE, M. S., MCKENZIE, A., 3RD, DEMARINI, D. J., SHAH, N. G., WACH, A., BRACHAT, A., PHILIPPSEN, P. & PRINGLE, J. R. (1998) Additional modules for versatile and economical PCR-based gene deletion and modification in Saccharomyces cerevisiae. Yeast, 14, 953-61.
LYNN, A., SOUCEK, R. & BORNER, G. V. (2007) ZMM proteins during meiosis: Crossover artists at work. Chromosome Res, 15, 591-605.
MALEKI, S., NEALE, M., ARORA, C., HENDERSON, K. & KEENEY, S. (2007) Interactions between Mei4, Rec114, and other proteins required for meiotic DNA double-strand break formation in Saccharomyces cerevisiae. Chromosoma, 116, 471-486.
MALKOVA, A., SWANSON, J., GERMAN, M., MCCUSKER, J. H., HOUSWORTH, E. A., STAHL, F. W. & HABER, J. E. (2004) Gene conversion and crossing over along the 405-kb left arm of Saccharomyces cerevisiae chromosome VII. Genetics, 168, 49-63.
MALONE, R. E., KIM, S., BULLARD, S. A., LUNDQUIST, S., HUTCHINGS-CROW, L., CRAMTON, S., LUTFIYYA, L. & LEE, J. (1994) Analysis of a recombination hotspot for gene conversion occurring at the HIS2 gene of Saccharomyces cerevisiae. Genetics, 137, 5-18.
MANFRINI, N., GUERINI, I., CITTERIO, A., LUCCHINI, G. & LONGHESE, M. P. (2010) Processing of meiotic DNA double strand breaks requires cyclin-dependent kinase and multiple nucleases. J Biol Chem, 285, 11628-11637.
MANI, P., YADAV, V. K., DAS, S. K. & CHOWDHURY, S. (2009) Genome-wide analyses of recombination prone regions predict role of DNA structural motif in recombination. PLoS ONE, 4, e4399.
MARSOLIER-KERGOAT, M.-C. & YERAMIAN, E. (2009) GC content and recombination: Reassessing the causal effects for the Saccharomyces cerevisiae genome. Genetics, 183, 31-38.
MARTINI, E., DIAZ, R. L., HUNTER, N. & KEENEY, S. (2006) Crossover homeostasis in yeast meiosis. Cell, 126, 285-295.
MERKER, J. D., DOMINSKA, M., GREENWELL, P. W., RINELLA, E., BOUCK, D. C., SHIBATA, Y., STRAHL, B. D., MIECZKOWSKI, P. & PETES, T. D. (2008) The histone methylase Set2p and the histone deacetylase Rpd3p repress meiotic recombination at the HIS4 meiotic recombination hotspot in Saccharomyces cerevisiae. DNA Repair, 7, 1298-1308.
MESELSON, M. S. & RADDING, C. M. (1975) A general model for genetic recombination. Proc Natl Acad Sci USA, 72, 358-361.
MIECZKOWSKI, P., DOMINSKA, M., BUCK, M., GERTON, J., LIEB, J. & PETES, T. (2006) Global analysis of the relationship between the binding of the Bas1p transcription factor and meiosis-specific double-strand DNA breaks in Saccharomyces cerevisiae. Mol Cell Biol, 26, 1014 - 1027.
MIECZKOWSKI, P. A., DOMINSKA, M., BUCK, M. J., LIEB, J. D. & PETES, T. D. (2007) Loss of a histone deacetylase dramatically alters the genomic distribution of Spo11p-catalyzed DNA breaks in Saccharomyces cerevisiae. Proc Natl Acad Sci USA, 104, 3955-3960.
MIZUNO, K., EMURA, Y., BAUR, M., KOHLI, J., OHTA, K. & SHIBATA, T. (1997) The meiotic recombination hot spot created by the single-base substitution ade6-

233
M26 results in remodeling of chromatin structure in fission yeast. Genes Dev, 11, 876-86.
MOLL, T., TEBB, G., SURANA, U., ROBITSCH, H. & NASMYTH, K. (1991) The role of phosphorylation and the CDC28 protein kinase in cell cycle-regulated nuclear import of the S. cerevisiae transcription factor SW15. Cell, 66, 743-758.
MOREAU, S., FERGUSON, J. R. & SYMINGTON, L. S. (1999) The nuclease activity of Mre11 is required for meiosis but not for mating type switching, end joining, or telomere maintenance. Mol Cell Biol, 19, 556-66.
MUERS, M. (2010) Recombination: The gene that hits the hot spot. Nat Rev Genet, 11, 92-92.
MYASNIKOV, A. N., SASNAUSKAS, K. V., JANULAITIS, A. A. & SMIRNOV, M. N. (1991) The Saccharomyces cerevisiae ADE1 gene: structure, overexpression and possible regulation by general amino acid control. Gene, 109, 143-147.
MYERS, S., BOWDEN, R., TUMIAN, A., BONTROP, R. E., FREEMAN, C., MACFIE, T. S., MCVEAN, G. & DONNELLY, P. (2010) Drive against hotspot motifs in primates implicates the PRDM9 gene in meiotic recombination. Science, 327, 876-879.
MYERS, S., FREEMAN, C., AUTON, A., DONNELLY, P. & MCVEAN, G. (2008) A common sequence motif associated with recombination hot spots and genome instability in humans. Nat Genet, 40, 1124-1129.
NASMYTH, K., ADOLF, G., LYDALL, D. & SEDDON, A. (1990) The identification of a second cell cycle control on the HO promoter in yeast: Cell cycle regulation of SWI5 nuclear entry. Cell, 62, 631-647.
NATARAJAN, K., MEYER, M. R., JACKSON, B. M., SLADE, D., ROBERTS, C., HINNEBUSCH, A. G. & MARTON, M. J. (2001) Transcriptional profiling shows that Gcn4p is a master regulator of gene expression during amino acid starvation in yeast. Mol Cell Biol, 21, 4347-4368.
NEALE, M. J. & KEENEY, S. (2006) Clarifying the mechanics of DNA strand exchange in meiotic recombination. Nature, 442, 153-8.
NEALE, M. J., PAN, J. & KEENEY, S. (2005) Endonucleolytic processing of covalent protein-linked DNA double-strand breaks. Nature, 436, 1053-7.
NISHANT, K. T., PLYS, A. J. & ALANI, E. (2008) A mutation in the putative MLH3 endonuclease domain confers a defect in both mismatch repair and meiosis in Saccharomyces cerevisiae. Genetics, 179, 747-755.
NOVAK, J. E., ROSS-MACDONALD, P. B. & ROEDER, G. S. (2001) The budding yeast Msh4 protein functions in chromosome synapsis and the regulation of crossover distribution. Genetics, 158, 1013-25.
O'NEILL, E. M., KAFFMAN, A., JOLLY, E. R. & O'SHEA, E. K. (1996) Regulation of PHO4 nuclear localization by the PHO80-PHO85 cyclin-CDK complex. Science, 271, 209-212.
OHTA, K., SHIBATA, T. & NICOLAS, A. (1994) Changes in chromatin structure at recombination initiation sites during yeast meiosis. Embo J, 13, 5754-5763.
ORLOVA, M., KANTER, E., KRAKOVICH, D. & KUCHIN, S. (2006) Nitrogen availability and TOR regulate the Snf1 protein kinase in Saccharomyces cerevisiae. Eukaryot Cell, 5, 1831-1837.
PAN, J., SASAKI, M., KNIEWEL, R., MURAKAMI, H., BLITZBLAU, HANNAHÂ G., TISCHFIELD, SAMÂ E., ZHU, X., NEALE, MATTHEWÂ J., JASIN, M., SOCCI, NICHOLASÂ D., HOCHWAGEN, A. & KEENEY, S. (2011) A hierarchical

234
combination of factors shapes the genome-wide topography of yeast meiotic recombination initiation. Cell, 144, 719-731.
PAPP, B., PAL, C. & HURST, L. D. (2003) Dosage sensitivity and the evolution of gene families in yeast. Nature, 424, 194-197.
PAQUES, F. & HABER, J. E. (1999) Multiple pathways of recombination induced by double-strand breaks in Saccharomyces cerevisiae. Microbiol Mol Biol Rev, 63, 349-404.
PERKINS, D. D. (1949) Biochemical mutants in the smut fungus Ustilago maydis. Genetics, 34, 607-626.
PETES, T. D. (2001) Meiotic recombination hot spots and cold spots. Nat Rev Genet, 2, 360-369.
PETRONCZKI, M., SIOMOS, M. F. & NASMYTH, K. (2003) Un menage a quatre: the molecular biology of chromosome segregation in meiosis. Cell, 112, 423-40.
PIÑA, B., FERNÁNDEZ-LARREA , J., GARCÍA-REYERO, N. & IDRISSI, F. Z. (2003) The different (sur)faces of Rap1p. Mol Genet Genomics, 268, 791-798.
PINSON, B., KONGSRUD, T. L., ORDING, E., JOHANSEN, L., DAIGNAN-FORNIER, B. & GABRIELSEN, O. S. (2000) Signaling through regulated transcription factor interaction: mapping of a regulatory interaction domain in the Myb-related Bas1p. Nucleic Acids Res, 28, 4665-73.
PINSON, B. T., VAUR, S., SAGOT, I., COULPIER, F., LEMOINE, S. & DAIGNAN-FORNIER, B. (2009) Metabolic intermediates selectively stimulate transcription factor interaction and modulate phosphate and purine pathways. Genes Dev, 23, 1399-1407.
PONTICELLI, A. S., SENA, E. P. & SMITH, G. R. (1988) Genetic and physical analysis of the M26 recombination hotspot of Schizosaccharomyces pombe. Genetics, 119, 491-7.
PRIELER, S., PENKNER, A., BORDE, V. & KLEIN, F. (2005) The control of Spo11's interaction with meiotic recombination hotspots. Genes Dev, 19, 255-69.
PRYCE, D. & MCFARLANE, R. (2009) The meiotic recombination hotspots of Schizosaccharomyces pombe. Genome Dyn, 5, 1-13.
QUON, K. C. & BERNS, A. (2001) Haplo-insufficiency? Let me count the ways. Genes Dev, 15, 2917-2921.
REBORA, K., DESMOUCELLES, C., BORNE, F., PINSON, B. & DAIGNAN-FORNIER, B. (2001) Yeast AMP pathway genes respond to adenine through regulated synthesis of a metabolic intermediate. Mol Cell Biol, 21, 7901-12.
REBORA, K., LALOO, B. & DAIGNAN-FORNIER, B. (2005) Revisiting purine-histidine cross-pathway regulation in Saccharomyces cerevisiae: a central role for a small molecule. Genetics, 170, 61-70.
RESNICK, M. A. & MARTIN, P. (1976) The repair of double-strand breaks in the nuclear DNA of Saccharomyces cerevisiae and its genetic control. Mol Gen Genet, 143, 119-29.
ROBYR, D., SUKA, Y., XENARIOS, I., KURDISTANI, S. K., WANG, A., SUKA, N. & GRUNSTEIN, M. (2002) Microarray deacetylation maps determine genome-wide functions for yeast histone deacetylases. Cell, 109, 437-446.
ROEDER, G. S. (1997) Meiotic chromosomes: it takes two to tango. Genes Dev, 11, 2600-21.

235
ROLFES, R. J. & HINNEBUSCH, A. G. (1993) Translation of the yeast transcriptional activator GCN4 is stimulated by purine limitation: implications for activation of the protein kinase GCN2. Mol Cell Biol, 13, 5099-111.
ROLFES, R. J., ZHANG, F. & HINNEBUSCH, A. G. (1997) The transcriptional activators BAS1, BAS2, and ABF1 bind positive regulatory sites as the critical elements for adenine regulation of ADE5,7. J Biol Chem, 272, 13343-13354.
RUNDLETT, S. E., CARMEN, A. A., KOBAYASHI, R., BAVYKIN, S., TURNER, B. M. & GRUNSTEIN, M. (1996) HDA1 and RPD3 are members of distinct yeast histone deacetylase complexes that regulate silencing and transcription. Proc Natl Acad Sci USA, 93, 14503-14508.
SANTAROSA, M. & ASHWORTH, A. (2004) Haploinsufficiency for tumour suppressor genes: when you don't need to go all the way. Biochim Biophys Acta, 2, 105 - 122.
SCHERER, S. & DAVIS, R. W. (1979) Replacement of chromosome segments with altered DNA sequences constructed in vitro. Proc Natl Acad Sci USA, 76, 4951-4955.
SCHNEIDER, K., SMITH, R. & O'SHEA, E. (1994) Phosphate-regulated inactivation of the kinase PHO80-PHO85 by the CDK inhibitor PHO81. Science, 266, 122-126.
SCHWACHA, A. & KLECKNER, N. (1995) Identification of double Holliday junctions as intermediates in meiotic recombination. Cell, 83, 783-91.
SHENKAR, R., SHEN, M. & ARNHEIM, N. (1991) DNase I-hypersensitive sites and transcription factor-binding motifs within the mouse E beta meiotic recombination hot spot. Mol Cell Biol, 11, 1813 - 1819.
SHERIDAN, S. D., YU, X., ROTH, R., HEUSER, J. E., SEHORN, M. G., SUNG, P., EGELMAN, E. H. & BISHOP, D. K. (2008) A comparative analysis of Dmc1 and Rad51 nucleoprotein filaments. Nucl Acids Res, 36, 4057-4066.
SHINOHARA, M., GASIOR, S. L., BISHOP, D. K. & SHINOHARA, A. (2000) Tid1/Rdh54 promotes colocalization of Rad51 and Dmc1 during meiotic recombination. Proc Natl Acad Sci USA, 97, 10814-10819.
SHINOHARA, M., OH, S. D., HUNTER, N. & SHINOHARA, A. (2008) Crossover assurance and crossover interference are distinctly regulated by the ZMM proteins during yeast meiosis. Nat Genet, 40, 299-309.
SHINOHARA, M., SHITA-YAMAGUCHI, E., BUERSTEDDE, J. M., SHINAGAWA, H., OGAWA, H. & SHINOHARA, A. (1997) Characterization of the roles of the Saccharomyces cerevisiae RAD54 gene and a homologue of RAD54, RDH54/TID1, in mitosis and meiosis. Genetics, 147, 1545-1556.
SNOWDEN, T., ACHARYA, S., BUTZ, C., BERARDINI, M. & FISHEL, R. (2004) hMSH4-hMSH5 recognizes Holliday junctions and forms a meiosis-specific sliding clamp that embraces homologous chromosomes. Mol Cell, 15, 437-451.
SOKAL, R. & ROHLF, F. (1969) Biometry: The principles and practice of statistics in biological research. 1st Edition. W.H. Freeman and Company, NY.
SOLLIER, J., LIN, W., SOUSTELLE, C., SUHRE, K., NICOLAS, A., GELI, V. & DE LA ROCHE SAINT-ANDRE, C. (2004) Set1 is required for meiotic S-phase onset, double-strand break formation and middle gene expression. Embo J, 23, 1957-1967.
SOM, I., MITSCH, R. N., URBANOWSKI, J. L. & ROLFES, R. J. (2005) DNA-bound Bas1 recruits Pho2 to activate ADE genes in Saccharomyces cerevisiae. Eukaryot Cell, 4, 1725-35.

236
SPRINGER, C., KUNZLER, M., BALMELLI, T. & BRAUS, G. H. (1996) Amino acid and adenine cross-pathway regulation act through the same 5'-TGACTC-3' motif in the yeast HIS7 promoter. J Biol Chem, 271, 29637-43.
STAFF, S., ISOLA, J. & TANNER, M. (2003) Haplo-insufficiency of BRCA1 in sporadic breast cancer. Cancer Res, 63, 4978-4983.
STAPLETON, A. & PETES, T. D. (1991) The Tn3 {beta}-lactamase gene acts as a hotspot for meiotic recombination in yeast. Genetics, 127, 39-51.
STEFANELLI, C., STANIC€™, I., BONAVITA, F., FLAMIGNI, F., PIGNATTI, C., GUARNIERI, C. & CALDARERA, C. M. (1998) Inhibition of glucocorticoid-induced apoptosis with 5-Aminoimidazole-4-carboxamide ribonucleoside, a cell-permeable activator of AMP-activated protein kinase. Biochem Biophys Res Commun, 243, 821-826.
STEINER, W. W., STEINER, E. M., GIRVIN, A. R. & PLEWIK, L. E. (2009) Novel nucleotide sequence motifs that produce hotspots of meiotic recombination in Schizosaccharomyces pombe. Genetics, 182, 459-469.
SUGIYAMA, T. & KOWALCZYKOWSKI, S. C. (2002) Rad52 protein associates with replication protein A (RPA)-single-stranded DNA to accelerate Rad51-mediated displacement of RPA and presynaptic complex formation. J Biol Chem, 277, 31663-31672.
SUKA, N., SUKA, Y., CARMEN, A. A., WU, J. & GRUNSTEIN, M. (2001) Highly specific antibodies determine histone acetylation site usage in yeast heterochromatin and euchromatin. Mol Cell, 8, 473-479.
SUN, H., TRECO, D., SCHULTES, N. & SZOSTAK, J. (1989) Double-strand breaks at an initiation site for meiotic gene conversion. Nature, 338, 87 - 90.
SUN, H., TRECO, D. & SZOSTAK, J. W. (1991) Extensive 3'-overhanging, single-stranded DNA associated with the meiosis-specific double-strand breaks at the ARG4 recombination initiation site. Cell, 64, 1155-61.
SUNG, P., KREJCI, L., VAN KOMEN, S. & SEHORN, M. G. (2003) Rad51 recombinase and recombination mediators. J Biol Chem, 278, 42729-32.
SUSSEL, L. & SHORE, D. (1991) Separation of transcriptional activation and silencing functions of the RAP1-encoded repressor/activator protein 1: isolation of viable mutants affecting both silencing and telomere length. Proc Natl Acad Sci USA, 88, 7749-7753.
SYM, M. & ROEDER, G. S. (1994) Crossover interference is abolished in the absence of a synaptonemal complex protein. Cell, 79, 283-92.
SZÉKVÖLGYI, L. & NICOLAS, A. (2009) From meiosis to postmeiotic events: Homologous recombination is obligatory but flexible. FEBS Journal, 277, 571-589.
SZOSTAK, J. W., ORR-WEAVER, T. L., ROTHSTEIN, R. J. & STAHL, F. W. (1983) The double-strand-break repair model for recombination. Cell, 33, 25-35.
TESSE, S., STORLAZZI, A., KLECKNER, N., GARGANO, S. & ZICKLER, D. (2003) Localization and roles of Ski8p protein in Sordaria meiosis and delineation of three mechanistically distinct steps of meiotic homolog juxtaposition. Proc Natl Acad Sci U S A, 100, 12865-70.
TIBBETTS, A. S. & APPLING, D. R. (1997) Saccharomyces cerevisiae expresses two genes encoding isozymes of 5-aminoimidazole-4-carboxamide ribonucleotide transformylase. Arch Biochem Biophys, 340, 195-200.

237
TIBBETTS, A. S. & APPLING, D. R. (2000) Characterization of two 5-aminoimidazole-4-carboxamide ribonucleotide transformylase/Inosine monophosphate cyclohydrolase isozymes from Saccharomyces cerevisiae. J Biol Chem, 275, 20920-20927.
TICE-BALDWIN, K., FINK, G. R. & ARNDT, K. T. (1989) BAS1 has a Myb motif and activates HIS4 transcription only in combination with BAS2. Science, 246, 931-5.
TSUBOUCHI, H. & OGAWA, H. (1998) A novel mre11 mutation impairs processing of double-strand breaks of DNA during both mitosis and meiosis. Mol Cell Biol, 18, 260-8.
TSUBOUCHI, H. & OGAWA, H. (2000) Exo1 roles for repair of DNA double-strand breaks and meiotic crossing over in Saccharomyces cerevisiae. Mol Biol Cell, 11, 2221-33.
TSUBOUCHI, H. & ROEDER, G. S. (2003) The importance of genetic recombination for fidelity of chromosome pairing in meiosis. Dev Cell, 5, 915-25.
UANSCHOU, C., SIWIEC, T., PEDROSA-HARAND, A., KERZENDORFER, C., SANCHEZ-MORAN, E., NOVATCHKOVA, M., AKIMCHEVA, S., WOGLAR, A., KLEIN, F. & SCHLOGELHOFER, P. (2007) A novel plant gene essential for meiosis is related to the human CtIP and the yeast COM1/SAE2 gene. Embo J, 26, 5061-5070.
USAITE, R., JEWETT, M. C., OLIVEIRA, A. P., YATES, J. R., OLSSON, L. & NIELSEN, J. (2009) Reconstruction of the yeast Snf1 kinase regulatory network reveals its role as a global energy regulator. Mol Syst Biol, 5.
VALERIUS, O., BRENDEL, C., WAGNER, C., KRAPPMANN, S., THOMA, F. & BRAUS, G. H. (2003) Nucleosome position-dependent and -independent activation of HIS7 expression in Saccharomyces cerevisiae by different transcriptional activators. Eukaryot Cell, 2, 876-885.
WACH, A., BRACHAT, A., POHLMANN, R. & PHILIPPSEN, P. (1994) New heterologous modules for classical or PCR-based gene disruptions in Saccharomyces cerevisiae. Yeast, 10, 1793-808.
WAHLS, W. P. & DAVIDSON, M. K. (2011) DNA sequence-mediated, evolutionarily rapid redistribution of meiotic recombination hotspots. Genetics, 189, 685-694.
WAHLS, W. P. & SMITH, G. R. (1994) A heteromeric protein that binds to a meiotic homologous recombination hot spot: correlation of binding and hot spot activity. Genes Dev, 8, 1693-1702.
WANG, T.-F., KLECKNER, N. & HUNTER, N. (1999) Functional specificity of MutL homologs in yeast: Evidence for three Mlh1-based heterocomplexes with distinct roles during meiosis in recombination and mismatch correction. Proc Natl Acad Sci USA, 96, 13914-13919.
WEST, S. C. (1997) Processing of recombination intermediates by the RuvABC Proteins. Annu Rev Genet, 31, 213-244.
WHITE, M. A., DETLOFF, P., STRAND, M. & PETES, T. D. (1992) A promoter deletion reduces the rate of mitotic, but not meiotic, recombination at the HIS4 locus in yeast. Curr Genet, 21, 109-16.
WHITE, M. A., DOMINSKA, M. & PETES, T. D. (1993) Transcription factors are required for the meiotic recombination hotspot at the HIS4 locus in Saccharomyces cerevisiae. Proc Natl Acad Sci USA, 90, 6621-5.

238
WHITE, M. A., WEIRDL, M., DETLOFF, P. & PETES, T. D. (1991) DNA-binding protein RAP1 stimulates meiotic recombination at the HIS4 locus in yeast. Proc Natl Acad Sci USA, 88, 9755-9759.
WU, T. & LICHTEN, M. (1994) Meiosis-induced double-strand break sites determined by yeast chromatin structure. Science, 263, 515 - 518.
WU, T. & LICHTEN, M. (1995) Factors that affect the location and frequency of meiosis-induced double-strand breaks in Saccharomyces cerevisiae. Genetics, 140, 55 - 66.
XU, L. & KLECKNER, N. (1995) Sequence non-specific double-strand breaks and interhomolog interactions prior to double-strand break formation at a meiotic recombination hot spot in yeast. Embo J, 14, 5115-28.
YAMADA, T., MIZUNO, K.-I., HIROTA, K., KON, N., WAHLS, W. P., HARTSUIKER, E., MUROFUSHI, H., SHIBATA, T. & OHTA, K. (2004) Roles of histone acetylation and chromatin remodeling factor in a meiotic recombination hotspot. Embo J, 23, 1792-1803.
YANG, R., WEK, S. A. & WEK, R. C. (2000) Glucose limitation induces GCN4 translation by activation of Gcn2 protein kinase. Mol Cell Biol, 20, 2706-2717.
YU, C., PALUMBO, M. J., LAWRENCE, C. E. & MORSE, R. H. (2006) Contribution of the histone H3 and H4 amino termini to Gcn4p- and Gcn5p-mediated transcription in yeast. J Biol Chem, 281, 9755-9764.
ZAKHARYEVICH, K., MA, Y., TANG, S., HWANG, P. Y.-H., BOITEUX, S. & HUNTER, N. (2010) Temporally and biochemically distinct activities of Exo1 during meiosis: Double-strand break resection and resolution of double Holliday junctions. Mol Cell, 40, 1001-1015.
ZHANG, F., KIROUAC, M., ZHU, N., HINNEBUSCH, A. G. & ROLFES, R. J. (1997) Evidence that complex formation by Bas1p and Bas2p (Pho2p) unmasks the activation function of Bas1p in an adenine-repressible step of ADE gene transcription. Mol Cell Biol, 17, 3272-83.
ZHANG, J., LI, F., LI, J., ZHANG, M. Q. & ZHANG, X. (2004) Evidence and characteristics of putative human α recombination hotspots. Hum Mol Genet, 13, 2823-2828.