multiple perspectives on employment relations: experience ... · pdf filemultiple perspectives...
TRANSCRIPT
201
MULTIPLE PERSPECTIVES ON EMPLOYMENT RELATIONS: EXPERIENCE FROM THE 1998WORKPLACE EMPLOYEE RELATIONS SURVEY
Mark Beatson, Department of Trade and Industry, United KingdomMark Beatson, Department of Trade and Industry, 1 Victoria Street, London SW1H 0ET, United Kingdom,
ABSTRACT
The 1998 Workplace Employee Relations Survey (WERS98) was the fourth in a series of workplace surveys carried out inGreat Britain, the first dating from 1980. The survey has always included an interview with a manager and workerrepresentative (where present). New elements introduced for the 1998 survey included: an employee perspective, based onself-completion data from employees; a reduction in the employee size threshold and an expanded panel element based ona separate survey of managers in workplaces included in the 1990 survey. Data was collected from managers in over3,000 workplaces; in nearly 1,000 of these, there was also a worker representative interview; and self-completionquestionnaires were obtained from nearly 30,000 employees. The data set offers enormous opportunities for the surveyanalyst. But it also provides challenges; one example is the sometimes different viewpoints held by managers, workerrepresentatives and employees.
Key words: Workplace surveys; Panel surveys; Linked employer-employee data; Management attitudes; Employeeattitudes; Consultation.
1. INTRODUCTION This paper presents a brief summary of the design and results of a huge and complex enterprise, the 1998 WorkplaceEmployee Relations Survey (known as WERS98). It provides an overview of the design of the survey and its scope.In addition, it highlights some of the key findings and the challenges that the analyst faces in manipulating andinterpreting such a large and complex data set. First, a little history. WERS98 is the fourth in a series of British workplace employment relations surveys. The threeprevious surveys in the series were carried out in 1980, 1984 and 1990 respectively1. The survey series has twomain purposes: to inform debate on employment relations policy and practice; and to provide a resource foremployment relations research. Both benefit from the existence of large scale, high quality and statisticallyrepresentative factual data. These twin purposes are reflected in the institutional arrangements for the conduct of thesurvey. WERS has always been a multi-sponsored survey. The current sponsors are the UK Department of Tradeand Industry, which is responsible within government for employment relations policy and legislation; the Advisory,Conciliation and Arbitration Service, an independent public body charged with dispute resolution, individualconciliation and the promotion of good industrial relations; the Economic and Social Research Council, which is themain funding body for social science research in the UK; and the Policy Studies Institute, an independent researchbody. The survey series has been carried out against a background of considerable change in British employment relations.The economic, social, political and legal background has changed greatly in the past twenty years (see Cully et al.,1999 and Millward et al., 2000 for overviews). Not least, 1979 saw the election of a Conservative government thathad a very different view of employment relations policy from its predecessors. It introduced a series of legislativechanges designed to reduce what it perceived to be excessive trade union power, together with a wider set ofeconomic policies designed to strengthen the influence of market forces in the UK economy. The WERS seriescharts these changes. Of course 1997 saw the election of a new government with a different approach toemployment relations – one based on promotion of fairness at work through legislation setting decent minimumstandards of protection for workers, together with a non-legislative agenda to promote partnership at work between
1 The three previous surveys are commonly known as the Workplace Industrial Relations Survey (WIRS) series.The name of the survey was changed to Workplace Employee Relations Survey in order to reflect the changingnature of its content (see below) – although – to confuse matters – the questionnaire documentation has alwaysreferred to the survey as the Workplace Employee Relations Survey.

202
employers and employees2. The latest survey provides a benchmark against which a future survey could evaluate theimpact of new policies such as the National Minimum Wage. Results from the first three surveys indicated that substantial changes had been taking place to both the institutionalstructure of British employment relations and to the economic and social context in which these institutions operated(see Millward et al., 1992). The ‘traditional’ model of employment relations based on collective bargaining betweenmanagement and trade unions – while never universal – was in retreat. But if employment relations were beingtransformed, it was not clear if any single new paradigm was emerging (Millward, 1994). However, the indicationsof substantive change were sufficiently strong to prompt a major re-evaluation and redesign for WERS98. The nextsection outlines the main innovations introduced for the 1998 survey. The third section reports on fieldworkoutcomes and key results. The fourth section then goes on to provide some examples of one particular feature of thenew survey design: the differing perspectives on employee relations often held by managers, worker representativesand employees within the same workplace. There is then a brief concluding section. 2. THE DESIGN OF WERS98
Recall that the objectives of WERS are to contribute to debate on policy and practice, and to provide a resource forresearchers. WERS does this by providing large-scale, statistically representative data. In the main, the data is‘factual’, i.e. it describes structures, policies and events, although some attitudinal data has always been collected.
The unit of observation in WERS is the workplace, not the company. This reflects a judgement that, in the Britishcontext, the workplace is the unit where the conduct of employment relations is principally played out, and where themost informed viewpoint will be obtained. Of course, in some cases, workplace and company coincide. But, inmany, the survey is collecting data on organisational policy from the perspective of the respondents in one particularworkplace.
In all the surveys, the primary informant has been a manager within the sampled workplace. This manager hasalways been the most senior manager in the workplace responsible for employee relations. Sometimes this will be apersonnel or employee relations specialist, in other cases it will be a general manager. This manager is asked tocomment on behalf of the workplace as a whole. In all the surveys, this interview has been supplemented by aninterview with a worker representative where one is present at the workplace. Note that identification of the workerrepresentative depends on management co-operation; the primary management respondent is asked if a workerrepresentative is present and, if so, for permission to interview them. In most cases, about 90 per cent in WERS98,permission is granted.
The population for the first three surveys was all workplaces3 in Great Britain with 25 or more employees. Thechoice of 25 employees as a size threshold reflected a view that employee relations in smaller workplaces were likelyto be less formal and therefore less amenable to a structured questionnaire approach.
The sampling frames for each of the first three surveys was the Census of Employment. Sampling has always beenstratified in order to permit analysis by employee size band and broad industry group.The fieldwork contractors – theNational Centre for Social Research (formerly Social and Community Planning Research) has won the contract forall four surveys – then conduct personal interviews at the workplace with managers and worker representatives.Each of the first three surveys yielded a data set of approximately 2,000 management responses plus, whereavailable, a worker representative response that could be matched with the appropriate management response. The1984 and 1990 surveys also included experimental panel elements, sampling a sub-set of workplaces included in theprevious survey.
2 The policy framework is set out in the Fairness at Work White Paper (DTI 1998).3 This paper uses the term ‘workplace’ throughout for simplification. In fact the units surveyed are often referred tousing another term, ‘establishments.

203
Experience with the first three surveys and the changing research and policy context meant that preparation for thefourth survey included a major re-evaluation and extensive consultation with users. The changes made inpreparation for WERS98 are summarised below. Cully (1998) provides a more detailed account.
2.1 Questionnaire content
Each survey in the series has seen revisions to the questionnaire in response to a changing environment and changinginformation needs. At the same time, consistency of questioning is important if valid comparisons are to be madeover time. For the 1998 survey, substantial changes were made to the management questionnaire. New or expandedmaterial was included on a range of employment and human resource topics: training, equal opportunities,performance appraisal and monitoring, workplace flexibility and team working. Some topics had to be cut back.Less data was collected on institutional structures and procedures, union organisation and industrial action.
Questionnaire space was also saved by dispensing with the distinction between ‘manual’ and ‘non-manual’employees used in previous surveys. This had involved repeating questions on a routine basis for manual and non-manual groups – a distinction which was becoming progressively less useful because of changes in the occupationaldistribution of employment. Instead, where it was felt relevant, data was collected on policies and practice for eachof nine occupational groups4, or for the largest single occupational group at the workplace.
2.2 Reduction in employee size threshold
The 1998 survey saw a reduction in the employee size threshold for the survey: down from 25 or more employees to10 or more employees. Small firms have become increasingly significant in terms of policy interest. The AustralianWorkplace Industrial Relations Survey (AWIRS) had successfully used a lower size threshold. A lower sizethreshold was therefore used in early stages of piloting and, when this proved to be successful, carried through intothe main survey.
Hence, in addition to the target of 2,000 responses from workplaces with 25 or more employees, the samplingprocedure was designed to collect a further 250 responses from workplaces with 10-24 employees.
2.3 Survey of employees
The most radical innovation for the fourth survey was the introduction of a survey of employees. This provides athird perspective on workplace employment relations – that of the employees themselves. By the time of the 1990survey, half of all workplaces sampled had no worker representative present. In these workplaces, the managementperspective was the only viewpoint available to the survey analyst.
Again, the Australian experience had shown that a survey of employees was feasible (Morehead et al., 1997),although the procedure used to capture employee data in WERS98 differed from that in AWIRS and indeed fromthat used in the only previous UK study to capture linked employer-employee data5. The procedure can besummarised as follows. During the main management interview, respondents were asked for permission to surveyemployees at the workplace. If permission was granted – it was in 86 per cent of cases – the interviewer asked for alist of all employees at the workplace, however this was organised. Using this list and set protocols, interviewersthen selected the names of 25 employees at random. Managers were given questionnaire packs for these employeesand asked to pass them on to the named employees. The packs comprised explanatory documentation, an eight pageself-completion questionnaire, and a reply paid envelope so that completed replies could be sent direct to thefieldwork contractors. Where there were less than 25 employees at the workplace, all employees were surveyed.Note that employee participation was conditional on management agreeing that employees could be surveyed and onmanagement subsequently passing on the questionnaire packs to employees.
The design of the employee survey meant that the responses should be representative of the population of employeesin workplaces with 10 or more employees. 4 These were the nine one digit subdivisions of the UK Standard Occupational Classification.5 The 1986 Social Change and Economic Life Initiative study.

204
As these were self-completion questionnaires, a much less extensive range of data could be collected fromemployees. The material sought in the questionnaire was a mixture of ‘factual’ data - including limited data ondemographics, experience of training, policy and practice at the workplace – and attitudinal data coveringperceptions, for example, of how employees were treated by management. In many cases, question wording wasdeliberately aligned with similar questions on the management and worker representative questionnaires.
2.4 A strengthened panel element
The 1984 and 1990 surveys had both included a panel element that involved re-interviewing some workplaces thathad taken part in the previous survey. WERS98 saw a substantial expansion in the size of the panel as well as a cleardistinction being introduced between the panel survey and the main management survey.
There were two main reasons for expansion of the panel. One was the increased emphasis given to panel studies inthe research community. The second was a consequence of the extensive revisions made to the main managementquestionnaire. These revisions meant that many questions asked in previous surveys had to be dropped. This wouldlead to some loss of continuity and ability to map changes over time. An expanded panel would be able to addressthe issue of change in greater detail than would ever be possible in the main survey. In particular, it would be able tohelp establish whether or not observed change in repeated cross-sections arose primarily from change withincontinuing workplaces or from changes in the composition of the population of workplaces.
The WERS98 panel study proceeded in two steps. First, the fieldwork contractors attempted to contact everyworkplace surveyed in 1990 in order to determine its current (1998) status: whether it was still in existence and, if so,whether it remained above the 25 employee threshold used in the 1990 survey. Second, a sample of theseworkplaces was re-interviewed. Only the management interview was repeated. The questionnaire was not the sameas that used in the main study. The focus was on repeating questions used in the 1990 survey and, where thisrevealed changing circumstances, the nature of change and the reasons behind it.
Hence WERS98 can be seen as four surveys in one. Three of them – the ‘cross-section’ element – are linked. Theseare the main management interview, the worker representative interview, and the survey of employees. Note thatboth worker representative interview and the survey of employees depend on management permission. Hence thereis no data from worker representatives or employees without data from the management respondent. But there wereworkplaces with management data but no data from worker representatives or employees. The fourth survey is thepanel element – a separate questionnaire administered only to management in a sub-sample of workplacesinterviewed in 1990.
3. FIELDWORK OUTCOMES AND KEY RESULTS
3.1 Fieldwork outcomes
Fieldwork for WERS98 began in October 1997, with the last interviews taking place in July 1998. Most interviewstook place in early 1998: only a fifth of interviews took place in the end months of 1997, and there was a ‘tail’ ofinterviews that lasted into the summer months6. Key outcomes in terms of numbers of responses and response ratesare summarised in Table 1 below, drawn from the source volume of findings (Cully et al., 1999). More detail iscontained in the technical report prepared by the fieldwork contractor (Airey et al., 1999).
6 Most of these latter interviews were in workplaces that were part of much larger organisations, e.g. retail chains,banks. Where the sampling process meant that several workplaces within a single organisation were to be contacted,special procedures were followed. Instead of the interviewer contacting the workplace, an approach was made by theDTI research team direct to the head office of the organisation seeking permission to contact all the specifiedworkplaces. This procedure often took time to secure the necessary consents.

205
Table 1: Fieldwork outcomes
Total responses Response rate (%) Average duration (minutes)1998 cross-sectionManagementquestionnaire
2,191 80 108
Worker representativequestionnaire
947 82 47
Survey of employees 28,237 64 -
1990-98 panelManagementquestionnaire
882 85 66
The survey sponsors have always taken pride in the high response rate achieved throughout the survey series. Thisreflects the considerable attention and resources put into securing a high response. It also indicates the relevance ofthe survey to employers, worker representatives and employees. The response rates for the interview components ofWERS98 are slightly lower than those achieved for the 1990 survey, but still extremely high relative to otherbusiness surveys. The response rate for the self-completion survey of employees was also encouraging7.
One more feature of WERS98 is worth noting. This survey was the first in the series to use computer assistedpersonal interviewing (CAPI) techniques. Using CAPI had a number of benefits. One was that it permitted morecomplex routing patterns. In the panel survey, in particular, the computer programme could compare responsesbeing keyed in with those to similar questions from the 1990 survey and hence identify where change had takenplace, prompting further questions. A second benefit was improved data quality. More consistency checks could bebuilt into the programme. The third benefit was improved turn-around time due to the elimination of the data entrystage and to less time being required to code and edit the data. For the 1990 survey, the lag between the end offieldwork and publication of findings was approximately two and a half years. This time round, a short booklet ofkey findings (Cully et al., 1998) was published within four months of fieldwork completion and the source volume offindings was published within fifteen months of fieldwork completion, a time saving of about one year.
3.2 Key Results
A brief but comprehensive precis is an impossible task. Even the short booklet of results (Cully et al., 1998) ran to30 pages. A whole volume was necessary to provide an account of the cross-section surveys (Cully et al., 1999).And a further volume has been prepared analysing change in British employment relations over the last twenty years,as depicted in the survey series (Millward et al., 2000). A small number of key themes relevant to policy,practitioner and academic debate are highlighted below.
The first of these concerns change. Together with its predecessors, WERS98 provides a quantitative account ofchanging patterns of employment relations over a period of nearly twenty years. The British industrial relations‘system’ of the post-War era can be characterised as largely voluntarist – in that there was relatively little stateregulation – and based on collective bargaining between employers and trade unions. It was always recognised thatthese arrangements did not apply to all of the economy, but it was the dominant paradigm. Table 2 presents timeseries data for a selection of measures of union presence and collective bargaining.
7 Note that the response rate is expressed as a percentage of questionnaires placed with managers. As a percentageof all employees in the cross-section sample, the response rate is under half. The difference is accounted for byworkplaces not participating in the survey at all and workplaces where managers were interviewed but declined topass questionnaires onto employees. The pattern of responses included a number of workplaces where not a singleresponse was received from employees despite agreement by management to pass on questionnaires. This suggeststhat, in some cases, managers had in fact failed to pass questionnaires onto employees.

206
Table 2: Measures of union presence, organisation and collective bargaining
1980 1984 1990 1998Union presence(% of workplaces with union members present)
73 73 64 54
Union density(% of employees who are union members)
65 58 47 36
Union recognition(% of workplaces that recognise trade unionsfor collective bargaining over pay)
64 66 53 42
Collective bargaining(% of workplaces with collective bargainingover pay for majority of workforce)
60 42 29
Collective bargaining(% of employees whose pay is covered bycollective bargaining)
70 54 40
Notes: Union density figure for 1980 is for full-time employees only.Base: All workplaces with 25 or more employees.Source: Millward et al., 2000.
The survey provides clear evidence of the decline in trade union influence and joint regulation of the employmentrelationship since the end of the 1970s. More detailed analysis of the 1990-98 WERS panel also provides someevidence on the dynamics of change. In particular, Millward et al. show that the decline in union presence andrecognition since 1990 has been largely due to new workplaces having a lower propensity to unionise, compared toworkplaces leaving the sample population. Changes in status among continuing workplaces play a relatively smallrole. This insight is only possible because of the existence of the panel study; and it is important because it refutessuggestions that changes in employment relations have been due to aggressive derecognition on the part ofemployers.
While the WERS series provides clear evidence on the decline of the ‘traditional’ model of British employmentrelations, no clear institutional model has emerged to replace it. In many workplaces, there is no formalrepresentative or consultative structure at all: no collective bargaining, no trade unions, no consultative committees.
As noted above, 1997 saw the election of a new government with new employment relations policies. These includeproposals for a comprehensive set of minimum standards governing key aspects of the employment relationship,covering both terms and conditions (a National Minimum Wage, implementation of the European Working TimeDirective) and procedural fairness (proposals for improved employment rights). WERS98 took place before thesepolicies came into effect. Questions could therefore be included that were germane to the policy debate; in particular,to help judge how far current employer practice was in line with government proposals.
The survey results indicate that, in most areas, employment practice meets or exceeds the standards set out in thegovernment’s legislative agenda. For example, nine out of ten workplaces with 25 or more employees did not payany of their employees less than £3.50 an hour at the time of the survey (a figure very close to the eventual adultNational Minimum Wage of £3.60 an hour). Similarly, almost all employers allowed employees to take time off inthe event of urgent family or domestic problems. And over 90 per cent of employers allowed employees who are thesubject of disciplinary or grievance procedures to be accompanied by another individual.
More generally, WERS98 collected a significantly greater amount of information on management practice. Cully etal. (1999) identified a set of 15 management practices, which they termed ‘high commitment management practices’.Examples include formal team working, the use of performance related pay, and the use of flexible working. Theywent on to explore the links between their presence and indicators of economic performance and ‘workplace well-being’ (which would include ‘objective’ measures such as staff turnover, absenteeism, accident rates, dismissal ratesas well as ‘subjective’ measures such as job satisfaction). The results of initial bivariate and multivariate analysis did

207
provide indications that the presence of high commitment management practices is associated with a number ofpositive workplace outcomes.
Of course, correlation does not imply causation, and other analysts will in due course refine and test theseconclusions further. Nevertheless, this is indicative evidence that modern employment practices can have beneficialeffects on business performance. The survey also revealed, however, that extensive use of these practices was notwidespread: only 14 per cent of workplaces had eight or more of the 15 management practices in place. So, if thereis a benefit to the ‘bottom line’, the message would not appear to be widely appreciated or accepted.
4. MULTIPLE PERSPECTIVES: COMPARISONS OF LINKED EMPLOYER AND EMPLOYEE DATA
Introducing an employee perspective through the self-completion questionnaire was the most significant innovationintroduced for WERS98. This section provides three brief examples of the use of data from employer, employee andworker representative questionnaires. The examples raise as many questions as answers.
4.1 The ‘climate’ of workplace employment relations
Managers, worker representatives and employees were all asked a similar question, to rate the relationship betweenmanagement and employees at their workplace on a five point scale, ranging from ‘very good’ through ‘neither goodnor poor’ to ‘very poor’. Table 3 reproduces Cully et al. (1999)’s summary of the responses8.
Table 3: Perceptions of management-employee relations
Managers v. unionrepresentatives
(% of workplaces)
Managers v.employees
(% of employees)
Union representatives v.employees
(% of employees)
Both parties agree 37 31 30
Managers’ rating worse by one point 11 11 -Managers’ rating worse by more thanone point
1 1 -
Union representatives’ rating worse byone point
27 - 20
Union representatives’ rating worse bymore than one point
24 - 12
Employees’ rating worse by one point - 32 23Employees’ rating worse by more thanone point
- 25 15
Base: Manager v. union representative and union representative v. employee are for all workplaces with 25 or moreemployees where a union representative was interviewed. The management v. employee comparison is for allworkplaces with 25 or more employees.
Two points emerge from this table. The first is that managers, union representatives and employees often assigndifferent ratings to the management-employee relationship: there is agreement in only a third or so of cases. And in
8 The worker representative component of the analysis is restricted to those workplaces where a trade unionrepresentative was interviewed, rather than a worker representative. In practice, this makes little difference becausethe large majority of worker representatives interviewed in the survey represented trade unions.

208
around a quarter of cases the difference in perceptions would appear to be substantial, by two or more points on afive point scale. The second feature of the table is that managers would appear to have a more positive assessment ofworkplace relations than either union representatives or employees.
These results do have implications for the analysis of the data. In particular, that analyses of the ‘quality’ ofworkplace relationships should consider using more than one respondents’ perception of that relationship.
4.2 Management attitudes to trade unions
All three sets of respondents were also asked a comparable question on their view of the management’s attitudetowards trade union membership: whether managers were in favour, against, or neutral.
Table 4: Management attitudes to trade union membership
Managers v. unionrepresentatives
(% of workplaces)
Managers v.employees
(% of employees)
Union representativesv. employees
(% of employees)
Both parties agree 54 42 36
Managers’ rating worseby one point
16 8 -
Managers’ rating worseby two points
2 1 -
Union representatives’rating worse by one point
24 - 10
Union representatives’rating worse two points
4 - 2
Employees’ rating worseBy one point
- 41 42
Employees’ rating worseby two points
- 9 10
Base: All workplaces with 25 or more employees where a union representative was interviewed.
In principle, answers to this question should produce more agreement between the different respondents than theprevious example. Although it is still an attitudinal question, it is asking about a specific attitude – that ofmanagement towards trade unions – rather than a broad evaluation. In addition, the use of a simple three point scaleshould produce greater agreement.
Table 4 does show greater agreement between the parties than Table 3, but considerable disagreement remains.Managers and union representatives differed in nearly a half of workplaces, mainly where one party said thatmanagement was neutral towards union membership whereas the other party said that management was in favour.Here there was a clear difference between employees and both managers and union representatives, with employeestending to have a less favourable perception of management attitudes. Note also that, in 6 per cent of workplacesand for around 10 per cent of employees, the difference was two points on the scale, i.e. one party thoughtmanagement were in favour of union membership while the other party thought they were against.

209
4.3 Keeping employees up to date
The third example concerns the extent to which managers consult and inform employees. Managers and employeeswere given broadly comparable questions asking them whether management kept employees up to date aboutproposed changes at the workplace9. Table 5 summarises responses.
Table 5: Keeping employees up to date about proposed workplace changes
Managementperception
Employee rating(% of employees)
Good Neither good nor poor Poor Row totals
Good 32 20 22 74Neither good nor poor 5 3 3 12Poor 5 4 5 14
Column totals 43 27 30
Base: All workplaces.
Again, only a minority (41 per cent) of employees agreed with their managers’ rating. In general, employees weremore negative than managers. Thus 74 per cent of employees had a manager who thought they kept employees up todate about changes at the workplace; yet less than half (43 per cent) of these employees thought their managers did agood job of keeping them up to date. This finding is consistent with responses to other questions in the survey onconsultation and information, which suggests considerable unmet demand from employees for more information anddiscussion of workplace issues.
It is also possible to see if these management and employee perceptions are affected by the presence (according tomanagement) of particular workplace practices. Table 5 shows that 43 per cent of employees thought theirmanagement did a good job of keeping them up to date about proposed changes. This figure fell to 32 per centamong the (small) proportion of employees whose workplaces did not have any sort of workforce or team briefingsystem. In contrast, the presence of a consultative committee made no difference to employee ratings. These (verylimited) comparisons suggest that the presence of formal information and consultation practices does not by itselfprovide the explanation for the differing perceptions of managers and employees. Much more extensive analysis willbe required to provide a full account.
5. CONCLUSIONS
This paper has provided a brief account of WERS98, covering key design innovations, fieldwork outcomes andheadline results. This latest survey in the series has introduced an employee perspective. Section 4 has presented abrief selection of results using the linked employer-employee data. These results raise as many questions as answers.
9 The precise questions were as follows. Management respondents were given the following statement: ‘We do notintroduce any changes here without first discussing the implications with employees’ and asked to respond on a fivepoint scale ranging from ‘Strongly agree’ to ‘Strongly disagree’. Employees were asked the following question:‘How good would you say managers here are at keeping everyone up to date about proposed changes?’ using a fivepoint scale ranging from ‘Very good’ to ‘Very poor’. Table 5 reduces these to a three point scale by combining the‘Strongly agree/Agree’ categories and the ‘Disagree/Strongly disagree categories’ for the management question and asimilar transformation for the employee question. Respondents made less use of the extreme categories, especiallythe ‘Strongly disagree/very poor’ rating.

210
Additional perspectives make for a ‘noisier’ account of workplace employment relations – in the sense thatmanagers, worker representatives and employees often seem to disagree – but also for a richer account. Thedifferent perceptions themselves become additional measures of workplace relations – perhaps, even, a betterindicator of the effectiveness of communication channels or of the ‘climate’ of industrial relations than the variableswhich aim to measure these phenomena.
All the data from WERS98 is available to researchers. At the time of writing, over 100 researchers had applied forthe data sets. Hence, in time, more rigorous analyses of the linked data should emerge.
BIBLIOGRAPHY
Airey, C., J. Hales, R. Hamilton, A. McKernan and S. Purdon (1999), The Workplace Employee Relations Survey,1998 (WERS): 1998 Technical Report (cross-section and panel samples), Social Community and Planning Research,London.
Cully, M. (1998), “A Survey in Transition: the Design of the 1998 Workplace Employee Relations Survey”,Department of Trade and Industry, London. Available at http:/www.dti.gov.uk/emarCully, M., S. Woodland, A. O’Reilly, G. Dix, N. Millward, A. Bryson, and J. Forth (1998), The 1998 WorkplaceEmployee Relations Survey: First Findings, Department of Trade and Industry, London. Available athttp:/www.dti.gov.uk/emar
Cully, M., S. Woodland, A. O’Reilly and G. Dix (1999), Britain at Work, London: Routledge.Department of Trade and Industry (1998) Fairness at Work, Cm 3968, The Stationery Office, London.
Millward, N. (1994), The New Industrial Relations?, London: Policy Studies Institute.
Millward, N., A. Bryson and J. Forth (2000, All Change at Work?, London: Routledge.
Millward, N., M. Stevens, D. Smart and W. Hawes, (1992), Workplace Industrial Relations in Transition: TheED/ESRC/PSI/ACAS Surveys, Aldershot: Dartmouth.

C.O.I. : A MATCHED EMPLOYER / EMPLOYEE SURVEYON ORGANIZATIONAL CHANGE AND COMPUTERIZATION
Nathalie Greenan1
Sylvie Hamon-Cholet2
ABSTRACT
In recent years, industrial firms have implemented innovative work practices to improve their performance, in response tochanges in their environment. These organisational choices have repercussions on the employees' work. The C.O.I. survey(“enquête sur les Changements Organisationnels et l’Informatisation”, conducted at the end of 1997 / beginning of 1998)is a matched employer / employee survey that aims at measuring these two outputs of workplace transformation. Thispaper presents the main principles according to which the C.O.I. survey has been designed and gives some first results thatgive a flavor of the type of empirical investigation that this structure of survey allows.
Key words : Matched survey, work organization, organizational change, quality, just-in-time, pseudo market, technicaluncertainty systems, work groups or teams
Introduction
Workplace transformation and its economic and social implications has become a key issue, challenging theacademic world as well as policy makers. In France, government surveys on this topic have been developed since themiddle of the 1980s’. In 1987, the Ministry of labor and INSEE conducted a labor force survey on technology andorganization in order to complement the information gathered through the national surveys on working conditionsand more precisely to better understand how working conditions were related with work (task and technology) andworker (gender, age, social origin) characteristics. At the beginning of the 1990s’, the Ministry of industry designed,a system of annual business surveys aiming at measuring the innovative behavior of firms. This took place in thecontext of the public debate on the productivity paradox. In 1991, a first innovation survey was conducted and in1993, a survey on organizational change (the survey on “organizational change in production”) was conducted tobetter understand the relations between technological innovation and organizational innovation.
However users of the labor force surveys as well as users of the business surveys felt the limits of these instrumentsfor empirical investigations. In labor force surveys, the lack of information on the firms did not allow to explore therelations between the characteristics of work in terms of organization and technology use and firms’ behavior. Thus,questions were added on the name and address of employers allowing to determine their SIREN identificationnumber and to import general information on the firms in the databases. However, this information provedinsufficient. Data on managerial practices and strategy were needed. But business surveys on their own also havesome drawbacks. Face to face surveys are expensive and self-administered questionnaires have to be light to keep agood quality in answers. Questions on different topics like human resource practices, investment in equipment andworkplace organization cannot be answered by one unique respondent. Formal organization can be measured butinformal, concrete practices are often unknown to the firm representative who answers the questionnaire and whobelongs, most of the time, to the head office of the firm.
For all these reasons, it became clear that there were many advantages in matching a labor force survey and abusiness survey in a unified framework for investigating organizational change and the diffusion of communicationand information technologies. The C.O.I. survey is the result of this collective reflection associating statisticiansfrom government agencies and scholars from the fields of sociology, management and economics. This paperpresents the main principles according to which the C.O.I. survey has been designed and presents some first resultsthat give a flavor of the type of empirical investigation that this structure of survey allows.
1 Centre d’Etudes de l’Emploi, 29 promenade Michel Simon 93 191 Noisy le Grand – France, E-mail : [email protected] DARES, 20 bis rue d’Estrées 75 700 Paris 07 SP – France, E-mail: [email protected]
211

212
1 . General principles of the C.O.I. survey
The C.O.I. survey aims at measuring the on-going changes in work organization, particularly with the use of newtechnologies, in order to clarify the nature of the links between computerization, organizational changes andperformance. The main challenge is to understand how firms evolve and adapt, and to analyze the impact of thesechanges on productivity, employment figures, skill mix, wage disparities and on job content as described by theemployees themselves. In a way, the survey allows assessing impacts in terms of economic performance and in termsof social cost. The idea of the survey originated from a seminar on innovation and performance improvements3
where a first description of the survey had been discussed collectively.
1 . 1 . A framework associating four surveys
C.O.I. is not just one survey. It is a framework associating four surveys and involving four statistical agencies:DARES (statistical office of the French ministry of labor), SESSI (statistical office the French ministry of industry),SCEES (statistical office of the French ministry of agriculture) and INSEE (French national institute of statistics andeconomic studies). The scientific direction and overall co-ordination of this framework of surveys has been ensuredby Nathalie Greenan at the Centre d’Etudes de l’Emploi.
The C.O.I. framework matches a business survey and a labor force survey. The business survey comprises threedifferent questionnaires according to the sector it is applied to: one for industrial firms including the agricultural andfood industries (AFI) and excluding the energy sector, one for firms from a branch of commerce (DIY or homedepots types of stores) and one for firms from a branch of services sector (accounting activities). SESSI and SCEESadministered the first questionnaire and the ‘trade’ and ‘services’ divisions of INSEE managed the two others. Thequestionnaire for the manufacturing industry includes many questions on the internal organization of the firm and onthe way information technology interacts with it. In the trade and service sectors, questionnaires are more focused onthe external organization, on vertical networks between firms in the former and on horizontal ones in the latter.
The sample of manufacturing firms is a large and representative one. About 6000 Firms with more than 20employees, were selected from the Annual Surveys of Firms file (EAE for “Enquête Annuelle d’Entreprise”). ForSESSI, the survey was the follow-up to an initial survey conducted in 1993 on organizational changes in production.The two samples of firms in the trade and the service sectors are more limited in scope, but the surveys in thesesectors aim at preparing a questionnaire for a more representative sample in the future. The DIY or home depotstypes of stores were surveyed exhaustively (about 1000 firms) and for accounting activities (about 2000 firms), firmsover 20 employees were surveyed exhaustively and a sample was used for smaller ones.
The labor force survey has been conducted by INSEE on behalf of DARES and concerns the employees of firmsinterviewed in each of the sectors under review. The questionnaire takes on several labor force surveys managed byDARES to follow the evolutions of work conditions, work techniques and work organization. The sample wasselected from the Annual Declarations of Social Data file (“Déclarations Annuelles de Données Sociales” known asDADS). Those documents are administrative and compulsory. They are completed by the establishments concernedand sent to the URSSAF administration for the calculation of their social security contributions. Establishments haveto complete one line per employment period for each employee who has worked during the year under review, withhis surname, first name(s), address, profession and wage. At the beginning of the year, this document is sent to theURSSAF administration with information about the previous year (in other words, the document concerning 1996, issent in January 1997). After preliminary processing, part of this information is sent to INSEE and other institutions.
3 Four papers were written in the context of this seminar, organized by Dominique Foray and Jacques Mairesse. They werepublished in Foray and Mairesse (1999). The main principles of what became the C.O.I survey are presented in one of them(Caby and alii, 1999).

213
1 . 2 . : A two tiers sampling scheme
� What type of sampling scheme has been used ?
First, a list of firms has been selected from the EAE file. The identification number of the firm is its SIRENregistration number. In the manufacturing industry, only firms with more than 50 employees were retained for thelabor force survey and in the trade and services sectors, firms with more than 20 employees were selected. Thischoice of size threshold aims at preserving a disconnection between the firm level and the employee levelquestionnaire, in order to protect the anonymity of the interviewed employee(s) and to make it difficult to have asame person responding to the two questionnaires. In the trade and service sectors, where the surveys were moreexploratory we chose the size threshold of 20 employees.
The list of SIREN numbers was then matched with DADS file corresponding to 1996 and a random selection ofemployees was made in the knowledge that they were present in the firm on December 31, 1996 and that they werenot either company owners or general managers. As the interviews of workers started in winter 1997, we did notwant to select workers that had left the firm during 1996. As a result of this method for selecting employees, oursample groups workers with at least one year of seniority in the firm. This is a drawback compared to the way theworkers were selected in previous labor force surveys where the criteria of selection was connected with the addressrather than with the employer.
Table 1: Breakdown of matched employer / employee samples from the C.O.I. survey
� Firm level survey:4 026 firms selected
� Employee level survey8 812 employees selected
from those firms� industrial sector : 2 542� AFI : 478� DIY stores : 272� accounting activities : 734
� industrial sector : 5 754� AFI : 1 042� DIY stores : 551� accounting activities : 1 465
� Is one employee enough?
We decided to select two employees in firms with less than 500 employees, and three employees in larger firms,leading to an overall sample of 8 812 employees. Table 1 gives the breakdown of this sample in terms of firms andsectors. Samples of interviewed workers in each firm are thus of limited size of either one, two or three persons. Isthis enough ?
Having a representative sample of employees per firm is very costly. It implies, in the presence of a budgetconstraint, a smaller sample of firms that the one we surveyed in C.O.I. We preferred to have an important sample offirms and to fix a small number of employees per firm. Such a choice allows conducting descriptive statistics onsector-size categories, taking into account the organizational or technological specificity of the firms. It does notchange the way the labor force survey is used on its own in empirical studies.
Furthermore, if the interviewed employees have been selected at random within the firm, estimations from firm levelregressions can be conducted using indicators constructed from the small number of employees’ answers. The bias inthe estimated coefficients can be assessed as long as a sub-sample of firms with more than two interviewedemployees exists in the database. The method for conducting such regressions is presented in Mairesse and Greenan(1999). They have been applied it to a cross-sectional analysis of firms to measure the impact of informationtechnologies on firm performance (Greenan and Mairesse, 2000), but it can be extended to panel regressions withoutneeding that the surveyed employee be the same or even be the same number for the same firm in the different yearsof the panel and firm level indicators built on the employees answers can also be used to instrument firm levelvariables without any further correction.

214
The important methodological point here is that we have to be sure that the employees have been chosen at random.The DADS data file is a key element in the implementation of such a structure of survey. This file allows choosingemployees at random, without having to ask the firm to deliver a list of employees. It also allows interviewingworkers in the context of their home and to guarantee anonymity about the information delivered. And it allowsavoiding asking questions on social, demographic or professional aspects (sex, age, address, occupation, wages, …)during the interviews. The main drawback of this sampling method has been underlined earlier: it leaves asideunstable or precarious employees that have worked in the firm for less than one year. It also leaves aside newlycreated firms but this is often a problem with business surveys.
1 . 3 .Questionnaires and matched data bases
� Modes of administration and response rates
The business survey questionnaires were self-administered4. They were mailed to the person who usually answers theEAE survey. A letter was added, pointing out that if the firm was large, several departments could be concerned(head office, production, human resources, information technologies) and a question was asked about the affiliationof the respondent. In more than half of cases, the general manager was the principal contributor the firm’s response.The letter also informed the firm that some workers randomly selected were interviewed, but of course it did not givetheir names. In the manufacturing sector, the survey obtained an 88% response rate (95% in terms of turnover). Inaccounting activities, 82% of firms answered and 56% of DIY or home depots types of stores.
The employee survey has been carried out by phone or face to face when the selected person could not be phoned. Inboth cases, workers have been interviewed in the context of their leisure time, at home. 89% of employees of oursample have been reached. 71% agreed to answer the questionnaire, 9% refused to do so and another 9% where outof the field of the survey beca use they had changed employer.
� Questions for firms and questions for employees
Given the explorato ry nature of the firm level surveys in the trade and service sector, we focus, in the following onthe manufacturing industry. The firm level questionnaire includes detailed questions on work organization using avocabulary stemming from the management literature. We listed a large set of innovative work practices and newmanagement tools described as contributing to “manufacturing excellence” or to a “high performance” model oforganization. This list groups together practices and managerial tools that aim at a more thorough management ofquality issues, just in time production and delivery and employee involvement in information tasks and decisionmaking. The questionnaire also tries to seize the computerization process of the firm, its general strategy andimplementation difficulties. Firms are asked about what they do in 1997 and about changes that occurred between1994 and 1997. Furthermore, some questions are modeled after questions that were asked in the in the 1993 SESSIsurvey on organizational change. It allows assessing an evolution over approximately seven years, from thebeginning of the 90s to 1997.
The employees level questionnaire enables to characterize work content at the time of the survey. It provides onlyfew elements on actual changes and none on employment, wages or company strategies. Hence the necessity toquestion firms which in contrast, can answer the same questions without being able to provide detailed informationon the job itself and on its organization from an employee standpoint. Questions describe hierarchical positions,communication networks, autonomy, work rhythm, strain and technology use. Contrary to the firm levelquestionnaire, questions in the labor force survey use simple, non-technical vocabulary. When the firm representativedescribes the managerial practices of the firm (the use of autonomous work groups for example), the employeedescribes concrete work (is he allowed to fix an hitch by himself? or does he scrupulously follows given orders andassignments?)
4 The questionnaires for the manufacturing industries and for accounting activities are very much alike in spirit. The latter usedthe former as a model, taking into account the specificity of the service sector. The questionnaire for DIY or home depots typesof stores is very different and part of the survey has been conducted through face to face interviews.

215
�Matching possibilities with other data bases
In addition to matching the ‘firm’ and ‘employees’ questionnaires, we have also matched the C.O.I. survey with otheradministrative databases and other surveys.
We have collected time series data on the C.O.I. firms from the Annual Surveys of Firms (EAE), the Financial Linkssurvey (LIFI), a database on employment structure (ESE) and a survey on Automation (AII).
Since the sample of employees was taken from the DADS data file, we have some information describing their age,sex, occupation and work contract. We selected employees born during the month of October of an even year whichenabled us to find them again in a panel keeping tracks of these workers since 1976. Furthermore the DADS filegives an exhaustive information on employees that have been working in the firm in 1996. From this information, wehave built aggregate indicators on wages per skill/age categories, on wage dispersion, on age groups, on turnover etc.
In total, C.O.I. is a system of information that allows studying the implications of information technology diffusionand organizational change on workers effort and professional trajectories as well as firms’ productivity, employment,skill mix and wage dispersion.
2 . Organizational change in French manufacturing: some first results using matched employer/employeeinformation5
The C.O.I. survey asks questions about the use of 5 major groups of work practices related to :
� Quality management: ISO certification, total quality management (TQM), guarantee of quality from suppliers� Management of the time constraint: just in time (JIT) production and delivery, tight delivery times for suppliers� Management of internal transactions : organization in profit centers, formalization of internal customer / supplier
contracts� Management of technical uncertainty: functional analysis, value analysis or AMDEC (we will refer to product or
process analysis), Total Productive Maintenance (TPM) or 5S methods (we will refer to preventive maintenancemethods).
� work in teams: autonomous work groups, problem solving groups and project teamsWe will refer respectively to “quality”, “just-in-time”, “pseudo market” and “technicaluncertainty” systems, and to “work groups or teams”
During the last decade, in order to improve their performance, cope with competition and provide better customersatisfaction, firms have reformed their work organization by adopting new management systems [Favre & al, 1998].In 1997, 85 % of industrial firms used at least one of the systems listed in the survey. And this use has increasedbetween 1994 and 1997.
5 For more details on these first results, see Greenan and Hamon-Cholet (2000).

216
Figure 1 : Diffusion of innovative work practices
Note for reading the graphFor quality, just-in-time, pseudo-market or technical uncertainty systems we measure the use or presence of the system in the firm in 1997. Forall these systems, except the ones imposed to suppliers we also know if the proportion of employees involved has increased since 1994, showingmore intensive use. We can see, for example, that 31% of firms had an ISO registration in 1997 and 21% of them had increased their use of itbetween 1994 and 1997. For work groups or teams, we consider that the firm is using it in more than a marginal way when over 10% of theproduction employees are involved.
Figure 1 shows that the most widespread are quality and just in time systems. Just over, one third of firms had theISO quality registration, a large quarter were using Total Quality Management and more than half demanded aguarantee of quality from their suppliers. 30% of firms produced on a just in time basis and 30% also delivered onthe same basis. 43 % demanded tight delivery times from their suppliers.
Approximately one company out of five stated being organized in profit centers or using internal customer / suppliercontracts. Finally, 15% of firms used methods for product and process analysis and 8% use TPM or 5S methods forpreventive maintenance. Just over, one third of firms stated the use of one form or another of work groups or teamson a fairly regular basis (which means that more than 10% of production employees are concerned by it).
0 10 20 30 40 50 60
Quality approach forsuppliers *
JIT for suppliers*
ISO Certification
JIT delivery
JIT production
Autonomous work groups*
TQM
Problem-solving groups*
Formal internal contracts
Profit centers
Project teams*
Product or process analysis
Preventive maintenance
en %
Users in 1997
More intensive use since 1994
(*) for these systems, the question of moreintensive use was not asked
Source : C.O.I. survey 1997,(MEFI - SESSI, MAP - SCEES)
217
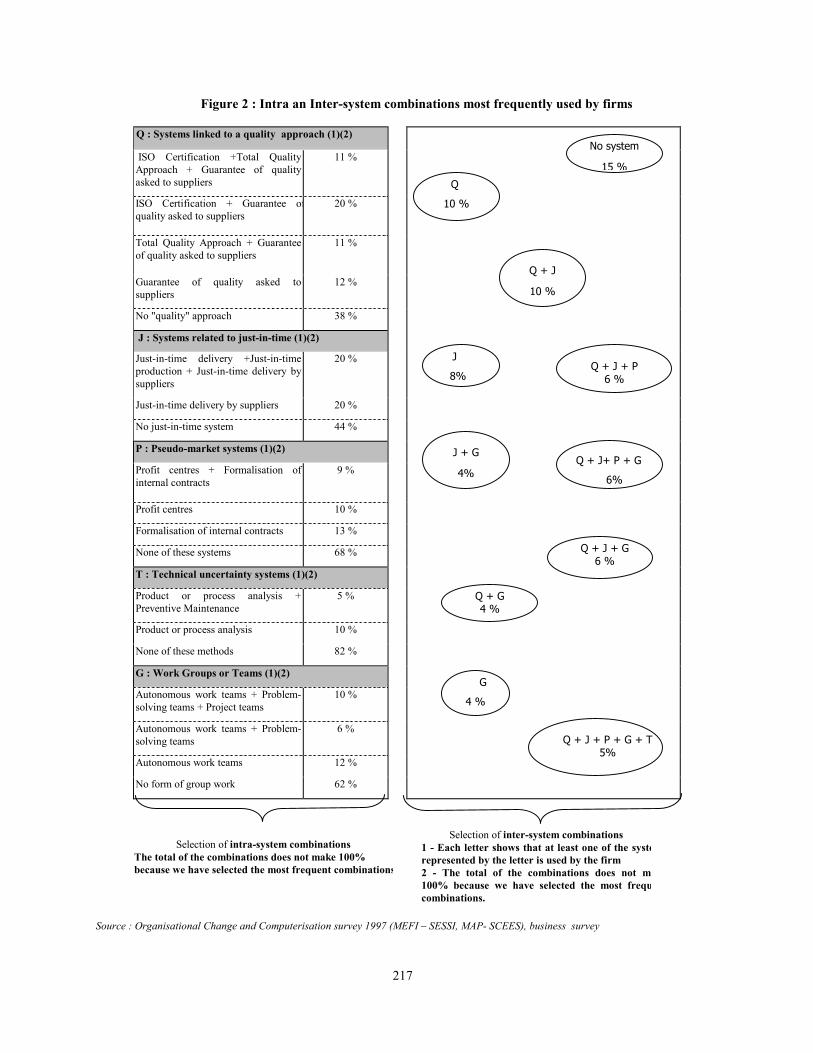
Figure 2 : Intra an Inter-system combinations most frequently used by firms
Q : Systems linked to a quality approach (1)(2)
ISO Certification +Total QualityApproach + Guarantee of qualityasked to suppliers
11 %
ISO Certification + Guarantee ofquality asked to suppliers
20 %
Total Quality Approach + Guaranteeof quality asked to suppliers
11 %
Guarantee of quality asked tosuppliers
12 %
No "quality" approach 38 %
J : Systems related to just-in-time (1)(2)
Just-in-time delivery +Just-in-timeproduction + Just-in-time delivery bysuppliers
20 %
Just-in-time delivery by suppliers 20 %
No just-in-time system 44 %
P : Pseudo-market systems (1)(2)
Profit centres + Formalisation ofinternal contracts
9 %
Profit centres 10 %
Formalisation of internal contracts 13 %
None of these systems 68 %
T : Technical uncertainty systems (1)(2)
Product or process analysis +Preventive Maintenance
5 %
Product or process analysis 10 %
None of these methods 82 %
G : Work Groups or Teams (1)(2)
Autonomous work teams + Problem-solving teams + Project teams
10 %
Autonomous work teams + Problem-solving teams
6 %
Autonomous work teams 12 %
No form of group work 62 %
Source : Organisational Change and Computerisation survey 1997 (MEFI – SESSI, MAP- SCEES), business survey
Q
10 %
Q + J
10 %
Q + J + P6 %
Q + J+ P + G
6%
Q + J + G6 %
Q + J + P + G + T5%
Q + G4 %
No system
15 %
J
8%
G
4 %
Selection of intra-system combinationsThe total of the combinations does not make 100%because we have selected the most frequent combinations
Selection of inter-system combinations1 - Each letter shows that at least one of the systerepresented by the letter is used by the firm2 - The total of the combinations does not ma100% because we have selected the most frequcombinations.
J + G
4%

218
Firms rarely use only one type of system. Several systems are often associated [Greenan & Mairesse, 1999]. Figure 2shows that 10% of firms use both a quality and a just in time system. When firms use a pseudo-market or technicaluncertainty system, this is more often a complement to a quality or just in time system : 6% of the firms had at least aquality approach, a just-in-time system and a pseudo-market system and 2% used at least method for dealing withtechnical uncertainty as well. The same applies to firms which use work groups or teams methods : 6% of the firmsused teams, quality and just in time systems and 5% were at the leading edge of organisational innovation,accumulating all types of systems.
According to the statements made by firms, the use of all these systems has intensified since 1994. With regard toemployees, 33% state having perceived a change in their working environment in the last three years when thecompany stated the use of at least one system. In firms that do not use any of the mentioned systems, only 23% ofemployees made the same comment. If there is a positive correlation between the presence of a system and theperception of change, it is rather weak. It reflects the gap that can exist between the company’s formal declarationand the actual practices of employees. However, the survey does show that the greater the number of systems used,the stronger the perception of change.
To analyze the effect of each system on the employee’s job characteristics, we estimated logit models in which thevariables that describe the employees’ work, are explained by their occupation (in four items) social-professionalgroup, the size of the firm (less than or more than 500 employees) and by the firm’s use of each of 13 practices listedabove. The job characteristics we consider are the pace of work, the realization of tasks that “enrich” the job, thescope of initiative and autonomy and the collective dimension of the work. Table 2 sums up the relations that wewere expecting to find. Only part of these predictions was confirmed by our estimations.
Table 2: Relations that we expect to find between firm’s use of innovative work practices and employee’s description of his work
When the firm uses (or increases the usebetween 1994 and 1997) …
Aspects of the work organization orconditions for the employee
ISO CertificationTotal Quality ManagementGuarantee of quality for suppliers
�
Making suggestions to improve work stationMeeting specific quality standardsCarrying out quality or product tests
Just in time productionJust in time deliveryTight delivery for suppliers
�
Having standard short times to respectDoing repetitious workHaving to meet outside demands immediately
Pseudo-market systems � No idea
Functional analysis, value analysis orAMDECTotal Productive Maintenance
�
Making suggestions to improve work stationCarrying out quality or product testsGiving instructions to others
Group or team work �Being autonomousCollective work
Although quality and just in time systems both involve very formal procedures, they nevertheless have opposingeffects. Employees working in firms with the ISO certification, state that they have less repetitive work than thoseworking in firms which operate on a just in time delivery basis: the proportion of workers who say they repeat thesame gestures or operations at rapid frequency, increase from 17% to 29% (tables 3 and 4). In firms that use TotalQuality Management, employees state that they have to meet strict deadlines less often, whereas those working infirms where suppliers have to deliver on a just in time basis, are often confronted with deadlines of approximatelyone hour. In comparison to just in time systems, quality related systems involve less repetitive work and timepressure.

219
ISO certification is positively related to all tasks that enrich the employees’ work, such as making proposals toimprove the job, meeting quality standards, conducting quality tests and participating in meetings or in the training ofnew recruits. Employee initiative also appears to be favored with ISO certified firms: employees have more frequentpossibilities of modifying the nature of the work in hand or the way to approach it, and of guiding others in theirspecific tasks. However, when they receive orders or instructions, they must scrupulously respect them. It wouldtherefore appear that although these employees have a certain freedom of movement to assume their work, it isnevertheless within the confines of a fairly strict and limited framework.
Employees who work in firms that deliver on a just in time basis, state that they strictly follow instructions and alsothat they are thoroughly supervised. 50% of these employees state that their pace of work is subject to permanentcontrols by their hierarchy. There is less hierarchical pressure in firms that produce just in time or whose suppliershave to deliver on this basis. Work in groups or teams is fostered in firms with the ISO certification, particularly withregard to conception activities whereas Just in time production fosters group work with regard to the productionactivity itself.
All things being equal throughout these sectors, the formalization (or standardization) of internal contracts has noparticular impact on the employee’s job. For firms organized into profit centers, employees state that their work ismore repetitive and they permanently work in groups. Their contact with customers is limited and in comparison toemployees subject to quality and just in time systems, they state more often that they have less of an obligation toscrupulously respect instructions. Globally speaking, pseudo-market systems have little impact on employees’ jobs.
Table 3 : In firms using a system related to quality ...
ISO certification Total QualityManagement
Guarantee of quality forsuppliers
Referencepopulation
(1)
The worker… effect estimatedfrequency
effect estimatedfrequency
effect estimatedfrequency
estimatedfrequency
Work rhythmsHas no lead times ns // + 18% ns // 13%Does repetitious work with short cycle (2) - 17% (-) 19% ns // 22%Organization of work station…makes suggestions to improve work station + 58% ns // ns // 49%has to meet specific quality standards + 48% ns // ns // 37%carries out quality or product tests + 51% ns // ns // 41%trains new or temporary staff at work station + 64% ns // ns // 55%attends at least 2 meetings a year + 30% ns // ns // 26%has constant contacts with customers - 2% ns // ns // 3%Autonomy and hierarchycan modify the nature and amount of work tobe done
+ 45% ns // ns // 40%
gives instructions to others to do the work (3) + 75% ns // ns // 70%follows instructions exactly (+) 62% ns // ns // 58%Collective workDoes conception activities within a group + 5% ns // (+) 5% 4%� Coding of the meaning of the effect: + and - when there is a significant positive or negative effect at a 5% level, (+) and (-) for significanteffects at a 10% level and ns for not significant effect at a 10% level. Only those variables for which at least one of the quality systems has aneffect beyond 10% are shown on this table� Reading the table: 22% of the blue collars in firms under 500 employees and using no innovative work practices do repetitious work with ashort cycle. When the firm has ISO certification, this proportion drops to 17%. The difference between the two frequencies is -5 points.Implementation ISO certification has therefore had a negative measured effect on repetitious work.Frequencies can be compared from one column to another within the same row, but cannot be compared from one row to another. From one tableto another, the frequencies can also be compared for the same row variables. For example, in Table 3, we see that 18% when the firm imposes aguarantee of quality to its suppliers. This 18% can be compared to the 11% that we read in Table 5 associated with tight delivery times imposedto suppliers.(1) Blue-collar workers in firms under 500 employees and using no innovative work practices form the reference category.(2) Work is considered repetitious when the cycle is shorter than one minute(3) By "others" we mean colleagues in the same department or in other departments within the firm or outsidersSource : C.O.I. 1997 (MEFI - SESSI, MAP - SCEES, MES - DARES)

220
Table 4 : In firms with a just-in-time system …
Just in time production Just in time delivery Tight delivery times forsuppliers
Referencepopulation
(1)
The worker… effect estimatedfrequency
effect estimatedfrequency
effect estimatedfrequency
estimatedfrequency
Work rhythmsHas no lead times ns // ns // (-) 11% 13%has standards or short lead times of an hour ns // ns // (+) 37% 34%does repetitious work with short cycle (2) + 29% ns // ns // 22%works under mechanical constraints (3) (+) 51% ns // ns // 47%Autonomy and hierarchy
has employees under his/her orders ns // (-) 12% ns // 14%works under constant supervision + 50% (-) 40% - 39% 44%follows instructions exactly (+) 62% ns // ns // 58%Collective workparticipates in group work (-) 44% + 53% ns // 48%works in groups all the time, or almost ns // ns // (-) // 26%work in groups with close colleagues ns // (+) 52% ns // 48%does production activities within a group ns // (+) 50% ns // 46%does conception activities within a group (-) 3% ns // - 3% 4%� Coding of the meaning of the effect: + and - when there is a significant positive or negative effect at a 5% level, (+) and (-) for significanteffects at a 10% level and ns for not significant effect at a 10% level. Only those variables for which at least one of the quality systems has aneffect beyond 10% are shown on this table� Reading the table: see table 3(1) Blue-collar workers in firms under 500 employees and using no innovative work practices form the reference category.(2) Work is considered repetitious when the cycle is shorter than one minute(3) By "others" we mean colleagues in the same department or in other departments within the firm or outsidersSource : C.O.I. 1997 (MEFI - SESSI, MAP - SCEES, MES - DARES)
In terms of impact, preventive maintenance methods are similar to that of quality systems and in particular, that ofthe ISO certification: less deadlines to meet, more autonomy and the possibilities of making proposals to improve thejob and of testing product. The methods of product and process analysis have less of an effect on work. They areoften associated with a pace of the work dependent on external demand. In fact, it appears that firms using thesemethods are geared towards market demands, whereas those that use preventive maintenance methods are morefocused on their industrial processes.
Work groups or teams are one of the means used by firms to motivate their staff and share information on commonobjectives. Autonomous work groups function all the time and keep production running smoothly. Problem-solvingteams and project teams are set up from time to time, the first to analyse problems encountered in the firm's routineactivities, the second to define and set up a new project.
With regard to group work, we have some quite surprising results. We were expecting to find some positive linksbetween the situation regarding firms that use work group or teams and the indicators regarding collective workamongst employees. Given that project and problem solving teams are the object of specific assessments, this isunderstandable, but for autonomous work teams (which are permanently operational), this goes against expectations.These results can be explained by the fact that we are assessing different points of view when we question firms onthe forms of group work and when we question employees on collective work. Again, the link between the systemformally stated by the company and the actual practices of employees, is far from evident.
The project teams alone appear to be linked to indications of collective work and this link is negative: when firmsdeclare that their production workers are involved in project teams more than marginally6, employees less often saythat they spend their whole time producing within a group (table 3). Since a project team is usually an occasional
6 That is when the firm declared that more than 10% of its production staff participated in a work group.

221
arrangement for group thinking about a specific topic, this result is understandable. But we expected autonomouswork groups to be associated with intensive work in groups or teams for production activities and problem-solvinggroups to be associated with collective work in conception activities. None of the employee level indicators ofcollective work was positively correlated with these two forms of team work, apart from attending at least twomeetings a year. These results are not very intuitive and could be explained by problems of measurement, or may belinked to correlation between systems, but they suggest that we are measuring different things when we question thefirm about work in groups or teams and the employee about collective work. One possible explanation may be thatthe teams declared by the firm are formal arrangements, whereas for the employee, collective work suggests a morepractical reality. The result obtained over meetings would support this explanation.
Otherwise, we expected that use of autonomous work teams would have repercussions on the indicators of autonomyand hierarchy drawn from the employee's responses. But this is not the case. The employees' work seems littleaffected by the use of autonomous teams. The work rate alone changes: the employees concerned have less often tomeet an outside, non immediate demand or to meet standards and lead-times within the day. Just like ISOcertification or preventive maintenance methods, the problem-solving teams are positively associated with new taskswhich enrich the work station. The project teams concern firms in which the employees handled unexpected eventsby themselves, carried out quality or product tests, and less often said they do repetitious work.
Table 5 : In firms which have set up work groups or teams…
Autonomous workgroups Problem solving groups Project teams
Referencepopulation
(1)The worker… effect estimated
frequencyeffect estimated
frequencyeffect estimated
frequencyestimatedfrequency
Work rhythmshas standards or lead times of one day - 66% ns // ns // 66%has to meet outside demand but notimmediately
+ 16% - 9% ns // 12%
does repetitious work with short cycle (2) ns 25% ns // - 17% 22%Organization of work station
makes suggestions to improve work station ns // + 56% ns // 49%has to meet specific quality standards ns // + 42% ns // 37%carries out quality or product tests ns // ns // + 46% 41%attends at least 2 meetings a year + 29% + 32% ns // 26%Autonomy and hierarchy
manages unexpected events on his/her own ns // ns // + 45% 41%Collective work
participates in group work ns // + 50% ns // 48%works in groups all the time, or almost ns // ns // - 22% 26%
does production activities within a group ns // ns // - 42% 46%does conception activities within a group ns // ns // ns // 4%� Coding of the meaning of the effect: + and - when there is a significant positive or negative effect at a 5% level, (+) and (-) for significanteffects at a 10% level and ns for not significant effect at a 10% level. Only those variables for which at least one of the quality systems has aneffect beyond 10% are shown on this table� Reading the table: see table 3(1) Blue-collar workers in firms under 500 employees and using no innovative work practices form the reference category.(2) Work is considered repetitious when the cycle is shorter than one minute(3) By "others" we mean colleagues in the same department or in other departments within the firm or outsidersSource : C.O.I. 1997 (MEFI - SESSI, MAP - SCEES, MES - DARES)

222
References
CABY L., DE CONINCK F., DUBOIS P., GOLLAC M., GREENAN N. MAIRESSE J., MOISDON J.-C.,RALLET A. ET VICKERY G., 1999 : “Mesurer les liens entre informatisation, organisation et performances. Unprojet d’enquête”, in FORAY. D. and MAIRESSE J. (Dir.), Innovations et performances : approchesinterdisciplinaires, pp. 171-189
FAVRE F., FRANCOIS J.P. and GREENAN N. ,1998 : “Changements organisationnels et informatisation dansl’industrie”, Chiffres Clés, Référence, N°203, September 1998
FORAY. D. and MAIRESSE J. (Dir.), 1999 : Innovations et performances : approches interdisciplinaires, Editionsde l’Ecole des Hautes Etudes en Sciences Sociales
GREENAN N. and MAIRESSE J. , 2000 “Computer and Productivity in France : Some Evidence” forthcoming inEconomics of Innovation and New Technologies, NBER Working paper n°5936, November 1996.
GREENAN N. and MAIRESSE J. , 1999, “Organizational Change in French Manufacturing : What Do We Learnfrom Firm Representatives and from Their Employees ?”, NBER Working paper n° 7285, August
MAIRESSE J. and GREENAN N., 1999, “Using Employee Level Data in a Firm Level Econometric Study”, inHaltiwanger J.C., Lane J.I., Spletzer J.R., Theeuwes J.J.M.and Troske K.R., Eds, The Creation and Analysis ofEmployer-Employee Matched Data, chap. 19, pp. 489-512, Elsevier Science, NBER Working paper N°7028,March 1999.
GREENAN N. and HAMON-CHOLET S., 2000 : “Les salariés industriels face aux changements organisationnels en1997”, Premières synthèses, 2000.03 - N 09.3, DARES, Ministère de l’emploi et de la solidarité.

223
THE METHODOLOGY OF THE WORKPLACE AND EMPLOYEE SURVEY
Z. Patak, M. Hidiroglou and P. LavalléeZdenek Patak, 11-F, R.H. Coats Bldg., Tunney’s Pasture, Ottawa, Ontario, K1A 0T6, Canada
ABSTRACT
The objective of the Workplace and Employee Survey (WES) is to investigate relationships among competitiveness,innovation, technology use and human resource management on the employer side, and technology use, training, jobstability and earnings on the employee side. WES is designed to be a longitudinal survey. The first wave sample uses asingle stage design for the employer portion, with a second stage added for the employee portion. Sampled employers willbe surveyed at least four consecutive years; a periodic sample update will take place every second survey occasion.Employees will be followed for two years after which the entire sample will be refreshed. The collection mode for theemployer portion is CAPI, while employee data are collected using CATI. All partially and fully completed questionnairespass through outlier detection and imputation modules to increase the usability of the data. Total non-response is handledusing a weight adjustment. Apart from CAPI and CATI, other generalized systems are used throughout the survey processto simplify it and improve its timeliness.
Key words: Linked samples, multi-stage design, survey process efficiency.
1. INTRODUCTION AND OBJECTIVES
In recent years Statistics Canada has steadily increased its capacity to follow businesses and individualslongitudinally. This is being achieved by linking survey and administrative data longitudinally to explore the impactof a rapidly changing labour market on firms and their employees. Clients interested in the competitive position ofCanadian industry have sponsored surveys on technology use, innovation and the success of small and medium sizedenterprises. These surveys are beginning to shed some light on firm growth and decline, particularly how theadaptive and innovative capacities of firms contribute to their success.
Canadian firms and their employees have always faced a competitive, changing environment. The developmentof a North American free trade zone has certainly heightened awareness of the competitive environment. Thegrowing disparity among workers, in terms of both earnings and hours, has been well documented. These trendscontribute to a general sense that economic change is increasingly difficult to understand, that the cost of change ismainly borne by less adaptable workers, and that even among the winners in the labour market, employment isbecoming less stable. Looking at these trends, analysts at Statistics Canada and elsewhere have reached theconclusion that there are two key elements missing in our understanding of firm performance and worker outcomes.
The determinants of how well firms respond to change can be properly studied in a longitudinal setting thatcovers all the firm characteristics and behaviours related to performance. The practices and policies related toemployees are also of interest, since they must be the agents of change in the firm. Their fortunes are tied to whatthey do on the job and how they interact with the internal forces of change within a firm. Thus the ideal surveyinstrument would follow the linked samples of employers and employees over an indefinite period.
The Workplace and Employee Survey (WES) is such an instrument. The objective of WES is to investigate therelationships among competitiveness, innovation, technology use and human resource management on the employerside, and technology use, training, job stability and earnings on the employee side. WES will shed some light onwhat triggers hiring and separations, actual and perceived job stability, which employees use particular technologiesand how it affects their skill requirements and pay, and how employee compensation and human resource practicesrelate to firm performance.
In Section 2 we discuss the longitudinal strategy for the employer and employee portions of WES. Aspects ofthe sample design are detailed in Section 3. Collection, edit, and imputation strategies are described in Section 4. Weprovide some detail on weighting and estimation in Section 5, followed by a discussion of future work in Section 6.

224
2. LONGITUDINAL STRATEGY
The Workplace and Employee Survey has been designed to be a longitudinal survey. It uses two distinctsampling units, workplace and employee. The workplace is defined as a physical location where employer-employeedata can be linked directly. These units will be surveyed on a number of successive occasions. The longitudinalstrategy for each unit is discussed next.
2.1. Workplace Portion
The first production wave of WES is a cross-sectional sample of Canadian workplaces and their employees. Thecollection of data for this sample started in the spring of 1999. Subsequent waves will be carried out at one-yearintervals. The focus in the first year is on cross-sectional analysis. To incorporate a time component into the firstwave, one may consider post-stratifying the workplace sample by the number of years a unit has been in operation.In the absence of respondent supplied historical data, this would allow us to conduct a limited, time dependentanalysis in the absence of multiple waves of data.
The employer portion of WES is carried out in a series of two-wave cycles. For each cycle, the first wave is atypical cross-sectional survey. Only complete and partial respondents are contacted for the second wave. First wavenon-respondents are not contacted again until wave three. This cycle is repeated every odd survey occasion, i.e.,years three, five, seven, and so on.
Starting with wave two, the emphasis will shift from cross-sectional to longitudinal analysis. All livelongitudinal units will be carried forward from wave one to wave two and thereafter. Total non-response units willnot be contacted during the second wave data collection. For wave three, every effort will be made to convertrefusals. This strategy coincides with our intention of sampling employer births and redrawing of employees in yearthree, and explained below.
Prior to wave three, the panel of continuing units will be expanded by a sample of births that have accrued sincethe first wave. This sample augmentation will occur before each odd survey occasion. The selected birth units areconsidered longitudinal. With their addition we will achieve cross-sectional representativity at the start of each two-year cycle. Workplaces with zero employees (eg., owner-operators) are out-of-scope for WES. If these units acquireemployees sometimes in the future, then they will be considered births and be sampled accordingly.
Figure 1. Longitudinal sampling of workplaces
The workplace sample has been designed to be robust longitudinally. A small study looking at birth and deathrates for Canadian businesses has revealed that the expected sample attrition is approximately 20% a year. To reducethe possibility of a non-certainty stratum being completely eroded over time, the minimum sample size has been setto ten. If, despite these precautions, sample attrition substantially depletes a particular stratum, then the possibilityexists that a second panel will be selected to add units within that stratum.
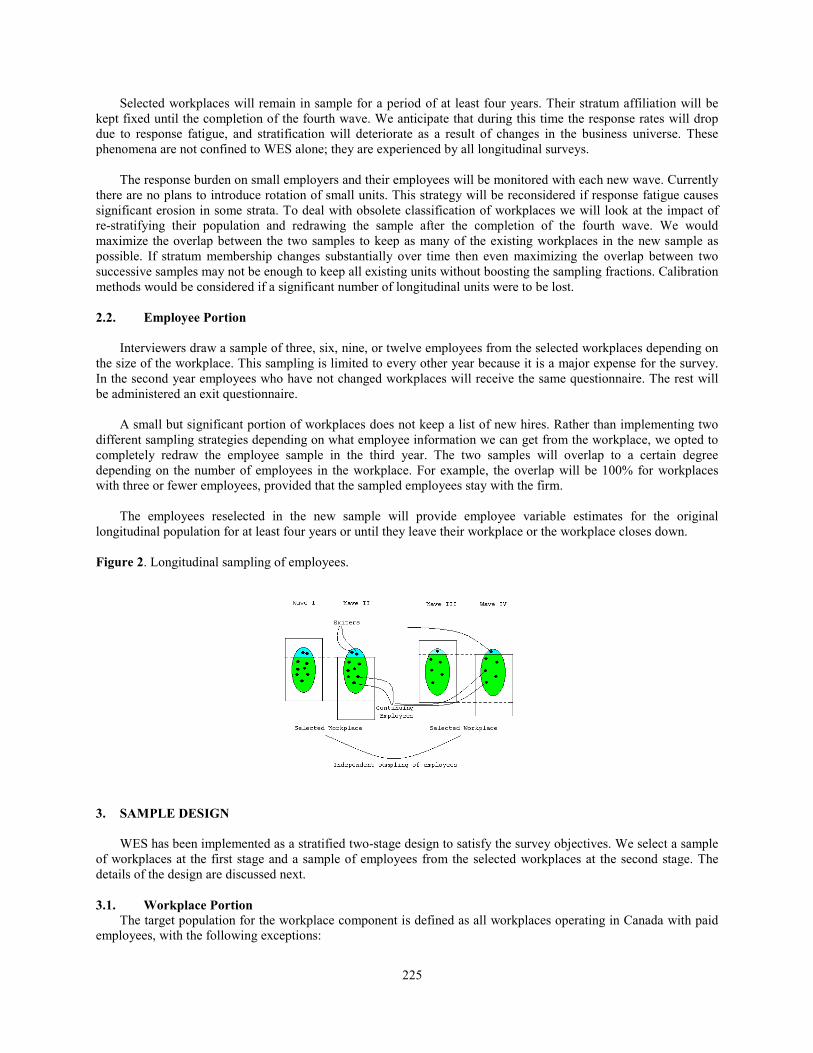
225
Selected workplaces will remain in sample for a period of at least four years. Their stratum affiliation will bekept fixed until the completion of the fourth wave. We anticipate that during this time the response rates will dropdue to response fatigue, and stratification will deteriorate as a result of changes in the business universe. Thesephenomena are not confined to WES alone; they are experienced by all longitudinal surveys.
The response burden on small employers and their employees will be monitored with each new wave. Currentlythere are no plans to introduce rotation of small units. This strategy will be reconsidered if response fatigue causessignificant erosion in some strata. To deal with obsolete classification of workplaces we will look at the impact ofre-stratifying their population and redrawing the sample after the completion of the fourth wave. We wouldmaximize the overlap between the two samples to keep as many of the existing workplaces in the new sample aspossible. If stratum membership changes substantially over time then even maximizing the overlap between twosuccessive samples may not be enough to keep all existing units without boosting the sampling fractions. Calibrationmethods would be considered if a significant number of longitudinal units were to be lost.
2.2. Employee Portion
Interviewers draw a sample of three, six, nine, or twelve employees from the selected workplaces depending onthe size of the workplace. This sampling is limited to every other year because it is a major expense for the survey.In the second year employees who have not changed workplaces will receive the same questionnaire. The rest willbe administered an exit questionnaire.
A small but significant portion of workplaces does not keep a list of new hires. Rather than implementing twodifferent sampling strategies depending on what employee information we can get from the workplace, we opted tocompletely redraw the employee sample in the third year. The two samples will overlap to a certain degreedepending on the number of employees in the workplace. For example, the overlap will be 100% for workplaceswith three or fewer employees, provided that the sampled employees stay with the firm.
The employees reselected in the new sample will provide employee variable estimates for the originallongitudinal population for at least four years or until they leave their workplace or the workplace closes down.
Figure 2. Longitudinal sampling of employees.
3. SAMPLE DESIGN
WES has been implemented as a stratified two-stage design to satisfy the survey objectives. We select a sampleof workplaces at the first stage and a sample of employees from the selected workplaces at the second stage. Thedetails of the design are discussed next.
3.1. Workplace PortionThe target population for the workplace component is defined as all workplaces operating in Canada with paid
employees, with the following exceptions:

226
a) workplaces located in Yukon or North West Territories;
b) workplaces operating in the following industries: agriculture and related industries; fishing andtrapping; highway, street and bridge maintenance; government services; private households; religiousorganisations
The population is partitioned into non-overlapping groups based on the workplace’s industrial activity andgeographic region. The workplaces in each industry/region group are allocated to three size strata based onemployment, using a model-based approach (Godfrey, Roshwalb and Wright, 1984). With this approach it isassumed that we can use a model defined by iii xy εβ += , where ),0( 2 γσε ii x≈ , and that the variable of interest y(eg., wages and salaries) has a variance proportional to a known auxiliary variable x (eg., employment). Severalchoices of γ are possible. For the ratio estimator we use 1=γ .
We want to minimise the design variance of the resulting estimator to arrive at a nearly optimal stratification bysize. Within each industry/region group we arrange the population units in an ascending order of their auxiliaryvariable. Then we divide each industry/region subpopulation into H groups of units such that their sums of theauxiliary variables raised to the power γ are approximately equal; that is, Hxxx
hHgg U iUi iUi i /)()(1
��� ≅≅≅ ∈∈γγγ
� .
The sample is then allocated to the strata by the equal parts rule, that is, Hnnh /= in each stratum. For model-based stratification, values other than one can be used for γ . Mahalanobis (1952) stated that 2=γ worked well formany skewed distributions. For WES, we tried several values of γ ranging from 1.0 to 2.5. The classical model-based stratification and allocation procedure was modified for WES. The equal parts rule for allocation was droppedin favour of Neyman allocation. This resulted in a more efficient sample.
Once the population is stratified by size, stratum sample sizes are computed using Neyman allocation subject tothe constraint that expected marginal design coefficients of variation (CV) not exceed a given CV at the region byindustry level. For WES this CV was initially set to 0.10. The resulting initial allocation yielded a sample of 6,281workplaces with expected industry-level CVs ranging from 0.01 to 0.09, and expected region-level CVs rangingfrom 0.02 to 0.04.
The sample size was still well within the budgeted 7,500 units. This allowed us to lower further the expectedmarginal CVs at the region by industry level to 0.09 by boosting the sample size from 6,281 to 7,378 workplaces.This resulted in lowering expected industry CVs to between 0.036 and 0.040, and expected region CVs to between0.046 and 0.061. A sample of workplaces was then drawn independently in each stratum using simple randomsampling without replacement. Several strata containing very large workplaces were sampled exhaustivelyproducing some 292 certainty units.
Several other sample stratification and allocation methods were investigated. Amongst them were thecumulative f rule followed by Neyman allocation, and the Lavallée-Hidiroglou method (Lavallée and Hidiroglou,1988). Below we compare the modified model-based stratification and allocation scheme based on 2=γ with the
cumulative f rule, and the Lavallée-Hidiroglou method using Neyman and square root allocations. To make thecomparison fairer in terms of the suggested number of certainty units to the optimal Lavallée-Hidiroglou method,the cumulative f rule and modified model-based probability strata with weights less than or equal to 1.25 wereconverted to certainty strata. This was done in anticipation of perhaps introducing sample rotation sometimes in thefuture. Using a time-out constraint of one year, a workplace with a weight of 1.25 would be rotated out for onesurvey occasion after being in sample for four years. Lower weights yield longer in sample periods. It was felt thatthe reduction of response burden due to rotating a unit out for one year every fifth survey occasion and not rotating itout at all was negligible.
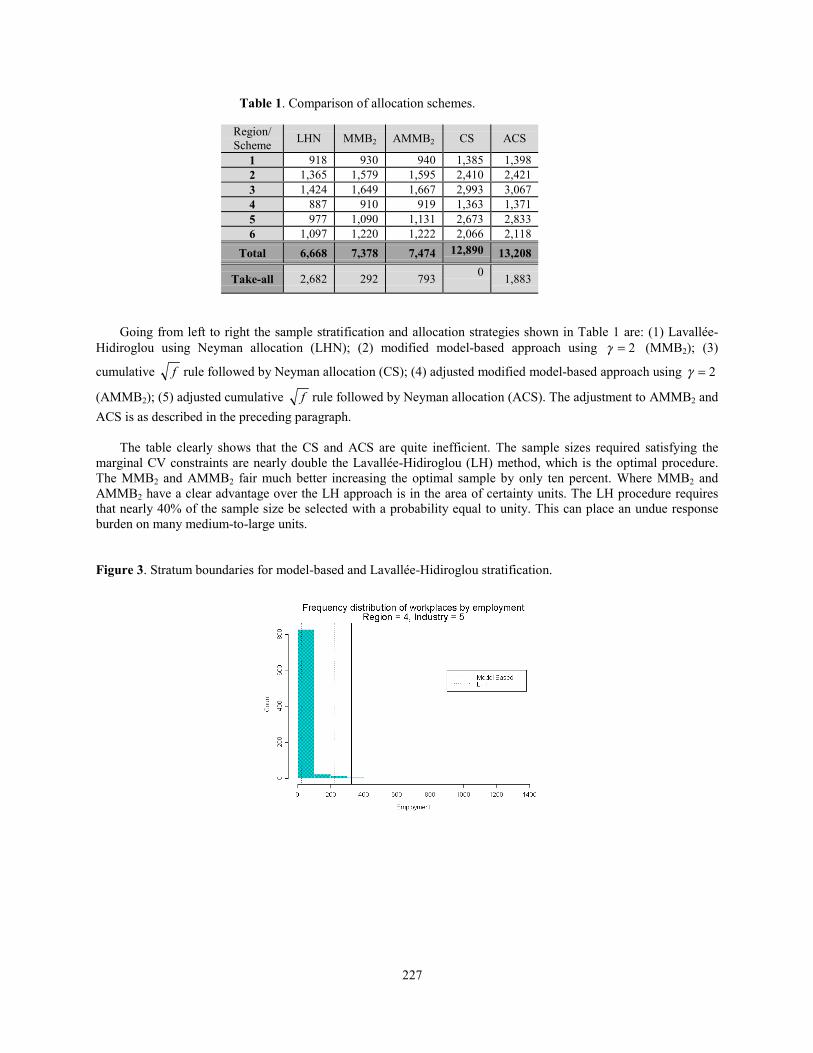
227
Table 1. Comparison of allocation schemes.
Region/Scheme LHN MMB2 AMMB2 CS ACS
1 918 930 940 1,385 1,3982 1,365 1,579 1,595 2,410 2,4213 1,424 1,649 1,667 2,993 3,0674 887 910 919 1,363 1,3715 977 1,090 1,131 2,673 2,8336 1,097 1,220 1,222 2,066 2,118
Total 6,668 7,378 7,474 12,890 13,208
Take-all 2,682 292 793 0 1,883
Going from left to right the sample stratification and allocation strategies shown in Table 1 are: (1) Lavallée-Hidiroglou using Neyman allocation (LHN); (2) modified model-based approach using 2=γ (MMB2); (3)
cumulative f rule followed by Neyman allocation (CS); (4) adjusted modified model-based approach using 2=γ
(AMMB2); (5) adjusted cumulative f rule followed by Neyman allocation (ACS). The adjustment to AMMB2 andACS is as described in the preceding paragraph.
The table clearly shows that the CS and ACS are quite inefficient. The sample sizes required satisfying themarginal CV constraints are nearly double the Lavallée-Hidiroglou (LH) method, which is the optimal procedure.The MMB2 and AMMB2 fair much better increasing the optimal sample by only ten percent. Where MMB2 andAMMB2 have a clear advantage over the LH approach is in the area of certainty units. The LH procedure requiresthat nearly 40% of the sample size be selected with a probability equal to unity. This can place an undue responseburden on many medium-to-large units.
Figure 3. Stratum boundaries for model-based and Lavallée-Hidiroglou stratification.
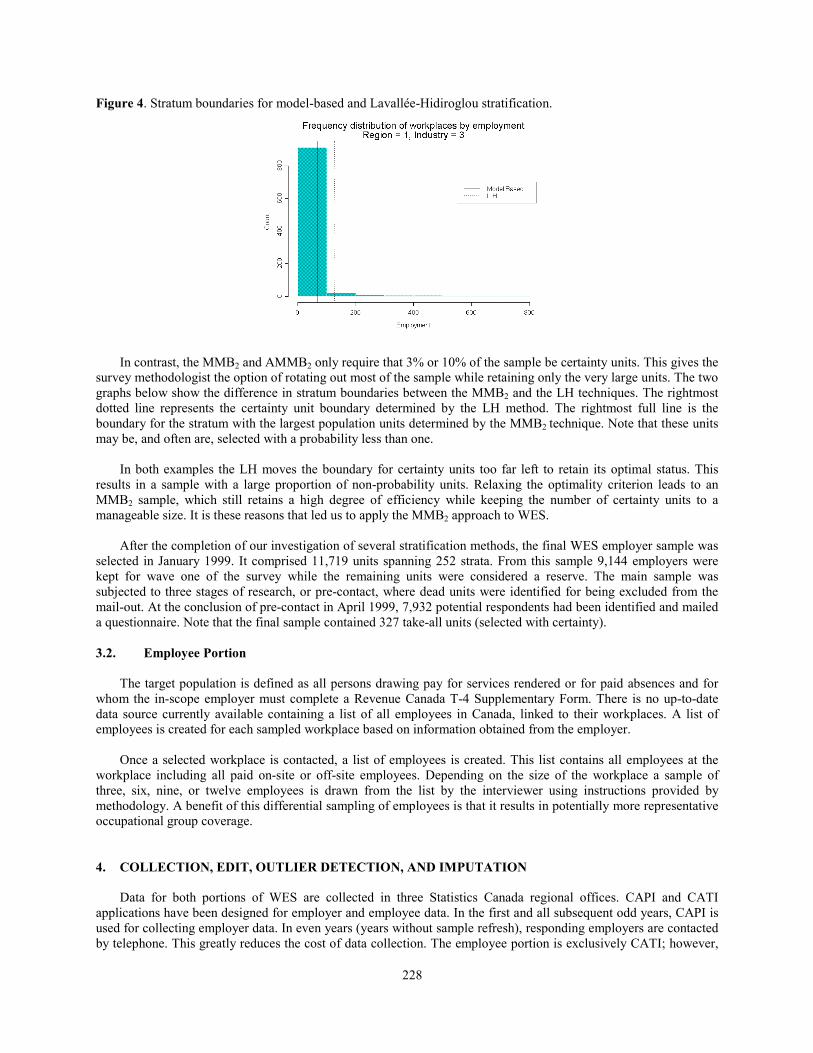
228
Figure 4. Stratum boundaries for model-based and Lavallée-Hidiroglou stratification.
In contrast, the MMB2 and AMMB2 only require that 3% or 10% of the sample be certainty units. This gives thesurvey methodologist the option of rotating out most of the sample while retaining only the very large units. The twographs below show the difference in stratum boundaries between the MMB2 and the LH techniques. The rightmostdotted line represents the certainty unit boundary determined by the LH method. The rightmost full line is theboundary for the stratum with the largest population units determined by the MMB2 technique. Note that these unitsmay be, and often are, selected with a probability less than one.
In both examples the LH moves the boundary for certainty units too far left to retain its optimal status. Thisresults in a sample with a large proportion of non-probability units. Relaxing the optimality criterion leads to anMMB2 sample, which still retains a high degree of efficiency while keeping the number of certainty units to amanageable size. It is these reasons that led us to apply the MMB2 approach to WES.
After the completion of our investigation of several stratification methods, the final WES employer sample wasselected in January 1999. It comprised 11,719 units spanning 252 strata. From this sample 9,144 employers werekept for wave one of the survey while the remaining units were considered a reserve. The main sample wassubjected to three stages of research, or pre-contact, where dead units were identified for being excluded from themail-out. At the conclusion of pre-contact in April 1999, 7,932 potential respondents had been identified and maileda questionnaire. Note that the final sample contained 327 take-all units (selected with certainty).
3.2. Employee Portion
The target population is defined as all persons drawing pay for services rendered or for paid absences and forwhom the in-scope employer must complete a Revenue Canada T-4 Supplementary Form. There is no up-to-datedata source currently available containing a list of all employees in Canada, linked to their workplaces. A list ofemployees is created for each sampled workplace based on information obtained from the employer.
Once a selected workplace is contacted, a list of employees is created. This list contains all employees at theworkplace including all paid on-site or off-site employees. Depending on the size of the workplace a sample ofthree, six, nine, or twelve employees is drawn from the list by the interviewer using instructions provided bymethodology. A benefit of this differential sampling of employees is that it results in potentially more representativeoccupational group coverage.
4. COLLECTION, EDIT, OUTLIER DETECTION, AND IMPUTATION
Data for both portions of WES are collected in three Statistics Canada regional offices. CAPI and CATIapplications have been designed for employer and employee data. In the first and all subsequent odd years, CAPI isused for collecting employer data. In even years (years without sample refresh), responding employers are contactedby telephone. This greatly reduces the cost of data collection. The employee portion is exclusively CATI; however,

229
in each even year the participating employees go through four separate streams of questions, depending on theirbeing with the employer a year ago status.
4.1. Data Collection and Edit
Prior to dispatching an interviewer to the workplace a telephone contact is initiated. It serves to identify theprimary respondent within the workplace, typically the human resource person, and to collect basic tombstoneinformation about the business. During this stage each unit is classified as being in-scope (i.e., has paid employees)or out-of-scope (i.e., has no paid employees). Out-of-scope units are flagged and not interviewed.
The workplace questionnaire contains ten distinct blocks. Each block focuses on a different theme. In mostcases a single respondent will be able to answer all the questions. If the primary respondent is unable to provide therequested information in its entirety, then he or she will be asked to identify the person privy to this information.The capture vehicle is capable of accepting up to ten different respondents, one for each content block. In addition tobasic contact descriptors, the system will also store data on the respondent’s position within the workplace. Thesedata will be analysed to shed some light on how information is propagated within the management structure of theworkplace.
The CAPI capture vehicle performs validity, range, and inter-field edits. These are the types of edits that areperformed during the collection of the first wave data. For subsequent waves a suitable set of historical edits hasbeen developed. The majority of inter-field edits are confined to a single content block. If an edit failure occursbetween blocks, then the primary respondent is asked to confirm the information.
An example of a validity edit is that total annual expenditures be positive. The corresponding range edit requiresthat expenditures not exceed a large upper bound. A related inter-field edit for total annual expenditures ensures thatthe sum of all expenditure sub-components such as wages and salaries, training expenses, and cost of implementingnew technologies does not exceed total annual expenditures.
Upon the completion of the interview, the primary respondent is asked to provide a list of employees associatedwith the workplace. Depending on the size of the employer, three, six, nine, or twelve employees are randomlyselected from the list. Given some basic personal employee data, the interviewer prints out a personalized employeeparticipation form containing six mandatory questions. The primary respondent is then asked to distribute theseforms to the selected employees.
Only the participation form is mandatory. The main employee questionnaire is voluntary. If the employeeagrees to take part in the survey, then the corresponding regional office contacts him or her for a telephoneinterview. Employees failing to return the participation form are followed up through their employer. This places anundue response burden on the primary respondent in the workplace, and is the reason for selecting at most twelveemployees for any one business location. The employee CATI application performs validity, range, and inter-fieldedits. Any edit failures are resolved during the telephone interview.
4.2. Outlier Detection and Treatment
The use of CATI and CAPI for data collection greatly reduces the number of gross response and typographicalerrors. If either type of error remains undetected, then a multivariate outlier detection routine, a modified Stahel-Donoho method, is applied to all complete and partial respondents prior to imputation. The technique uses robustMahalanobis distance, )()( 12
robrobT
robiMD xxΣxx ii −−= − , to identify units for which this statistic exceeds a pre-
specified percentile of the corresponding 2χ distribution. The variable robx in 2iMD is the 1L -estimator of
multivariate location (Rousseeuw and Leroy, 1987), robΣ a robust estimator of scatter computed using a methodsimilar to projection pursuit, and ix is a vector of responses for unit i . This type of outlier detection is performedfor both workplaces and employees at the micro data level. The sensitivity of the process can be adjusted to suit thesurvey's needs.
The current implementation of the outlier detection routine does not incorporate design weights. To be able touse the technique successfully with business survey data, one has to satisfy two criteria: (a) data homogeneity, and
230
(b) data symmetry. Achieving data homogeneity obviates the need to use design weights when pooling neighbouringstrata to increase the resolution of the outlier routine. Data homogeneity reduces the effect of the design and thecomplex problem of identifying aberrant observations in a sample drawn from a finite population reduces to a muchsimpler problem of dealing with outliers in the context of an infinite population.
Homogeneity can be achieved by applying an appropriate function to one or more variables. After data havebeen suitably transformed (eg., square root, log, etc.), the distributions of the resulting variables should be evaluatedfor approximate symmetry. This requirement stems from the fact that most outlier detection theory has beendeveloped for contaminated normal distributions. The modified Stahel-Donoho approach is no exception. For WES,approximate symmetry is achieved for ratios of continuous variables to total employment.
The outlier routine can be applied to respondents of a single wave, or across waves. To do so, the responsevector ix would be modified to include data from two consecutive waves. The possibility of extending the utility ofthe approach beyond two waves will be studied shortly. Our goal is to develop a method that would fill the gapbetween cross-sectional outlier detection and robust time series analysis. Data validation is also performed at amacro level. For a number of key variables we identify the top ten contributors to the weighted estimates for furtheranalysis. Subject matter officers identify both micro and macro level anomalies and correct errors. After errors havebeen corrected, the data validation cycle is repeated. All remaining outliers are flagged and excluded fromimputation.
4.3. Imputation
Imputation methods are used cross-sectionally for item non-response for units appearing within each wave forthe first time. Longitudinal imputation methods are for wave non-response if historical data are available. In theabsence of prior information, total non-response is handled by modifying the weights of the respondents. Thisapproach assumes that the non-response is occurring completely at random.
There are three imputation methods being used for the first wave of the employer portion of WES:deterministic, distributional, and weighted hot deck. Deterministic imputation is used when a single missing fieldcan be deduced uniquely from the given information. For example, if one component of a sum is missing and theremaining components including the sum are present, then the missing component can be determined uniquely.
Distributional imputation is used for questions where the respondent is asked to provide a total and itsbreakdown into multiple categories when either two or more of the categories are missing. The distribution of thecategories is computed at a macro level and applied at the micro level. To illustrate this approach, let us assume thatthe respondent gave us total employment but was unable to provide a breakdown by occupational group. We wouldapply the distribution of the occupational groups computed at the industry/size level to the total employment figureto impute the missing fields.
For weighted hot deck, a missing field is imputed using the response of a suitable donor. The donor is selectedrandomly with a probability of selection equal to the ratio of its sample weight over the sum of the sample weightsof all units in the corresponding cross-sectional imputation class. The weighted hot deck approach was adopted forthe following four reasons. The method is easy to implement. It leads to approximately p unbiased point estimates(Rao, 1996). A consistent variance estimator can be constructed in the presence of imputed data (Rao, 1996). Andlastly, most questions are independent keeping the number of post-imputation adjustments to maintain internal dataconsistency to a minimum.
Missing data on the employee questionnaire are imputed using deterministic and weighted hot-deck imputation.To avoid producing inconsistencies in the data, most interrelated fields are imputed as a block. Since there are anumber of questions falling into this category, a post-imputation system has been developed to preserve all inter-field relationships.
5. WEIGHTING AND ESTIMATION
Estimation for the Workplace and Employee Survey is also divided into two parts, a workplace portion and anemployee portion.

231
5.1. Workplace Portion
The workplace portion of WES is a stratified single-stage simple random sample of workplaces drawn withoutreplacement. Population estimates are computed using the separate ratio estimator. This improves efficiency of theestimates by adjusting sample totals to estimated population totals available from SEPH (Survey of Employees,Payroll, and Hours). The auxiliary information, total employment, is applied at the model group level, correspondingto combinations of industry and region.
We would like to introduce some notation before formulating the estimation process. Note that the superscript tdenoting time is implicit in all the following expressions. Let hU1 be the population of workplaces of size hN1 instratum h , where Lh ,...,1= ; let hs1 be the corresponding intersection of the population with the sample of size
hn1 . Stratum is defined as the crossing of industry, region, and employment size. Let y be the variable of interestand let hiy1 be its value for the thi unit in stratum h in the first stage of sampling (workplace stage). Then theestimated total for a specified domain of interest dU is given by
h
hL
hhRAT X
XdYdY1
1
11,1 ˆ)(ˆ)(ˆ �
== ,
where )()(ˆ 1
11
1
11 dy
nNdY
hn
ihi
h
hh �
== , �
∈=
hUihih xX
1
11 , and �∈
=hsi
hih
hh x
nNX
1
11
11
ˆ . The corresponding estimated variance is
,))()((ˆ1111))(ˆ(ˆ 2
111
2
1
1
1111
21,1
1
dedeXX
nNnNdYV hhi
n
ih
h
hhh
L
hhRAT
h
−���
����
�
��
��
−���
����
�−= ��
==
where
hiXY
hihi xdydeh
h1ˆ
ˆ11 1
1)()( −= and )()(1
11
11
1 dedeh
h
n
ihinh �
== .
In odd years, cross-sectional estimates will be unbiased and representative of the corresponding cross-sectionalpopulation. In even years, by virtue of not sampling birth units, the cross-sectional estimates will be somewhatbiased. Post-stratification and other techniques will be used to keep the bias to a minimum.
5.2. Employee Portion
The employee portion of WES is a stratified 2-stage design with workplaces drawn at the first stage andemployees drawn at the second stage. Within a given workplace (defined by the index hi ), we sample systematically
hin2 out of hiN 2 units. This results in a sample of employees: ��L
h
n
ihi
h
ss1 1
22= =
= . The measurement on an individual is
denoted by hijy2 , where the leading term of the index is used to specify the stage of sampling. The estimated totalfor a given domain dU has the form
)(ˆ)(ˆ 21
12
1 2
2
1
1
1 1
12 dy
nN
XX
nNdY
hih n
jhij
n
i hi
hi
h
hL
h h
h���=== �
��
����
�= .
The overall estimated variance of )(2̂ dY could be written as the sum of the variances for the two correspondingstages, I and II,
))(ˆ(ˆ))(ˆ(ˆ))(ˆ(ˆ222 dYVdYVdYV III += . (5.1.)
The first component of (5.1.) is defined as

232
��==
−���
����
�
��
��
−���
����
�−=
hn
ihihi
h
hL
h hhhhI dede
XX
nNnNdYV
1
1
211
2
1
1
1 111
212 ))()((ˆ1
111))(ˆ(ˆ ,
where )(ˆ)(ˆ)( 221 dYdYde hhihi −= . The two terms in the residual expression are )()(ˆ 2
22
122 dydY
hi
hihi
n
jhijn
Nhi �
== and
�=
=h
h
n
ihinh dYdY
1
11
21
2 )(ˆ)(ˆ . The second component of (5.1.) has the form
���
���
−−��
���
��
���
��
���
−�
�
���
= �� �
== =
2
122
2221 1
22
2
1
1
1
12 ))()((
1111
ˆ))(ˆ(ˆ21
dydynNn
NXX
nNdYV
hih n
jhihij
hihihi
L
h
n
ihi
h
h
h
hII ,
where )()(2
21
21
2 dydyhi
hi
n
jhijnhi �
== .
Due to the fact that the auxiliary totals used for calibration are estimates from another, much larger survey, theirvariance will be incorporated (not seen here) into the preceding variance formulas.
6. FUTURE DEVELOPMENT
The work on most post-collection processes of wave one is now terminated. The systems for wave two arenearing their completion as we are entering the second month of data collection. Stratification, sample allocation,sample selection, collection vehicles, edit and imputation, outlier detection, weighting and estimation have all beenput in place. A small pilot will be conducted in the fall of 2000 to test the changes that have been implemented toaccommodate the integration of WES and LCI (Labour Cost Index) slated for year three.
A small simulation study was done to identify a suitable method for longitudinal imputation. The resultssuggested that either longitudinal weighted hot-deck or longitudinal nearest neighbour would be good candidates forboth continuous and categorical data. The adopted strategies will be implemented over the next few months. At thistime it is conceivable that different imputation schemes be developed for small, medium and large employers. Thedecision hinges on further analysis of wave one data.
Even prior to conducting an in-depth investigation of the non-response patterns, there are some optionsavailable to us that we will explore. The possibility exists that longitudinal weights, along with the correspondingestimates, are revised after a respondent has decided to stop providing survey data. Revisions may also be necessaryif a refusal is converted and used to impute his or her past. We will also examine data collected by other surveys todetermine whether cross-imputation can be used to impute some missing items in WES.
Godfrey, J., A. Roshwalb, A. and Wright, R. L (1984). Model-Based Stratification in Inventory Cost Estimation.Journal of Business & Economic Statistics, Vol. 2, No. 1, 1-9.
Lavallée, P. and Hidiroglou, M. A. (1988). On the Stratification of Skewed Populations. Survey MethodologyJournal, Vol. 14, 33-44.
Little, R. J. and Rubin, D. B. (1987). Statistical Analysis with Missing Data. New York: Wiley.
Mahalanobis, P. C. (1952). Some aspects of the design of sample surveys. Sankhya 12, 1-7.
Rao, J. N. K. (1996). On Variance Estimation With Imputed Survey Data. Journal of the American StatisticalAssociation, Vol. 91, No. 434, pp. 499-520.
Rousseeuw, P. J. and Leroy, A. M. (1987). Robust regression and outlier detection. John Wiley & Son.
233
DISCUSSION OF WORKPLACE AND EMPLOYMENT SURVEYS PAPERS
Ted Wannell, Statistics CanadaOttawa, Ontario, Canada K1A 0T6
In conducting workplace and employee surveys, statistical agencies may have a number of specific goals, butthey generally include: 1) examining employer outcomes while taking account of employee characteristics, aswell as workplace practices and strategies ; and, 2) examining employee outcomes while taking account ofworkplace practices and strategies, as well as controlling for individual human capital.
In designing surveys to achieve these goals, some common features are evolving as evidenced by the paperspresented in this session. First, the organizational level of the employer surveyed should conform to thecommon sense notion of a workplace – a business location organized to achieve a common set of goals with afixed set of human resource practices. The statistical sampling infrastructure of different countries may putdifferent names on this level of organization – workplace, establishment, plant or location – but the desiredoutcome is the same: when you select an employee you want to ensure that she is actually governed by thepolicies and practices mentioned by the employer respondent. However, survey instruments and fieldworkpractices should be flexible enough to go to a higher level of organization if policies and practices are notwell understood by location level managers.
Second, multiple employees should be sampled within workplaces. Just how many depends on theanticipated analytical focus. Greenan and Mairesse (1998) have done some very interesting empirical workon just how few you can get away with. At the risk of oversimplification, they concluded that one employeeis okay in a pinch and two or three are pretty darn good. This is an encouraging result, since samplingefficiency (within a fixed budget) is increased by maximizing the size of the workplace sample andminimizing the number of employees sampled. However, there is a major drawback associated with smallemployee sample sizes: the smaller the employee sample size, the more likely zero employee responses willbe received. Such employee voids creates major analytical and methodological headaches.
Third, the analytical value of employer-employee surveys is greatly enhanced if they are longitudinal innature, with the primary focus on the workplace as the longitudinal unit. The workplace is the longitudinalfocus because workers are mobile among workplaces – if we tried to follow employees, the workplace samplewould explode over time. Furthermore, most, if not all, of the countries with employer-employee surveysalso conduct household-based longitudinal surveys covering many employee issues. Thus, analytically, thebest value for is to be found by focusing longitudinal efforts on the workplace side of employer-employeesurveys.
Quite aside from these practical reasons for the longitudinal focus on workplaces, there are methodologicalimperatives to a longitudinal approach, particularly given the interest in making inferences about workplaceoutcomes. The first is the well-recognized heterogeneity issue (see Capelli and Neumark 1999 for a completesurvey with relation to workplace practices). This can be loosely characterized as a chicken-or-the-egg issue:Did the establishment become successful before or after it implemented the practices under study? Theheterogeneity issue is typically addressed through the use of fixed effects models, which require longitudinalinformation on both practices and outcomes -- the longer the time span the better. Another issue that hasgenerally been disregarded is survivorship bias (a recent exception is Dunne et al 2000). Survivorship biasoccurs when the policies or practices under study are related to the probability of an establishment going outof business. Failed businesses are not observed in cross-sections or retrospective studies, so the extent anddirection of this bias is generally unknown.
The differences in the survey approaches presented in these papers are nearly as interesting as theircommonalities. Some of the differences obviously reflect the different roles played by the authors in theirrespective organizations. The institutional environments in which the surveys were developed also explainssome differences, particularly with respect to the content and methodology of the surveys. The differencesare best highlighted in the individual discussions of each paper.

234
MULTIPLE PERSPECTIVES ON EMPLOMENT RELATIONS: EXPERIENCE FROM THE 1998WORKPLACE EMPLOYEE RELATIONS SURVEYMark Beatson, Department of Trade and Industry, United Kingdom
As noted in the paper, this survey represents an evolution in a long-running series of surveys conducted bythe Department of Trade and Commerce formerly known as the Workplace Industrial Relations Surveys.This groundbreaking survey series began in 1980 in a much different economic climate than exists today.The emphasis was on a formal industrial relations model represented by large manufacturing establishments,with the assumed adversarial views of employer and employees expressed through management and worker(i.e. union) representatives . As the union density in the UK (and elsewhere) declined through the 1980s and1990s, there was a concomitant shift in academic work on employer-employee relations away from anindustrial relations vocabulary towards a human resource management vocabulary.
The first part of the paper chronicles the changes to the survey brought about by the change in the politicaland academic environment. While retaining a worker representative interview (where available), a randomsample of employees in each consenting workplace has been added to the survey program. The establishmentsize threshold was also lowered to 10 employees in the new survey, down from the previous 25. The surveycontent migrated away from the industrial relations pole towards the human resource management pole. Interms of longitudinal efforts, an attempt was made to contact all respondents from the 1990 WIRS andadminister them a questionnaire based on the 1990 questions (i.e. different from the 1998 cross-section). Theremainder of the paper is devoted to, in turn, an exposition of response rates, a smattering of cross-sectionalresults and a brief look at multiple perspectives on employment relations as promised in the title.
I think it’s fair to characterize this as a seed paper: it’s main intent is to sow interest in and encourage broaderuse of the survey data. My initial reaction was that it could better serve this purpose by either focusing moreon the development of and changes to the survey instruments as found in the first section or greatlyexpanding the “multiple perspectives” section and minimizing the earlier sections. On second thought, Irealized that papers on survey development have a very limited appeal and would probably not serve theintended purpose. Similarly, a focus merely on the results could limit interest in the paper to a particularacademic field. On closer reading, I think the story line to better integrate the parts is already present in paper– it just needs to be made more explicit. The story line is thus: industry, academia and the policyestablishment have shifted their model of employer-employee interactions away from an industrial relationsmodel towards a human resources model. Concomitant changes were made to a major research survey toreflect this shift. However, when the opinions of employers and employees are compared withinestablishments using the revised survey instrument, their views frequently diverge as might be expected underthe industrial relations paradigm. If the author chooses to take this route, then section 3.2 becomessuperfluous (it’s somewhat of a digression in the current format anyway) and could be eliminated.
THE METHODOLOGY OF THE WORKPLACE AND EMPLOYEE SURVEYZ. Patak, M. Hidiroglou and P. LavalléeStatistics Canada
I’m too close to this paper -- having worked with Zdenek, Mike and Pierre on the development of theWorkplace and Employee Survey for the past five years – to provide completely impartial comments. Itstands apart from the other papers in this session by focusing more on sampling, imputation and estimationissues. Keeping with the earlier theme, this seems to me a consequence of the Statistics Canada’sinstitutional environment in two ways.
First, in Statistics Canada we have the tradition of running large, representative surveys. In developing alinked employer-employee survey, the natural extension of this tradition was to design a survey that wasbroadly representative of the population of both workplaces and workers. This somewhat unconsciousdecision creates the methodological issues that are the focus of this paper: efficiently allocating the sample sothat inferences can be made within a number of industry-size groups; dealing with missing and nonsensicalresponses through outlier, edit and imputation routines to maximize data utility, particularly for descriptivestatistics; and, weighting estimates to population totals while accounting for the complex design effects.

235
Second, the extent to which these methodological issues are the main focus of the paper relates to theorganizational structure and specialization of roles in Statistics Canada. Subject matter analysts reside insubject matter divisions and “do” subject matter. Methodologists reside in methodology divisions and “do”methodology. Although these barriers are beginning to show some cracks, the ‘twain is too seldom bridgedfor my tastes.
My suggestions for revising this paper are entirely selfish. I’d like to see it evolve into more of a lay leveldiscussion aimed at users of WES data. This would imply simplifying sections 3, 4 and 5, and adding asection on the implications of the methodological decisions for both aggregate- and micro-data users.
ORGANIZATIONAL CHANGE IN FRENCH MANUFACTURING: WHAT DO WE LEARN FROMFIRM REPRESENTATIVES AND FROM THEIR EMPLOYEES?Nathalie Greenan (Centre d’Etudes de l’Emploi) and Jacques Mairesse (CREST-INSEE and NBER)
This paper impressed me with the number of important bridges it created. It bridges the various theories usedto explain organizational change with the observation of organizational change. It bridges the semantic issuesinvolved with transferring concepts from a largely English language literature to a French language surveyinstrument. It bridges the rational intentions of organizational change with the human resource and otherconstraints of implementing change. Finally, it bridges a large sample survey approach with a case studyapproach. These bridges combine to form the infrastructure necessary to study the relationship betweenorganizational change and performance. This infrastructure provides important lessons for both datacollection and analysis. A list follows of what I see as the most important lessons.
� Ensure that the concepts being measured are well understood in all sizes of establishments.� Finding the correct employer respondent improves the quality of the data.� Survey instruments need to capture multiple dimensions of change for both employees and employers.� Both location size and enterprise size (and structure) matter.� The sequencing of various elements of change is important.� Outside influences (mainly customers) may be as important in precipitating organizational change as
internal planning.� Constraints limiting the scope of organizational change may be as important as the change itself.
Given that the paper is primarily focused on these infrastructure issues, I found the introductory discussionon theories of organizational change to be somewhat of a red herring. I think it would be sufficientmotivation for the paper to simply state that there are competing models of firm behaviour and surveyinstruments need to be well-designed to effectively evaluate the relative merits of competing models. I’d alsolike to see the authors address my pet issue of survivorship bias, particularly since one of their case studieswent through a bankruptcy between the original interview and the follow-up. However, these points arerelatively minor and I’d like to finish by complementing the authors on a paper that I, personally, have foundvery useful.
ORGANIZATIONAL CHANGE IN FRENCH MANUFACTURING IN 1997Nathalie Greenan (Centre d’Etudes de l’Emploi), Sylvie Hamon-Cholet (DARE) and Jacques Mairesse(CREST-INSEE and NBER)
This paper makes use of the same survey as the earlier Greenan-Mairesse submission, but is much more in themould of a “first findings” paper. It consists primarily of an exploratory analysis that asks how much of anaffect do various types of reorganization have on individual workers. The short answer is that the only typeof reorganization that consistently and significantly affects workers’ jobs is ISO certification. Most othertypes of reorganization had little impact on workers.
Although I don’t have much to say about the methods or results of the paper, I think readers would benefitfrom some further work on the organization – particularly the addition of an introduction and conclusion (orat least a discussion of the results). At a first glance, the lead paragraph reads as some general notions about

236
reorganizations, but in retrospect it could be viewed as a summary of the results. The goals, methodologyand (according to the authors’ tastes) main findings should be made explicit at the beginning so that thereader knows how to orient the information presented in the paper. There are also some obvious points tobring into the discussion of the results. For example, what is the relationship between the small within-establishment sample sizes and the lack of robust employee effects for most reorganizations. Another pointwould be to contrast the pervasive and externally verified procedures involved in ISO certification to the lessformal – perhaps limited scale – approach of other types of reorganization. Although this information can begleaned from one of the information boxes, it should receive some attention in the body of the paper. Oneother minor point is that I would prefer to see some more specifics on the estimated models. How is the lackof independence of employer effects (i.e. across employees within the same company) treated?
Capelli, P., D. Neumark, Do “High Performance” Work Practices Improve Establishment-Level Outcomes?National Bureau of Economic Research Working Paper 7374. Cambridge, Massachusetts. October,1999.
Dunne,T., J. Haltiwanger, L. Foster, K. Troske. Wage and Productivity Dispersion in U.S. Manufacturing:The Role of Computer Investment. National Bureau of Economic Research Working Paper W7465.Cambridge, Massachusetts. January, 2000.
Mairesse, J., N. Greenan. “Using Employee-Level Data in a Firm-Level Econometric Study” pp. 489-512, inThe Creation and Analysis of Employer and Employee Matched Data, John C. Haltiwanger et al, eds.North-Holland, Amsterdam. 1999.