multiple substrate-induced respiration and … abstract multiple substrate-induced respiration and...
TRANSCRIPT

UPTEC W 17 003
Examensarbete 30 hpMaj 2017
Multiple Substrate-Induced Respiration and Isothermal Calorimetry
Applicability in Risk Assessment of Contaminated
Soil
Caroline Wright
i
ABSTRACT
Multiple substrate-induced respiration and isothermal calorimetry – applicability
in risk assessment of contaminated soil
Caroline Wright
At present, soils face great threats. Consequences of human activities, such as climate
change, acidification and contamination result in decreased soil health. This is a threat to
human health and well-being, since our society is dependent on soil ecosystem services.
The soil ecosystems provide resources, such as food and fresh water, regulate the climate
and play key parts in important life supporting biological processes, e.g. cycling of carbon
and nutrients. Due to increased awareness of the threats that soils face, and its importance
to humans, soil quality monitoring has recently received increased attention.
Microorganisms run most biological processes in the soil, such as decomposition of
organic material and nutrient cycling. Thus, microbial activity and diversity are
considered useful biological indicators for soil quality monitoring. These biological
properties can be examined using different methods.
The aim of the project was to evaluate the potential of multiple substrate-induced
respiration (MSIR), using the MicroRespTM system, and isothermal calorimetry for
determining microbial activity and diversity in soils contaminated with copper (Cu) and
polycyclic aromatic hydrocarbons (PAH). Thereby, the methods’ applicability in risk
assessment of contaminated soil could be decided. MSIR is considered appropriate for
determining microbial activity and functional diversity, while isothermal calorimetry has
not been tested as much in this area. The calorespirometric ratio (produced heat per unit
CO2) was calculated to evaluate potential relationships between heat and CO2 at different
contamination levels.
Although there was some variation between the methods, Cu had a clear effect on both
microbial activity and functional diversity. Both methods were thus considered applicable
in risk assessment of soil contaminated with Cu. The impact of PAH appeared to be more
complex, the effects on microbial activity varied and PAH had little significant effect on
functional diversity. Neither of the methods were therefore considered applicable for
assessment of soil contaminated with PAH. The calorespirometric ratio did not provide
useful results, and cannot be recommended for risk assessment purposes at present.
Keywords: Risk assessment, biological indicators, multiple substrate-induced
respiration, MSIR, MicroRespTM, isothermal calorimetry, calorespirometric ratio,
contamination, Cu, PAH
Department of Soil and Environment, Swedish University of Agricultural Sciences (SLU).
Lennart Hjelms väg 9, SE 750 07 Uppsala
ii
REFERAT
Multipla substrat-inducerad respiration och isotermisk kalorimetri – tillämplighet
i riskbedömning av förorenad mark
Caroline Wright
I dagsläget utsätts marken för stora hot. Följder av mänsklig aktivitet, så som
klimatförändringar, försurning och förorening försämrar markens kvalitet. Detta är ett hot
mot människors hälsa och välmående, eftersom vårt samhälle är beroende av markens
ekosystemtjänster. Markens ekosystem förser oss med exempelvis mat och rent vatten,
reglerar klimatet, och har nyckelroller i viktiga biologiska processer, exempelvis
cirkulering av kol och näringsämnen. På grund av ökad medvetenhet om hoten mot
marken samt dess betydelse för människan, har kontroll av markens kvalitet börjat få
ökad uppmärksamhet.
Mikroorganismer sköter de flesta biologiska processer som sker i marken, så som
nedbrytning av organiskt material och cirkulering av näringsämnen. Därmed anses
mikrobiell aktivitet och diversitet vara lämpliga biologiska indikatorer vid kontroll av
markens kvalitet. Dessa biologiska egenskaper kan mätas med flera olika metoder.
Syftet med projektet var att utvärdera potentialen i att använda multipla substrat-
inducerad respiration (MSIR), genom att använda systemet MicroRespTM, samt
isotermisk kalorimetri för att mäta mikrobiell aktivitet och funktionell diversitet i mark
förorenad med koppar (Cu) och polycykliska aromatiska kolväten (PAH). Därmed kunde
metodernas tillämplighet i riskbedömning av förorenad mark bestämmas. MSIR anses
vara en lämplig metod i syfte att undersöka mikrobiell aktivitet och funktionell diversitet,
medan isotermisk kalorimetri inte är lika beprövat. Kvoten mellan värmeproduktion och
respirerad CO2, the calorespirometric ratio, beräknades för att utvärdera eventuella
samband mellan värmeproduktion och respiration vid olika föroreningskoncentrationer.
Trots att det förekom viss variation mellan metoderna, hade Cu en tydlig effekt på både
mikrobiell aktivitet och funktionell diversitet. Båda metoder ansågs därför vara
tillämpbara i riskbedömning av Cu-förorenad jord. PAH hade varierande effekt på
mikrobiell aktivitet och liten signifikant effekt på funktionell diversitet. Ingen av
metoderna ansågs därför tillämpbar i riskbedömning av jord förorenad med PAH. The
calorespirometric ratio tillhandahöll ej användbara resultat, och kunde därmed inte
rekommenderas i riskbedömningssyfte.
Nyckelord: Riskbedömning, biologiska indikatorer, multipla substrat-inducerad
respiration, MSIR, MicroRespTM, isotermisk kalorimetri, calorespirometric ratio,
förorening, Cu, PAH
Institutionen för mark och miljö, Sveriges lantbruksuniversitet (SLU), Lennart Hjelms
väg 9, SE 750 07 Uppsala

iii
PREFACE
This Master’s thesis corresponds to 30 ETCS and is the final part of the M.Sc. in
Environmental and Water Engineering at Uppsala University. My supervisor was
Professor Dan Berggren Kleja and my subject reviewer was Associate Professor Anke
Herrmann, both at the Department of Soil and Environment at the Swedish University of
Agricultural Sciences.
The project was performed as a part of the science project APPLICERA, which is a
collaboration between the Swedish University of Agricultural Sciences, the Swedish
Geotechnical Institute, Chalmers University of Technology and Örebro University.
I would like to thank my subject reviewer Anke Herrmann, who with great engagement
has provided valuable knowledge and assistance throughout the course of this project.
You have patiently answered my questions which I am very grateful for. I would also like
to thank my supervisor Dan Berggren Kleja for giving me the opportunity to carry out
this project, for sharing his expertise and providing valuable feedback on the report.
Finally, I wish to thank my family and friends for all the encouragement and support
throughout my years of studying and the course this thesis.
Uppsala, Sweden, May 2017
Caroline Wright
Copyright © Caroline Wright and the Department of Soil and Environment, Swedish
University of Agricultural Sciences (SLU). UPTEC W 17 003, ISSN 1401-5765
Published digitally at the Department of Earth Sciences, Uppsala University, May 2017

iv
POPULÄRVETENSKAPLIG SAMMANFATTNING
Mänsklig aktivitet utgör ett stort hot mot markens funktion i dagsläget.
Klimatförändringar och försurning till följd av bland annat förbränning av fossila
bränslen, så som olja och kol, påverkar marken negativt. Även föroreningar från
exempelvis gamla industriområden hotar markens hälsa. Försämrad markhälsa påverkar
även människors hälsa och välmående eftersom vi på många sätt är beroende av marken.
I marken finns ekosystem som förser vårt samhälle med många viktiga råvaror och
tjänster. De förser oss till exempel med mat och rent vatten, och bidrar till reglering av
klimatet genom att reglera koncentrationer av växthusgaser (exempelvis koldioxid,
dikväveoxid och metan) i atmosfären. Markens ekosystem har också nyckelroller i många
viktiga biologiska processer, exempelvis cirkulering av kol och näringsämnen. På grund
av ökad medvetenhet om hoten mot marken samt dess betydelse för människan, har
kontroll av markens kvalitet börjat få ökad uppmärksamhet.
Marklevande mikroorganismer, så som bakterier, har stor påverkan på markens funktion.
De driver de flesta av de biologiska processer som äger rum i marken, exempelvis
nedbrytning av organiskt material och cirkulering av näringsämnen. På grund av
mikroorganismernas stora betydelse kan de också användas för att indikera markens
kvalitet och funktion; de är lämpliga biologiska indikatorer. Två egenskaper som anses
vara lämpliga biologiska indikatorer är mikroorganismernas aktivitet och mångfald. Det
finns många olika metoder för att mäta dessa egenskaper.
När människors hälsa, miljön eller omkringliggande naturresurser hotas av förorenad
mark, måste åtgärder vidtas. Som en del av processen att bestämma lämplig åtgärd bör en
riskbedömning göras. Syftet med projektet var att utvärdera två metoders potential att
mäta mikroorganismers aktivitet och mångfald, och därmed avgöra deras lämplighet i
riskbedömning av förorenad mark. Metoderna mätte mikroorganismernas respiration
(avgång av koldioxid, som är slutprodukten i många mikroorganismers ämnesomsättning)
och värmeproduktion (värme bildas i markprocesser som frigör energi) till följd av tillsats
av sju olika kolsubstrat, det vill säga organiskt kol som mikroorganismerna kan använda
i sin ämnesomsättning. Respirationen och värmeproduktionen mättes i oförorenade
jordprover samt jordprover förorenade med metallen koppar (Cu) och den organiska
föroreningsgruppen polycykliska aromatiska kolväten (PAH) för att undersöka om
föroreningarna hade någon påverkan på mikroorganismernas aktivitet och mångfald.
Cu är en essentiell, det vill säga livsnödvändig, metall som släpps ut i naturen i och med
exempelvis användande av bekämpningsmedel i jordbruket och motorfordon. Trots att
det inte är så giftigt för däggdjur, är det mycket giftigt för mikroorganismer. Därför var
det föga förvånande att båda metoder visade att Cu generellt minskande
mikroorganismernas aktivitet och mångfald. PAH är en föroreningsgrupp bestående av
organiska ämnen. Exempel på källor för utsläpp av PAH är uppvärmning och ofullständig
förbränning av organiskt material. De olika ämnena i gruppen PAH är olika giftiga, vissa
är till exempel cancerframkallande. I mätningarna av mikroorganismernas respiration och
produktion av värme, hade PAH en mer komplex effekt än Cu. Effekten på
mikroorganismernas aktivitet varierade mellan jordar och metoder, och PAH hade liten
signifikant effekt på den mikrobiella mångfalden.

v
Överlag visade mätning av både värmeproduktion och respiration potential för att korrekt
kunna mäta mikroorganismernas aktivitet och mångfald i jord förorenad med Cu. Därför
ansågs båda metoder vara tillämpliga i riskbedömning av mark som är förorenad av Cu.
Det förekom viss variation mellan metoderna vilken bör redas ut i ytterligare försök.
Effekten av PAH bedömdes vara alltför komplex för att metoderna skulle kunna
tillhandahålla tillförlitliga resultat. Ingen av metoderna ansågs därför vara användbar i
riskbedömning av PAH-förorenad mark.
vi
TABLE OF CONTENTS
1 INTRODUCTION ..................................................................................................... 1
1.1 BACKGROUND ............................................................................................... 1
1.1.1 Ecosystem services of soils ........................................................................ 1
1.1.2 Biological indicators in soil quality monitoring ......................................... 1
1.1.2.1 Multiple substrate-induced respiration ................................................... 2
1.1.2.2 Isothermal calorimetry ............................................................................ 2
1.1.2.3 The calorespirometric ratio ..................................................................... 3
1.1.3 Soil contamination and remediation ........................................................... 3
1.1.3.1 Copper ..................................................................................................... 3
1.1.3.2 Polycyclic aromatic hydrocarbons .......................................................... 3
1.2 AIM .................................................................................................................... 4
1.3 HYPOTHESIS ................................................................................................... 4
2 METHODS AND MATERIAL ................................................................................ 5
2.1 LYSIMETER FIELD EXPERIMENT .............................................................. 5
2.2 LABORATORY EXPERIMENT ...................................................................... 7
2.2.1 Sampling and preparation of soil ................................................................ 7
2.2.2 Microbial activity and functional diversity ................................................ 7
2.2.2.1 Carbon substrate solutions ...................................................................... 7
2.2.2.2 Reference samples .................................................................................. 8
2.2.2.3 Substrate-induced respiration and heat production ................................. 8
2.2.2.4 Abiotic processes .................................................................................... 8
2.3 THE CALORESPIROMETRIC RATIO ........................................................... 9
2.4 THE SHANNON INDEX .................................................................................. 9
2.5 THE SIMPSON INDEX .................................................................................... 9
2.6 STATISTICAL ANALYSIS ............................................................................. 9
3 RESULTS................................................................................................................ 10
3.1 SOIL CHARACTERISTICS ........................................................................... 10
3.2 OVERALL MICROBIAL ACTIVITY ........................................................... 10
3.2.1 Effects on heat production ........................................................................ 10
3.2.2 Effects on respiration ................................................................................ 11
3.2.3 The calorespirometric ratio ....................................................................... 13
3.3 MICROBIAL FUNCTIONAL DIVERSITY .................................................. 13
3.3.1 Heat production ........................................................................................ 13
3.3.2 CO2 production ......................................................................................... 15
vii
3.3.3 Principal component analysis ................................................................... 17
3.3.3.1 Comparison of Krusenberg and Nåntuna soil ....................................... 17
3.3.3.2 Impact of Cu and PAH in Krusenberg soil ........................................... 18
3.3.3.3 Impact of Cu and PAH in Nåntuna soil ................................................ 19
3.3.4 The Shannon Index ................................................................................... 20
3.3.5 The Simpson Index ................................................................................... 21
4 DISCUSSION ......................................................................................................... 22
4.1 OVERALL MICROBIAL ACTIVITY ........................................................... 22
4.1.1 Effects of Cu ............................................................................................. 22
4.1.2 Effects of PAH ......................................................................................... 22
4.1.3 The calorespirometric ratio ....................................................................... 23
4.2 MICROBIAL FUNCTIONAL DIVERSITY .................................................. 23
4.2.1 Influence of carbon substrates .................................................................. 23
4.2.2 Abiotic processes ...................................................................................... 23
4.2.3 Effects on microbial functional diversity ................................................. 24
4.3 APPLICABILITY IN RISK ASSESSMENT .................................................. 25
4.4 UNCERTAINTIES .......................................................................................... 25
5 CONCLUSIONS ..................................................................................................... 26
6 REFERENCES ........................................................................................................ 27
APPENDIX .................................................................................................................... 31
A1 CALIBRATION CURVE ................................................................................ 31
A2 HEAT DATA ................................................................................................... 32
A3 NORMALIZED HEAT DATA ....................................................................... 33
A4 RESPIRATION DATA ................................................................................... 34
A5 NORMALIZED RESPIRATION DATA ........................................................ 35
1
1 INTRODUCTION
1.1 BACKGROUND
1.1.1 Ecosystem services of soils
Soils are essential to human societies. Ecosystems which inhabit the soil provide a wide
range of goods and services. These can be arranged as supporting, provisioning,
regulating and cultural services (Haygarth and Ritz, 2009). The supporting services
maintain life on Earth through processes such as primary production, nutrient cycling and
soil formation. The provisioning ecosystem services supply food and fresh water as well
as raw- and biomaterials and a platform for infrastructure. The regulating services
regulate water supply and quality. They also regulate the climate through regulation of
atmospheric concentrations of greenhouse gases, such as carbon dioxide (CO2), nitrous
oxide (N2O) and methane (CH4). Finally, the cultural ecosystem services provide
spiritual, recreational, and cultural value (Haygarth and Ritz, 2009).
Soils are one of Earth’s most complex systems (Ramsden and Kervalishvili, 2008). They
are heterogeneous systems which make up a habitat to immense diversity (Haygarth and
Ritz, 2009; Turbé et al., 2010), regarding abundance within species, species richness and
function (Pulleman et al., 2012). The biodiversity in soil exceeds the biodiversity
anywhere else in the biosphere. Without its diversity, the soil would not be able to deliver
its important ecosystem services (Turbé et al., 2010).
As a result of increased awareness of the soils’ essential ecosystem services, soil quality
monitoring is receiving attention (Creamer et al., 2009; Pulleman et al., 2012). Soil
quality, or soil health, has many definitions. What they all have in common, however, is
that the soil should be able to function in a fashion that is consistent with its intended use,
at present and in the future (Haygarth and Ritz, 2009). To ensure sustainable delivery of
ecosystem services, assessment tools for soil quality monitoring are required (Turbé et
al., 2010).
1.1.2 Biological indicators in soil quality monitoring
Although the soil biota runs most processes in soil, soil function has previously been
associated with the soil’s physical and chemical properties (Ritz et al., 2009). Due to the
importance of biota to soil function, biological properties should be obvious indicators of
soil quality (Nyberg et al., 2006; Black et al., 2008; Creamer et al., 2009; Ritz et al.,
2009). Biological indicators have been used in specific situations for some time (Griffiths
et al., 2016), but few have reached national success or the status as international standards
(Ritz et al., 2009) and there is no obtainable standardized set (Pulleman et al., 2012).
Indicators are measurable substitutes to soil functions which might be too complex to
assess (Turbé et al., 2010; Pulleman et al., 2012). Their purpose is to simplify information
and measurements (Turbé et al., 2010). Various biological properties have been suggested
as indicators. Ritz et al. (2009) developed a methodology in order to select appropriate
indicators of soil quality. One of the candidates they considered to be applicable were
abundance and diversity of nematodes, which was also suggested by Turbé et al. (2010).
Nematodes show sensitivity regarding land use and soil type variations but the

2
measurement is, however, time consuming and requires specific knowledge (Turbé et al.,
2010). Abundance and diversity of earthworms is also considered a useful indicator.
These properties are easy to measure and sensitive to land use and soil type variations
(Turbé et al., 2010). Most of the biological processes which take place in soil are run by
microorganisms. They play key parts in fundamental processes, such as decomposition
of soil organic material (SOM) and circulation of carbon and nutrients (Nyberg et al.,
2006; Van Der Heijden et al., 2008; Ritz et al., 2009; Pulleman et al., 2012).
Consequently, microbial activity and diversity are indicators of functions in which
microorganisms participate (Turbé et al., 2010).
Diversity can be assessed using a variety of indexes (DeJong, 1975), e.g. The Shannon
Index, established by Pielou (1975; Stevens et al., 2003) and the Simpson Index,
established by Simpson (1949; DeJong, 1975). The Shannon Index puts much weight on
the species richness, while the Simpson Index is more influenced by the species evenness
(DeJong, 1975). However, biodiversity has often been ignored in monitoring of soil, since
it is considered an ambiguous concept, and thus difficult to measure. Instead, methods
which evaluate the soil’s functional diversity have been established (Turbé et al., 2010).
The functional diversity is the distribution of functions within the soil community
(Stevens et al., 2003). The Shannon Index and the Simpson Index can also be applied for
estimations of functional diversity.
1.1.2.1 Multiple substrate-induced respiration
During microbial decomposition of SOM, some of the organic carbon is assimilated into
biomass while some is respired to the atmosphere as CO2 (Schlesinger and Andrews,
2000; Harris et al., 2012; Bölscher et al., 2016). Multiple substrate-induced respiration
(MSIR) measures the respiration in the soil. MSIR measurements reflect microbial
activity, and can therefore be used to assess e.g. carbon cycling and decomposition of
organic material (Ritz et al., 2009). It is an established and frequently used method in soil
quality monitoring (Jensen and Mesman, 2006), and it is used on larger scales in some
countries, such as the UK and Switzerland (Pulleman et al., 2012). Measurements of the
microorganisms’ respiration can also be used to assess microbial functional diversity
(Turbé et al., 2010).
There is a variety of different methods available for measuring respiration (Black et al.,
2008). The MicroRespTM system (Campbell et al., 2003), is ranked as one of the best
(Black et al., 2008). There is, however, some debate regarding MicroRespTM’s
applicability on larger scales. Its high throughput is what makes it applicable for large
scale soil monitoring (Black et al., 2008; Ritz et al., 2009). However, both Black et al.
(2008) and Ritz et al. (2009) pointed out that there is still need for further testing across
different land uses, and according to Creamer et al. (2009), MicroRespTM should be used
carefully on large scales.
1.1.2.2 Isothermal calorimetry
As opposed to MSIR, which only takes into account the CO2 produced in complete
metabolic processes, isothermal calorimetry is an energetics approach which includes net
heat production from all catabolic and anabolic processes in soil (Herrmann and Bölscher,
2015). It includes complete and incomplete aerobic metabolic processes, anaerobic
metabolic processes and abiotic processes (Haglund et al., 2003). Heat production is
3
considered a suitable substitute for assessing microbial activity (Braissant et al., 2010),
and isothermal calorimetry has been proven effective when it comes to accurately
measuring heat production in soils (Harris et al., 2012; Herrmann et al., 2014).
While MSIR is considered suitable for monitoring soil quality (Jensen and Mesman,
2006), there is not much research about applying isothermal calorimetry for this purpose.
However, it could potentially function as an alternative, or supply complementary
information, to respiration measurements (Herrmann et al., 2014).
1.1.2.3 The calorespirometric ratio
Measurements of CO2 and heat can be combined using the calorespirometric ratio
(produced heat per unit CO2; equation 1 on page 8). It has been used to assess microbial
metabolism and metabolic efficiency, i.e. how efficiently soil microorganisms decompose
soil organic carbon (SOC; Barros et al., 2010). For decomposition of organic material
with identical composition, higher ratios indicate lower metabolic efficiency, since more
waste heat is released per unit CO2 (Herrmann and Bölscher, 2015). The
calorespirometric ratio is not, however, established in risk assessment of contaminated
soil.
1.1.3 Soil contamination and remediation
Contamination of soil is one of the main threats to soil quality (Howard, 1993; Creamer
et al., 2010). Exposure to contaminants, such as metals and organic contaminants, can
harm soil organisms which seriously impacts soil ecosystems (Creamer et al., 2010). This
project focuses on the toxic effects of the metal copper (Cu) and the organic contaminant
group polycyclic aromatic hydrocarbons (PAH) on soil microorganisms.
1.1.3.1 Copper
Although Cu is an essential metal (Berggren Kleja et al., 2006; Wang et al., 2010), it is
very toxic to microorganisms (Sternbeck, 2000). The sensitivity varies a lot among
species (Berggren Kleja et al., 2006), bacteria are particularly sensitive (Wang et al.,
2010). Wang et al. (2009) showed that Cu reduces the soil microorganisms’ ability to
carry out their functions. Exposure to Cu has also been shown to affect microbial activity
(Wang et al., 2007, 2010; Li et al., 2015) and diversity (Wang et al., 2007). According to
the work of (Airoldi and Critter, 1996), exposure to Cu results in reduced microbial
growth and ability to degrade glucose. The fraction of bioavailable Cu determines its
toxicity. The two major factors which affect the bioavailability are pH and SOM content
(Berggren Kleja et al., 2006).
1.1.3.2 Polycyclic aromatic hydrocarbons
PAH occur in mixtures containing different compounds of varying toxicity (CCME,
2008; Naturvårdsverket, 2009), which can obstruct the assessment of potential risks
(CCME, 2008). The toxicity of PAH is also influenced by the bioavailability (El-Alawi
et al., 2002). The presence of PAH in soil can both increase and decrease microbial
activity and diversity. Some bacteria and fungi can utilize PAH as a carbon source
(CCME, 2008; Turbé et al., 2010), which increases microbial activity. At high
concentrations, however, the toxic effect leads to decreased activity (Dawson et al., 2007;
4
CCME, 2008). Sverdrup et al. (2002) observed no effects on bacterial diversity following
PAH exposure.
Due to the threats of contamination, remediation of contaminated soil is important to
improve soil function. Excavation of contaminated soil is usually required to reduce direct
risks to human and environmental health. However, excavation practices greatly impact
the soil environment, and result in e.g. soil erosion and disturbance of soil ecosystems
(US EPA, 2008). Disturbed soil ecosystems is a big problem since it takes a long time for
them to be restored once their function is lost or reduced (Haygarth and Ritz, 2009). It is
therefore important to develop a methodology for monitoring the effects of contaminants
on soil and ecosystem function without facing negative environmental consequences.
Even though microbial properties have been used and recommended as biological
indicators of soil contamination (Brookes, 1995; Winding et al., 2002; Dawson et al.,
2007) there is still need to investigate the potential of MSIR and isothermal calorimetry
for this purpose.
1.2 AIM
The aim of the project was to evaluate the applicability of MSIR, using the MicroRespTM
system, and isothermal calorimetry in risk assessment of contaminated soil. This was
done by assessing the effects of Cu and PAH on microbial activity and microbial
functional diversity, using both methods. The applicability of each method was evaluated
separately, but potential to combine the two, using the calorespirometric ratio, was also
investigated.
Three specific questions were formulated:
▪ Is there a relationship between contamination level and microbial heat production
in soil contaminated with Cu and soil contaminated with PAH?
▪ Is there a relationship between contamination level and microbial respiration in
soil contaminated with Cu and soil contaminated with PAH?
▪ How do different concentrations of Cu and PAH influence the calorespirometric
ratio?
1.3 HYPOTHESIS
According to previous research, MSIR is a suitable method for monitoring soil function.
Therefore, similar results were expected in this project. Even though there has not been
much testing of isothermal calorimetry’s applicability per se, it has been proven to
accurately measure heat flows from soil, which reflect microbial activity. Thus,
isothermal calorimetry was assumed to be useful as well.
The hypotheses to the questions were:
▪ The heat production was expected to decrease with increasing Cu concentration,
due to the well-known toxicity of Cu to microorganisms. The response of PAH
on heat release was expected to be a bit more complex, since PAH can both
increase and decrease microbial activity.

5
▪ For the same reasons as above, the microbial respiration was expected to
decrease with increasing Cu concentration while the respiration response to
PAH was expected to be more complex.
▪ The calorespirometric ratio was expected to increase with Cu concentration,
since an increase indicates decreased metabolic efficiency. Due to the
uncertainties regarding heat and respiration responses to PAH, it remained
unclear how the ratio would change at different PAH concentrations.
2 METHODS AND MATERIAL
2.1 LYSIMETER FIELD EXPERIMENT
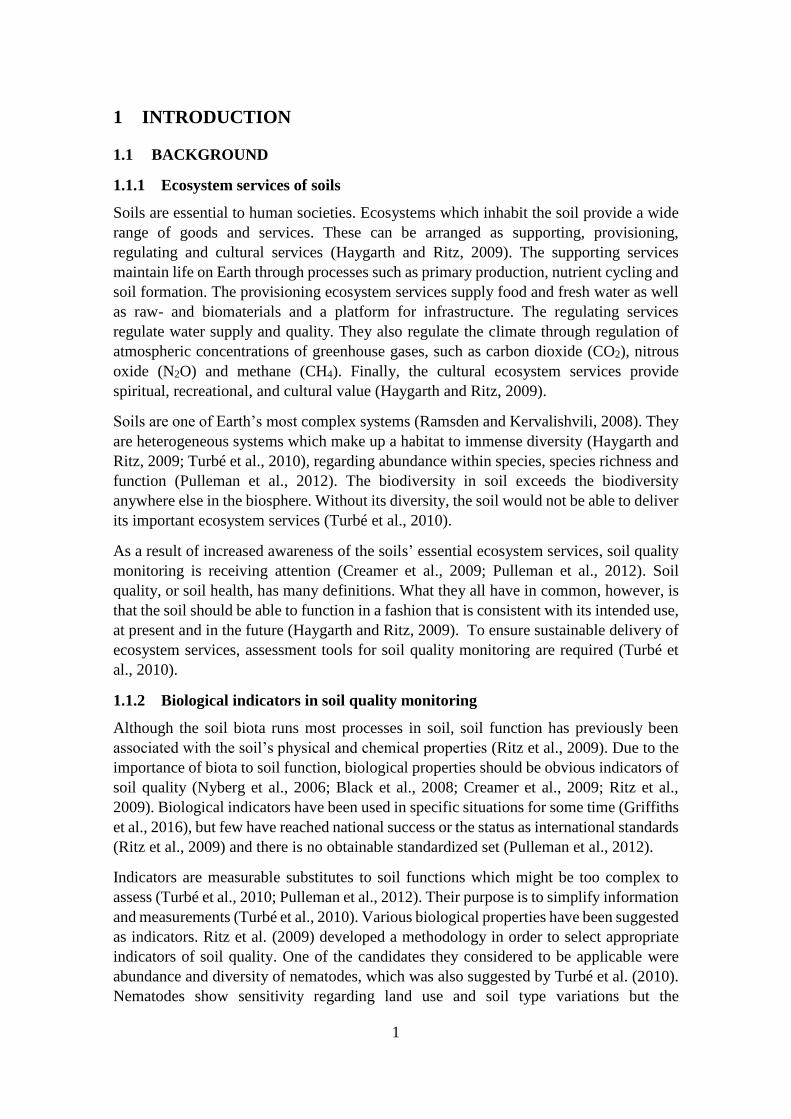
The soils which were analyzed in the project were prepared in a lysimeter field
experiment at the Swedish University of Agricultural Sciences (SLU). Figure 1 shows a
picture of the lysimeter park in the summer of 2016.
Figure 1 The lysimeter field experiment in the summer of 2016.
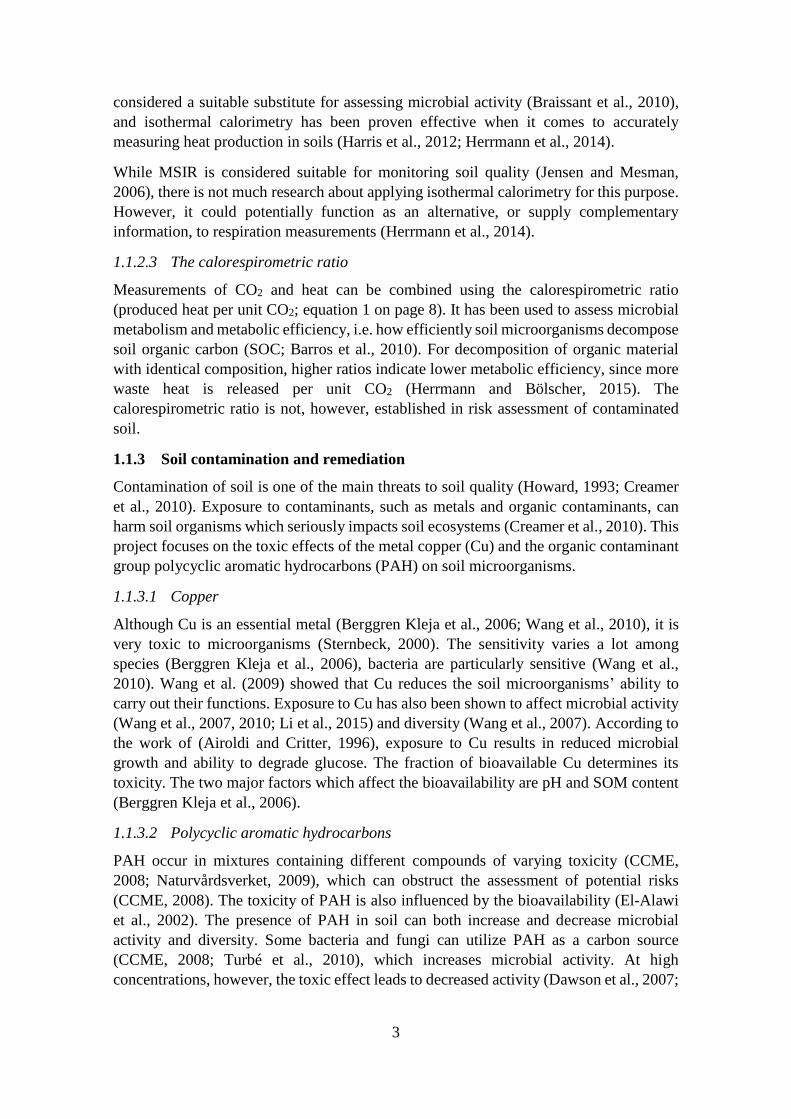
The experiment was initiated in October 2015 (a timeline describing when the different
events of the lysimeter experiment took place is shown in Figure 2). The soil which was
used in the experiment was sampled from two grasslands in the Uppsala area, Krusenberg
(59.741117 °N, 17.682137 °E) and Nåntuna (59.796459 °N, 17.670756 °E). In October
2015, soil from both sites was mixed with 1 M CuCl2 and 1 M CaO to achieve soil with
high concentration of Cu (the Cu spike soil). The CaO was added to neutralize the protons
released when Cu2+ was bound to soil material. The Cu spike soils were placed in
lysimeters in the lysimeter park, and put to rest during the winter of 2015/2016 to allow
leaching of excess Cu. The Cu spike soils had a target concentration of 3,000 mg kg-1.
6
Figure 2 Timeline describing the implementation of the lysimeter field experiment.
In May 2016, soil was sampled from both locations, and soil with high PAH concentration
(the PAH spike soil) was collected at the Nässjö impregnation work. The PAH spike soil
contained PAH compounds with low (L), medium (M) and high (H) molecular weight at
a total concentration of 14,000 mg kg-1. Soils of different Cu and PAH concentration
(Table 1) were achieved by mixing the spike soils with uncontaminated soil from
Krusenberg and Nåntuna.
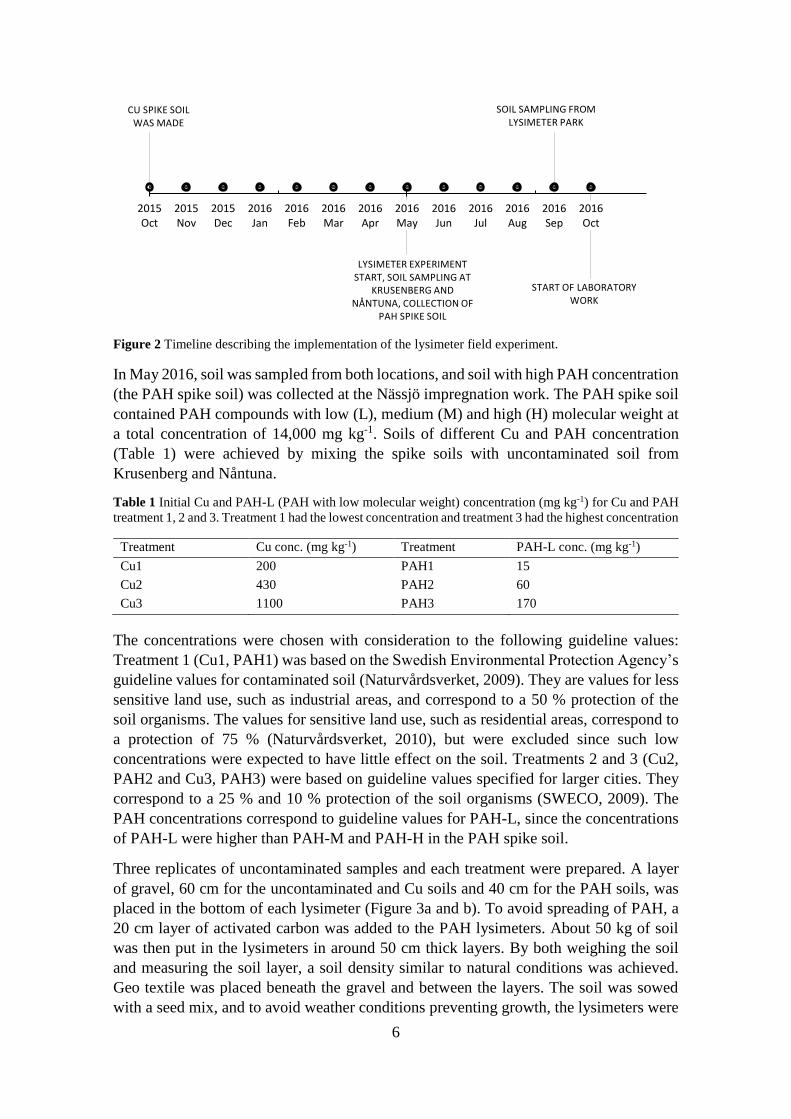
Table 1 Initial Cu and PAH-L (PAH with low molecular weight) concentration (mg kg-1) for Cu and PAH
treatment 1, 2 and 3. Treatment 1 had the lowest concentration and treatment 3 had the highest concentration
Treatment Cu conc. (mg kg-1) Treatment PAH-L conc. (mg kg-1)
Cu1 200 PAH1 15
Cu2 430 PAH2 60
Cu3 1100 PAH3 170
The concentrations were chosen with consideration to the following guideline values:
Treatment 1 (Cu1, PAH1) was based on the Swedish Environmental Protection Agency’s
guideline values for contaminated soil (Naturvårdsverket, 2009). They are values for less
sensitive land use, such as industrial areas, and correspond to a 50 % protection of the
soil organisms. The values for sensitive land use, such as residential areas, correspond to
a protection of 75 % (Naturvårdsverket, 2010), but were excluded since such low
concentrations were expected to have little effect on the soil. Treatments 2 and 3 (Cu2,
PAH2 and Cu3, PAH3) were based on guideline values specified for larger cities. They
correspond to a 25 % and 10 % protection of the soil organisms (SWECO, 2009). The
PAH concentrations correspond to guideline values for PAH-L, since the concentrations
of PAH-L were higher than PAH-M and PAH-H in the PAH spike soil.
Three replicates of uncontaminated samples and each treatment were prepared. A layer
of gravel, 60 cm for the uncontaminated and Cu soils and 40 cm for the PAH soils, was
placed in the bottom of each lysimeter (Figure 3a and b). To avoid spreading of PAH, a
20 cm layer of activated carbon was added to the PAH lysimeters. About 50 kg of soil
was then put in the lysimeters in around 50 cm thick layers. By both weighing the soil
and measuring the soil layer, a soil density similar to natural conditions was achieved.
Geo textile was placed beneath the gravel and between the layers. The soil was sowed
with a seed mix, and to avoid weather conditions preventing growth, the lysimeters were
CU SPIKE SOIL WAS MADE
LYSIMETER EXPERIMENT START, SOIL SAMPLING AT
KRUSENBERG AND NÅNTUNA, COLLECTION OF
PAH SPIKE SOIL
SOIL SAMPLING FROM LYSIMETER PARK
START OF LABORATORY WORK
2015Oct
2015Nov
2015Dec
2016Jan
2016Feb
2016Mar
2016Apr
2016May
2016Jun
2016Jul
2016Aug
2016Sep
2016Oct

7
watered with 1 L of water each per week between the 22nd of June and the 10th of August
2016.
Figure 3 Schematic structure of the lysimeters. (a) The uncontaminated samples and Cu samples had a 60
cm layer of gravel beneath a 50 cm layer of soil. (b) The PAH samples had a layer of gravel of 40 cm in
the bottom, which was followed by a 20 cm layer of activated carbon and a 50 cm layer of soil.
2.2 LABORATORY EXPERIMENT
2.2.1 Sampling and preparation of soil
Sampling from the lysimeter field experiment took place at the end of September 2016.
The soil samples were sieved through a 2 mm sieve. Grass, roots and other remaining
pieces of visible organic material were removed manually. The water content was
adjusted to 45 % of the water holding capacity (Harris et al., 2012; Herrmann et al., 2014).
The samples were incubated for 10-12 days at 25 °C to avoid effects of the preparations
on the microbial community (Herrmann et al., 2014). Due to lack of space in the
isothermal calorimeters, all samples could not be analyzed simultaneously. Therefore, the
samples were stored at 8 °C during the period before incubation.
2.2.2 Microbial activity and functional diversity
2.2.2.1 Carbon substrate solutions
Seven different carbon substrates, α-ketoglutaric acid, citric acid, D-glucose, γ-
aminobutyric acid, L-alanine, N-acetyl glucosamine and α-cyclodextrin, were used in the
experiment (Herrmann et al., 2014). To avoid reduced microbial activity due to substrate
deficiency, the substrate addition should lead to saturation of the microbial metabolism
(Lerch et al., 2013). The work of Lerch et al. (2013) showed that, to saturate the microbial
metabolism, the addition of carbon should correspond to at least 10 % of the SOC content.
Since the soils had similar content of SOC (Table 2), the same substrate solutions were
used for both soils. Nåntuna required a higher addition of carbon to satisfy the microbial
metabolism. So, using the SOC content of Nåntuna, it was calculated that 1.4 mg C g-1
soil, corresponding to 11 and 10 % of the SOC in Krusenberg and Nåntuna respectively,
should be added. The substrates were solved in Milli-Q (ultra-pure) water. The added
weights of the carbon substrates varied since they had different carbon content.

8
2.2.2.2 Reference samples
Reference samples with similar heat capacity as the soil samples, were prepared before
the main experiment start. To calculate the heat capacity of the soil samples, the soils’
proportions of water (heat capacity: 4.18 J g-1 K-1), organic material (heat capacity: 1.30
J g-1 K-1) and mineral (heat capacity: 0.83 J g-1 K-1) were determined. The volume of
Milli-Q water which had similar heat capacity compared to the soil samples was
calculated. Milli-Q water was chosen for the reference samples because it is an inert
medium, i.e. does not release heat during incubation at constant temperature. The
calculated volumes for the Krusenberg and Nåntuna soils were similar. Therefore, an
average value was calculated to 1.78 ml Milli-Q water. The same reference samples could
thus be used during the whole experiment.
2.2.2.3 Substrate-induced respiration and heat production
Heat production and respiration following substrate addition were measured
simultaneously, using a method developed by Herrmann and Bölscher (2015). Soil
weights corresponding to 4 g of dry soil were placed in 20 ml reaction vessels, and 300
µl of the carbon substrate solutions were added dropwise to seven separate vessels. Milli-
Q water was added to the soil in an eighth vessel as a control sample. To get a starting
value, the absorbance of the CO2 traps was measured using a spectrophotometer
(SpectraMax Plus 384, Molecular Devices) at 572 nm after which they were placed in the
vessels. The reaction vessels were then closed and placed in the isothermal calorimeters
(TAM Air, TA Instruments) together with the reference samples. Heat production was
measured continuously throughout the measurement. The duration of all measurements
was initially planned to be 6 h. However, on the first day it was discovered that the
respiration in the Nåntuna samples amended with α-ketoglutaric acid and citric acid was
very high. A duration of 6 h would affect the accuracy of the results. Therefore, the
duration of these measurements was reduced to 3.5 h. At the end of the experiment, the
absorbance of the CO2 traps was measured a second time. All measurements were
performed at 25 °C.
In order to calculate the produced CO2, the absorbance data were fitted to a calibration
curve (y = 5.95x-3.64, R2 = 0.97; Figure A1), with absorbance on the x-axis and equilibrium
CO2 (µg) on the y-axis, which was made during the main experiment. To only account
for the heat and CO2 produced following substrate addition, the production in the Milli-
Q water control samples were subtracted for all samples. The soil samples amended with
α-ketoglutaric acid and citric acid were also corrected for abiotic processes (see below)
to only take biotic processes into account. The basal respiration (see below) was found to
be negligible and was thus not accounted for.
2.2.2.4 Abiotic processes
Herrmann et al. (2014) showed that addition of the carboxylic acids α-ketoglutaric acid
and citric acid to sterile soil lead to significant heat production, indicating that the addition
of these carbon substrates resulted in heat production from abiotic processes. Therefore,
measurements of heat from abiotic processes were made for samples amended with α-
ketoglutaric acid and citric acid. This was also done for samples amended with Milli-Q
water to assess basal respiration. Similar to previous preparations, soil corresponding to
4 g of dry weight was placed in 20 ml glass reaction vessels. The soil samples were
9
sterilized by covering the vessels with aluminum foil and heating them to 120 °C for 20
minutes in an autoclave (3150 EL, Tuttnauer). After two days, the samples were put in
the autoclave again, and the procedure was repeated. The carbon substrates and Milli-Q
water were sterilized through a 0.2 µm filter to containers sterilized with ethanol before
adding them to the soil. The production CO2 and heat was determined as described above
(Herrmann and Bölscher, 2015). The samples amended with Milli-Q water were stored
in an incubator during the measurement due to lack of space in the calorimeters. The
duration of the measurements was 6 h for the Krusenberg samples and 3.5 h for the
Nåntuna samples, and the temperature was 25 °C.
2.3 THE CALORESPIROMETRIC RATIO
To determine if there were any relationships between heat production and respiration at
different Cu and PAH concentrations, the calorespirometric ratio, γ, (mJ µg-1) was
calculated (equation 1).
𝛾 = 𝑄
𝐶𝑂2 (1)
Where Q (mJ g-1 soil) is the produced heat and CO2 (µg g-1 soil) is the respired CO2.
2.4 THE SHANNON INDEX
To evaluate the microbial functional diversity, i.e. how well the microorganisms could
utilize the carbon substrates at different contaminant concentrations, the Shannon Index
was calculated (equation 2). Normalized heat and CO2 data were used. Data were
normalized by dividing the response from the addition of one substrate with the sum of
the responses from all substrates (Table A2, A3, A4, and A5).
𝑆ℎ𝑎𝑛𝑛𝑜𝑛 𝐼𝑛𝑑𝑒𝑥 = − ∑ 𝑝𝑖 ∙ ln 𝑝𝑖𝑠𝑖=1 (2)
Where p is the heat or CO2 response to addition of one substrate as a proportion of the
total response, and s is the number of substrates.
2.5 THE SIMPSON INDEX
To examine the catabolic evenness, i.e. how even the utilization of the substrates was in
the two soils at different contamination levels, the Simpson Index was calculated
(equation 3). For the Simpson Index calculation, normalized heat and CO2 data were used.
𝑆𝑖𝑚𝑝𝑠𝑜𝑛 𝐼𝑛𝑑𝑒𝑥 = 1
∑ 𝑝𝑖2𝑠
𝑖=1
(3)
2.6 STATISTICAL ANALYSIS
All statistical analyses were performed in R version 2.15.1 (R Development Core Team,
2008), using the “Vegan: Community Ecology Package” (Oksanen et al., 2011).
PRIMER6 (Clarke and Gorley, 2005) was used to illustrate multi-variate statistics results.
Effects of Cu and PAH on microbial functional diversity were examined with principal
component analysis (PCA) using normalized heat and CO2 data. Significant functional
diversity differences between soil treatments along ordination axes were analyzed by
posthoc one-way ANOVA, followed by Bartlett’s test and Tukey multiple pair test
comparison on principal component scores. The similarity of the heat and CO2 data sets

10
was determined using the Mantel dissimilarity test based on the Pearson product-moment
correlation coefficient (999 permutations).
3 RESULTS
3.1 SOIL CHARACTERISTICS
Krusenberg was a sand/loamy sand, while Nåntuna was a sandy loam/loam. The pH in
Nåntuna was around 8.4, and was higher than the pH in Krusenberg, which was around
5.5 (Table 2). Cu had no effect on pH, i.e. the protons released when Cu2+ was bound to
the soil were efficiently buffered by the added CaO. The Cu concentration in Krusenberg
and Nåntuna had decreased to 60 and 80 % of the initial concentrations (cf. Tables 1 and
2). The analysis of the PAH concentrations had not been done within the timeline of this
project, and were assumed to be equal to the initial concentrations (Table 1) in the analysis
of the results. The soils had similar content of organic carbon and total nitrogen (Table
2).
Table 2 Soil pH and Cu concentrations in the uncontaminated samples and Cu samples. Content of organic
carbon and total nitrogen in the uncontaminated samples. The values are mean ± standard deviation (n =
3). The soil samples for pH and Cu concentration were sampled in September 2016, and the samples for
organic carbon and total nitrogen were sampled in June 2016
Soil and treatment pH (water) Cu conc. (mg g-1 soil) Org. C (%) Tot. N (%)
Krusenberg soil 5.5 ± 0.03 9 ± 1 1.3 ± 0.03 0.1 ± 0.003
Cu1 5.4 ± 0.03 121 ± 10 - -
Cu2 5.4 ± 0.04 260 ± 15 - -
Cu3 5.6 ± 0.02 652 ± 47 - -
Nåntuna soil 8.4 ± 0.03 7 ± 1 1.4 ± 0.1 0.1 ± 0.01
Cu1 8.4 ± 0.03 163 ± 11 - -
Cu2 8.4 ± 0.04 359 ± 92 - -
Cu3 8.3 ± 0.05 900 ± 25 - -
3.2 OVERALL MICROBIAL ACTIVITY
3.2.1 Effects on heat production
Cu had an apparent impact on heat production in both soils (Figure 4a and c, Table 3).
The heat production decreased the most between the uncontaminated samples and the
Cu1 samples, which had Cu concentrations around 150 mg kg-1. Comparing the
uncontaminated samples to the Cu3 samples, there was a decrease from about 200 to 90
mJ g-1 soil h-1 in the Krusenberg soil and 1,000 to 300 mJ g-1 soil h-1 in Nåntuna soil.
The data were fitted to logarithmic curves (R2 = 0.95 for Krusenberg and 0.98 for
Nåntuna).
The impact of PAH on heat production varied between the soils (Figure 4b and d, Table
3). The heat production increased from approximately 200 mJ g-1 soil h-1 in the
uncontaminated samples to 300 mJ g-1 soil h-1 in the PAH3 samples in the Krusenberg
soil, while there was a decrease in Nåntuna soil from around 1,000 mJ g-1 soil h-1 to 800
mJ g-1 soil h-1. However, both soils followed linear dose-response (R2 = 0.82 for
Krusenberg and 0.68 for Nåntuna).

11
Figure 4 Effect on substrate-induced heat production of (a) Cu in Krusenberg soil (b) PAH in Krusenberg
soil (c) Cu in Nåntuna soil (d) PAH in Nåntuna soil. The values represent mean values, vertical and
horizontal error bars represent standard deviation (n = 3).
The addition of Cu lead to a greater heat production decrease in the Nåntuna samples than
in Krusenberg (Table 3). At Cu3, the heat production in Krusenberg and Nåntuna were
41 and 32 % of the heat production in the uncontaminated samples. PAH1 lead to an
increased heat production of approximately 20 % in both soils. At the highest
concentration, however, the heat production in the Krusenberg samples had increased
with around 60 %, while it had decreased to 74 % of the uncontaminated samples in
Nåntuna.
Table 3 Percentage of the heat production in contaminated samples compared to uncontaminated samples.
The values for Cu concentration represent mean ± standard deviation (n = 3)
Krusenberg Nåntuna
Treatment
Conc.
(mg kg-1)
Heat (% of
uncont.) Treatment
Conc.
(mg kg-1)
Heat (% of
uncont.)
Cu1 121 ± 10 77 Cu1 163 ± 11 55
Cu2 260 ± 15 60 Cu2 359 ± 92 36
Cu3 652 ± 47 41 Cu3 900 ± 25 32
PAH1 15 122 PAH1 15 121
PAH2 60 111 PAH2 60 88
PAH3 170 159 PAH3 170 74
3.2.2 Effects on respiration
Cu had a decreasing effect on respiration in Krusenberg soil (Figure 5a, Table 4), which
was similar to the heat production responses to Cu in both soils (Figure 4a and c). The
respiration decreased from around 20 to 2 µg g-1 soil h-1 comparing the uncontaminated
samples to Cu3. The respiration decreased logarithmically with increased Cu (R2 = 0.98).
y = -26ln(x) + 262R² = 0.95
0
100
200
300
400
0 200 400 600 800 1000
mJ
g-1so
il h
-1
mg Cu kg-1 soil
(a) Krusenberg: Cu ∑Heat
y = -150ln(x) + 1309R² = 0.98
0
500
1000
1500
0 200 400 600 800 1000
mJ
g-1so
il h
-1
mg Cu kg-1 soil
(c) Nåntuna: Cu ∑Heat
y = 0.6x + 207R² = 0.82
0
100
200
300
400
0 50 100 150 200
mJ
g-1so
il h
-1
mg PAH kg-1 soil
(b) Krusenberg: PAH ∑Heat
y = -2.2x + 1110R² = 0.68
0
500
1000
1500
0 50 100 150 200m
J g-1
soil
h-1
mg PAH kg-1 soil
(d) Nåntuna: PAH ∑Heat
12
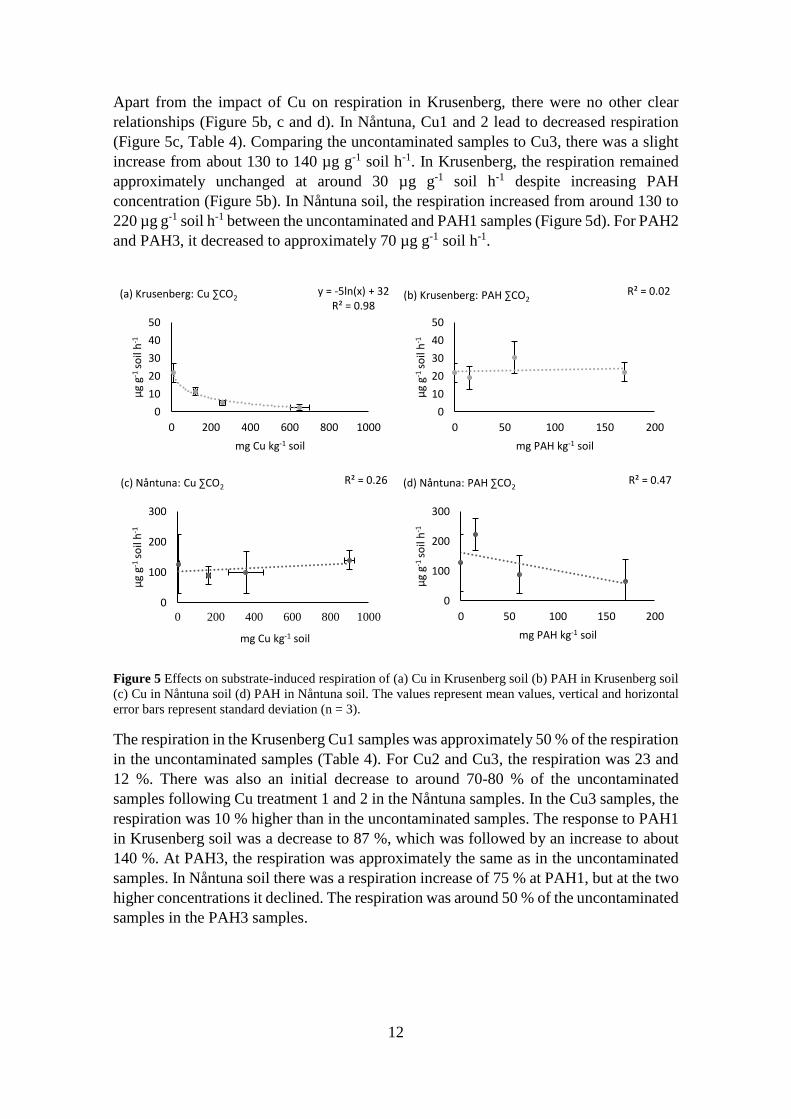
Apart from the impact of Cu on respiration in Krusenberg, there were no other clear
relationships (Figure 5b, c and d). In Nåntuna, Cu1 and 2 lead to decreased respiration
(Figure 5c, Table 4). Comparing the uncontaminated samples to Cu3, there was a slight
increase from about 130 to 140 µg g-1 soil h-1. In Krusenberg, the respiration remained
approximately unchanged at around 30 µg g-1 soil h-1 despite increasing PAH
concentration (Figure 5b). In Nåntuna soil, the respiration increased from around 130 to
220 µg g-1 soil h-1 between the uncontaminated and PAH1 samples (Figure 5d). For PAH2
and PAH3, it decreased to approximately 70 µg g-1 soil h-1.
Figure 5 Effects on substrate-induced respiration of (a) Cu in Krusenberg soil (b) PAH in Krusenberg soil
(c) Cu in Nåntuna soil (d) PAH in Nåntuna soil. The values represent mean values, vertical and horizontal
error bars represent standard deviation (n = 3).
The respiration in the Krusenberg Cu1 samples was approximately 50 % of the respiration
in the uncontaminated samples (Table 4). For Cu2 and Cu3, the respiration was 23 and
12 %. There was also an initial decrease to around 70-80 % of the uncontaminated
samples following Cu treatment 1 and 2 in the Nåntuna samples. In the Cu3 samples, the
respiration was 10 % higher than in the uncontaminated samples. The response to PAH1
in Krusenberg soil was a decrease to 87 %, which was followed by an increase to about
140 %. At PAH3, the respiration was approximately the same as in the uncontaminated
samples. In Nåntuna soil there was a respiration increase of 75 % at PAH1, but at the two
higher concentrations it declined. The respiration was around 50 % of the uncontaminated
samples in the PAH3 samples.
y = -5ln(x) + 32R² = 0.98
0
10
20
30
40
50
0 200 400 600 800 1000
µg
g-1 s
oil
h-1
mg Cu kg-1 soil
(a) Krusenberg: Cu ∑CO2
R² = 0.26
0
100
200
300
0 200 400 600 800 1000
µg
g-1 s
oil
h-1
mg Cu kg-1 soil
(c) Nåntuna: Cu ∑CO2
R² = 0.02
0
10
20
30
40
50
0 50 100 150 200µ
g g-1
so
il h
-1
mg PAH kg-1 soil
(b) Krusenberg: PAH ∑CO2
R² = 0.47
0
100
200
300
0 50 100 150 200
µg
g-1 s
oil
h-1
mg PAH kg-1 soil
(d) Nåntuna: PAH ∑CO2

13
Table 4 Percentage of the respiration in contaminated samples compared to uncontaminated samples. The
values for Cu concentration represent mean ± standard deviation (n = 3)
Krusenberg Nåntuna
Treatment
Conc.
(mg kg-1)
CO2 (% of
uncont.) Treatment
Conc.
(mg kg-1)
CO2 (% of
uncont.)
Cu1 121 ± 10 53 Cu1 163 ± 11 71
Cu2 260 ± 15 23 Cu2 359 ± 92 78
Cu3 652 ± 47 12 Cu3 900 ± 25 110
PAH1 15 87 PAH1 15 175
PAH2 60 139 PAH2 60 68
PAH3 170 102 PAH3 170 52
3.2.3 The calorespirometric ratio
The calorespirometric ratio decreased linearly (y = -0.009x + 9.6, R2 = 0.82) with
increasing Cu concentration in the Nåntuna soil samples (Figure 6a). There was no linear
relationship between the calorespirometric ratio and Cu in Krusenberg soil. However, the
ratio increased with increasing Cu concentration. There were no clear relationships
between the calorespirometric ratio and PAH concentration (Figure 6b).
Figure 6 The calorespirometric ratio, γ, for (a) the uncontaminated samples and Cu treatments in
Krusenberg (Kr) and Nåntuna (Nå) soil, and (b) the uncontaminated samples and PAH treatments in
Krusenberg and Nåntuna soil. The values are mean values and the error bars are standard deviation (n = 3).
3.3 MICROBIAL FUNCTIONAL DIVERSITY
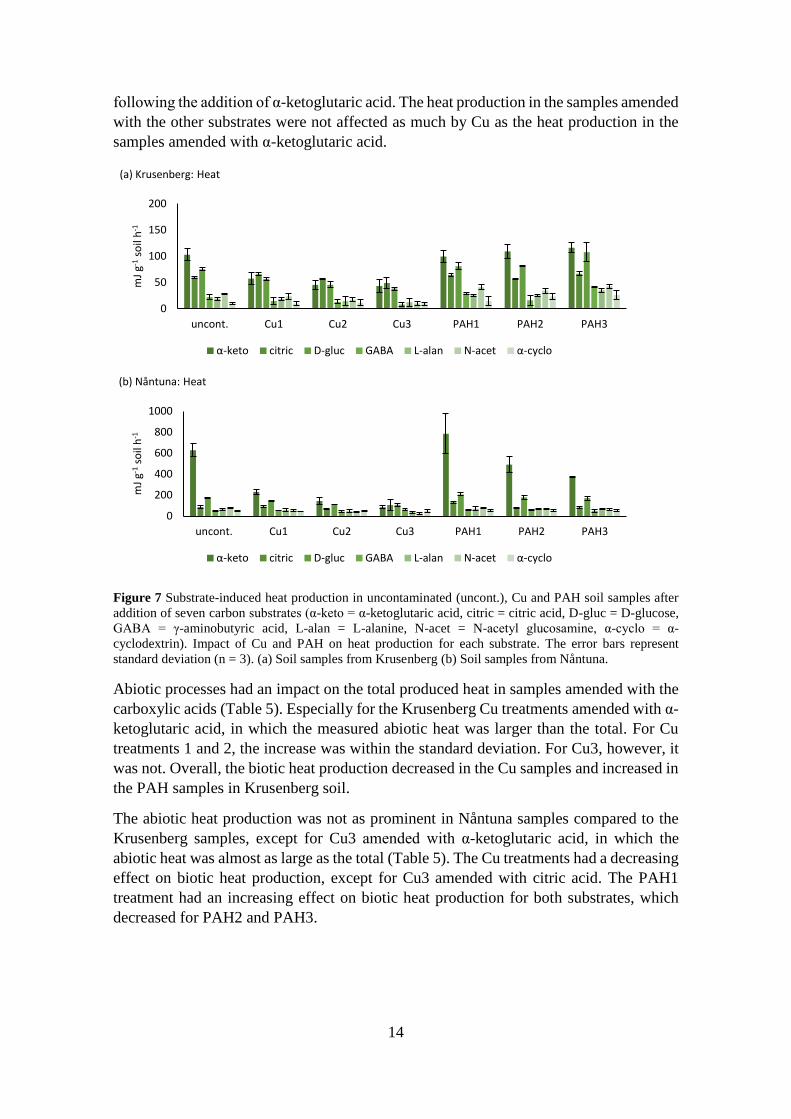
3.3.1 Heat production
The substrate-induced heat production in the Nåntuna soil was generally higher than in
the Krusenberg soil (Figure 7a and b). PAH appeared to have a more complex effect on
heat production than Cu in both soils. The substrates which generated the highest
accumulated heat among the Krusenberg soil samples were α-ketoglutaric acid, citric acid
and D-glucose (Figure 7a). The heat production appeared to decrease with increasing Cu
concentration for all substrates. PAH appeared to either have no effect or an increasing
effect on heat production.
The samples amended with α-ketoglutaric acid had the highest heat production in the
uncontaminated samples and PAH samples in the Nåntuna soil (Figure 7b). The produced
heat following the addition of α-ketoglutaric acid increased at PAH1, but decreased at
PAH2 and PAH3. Cu appeared to have a decreasing effect on the heat production
0
10
20
30
40
0 250 500 750 1000
γ(m
J µ
g-1)
mg Cu kg-1 soil
(a) Cu
K…
R² = 0.45
R² = 0.82
0
10
20
30
40
0 50 100 150 200
γ(m
J µ
g-1)
mg PAH kg-1 soil
(b) PAH
Kr
Nå
R² = 0.21
R² = 0.17
14
following the addition of α-ketoglutaric acid. The heat production in the samples amended
with the other substrates were not affected as much by Cu as the heat production in the
samples amended with α-ketoglutaric acid.
Figure 7 Substrate-induced heat production in uncontaminated (uncont.), Cu and PAH soil samples after
addition of seven carbon substrates (α-keto = α-ketoglutaric acid, citric = citric acid, D-gluc = D-glucose,
GABA = γ-aminobutyric acid, L-alan = L-alanine, N-acet = N-acetyl glucosamine, α-cyclo = α-
cyclodextrin). Impact of Cu and PAH on heat production for each substrate. The error bars represent
standard deviation (n = 3). (a) Soil samples from Krusenberg (b) Soil samples from Nåntuna.
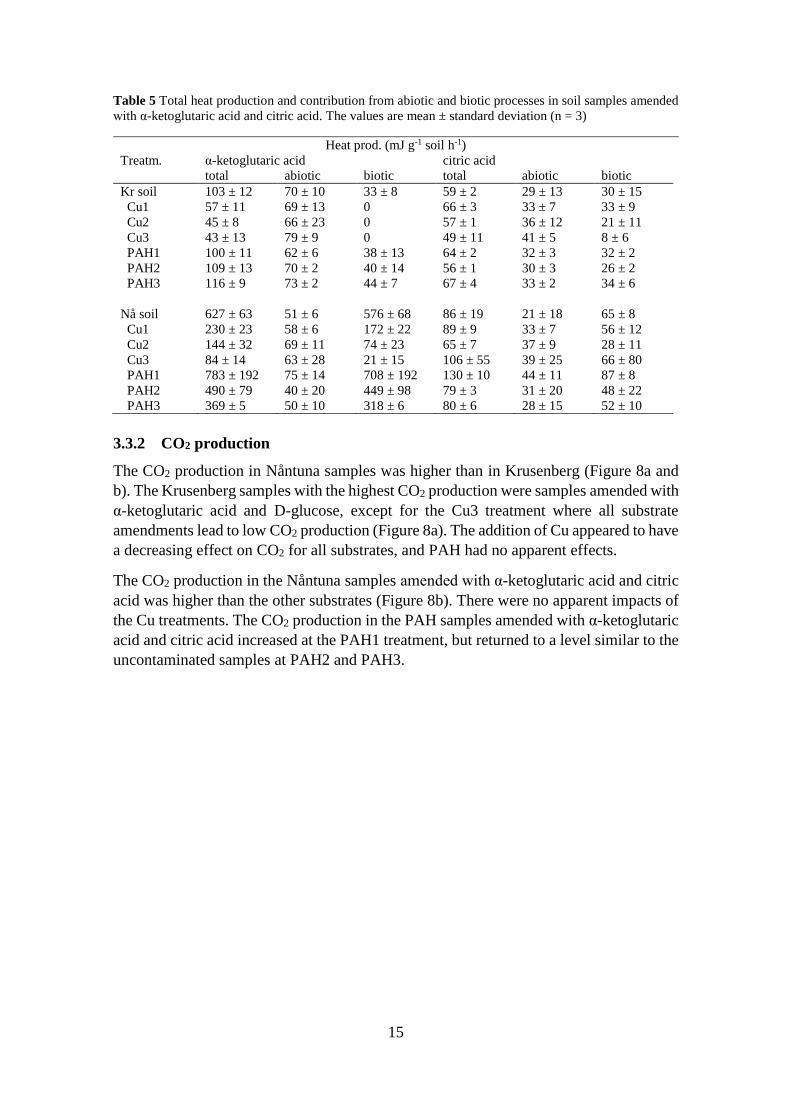
Abiotic processes had an impact on the total produced heat in samples amended with the
carboxylic acids (Table 5). Especially for the Krusenberg Cu treatments amended with α-
ketoglutaric acid, in which the measured abiotic heat was larger than the total. For Cu
treatments 1 and 2, the increase was within the standard deviation. For Cu3, however, it
was not. Overall, the biotic heat production decreased in the Cu samples and increased in
the PAH samples in Krusenberg soil.
The abiotic heat production was not as prominent in Nåntuna samples compared to the
Krusenberg samples, except for Cu3 amended with α-ketoglutaric acid, in which the
abiotic heat was almost as large as the total (Table 5). The Cu treatments had a decreasing
effect on biotic heat production, except for Cu3 amended with citric acid. The PAH1
treatment had an increasing effect on biotic heat production for both substrates, which
decreased for PAH2 and PAH3.
0
50
100
150
200
uncont. Cu1 Cu2 Cu3 PAH1 PAH2 PAH3
mJ
g-1so
il h
-1
(a) Krusenberg: Heat
α-keto citric D-gluc GABA L-alan N-acet α-cyclo
0
200
400
600
800
1000
uncont. Cu1 Cu2 Cu3 PAH1 PAH2 PAH3
mJ
g-1so
il h
-1
(b) Nåntuna: Heat
α-keto citric D-gluc GABA L-alan N-acet α-cyclo
15
Table 5 Total heat production and contribution from abiotic and biotic processes in soil samples amended
with α-ketoglutaric acid and citric acid. The values are mean ± standard deviation (n = 3)
Heat prod. (mJ g-1 soil h-1)
Treatm. α-ketoglutaric acid citric acid
total abiotic biotic total abiotic biotic
Kr soil 103 ± 12 70 ± 10 33 ± 8 59 ± 2 29 ± 13 30 ± 15
Cu1 57 ± 11 69 ± 13 0 66 ± 3 33 ± 7 33 ± 9
Cu2 45 ± 8 66 ± 23 0 57 ± 1 36 ± 12 21 ± 11
Cu3 43 ± 13 79 ± 9 0 49 ± 11 41 ± 5 8 ± 6
PAH1 100 ± 11 62 ± 6 38 ± 13 64 ± 2 32 ± 3 32 ± 2
PAH2 109 ± 13 70 ± 2 40 ± 14 56 ± 1 30 ± 3 26 ± 2
PAH3 116 ± 9 73 ± 2 44 ± 7 67 ± 4 33 ± 2 34 ± 6
Nå soil 627 ± 63 51 ± 6 576 ± 68 86 ± 19 21 ± 18 65 ± 8
Cu1 230 ± 23 58 ± 6 172 ± 22 89 ± 9 33 ± 7 56 ± 12
Cu2 144 ± 32 69 ± 11 74 ± 23 65 ± 7 37 ± 9 28 ± 11
Cu3 84 ± 14 63 ± 28 21 ± 15 106 ± 55 39 ± 25 66 ± 80
PAH1 783 ± 192 75 ± 14 708 ± 192 130 ± 10 44 ± 11 87 ± 8
PAH2 490 ± 79 40 ± 20 449 ± 98 79 ± 3 31 ± 20 48 ± 22
PAH3 369 ± 5 50 ± 10 318 ± 6 80 ± 6 28 ± 15 52 ± 10
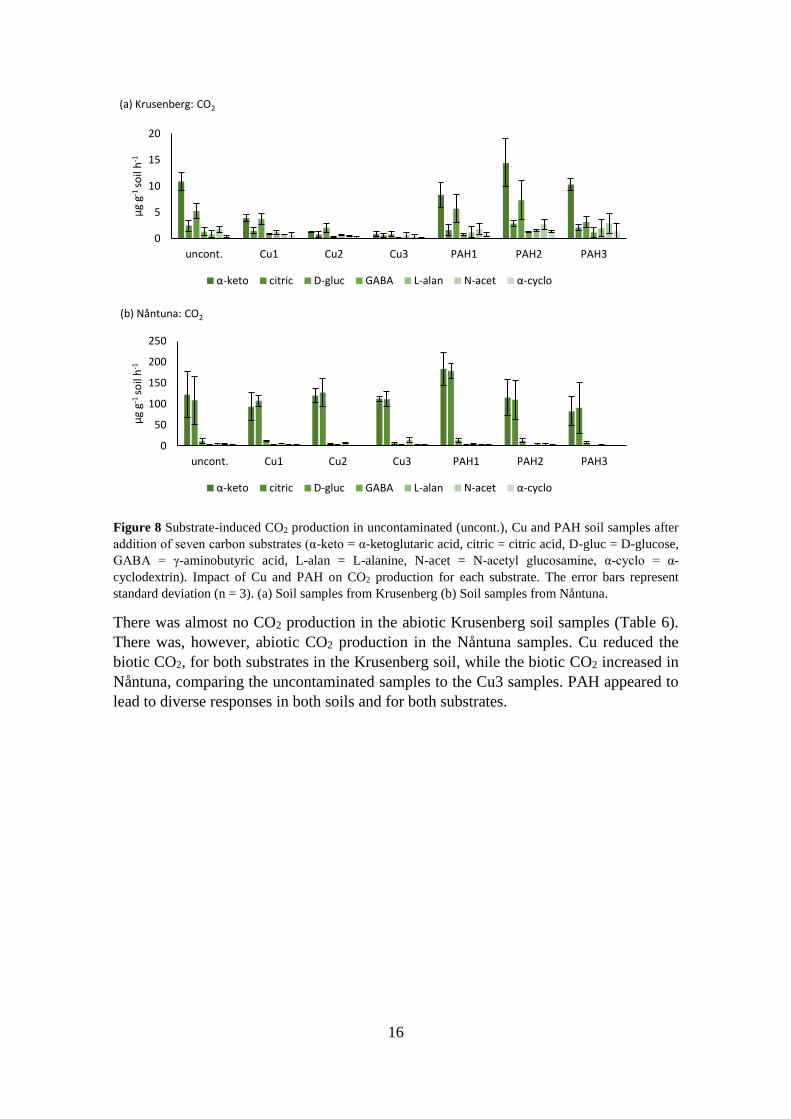
3.3.2 CO2 production
The CO2 production in Nåntuna samples was higher than in Krusenberg (Figure 8a and
b). The Krusenberg samples with the highest CO2 production were samples amended with
α-ketoglutaric acid and D-glucose, except for the Cu3 treatment where all substrate
amendments lead to low CO2 production (Figure 8a). The addition of Cu appeared to have
a decreasing effect on CO2 for all substrates, and PAH had no apparent effects.
The CO2 production in the Nåntuna samples amended with α-ketoglutaric acid and citric
acid was higher than the other substrates (Figure 8b). There were no apparent impacts of
the Cu treatments. The CO2 production in the PAH samples amended with α-ketoglutaric
acid and citric acid increased at the PAH1 treatment, but returned to a level similar to the
uncontaminated samples at PAH2 and PAH3.
16
Figure 8 Substrate-induced CO2 production in uncontaminated (uncont.), Cu and PAH soil samples after
addition of seven carbon substrates (α-keto = α-ketoglutaric acid, citric = citric acid, D-gluc = D-glucose,
GABA = γ-aminobutyric acid, L-alan = L-alanine, N-acet = N-acetyl glucosamine, α-cyclo = α-
cyclodextrin). Impact of Cu and PAH on CO2 production for each substrate. The error bars represent
standard deviation (n = 3). (a) Soil samples from Krusenberg (b) Soil samples from Nåntuna.
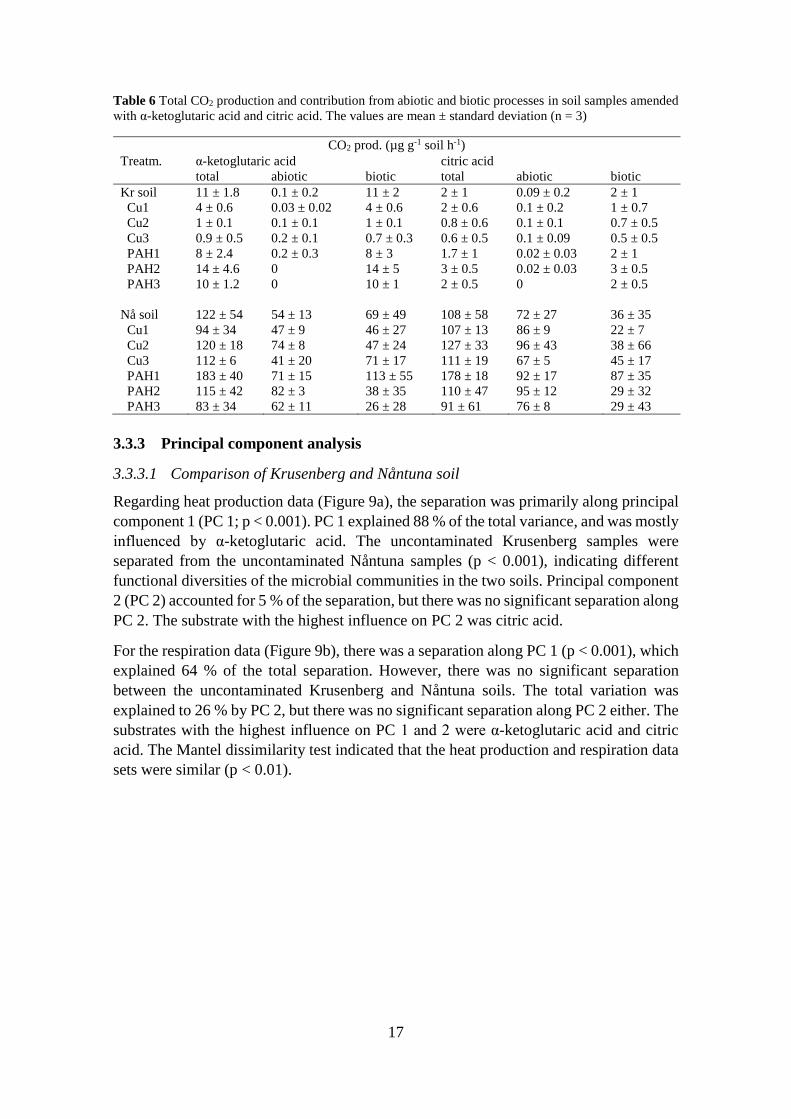
There was almost no CO2 production in the abiotic Krusenberg soil samples (Table 6).
There was, however, abiotic CO2 production in the Nåntuna samples. Cu reduced the
biotic CO2, for both substrates in the Krusenberg soil, while the biotic CO2 increased in
Nåntuna, comparing the uncontaminated samples to the Cu3 samples. PAH appeared to
lead to diverse responses in both soils and for both substrates.
0
5
10
15
20
uncont. Cu1 Cu2 Cu3 PAH1 PAH2 PAH3
µg
g-1 s
oil
h-1
(a) Krusenberg: CO2
α-keto citric D-gluc GABA L-alan N-acet α-cyclo
0
50
100
150
200
250
uncont. Cu1 Cu2 Cu3 PAH1 PAH2 PAH3
µg
g-1 s
oil
h-1
(b) Nåntuna: CO2
α-keto citric D-gluc GABA L-alan N-acet α-cyclo
17
Table 6 Total CO2 production and contribution from abiotic and biotic processes in soil samples amended
with α-ketoglutaric acid and citric acid. The values are mean ± standard deviation (n = 3)
CO2 prod. (µg g-1 soil h-1)
Treatm. α-ketoglutaric acid citric acid
total abiotic biotic total abiotic biotic
Kr soil 11 ± 1.8 0.1 ± 0.2 11 ± 2 2 ± 1 0.09 ± 0.2 2 ± 1
Cu1 4 ± 0.6 0.03 ± 0.02 4 ± 0.6 2 ± 0.6 0.1 ± 0.2 1 ± 0.7
Cu2 1 ± 0.1 0.1 ± 0.1 1 ± 0.1 0.8 ± 0.6 0.1 ± 0.1 0.7 ± 0.5
Cu3 0.9 ± 0.5 0.2 ± 0.1 0.7 ± 0.3 0.6 ± 0.5 0.1 ± 0.09 0.5 ± 0.5
PAH1 8 ± 2.4 0.2 ± 0.3 8 ± 3 1.7 ± 1 0.02 ± 0.03 2 ± 1
PAH2 14 ± 4.6 0 14 ± 5 3 ± 0.5 0.02 ± 0.03 3 ± 0.5
PAH3 10 ± 1.2 0 10 ± 1 2 ± 0.5 0 2 ± 0.5
Nå soil 122 ± 54 54 ± 13 69 ± 49 108 ± 58 72 ± 27 36 ± 35
Cu1 94 ± 34 47 ± 9 46 ± 27 107 ± 13 86 ± 9 22 ± 7
Cu2 120 ± 18 74 ± 8 47 ± 24 127 ± 33 96 ± 43 38 ± 66
Cu3 112 ± 6 41 ± 20 71 ± 17 111 ± 19 67 ± 5 45 ± 17
PAH1 183 ± 40 71 ± 15 113 ± 55 178 ± 18 92 ± 17 87 ± 35
PAH2 115 ± 42 82 ± 3 38 ± 35 110 ± 47 95 ± 12 29 ± 32
PAH3 83 ± 34 62 ± 11 26 ± 28 91 ± 61 76 ± 8 29 ± 43
3.3.3 Principal component analysis
3.3.3.1 Comparison of Krusenberg and Nåntuna soil
Regarding heat production data (Figure 9a), the separation was primarily along principal
component 1 (PC 1; p < 0.001). PC 1 explained 88 % of the total variance, and was mostly
influenced by α-ketoglutaric acid. The uncontaminated Krusenberg samples were
separated from the uncontaminated Nåntuna samples (p < 0.001), indicating different
functional diversities of the microbial communities in the two soils. Principal component
2 (PC 2) accounted for 5 % of the separation, but there was no significant separation along
PC 2. The substrate with the highest influence on PC 2 was citric acid.
For the respiration data (Figure 9b), there was a separation along PC 1 (p < 0.001), which
explained 64 % of the total separation. However, there was no significant separation
between the uncontaminated Krusenberg and Nåntuna soils. The total variation was
explained to 26 % by PC 2, but there was no significant separation along PC 2 either. The
substrates with the highest influence on PC 1 and 2 were α-ketoglutaric acid and citric
acid. The Mantel dissimilarity test indicated that the heat production and respiration data
sets were similar (p < 0.01).

18
Figure 9 Microbial functional diversity, Cu and PAH treatments included, in Krusenberg and Nåntuna soil
samples (a) using heat data (b) using respiration data.
3.3.3.2 Impact of Cu and PAH in Krusenberg soil
Analyzing heat data, there was a separation along PC 1 (p < 0.001), which explained 46
% of the separation (Figure 10a). The substrates with the biggest influence on PC 1 were
α-ketoglutaric acid and D-glucose. There was no significant separation between the
uncontaminated samples and the lowest or middle Cu concentration. However, there was
a separation (p < 0.05) comparing the uncontaminated samples to the Cu3 samples,
indicating a significant impact on microbial functional diversity. There was also a
separation along PC 2 (p < 0.01). The separation along PC 2, which was mostly impacted
by citric acid, accounted for 29 % of the variation. There was significant separation
between the Cu1 and Cu3 treatment (p < 0.01) and the Cu2 and Cu3 treatment (p < 0.05).
There were no significant separations between the uncontaminated samples and any of
the PAH samples.
The separation of the CO2 data along PC 1 explained 69 % of the total separation (p <
0.001; Figure 10b). There was a significant separation between the uncontaminated
samples and the Cu2 samples (p < 0.01), as well as the uncontaminated samples and the
Cu3 samples (p < 0.001). There was also significant separation between Cu treatment 1
and 3 (p < 0.05). There were no significant separations between the uncontaminated
samples and the PAH samples. PC 2 explained 19 % of the separation, but there was no
significant separation along PC 2. PC 2 was mostly impacted by D-glucose. Comparing
the heat and CO2 data sets, the Mantel test showed similarity (p < 0.01).
(a)
-0,4 -0,2 0 0,2 0,4 0,6
PC1
-0,2
0
0,2
PC
2
TreatmentKr ref
Kr Cu1
Kr Cu2
Kr Cu3
Kr PAH1
Kr PAH2
Kr PAH3
Nå ref
Nå Cu1
Nå Cu2
Nå Cu3
Nå PAH1
Nå PAH2
Nå PAH3
keto
citric
D-gluc
GABA
L-alanN-acetcyclo
PC 2 5 %
PC 1 88 %
(b)
-0,6 -0,4 -0,2 0 0,2 0,4
PC1
-0,4
-0,2
0
0,2
0,4
0,6
PC
2
TreatmentKr ref
Kr Cu1
Kr Cu2
Kr Cu3
Kr PAH1
Kr PAH2
Kr PAH3
Nå ref
Nå Cu1
Nå Cu2
Nå Cu3
Nå PAH1
Nå PAH2
Nå PAH3keto
citric
D-glucGABAL-alan
N-acetcyclo
PC 2 26 %
PC 1 64 %

19
Figure 10 Effects of Cu and PAH on microbial functional diversity in Krusenberg soil samples (a) using
heat production data (b) using respiration data.
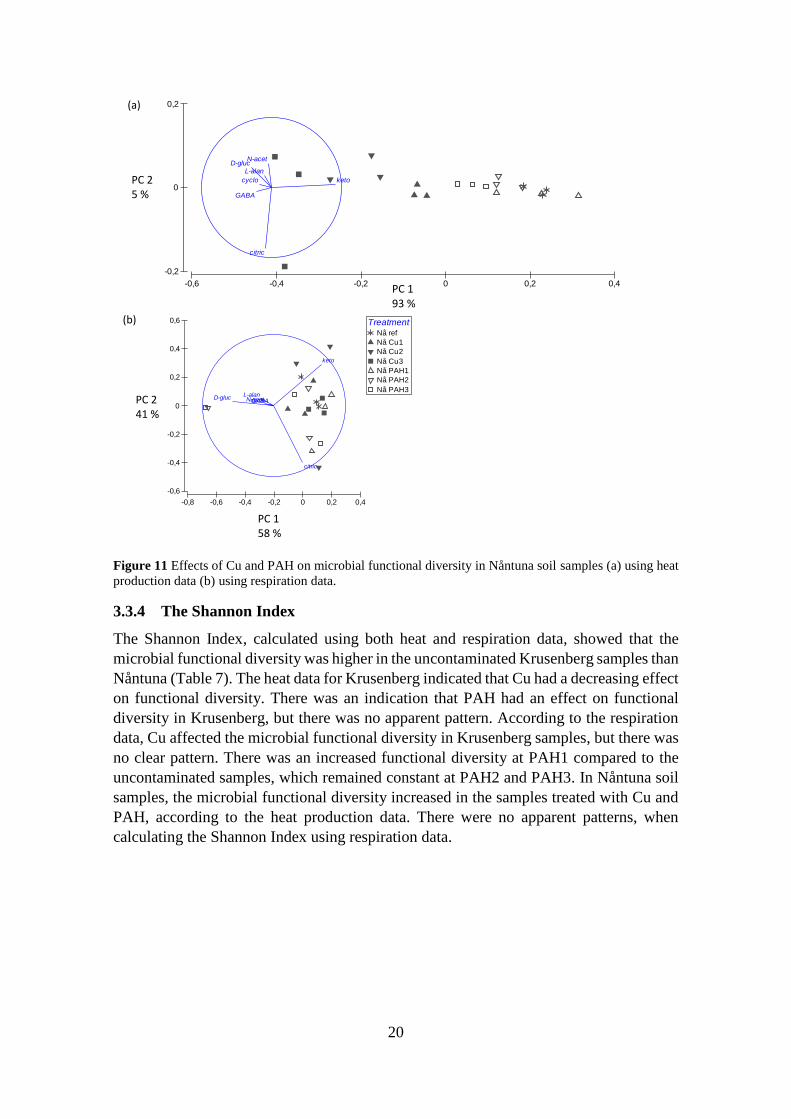
3.3.3.3 Impact of Cu and PAH in Nåntuna soil
There was a separation, primarily along PC 1 (p < 0.001), accounting for 93 % of the total
variation of the heat production data (Figure 11a). The substrate with the most impact on
PC 1 was α-ketoglutaric acid. There was separation between the uncontaminated samples
and all Cu treatments (p < 0.001). The Cu1 treatment was separated from the Cu3
treatment (p < 0.001), and the Cu2 treatment was separated from Cu3 (p < 0.05).
Additionally, the uncontaminated and PAH1 samples were significantly separated from
the PAH3 samples (p < 0.05). PC 2 explained only 5 % of the total separation with no
significant separations along PC 2.
For the CO2 data (Figure 11b), PC 1 and PC 2 explained 58 and 41 % of the total variance.
However, there were no significant separations between the uncontaminated samples and
the Cu and PAH samples. The substrates with the biggest impact on PC 1 were α-
ketoglutaric acid and D-glucose and the substrates which had the biggest influence on PC
2 were α-ketoglutaric acid and citric acid. The outcome of the Mantel test was not
significant, indicating that the data sets for heat production and respiration were not
similar.
-0,4 -0,2 0 0,2 0,4 0,6
PC1
-0,4
-0,2
0
0,2
0,4
PC
2
TreatmentKr ref
Kr Cu1
Kr Cu2
Kr Cu3
Kr PAH1
Kr PAH2
Kr PAH3
keto
citric
D-gluc
GABA
L-alan
N-acet
cyclo
PC 1 69 %
PC 2
19 %
-0,15 -0,10 -0,05 0 0,05 0,10 0,15
PC1
-0,15
-0,10
-0,05
0
0,05
0,10
0,15
PC
2
TreatmentKr ref
Kr Cu1
Kr Cu2
Kr Cu3
Kr PAH1
Kr PAH2
Kr PAH3
keto
citric
D-gluc
GABA
L-alan
N-acet
cyclo
PC 2 29 %
PC 1 46 %
(a)
(b)
20
Figure 11 Effects of Cu and PAH on microbial functional diversity in Nåntuna soil samples (a) using heat
production data (b) using respiration data.
3.3.4 The Shannon Index
The Shannon Index, calculated using both heat and respiration data, showed that the
microbial functional diversity was higher in the uncontaminated Krusenberg samples than
Nåntuna (Table 7). The heat data for Krusenberg indicated that Cu had a decreasing effect
on functional diversity. There was an indication that PAH had an effect on functional
diversity in Krusenberg, but there was no apparent pattern. According to the respiration
data, Cu affected the microbial functional diversity in Krusenberg samples, but there was
no clear pattern. There was an increased functional diversity at PAH1 compared to the
uncontaminated samples, which remained constant at PAH2 and PAH3. In Nåntuna soil
samples, the microbial functional diversity increased in the samples treated with Cu and
PAH, according to the heat production data. There were no apparent patterns, when
calculating the Shannon Index using respiration data.
-0,8 -0,6 -0,4 -0,2 0 0,2 0,4
PC1
-0,6
-0,4
-0,2
0
0,2
0,4
0,6
PC
2
TreatmentNå ref
Nå Cu1
Nå Cu2
Nå Cu3
Nå PAH1
Nå PAH2
Nå PAH3
keto
citric
D-glucGABA
L-alanN-acetcyclo
(b)
PC 2 41 %
PC 1 58 %
-0,6 -0,4 -0,2 0 0,2 0,4
PC1
-0,2
0
0,2
PC
2
TreatmentNå ref
Nå Cu1
Nå Cu2
Nå Cu3
Nå PAH1
Nå PAH2
Nå PAH3keto
citric
D-gluc
GABA
L-alan
N-acet
cyclo
(a)
PC 2 5 %
PC 1 93 %

21
Table 7 The Shannon Index in uncontaminated soil samples and at different Cu and PAH concentrations
using heat production and respiration data. The values are mean ± standard deviation (n = 3). (*Cu
concentration (mean ± standard deviation, n = 3); PAH concentration)
Treatment Conc. (mg kg-1 soil) Shannon Index (heat data) Shannon Index (resp. data)
Krusenberg soil *9 ± 1; 0 1.7 ± 0.03 1.4 ± 0.09
Cu1 121 ± 10 1.6 ± 0.1 1.7 ± 0.1
Cu2 260 ± 15 1.6 ± 0.03 1.6 ± 0.23
Cu3 652 ± 47 1.5 ± 0.09 1.3 ± 0.56
PAH1 15 1.8 ± 0.07 1.5 ± 0.04
PAH2 60 1.7 ± 0.04 1.5 ± 0.11
PAH3 170 1.8 ± 0.03 1.5 ± 0.32
Nåntuna soil *7 ± 1; 0 1.4 ± 0.05 1.3 ± 0.09
Cu1 163 ± 11 1.8 ± 0.02 1.4 ± 0.15
Cu2 359 ± 92 1.8 ± 0.02 1.0 ± 0.26
Cu3 900 ± 25 1.6 ± 0.1 1.2 ± 0.12
PAH1 15 1.4 ± 0.18 1.1 ± 0.11
PAH2 60 1.5 ± 0.05 1.3 ± 0.06
PAH3 170 1.6 ± 0.04 1.3 ± 0.18
3.3.5 The Simpson Index
The Simpson Index showed that the Krusenberg microbial community had a more even
substrate utilization than Nåntuna (Table 8). This was apparent using both heat and
respiration data. The Simpson Index calculated with Krusenberg heat data declined with
increasing Cu, pointing to less even utilization of the substrates. The respiration data
showed increased evenness at Cu1 and Cu2, which decreased at Cu3 to a similar evenness
as the uncontaminated samples. Both heat and respiration data indicated increased
evenness with increasing PAH concentration for Krusenberg. Cu had an increasing effect
on evenness according to the Simpson Index, calculated with Nåntuna heat production
data. This was not as apparent when analyzing CO2 data. There was an increase at the
Cu1, which then decreased. At Cu3, the evenness was similar to the uncontaminated
samples. The PAH treatments resulted in increased evenness using both heat and
respiration data. However, the evenness was higher using heat production data.
Table 8 Simpson Index in uncontaminated soil samples and at different Cu and PAH concentrations using
heat production and respiration data. The values are mean ± standard deviation (n = 3). (*Cu concentration
(mean ± standard deviation, n = 3); PAH concentration)
Treatment Conc. (mg kg-1 soil) Simpson Index (heat data) Simpson Index (resp. data)
Krusenberg soil *9 ± 1; 0 4.6 ± 0.2 3.3 ± 0.5
Cu1 121 ± 10 4.3 ± 0.7 4.4 ± 0.6
Cu2 260 ± 15 4.3 ± 0.3 4.2 ± 1.5
Cu3 652 ± 47 3.4 ± 0.5 3.5 ± 1.6
PAH1 15 5.1 ± 0.7 3.7 ± 0.2
PAH2 60 4.7 ± 0.3 3.6 ± 0.4
PAH3 170 5.2 ± 0.3 3.8 ± 1.5
Nåntuna soil *7 ± 1; 0 2.9 ± 0.2 2.7 ± 0.1
Cu1 163 ± 11 5.2 ± 0.2 3.3 ± 0.8
Cu2 359 ± 92 5.4 ± 0.3 2.0 ± 0.6
Cu3 900 ± 25 4.5 ± 0.5 2.7 ± 0.4
PAH1 15 2.9 ± 0.7 2.3 ± 0.2
PAH2 60 3.4 ± 0.3 2.9 ± 0.2
PAH3 170 4.1 ± 0.3 2.8 ± 0.4

22
4 DISCUSSION
4.1 OVERALL MICROBIAL ACTIVITY
4.1.1 Effects of Cu
According to the heat data, Cu had a decreasing effect on microbial activity in both soils.
This was not surprising due to the well-known toxicity of Cu to microorganisms (Wang
et al., 2007, 2010; Li et al., 2015). There were large initial decreases, indicating effects
of Cu on microbial activity at relatively low concentrations, even lower than the guideline
value for less sensitive land use (Naturvårdsverket, 2009). Although the heat decrease
followed a similar pattern in both soils, the percental decrease compared to
uncontaminated samples was greater in Nåntuna. The reason for this could be the higher
fractions of available Cu, i.e. higher Cu concentrations, in the Nåntuna soil, which were
probably due to more leaching in the Krusenberg spike soil. A possible reason for the
higher losses due to leaching could be the diverse properties of the soils. Physical and
chemical properties, primarily pH and SOM, affect the proportion of adsorbed Cu
(Berggren Kleja et al., 2006). In a soil with lower pH, such as Krusenberg, a larger
proportion of Cu is leached. Variation due to pH differences could have been avoided by
adjusting the pH in the soils, as was done by Griffiths et al. (2008). However, for the sake
of the objective of this project, comparing two soils with different properties provides
more useful information. In addition, soil texture may have had an influence on the
results. The Krusenberg soil was a sand/loamy sand which probably supported the
leaching of Cu.
There was an apparent relationship between Cu concentration and respiration for
Krusenberg soil samples, which followed the same pattern as for the heat data of both
soils. Similar to the Krusenberg heat data, the initial decrease was the most prominent.
As was mentioned above, this indicates effects on microbial activity at a concentration
corresponding to less sensitive land use, maybe even sensitive land use. There was no
relationship between Cu concentration and respiration in the Nåntuna samples. There was
high variation between the replicates, which probably had a large impact on the results,
and the results should be interpreted with this in mind.
4.1.2 Effects of PAH
The responses to PAH were complex, as expected (CCME, 2008). There is not as much
knowledge of the impacts of PAH on soil microorganisms as Cu, and further investigation
is needed in this area. Exposure to PAH lead to a linear heat production increase in
Krusenberg samples, and a linear decrease in the Nåntuna samples. In both soils, however,
there was an initial increase at the lowest PAH concentration, corresponding to the
guideline value for less sensitive land use (Naturvårdsverket, 2009). This could possibly
be due to microorganisms utilizing PAH as a carbon source (CCME, 2008; Turbé et al.,
2010). It is not known why the responses vary between the soils. It could be due to
different microbial community composition, with different abilities to degrade PAH.
Another possible reason is different concentrations in Krusenberg and Nåntuna samples.
If the PAH concentrations were higher in the Nåntuna samples, as they were for Cu, the
decrease could be due to a greater toxic effect (Dawson et al., 2007; CCME, 2008). There
were no relationships between PAH concentration and respiration, possibly due to the
23
complex effects of PAH to soil organisms (CCME, 2008). The respiration results should,
however, be analyzed with respect to the big differences between replicates. For both heat
and respiration data, there was no knowledge about actual PAH concentrations, which
prevents proper interpretation of PAH impacts.
4.1.3 The calorespirometric ratio
The calorespirometric ratio has been found to be applicable for evaluation of metabolic
efficiency in soils (Barros et al., 2010). The results of this project, however, do not agree.
In the Cu soil samples, the calorespirometric ratio was inconsistent between the soils. The
ratio for Krusenberg increased, indicating decreased metabolic efficiency (Herrmann et
al., 2014; Herrmann and Bölscher, 2015). This is in line with the initial hypothesis that
Cu contamination decreases metabolic efficiency. However, there was no apparent
relationship between the ratio and Cu concentration in Krusenberg samples. The ratio in
Nåntuna samples decreased in a linear fashion, indicating an increased metabolic
efficiency (Herrmann et al., 2014; Herrmann and Bölscher, 2015).
PAH had no apparent impact on the calorespirometric ratio. This was hardly surprising
considering the complex responses to PAH in the measurements of both heat production
and respiration. The fact that there was no knowledge of actual PAH concentrations
inhibits a proper analysis of the results, as was also mentioned above. It is also important
to point out that the results could have been affected by variation between replicates.
4.2 MICROBIAL FUNCTIONAL DIVERSITY
4.2.1 Influence of carbon substrates
The substrates which were primarily responsible for the functional diversity variations
between the soils were α-ketoglutaric acid and citric acid. Soil samples amended with
these substrates were also greatly affected by Cu. This is consistent with Kong et al.
(2006), who showed that exposure to Cu reduced the microorganisms’ ability to utilize
carboxylic acids as carbon substrates. α-ketoglutaric acid and citric acid are both
intermediates in the tricarboxylic acid (TCA) cycle, which is a part of the metabolism of
aerobic organisms (Yin et al., 2012). Addition of these acids might therefore contribute
to increased microbial metabolism. It is not completely clear why some carbon substrates
lead to more production of heat and CO2 than others.
4.2.2 Abiotic processes
There was abiotic heat production in the sterile soil samples amended with carboxylic
acids, as was also shown by Herrmann et al. (2014). At present, further investigation is
needed to determine the source of abiotic heat production in soil (Herrmann et al., 2014).
A possible reason could be adsorption of carboxylic functional groups of organic matter
to iron oxide, which has been proven to be a reaction that releases heat (Gu et al., 1994).
The abiotic heat production in the Krusenberg Cu samples amended with α-ketoglutaric
acid exceeded the total. This indicates that Cu had such toxic effect in the Krusenberg
soil that there was no microbial heat production in these samples. It is important to point
out, however, that the analyses of total and abiotic heat production were done in different
soil samples, and that some variation could be due to soil heterogeneity.
24
Herrmann et al. (2014) showed that there was no significant CO2 production in sterilized
soil samples amended with α-ketoglutaric acid and citric acid. The results of this project,
however, showed CO2 production from sterilized Nåntuna soil samples. The reason for
this is not completely clear. One reason could be that the sterilization was unsuccessful.
This is not likely, however, since the abiotic CO2 production in the Krusenberg soil
samples was insignificant. Taking the different pH values of the soils into account, a more
probable reason is that the soil carbonate has reacted with the carboxylic acids, which
leads to a release of CO2.
4.2.3 Effects on microbial functional diversity
The Shannon Index, calculated using heat data, indicated that the microbial functional
diversity in uncontaminated Krusenberg samples exceeded the microbial functional
diversity in Nåntuna samples. This was a bit surprising since the Nåntuna soil samples
had higher microbial activity, i.e. higher heat production and respiration, than
Krusenberg. The difference was not as apparent using respiration data, the Shannon Index
was a bit higher for Krusenberg, but according to the PCA the difference was not
significant. The Simpson Index, calculated with both heat and CO2 data, was also higher
for Krusenberg, indicating a more even use of the substrates. Much of the activity in
Nåntuna samples came from the addition of α-ketoglutaric acid and citric acid, which
explains the lower Shannon and Simpson Index scores for the Nåntuna samples.
Comparing the Nåntuna heat and respiration data with PCA, gave an indication that the
methods did not provide the same information. This was verified by the Mantel
dissimilarity test. The heat data showed an apparent impact of Cu on microbial functional
diversity, according to both the Shannon Index and the PCA, while the respiration data
showed no significant effects of Cu. The heat data were consistent with Kong et al. (2006)
and Wang et al. (2007) who showed that Cu affect microbial diversity. The Cu treatments
also lead to an increased Simpson index, i.e. more even substrate utilization, according to
the heat production data. This was due to the microorganisms’ decreased ability to utilize
carboxylic acids, i.e. α-ketoglutaric acid and citric acid, in Cu contaminated soil (Kong et
al., 2006). The fact that the methods provided different information could be explained
by the presence of incomplete metabolic processes in the soil, which are only included by
calorimetry (Herrmann and Bölscher, 2015). If these processes were heavily impacted by
Cu, it would not be shown using MSIR. MSIR is considered an appropriate method for
soil monitoring. However, it underestimates the impacts of Cu on microbial functional
diversity. The differences between the results using MSIR and isothermal calorimetry
support the idea to use both methods.
The data for Krusenberg soil samples were similar, indicating that measurements of heat
and CO2 provided the same information. This indicates that the metabolic processes in
the Krusenberg samples produce both heat and CO2. The Shannon Index and PCA for
Krusenberg heat and CO2 data showed that Cu had an impact on microbial functional
diversity. This is consistent with Wang et al. (2007), who showed an effect of Cu on
microbial diversity. The heat data showed that both functional diversity and evenness
were reduced by Cu, which was also shown by Kong et al. (2006). The PAH treatments
had little significant effect on microbial functional diversity and substrate use evenness
in both soils.
25
4.3 APPLICABILITY IN RISK ASSESSMENT
Diverse results regarding the methods’ applicability in risk assessment have been shown.
MSIR is generally considered an appropriate method for monitoring soil function (e.g.
Jensen and Mesman, 2006). The method reflects carbon cycling, which is a fundamental
function of soils, and has high throughput (Ritz et al., 2009). However, there was a lot of
variation between replicates using MSIR, compared to isothermal calorimetry. While
isothermal calorimetry may be more work- and time consuming than the MicroRespTM
system, it has been proven to accurately measure heat production in soil (Harris et al.,
2012; Herrmann et al., 2014). This agrees with the results of this project. Isothermal
calorimetry also has the advantage of including other microbial processes (Herrmann and
Bölscher, 2015), which are not taken into account by MSIR. Due to its lower capacity,
however, isothermal calorimetry might not be applicable in routine risk assessment
investigations.
The heat and respiration data did not provide the same information for the Nåntuna
samples regarding effects on microbial functional diversity. To only use MSIR could thus
lead to an underestimation of the contamination situation. The abiotic CO2 production in
the Nåntuna samples amended with the carboxylic acids could also give a misleading
picture of the microbial respiration. MSIR does not take abiotic processes into
consideration, and thus the CO2 production could be misinterpreted as respiration.
However, both methods are considered applicable in soil contaminated with Cu. The
calorimetry data decreased similarly for both soils with little variation, as did the MSIR
data for Krusenberg. The variation among the replicates could have contributed to the
absence of a pattern in the Nåntuna samples. Variation should be considered, but it seems
unnecessary to discard the method completely because of the variation among the
Nåntuna MSIR data. Instead, further investigation is needed. PAH appears to have
complex effects on microbial activity, and has little significant effect on microbial
functional diversity. Therefore, neither of the methods can be considered applicable in
risk assessment of soils contaminated with PAH. The calorespirometric ratio is not
considered applicable in risk assessment due to the diverse results. Further testing is
needed to determine why the ratio increased with increasing Cu concentration in the
Krusenberg soil samples and decreased in Nåntuna samples.
The objective of the project was not to evaluate the differences between the two soils.
However, including two soils with different properties has increased the robustness of the
results. The diverse results also emphasize how complex soil systems are, and that there
is need for further research and testing. When risk assessment is performed, site-specific
properties (e.g. soil properties and contaminant type) must always be considered. These
properties determine the effectiveness of the chosen remediation technique (Leitgib et al.,
2008).
4.4 UNCERTAINTIES
Generally, which has been mentioned above, there were larger variations between
replicates using MSIR than isothermal calorimetry. Variation does not necessarily mean
that the methods are not stable. The replicates used in the experiments were field
replicates. Thus, the variation could be due to variation between the soil samples, and not
26
instability of the methods. Both methods required only a small amount of soil. This gives
soil heterogeneity a big influence on each soil sample (Creamer et al., 2009). To reduce
variation that is not related to the stability of the methods, lab replicates should have been
included in the experiment.
The actual PAH concentrations had not been determined within the timeline of this
project, as has also been mentioned above. Therefore, it is to be expected that the PAH
concentrations have been overestimated. This is a major uncertainty for the PAH results.
Because of the diverse soil properties and Cu concentrations, it is likely that the PAH
concentrations also vary between the soils.
5 CONCLUSIONS
The answers to the formulated questions were:
▪ There was a relationship between Cu concentration and substrate-induced heat
production in both soils. The heat production decreased logarithmically with
increased Cu concentration. There were linear relationships between PAH
concentration and heat production. However, the relationships varied between
the soils. The heat production increased with PAH concentration in the
Krusenberg soil samples, and decreased in the Nåntuna soil samples.
▪ There was a relationship between substrate-induced respiration and Cu
concentration in the Krusenberg soil. The respired CO2 declined logarithmically
with increased concentration of Cu. There were no relationships between
respiration and Cu in Nåntuna soil samples or respiration and PAH in both soils.
▪ The calorespirometric ratio increased with increased Cu in Krusenberg soil
samples, and decreased in the Nåntuna samples. The calorespirometric ratio was
not influenced by PAH concentration.
There is potential to use both methods in risk assessment of soils contaminated with Cu.
MSIR is already frequently used in some countries. Therefore, I would especially like to
promote isothermal calorimetry as a new candidate for evaluating microbial activity and
functional diversity. Although the throughput of isothermal calorimetry is not as high as
for MSIR, it measures microbial activity with high precision. Combining the methods by
calculating the calorespirometric ratio did not give consistent results for soil contaminated
with Cu in this project, and should therefore be used with caution. The microbial
responses to exposure of PAH are at present regarded as too complex to be accurately
evaluated with MSIR or isothermal calorimetry.
As a final remark, the importance of site-specific properties must be emphasized. A
method can show one thing at one site but something else at another. Although this project
evaluated the impacts of Cu and PAH in two diverse soils, there is still need for further
investigation, including other soil types and contaminants, to verify the methods’
applicability in risk assessment of contaminated soil.

27
6 REFERENCES
Airoldi, C., Critter, S.A., 1996. The inhibitor effect of copper sulphate on microbial
glucose degradation in red latosol soil. Thermochimica Acta, 288, 73–82.
Barros, N., Salgado, J., Rodríguez-Añón, J.A., Proupín, J., Villanueva, M., Hansen,
L.D., 2010. Calorimetric approach to metabolic carbon conversion efficiency in
soils: Comparison of experimental and theoretical models. Journal of Thermal
Analysis and Calorimetry, 99, 771–777. doi:10.1007/s10973-010-0673-4
Berggren Kleja, D., Sverige, Statens Naturvårdsverk, 2006. Metallers mobilitet i mark.
Stockholm: Naturvårdsverket (Report 5536).
Black, H.I.J., Ritz, K., Campbell, C.D., Harris, J.A., Wood, C., Chamberlain, P.M.,
Parekh, N., Towers, W., Scott, A., 2008. SQID: Prioritising biological
indicators of soil quality for deployment in a national-scale soil monitoring
scheme. Summary report.
Bölscher, T., Wadsö, L., Börjesson, G., Herrmann, A.M., 2016. Differences in substrate
use efficiency: impacts of microbial community composition, land use
management, and substrate complexity. Biology and Fertility of Soils, 52, 547–
559. doi:10.1007/s00374-016-1097-5
Braissant, O., Wirz, D., Göpfert, B., Daniels, A.U., 2010. Use of isothermal
microcalorimetry to monitor microbial activities. FEMS Microbiology Letters,
303, 1–8. doi:10.1111/j.1574-6968.2009.01819.x
Brookes, P.C., 1995. The use of microbial parameters in monitoring soil pollution by
heavy metals. Biology and Fertility of soils, 19, 269–279.
Campbell, C.D., Chapman, S.J., Cameron, C.M., Davidson, M.S., Potts, J.M., 2003. A
Rapid Microtiter Plate Method To Measure Carbon Dioxide Evolved from
Carbon Substrate Amendments so as To Determine the Physiological Profiles of
Soil Microbial Communities by Using Whole Soil. Applied and Environmental
Microbiology, 69, 3593–3599. doi:10.1128/AEM.69.6.3593-3599.2003
CCME (Canadian Council of Ministers of the Environment), 2008. Canadian Soil
Quality Guidelines for Carcinogenic and Other Polycyclic Aromatic
Hydrocarbons (Environmental and Human Health Effects). Canadian Council of
Ministers of the Environment, Winnipeg.
Creamer, R.E., Bellamy, P., Black, H.I.J., Cameron, C.M., Campbell, C.D.,
Chamberlain, P., Harris, J., Parekh, N., Pawlett, M., Poskitt, J., Stone, D., Ritz,
K., 2009. An inter-laboratory comparison of multi-enzyme and multiple
substrate-induced respiration assays to assess method consistency in soil
monitoring. Biology and Fertility of Soils, 45, 623–633. doi:10.1007/s00374-
009-0374-y
Creamer, R.E., Brennan, F., Fenton, O., Healy, M.G., Lalor, S.T.J., Lanigan, G.J.,
Regan, J.T., Griffiths, B.S., 2010. Implications of the proposed Soil Framework
Directive on agricultural systems in Atlantic Europe – a review. Soil Use and
Management, 26, 198–211. doi:10.1111/j.1475-2743.2010.00288.x
Dawson, J.J.C., Godsiffe, E.J., Thompson, I.P., Ralebitso-Senior, T.K., Killham, K.S.,
Paton, G.I., 2007. Application of biological indicators to assess recovery of
hydrocarbon impacted soils. Soil Biology and Biochemistry, 39, 164–177.
doi:10.1016/j.soilbio.2006.06.020
DeJong, T.M., 1975. A Comparison of Three Diversity Indices Based on Their
Components of Richness and Evenness. Oikos, 26, 222–227.
doi:10.2307/3543712
28
El-Alawi, Y.S., McConkey, B.J., Dixon, D.G., Greenberg, B.M., 2002. Measurement of
Short- and Long- Term Toxicity of Polycyclic Aromatic Hydrocarbons Using
Luminescent Bacteria. Ecotoxicology and Environmental Safety, 51, 12–21.
Griffiths, B.S., Hallett, P.D., Kuan, H.L., Gregory, A.S., Watts, C.W., Whitmore, A.P.,
2008. Functional resilience of soil microbial communities depends on both soil
structure and microbial community composition. Biology and Fertility of Soils,
44, 745–754. doi:10.1007/s00374-007-0257-z
Griffiths, B.S., Römbke, J., Schmelz, R.M., Scheffczyk, A., Faber, J.H., Bloem, J.,
Pérès, G., Cluzeau, D., Chabbi, A., Suhadolc, M., Sousa, J.P., Martins da Silva,
P., Carvalho, F., Mendes, S., Morais, P., Francisco, R., Pereira, C., Bonkowski,
M., Geisen, S., Bardgett, R.D., de Vries, F.T., Bolger, T., Dirilgen, T., Schmidt,
O., Winding, A., Hendriksen, N.B., Johansen, A., Philippot, L., Plassart, P., Bru,
D., Thomson, B., Griffiths, R.I., Bailey, M.J., Keith, A., Rutgers, M., Mulder,
C., Hannula, S.E., Creamer, R., Stone, D., 2016. Selecting cost effective and
policy-relevant biological indicators for European monitoring of soil
biodiversity and ecosystem function. Ecological Indicators, 69, 213–223.
doi:10.1016/j.ecolind.2016.04.023
Gu, B., Schmitt, J., Chen, Z., Liang, L., McCarthy, J.F., 1994. Adsorption and
desorption of natural organic matter on iron oxide: mechanisms and models.
Environmental Science & Technology, 28, 38–46.
Haglund, A.-L., Lantz, P., Törnblom, E., Tranvik, L., 2003. Depth distribution of active
bacteria and bacterial activity in lake sediment. FEMS Microbiology Ecology,
46, 31–38. doi:10.1016/S0168-6496(03)00190-9
Harris, J.A., Ritz, K., Coucheney, E., Grice, S.M., Lerch, T.Z., Pawlett, M., Herrmann,
A.M., 2012. The thermodynamic efficiency of soil microbial communities
subject to long-term stress is lower than those under conventional input regimes.
Soil Biology and Biochemistry, 47, 149–157. doi:10.1016/j.soilbio.2011.12.017
Haygarth, P.M., Ritz, K., 2009. The future of soils and land use in the UK: Soil systems
for the provision of land-based ecosystem services. Land Use Policy, 26, S187–
S197. doi:10.1016/j.landusepol.2009.09.016
Herrmann, A.M., Bölscher, T., 2015. Simultaneous screening of microbial energetics
and CO2 respiration in soil samples from different ecosystems. Soil Biology and
Biochemistry, 83, 88–92. doi:10.1016/j.soilbio.2015.01.020
Herrmann, A.M., Coucheney, E., Nunan, N., 2014. Isothermal Microcalorimetry
Provides New Insight into Terrestrial Carbon Cycling. Environmental Science &
Technology, 48, 4344–4352. doi:10.1021/es403941h
Howard, P.J.A., 1993. Soil protection and soil quality assessment in the EC. Science of
the total environment, 129, 219–239.
Jensen, J., Mesman, M., 2006. Ecological risk assessment of contaminated land:
decision support for site specific investigations. RIVM, Bilthoven.
Kong, W.-D., Zhu, Y.-G., Fu, B.-J., Marschner, P., He, J.-Z., 2006. The veterinary
antibiotic oxytetracycline and Cu influence functional diversity of the soil
microbial community. Environmental Pollution, 143, 129–137.
doi:10.1016/j.envpol.2005.11.003
Leitgib, L., Gruiz, K., Fenyvesi, É., Balogh, G., Murányi, A., 2008. Development of an
innovative soil remediation: “Cyclodextrin-enhanced combined technology.”
Science of the Total Environment, 392, 12–21.
doi:10.1016/j.scitotenv.2007.10.055.
29
Lerch, T.Z., Coucheney, E., Herrmann, A.M., 2013. Sensitivity of soil microbial
catabolic profiles to a gradient of carbon inputs: Does the soil organic matter
matter? Soil Biology and Biochemistry, 57, 911–915.
Li, Y., Liu, B., Zhang, X., Gao, M., Wang, J., 2015. Effects of Cu exposure on enzyme
activities and selection for microbial tolerances during swine-manure
composting. Journal of Hazardous Materials, 283, 512–518.
doi:10.1016/j.jhazmat.2014.09.061.
Naturvårdsverket, 2010. Riskbedömning av förorenade områden: en vägledning från
förenklad till fördjupad riskbedömning. Stockholm: Naturvårdsverket (Report
5977).
Naturvårdsverket, 2009. Riktvärden för förorenad mark - Modelbeskrivning och
vägledning. Stockholm: Naturvårdsverket (Report 5976).
Nyberg, K., Schnürer, A., Sundh, I., Jarvis, Å., Hallin, S., 2006. Ammonia-oxidizing
communities in agricultural soil incubated with organic waste residues. Biology
and Fertility of Soils, 42, 315–323. doi:10.1007/s00374-005-0029-6
Oksanen, J., Blanchet, F.G., Kindt, R., Legendre, P., Minchin, P.R., O’Hara, R.B.,
Simpson, G.L., Solymos, P., Stevens, M.H.H., Wagner, H., 2011. Package
“vegan”. Community ecology package, version 1.17-6.
Pielou, E.C., 1975. Ecological Diversity. John Wiley and Sons, New York, NY.
Pulleman, M., Creamer, R., Hamer, U., Helder, J., Pelosi, C., Pérès, G., Rutgers, M.,
2012. Soil biodiversity, biological indicators and soil ecosystem services–an
overview of European approaches. Current Opinion in Environmental
Sustainability, 4, 529–538. doi:10.1016/j.cosust.2012.10.009.
R Development Core Team, 2008. A language and environment for statistical
computing. URL https://www.r-project.org/.
Ramsden, J., Kervalishvili, P.J., 2008. Complexity and Security. IOS Press.
Ritz, K., Black, H.I.J., Campbell, C.D., Harris, J.A., Wood, C., 2009. Selecting
biological indicators for monitoring soils: A framework for balancing scientific
and technical opinion to assist policy development. Ecological Indicators, 9,
1212–1221. doi:10.1016/j.ecolind.2009.02.009.
Schlesinger, W.H., Andrews, J.A., 2000. Soil respiration and the global carbon cycle.
Biogeochemistry, 48, 7–20. doi:10.1023/A:1006247623877.
Simpson, E.H., 1949. Measurement of diversity. Nature, 163, 688–688.
Sternbeck, J., 2000. Uppträdande och effekter av koppar i vaten och mark. Stockholm:
IVL Svenska Miljöinstitutet AB (Report B1349).
Stevens, R.D., Cox, S.B., Strauss, R.E., Willig, M.R., 2003. Patterns of functional
diversity across an extensive environmental gradient: vertebrate consumers,
hidden treatments and latitudinal trends: Gradients of functional diversity.
Ecology Letters, 6, 1099–1108. doi:10.1046/j.1461-0248.2003.00541.x.
Sverdrup, L.E., Ekelund, F., Krogh, P.H., Nielsen, T., Johnsen, K., 2002. Soil microbial
toxicity of eight polycyclic aromatic compounds: effects on nitrification, the
genetic diversity of bacteria, and the total number of protozoans. Environmental
Toxicology and Chemistry, 21, 1644–1650.
SWECO, 2009. Storstadsspecifika riktvärden för Malmö, Göteborgs och Stockholms
stad. Stockholm: SWECO Environment AB.
Turbé, A., De Toni, A., Benito, P., Lavelle, P., Lavelle, P., Camacho, N.R., Van Der
Putten, W.H., Labouze, E., Mudgal, S., 2010. Soil biodiversity: functions,
threats and tools for policy makers.

30
US EPA (United States Environmental Protection Agency), 2008. Green Remediation:
Best Management Practices for Excavation and Surface Restoration. URL
https://www.epa.gov/sites/production/files/2015-
04/documents/gr_quick_ref_fs_exc_rest.pdf (accessed 2017-02-10).
Van Der Heijden, M.G.A., Bardgett, R.D., Van Straalen, N.M., 2008. The unseen
majority: soil microbes as drivers of plant diversity and productivity in terrestrial
ecosystems. Ecology Letters, 11, 296–310. doi:10.1111/j.1461-
0248.2007.01139.x.
Wang, F., Yao, J., Si, Y., Chen, H., Russel, M., Chen, K., Qian, Y., Zaray, G.,
Bramanti, E., 2010. Short-time effect of heavy metals upon microbial
community activity. Journal of Hazardous Materials, 173, 510–516.
doi:10.1016/j.jhazmat.2009.08.114.
Wang, Q.-Y., Zhou, D.-M., Cang, L., 2009. Microbial and enzyme properties of apple
orchard soil as affected by long-term application of copper fungicide. Soil
Biology and Biochemistry, 41, 1504–1509. doi:10.1016/j.soilbio.2009.04.010.
Wang, Y., Shi, J., Wang, H., Lin, Q., Chen, X., Chen, Y., 2007. The influence of soil
heavy metals pollution on soil microbial biomass, enzyme activity, and
community composition near a copper smelter. Ecotoxicology and
Environmental Safety, 67, 75–81. doi:10.1016/j.ecoenv.2006.03.007.
Winding, A., Neiendam Nielsen, M., Danmark, Danmarks Miljøundersøgelser, 2002.
Microorganisms as indicators of soil health. National Environmental Research
Institute, Roskilde.
Yin, X., Madzak, C., Du, G., Zhou, J., Chen, J., 2012. Enhanced alpha-ketoglutaric acid
production in Yarrowia lipolytica WSH-Z06 by regulation of the pyruvate
carboxylation pathway. Applied Microbiology and Biotechnology, 96, 1527–
1537. doi:10.1007/s00253-012-4192-z.
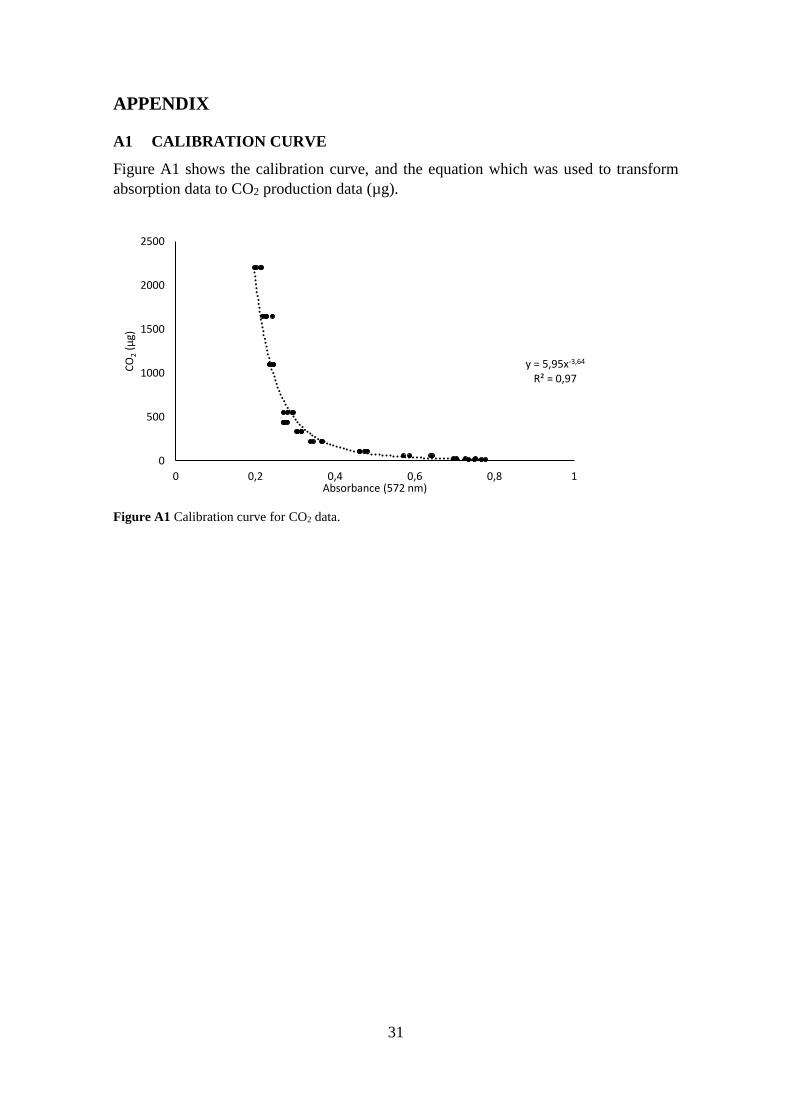
31
APPENDIX
A1 CALIBRATION CURVE
Figure A1 shows the calibration curve, and the equation which was used to transform
absorption data to CO2 production data (µg).
Figure A1 Calibration curve for CO2 data.
y = 5,95x-3,64
R² = 0,97
0
500
1000
1500
2000
2500
0 0,2 0,4 0,6 0,8 1
CO
2(µ
g)
Absorbance (572 nm)
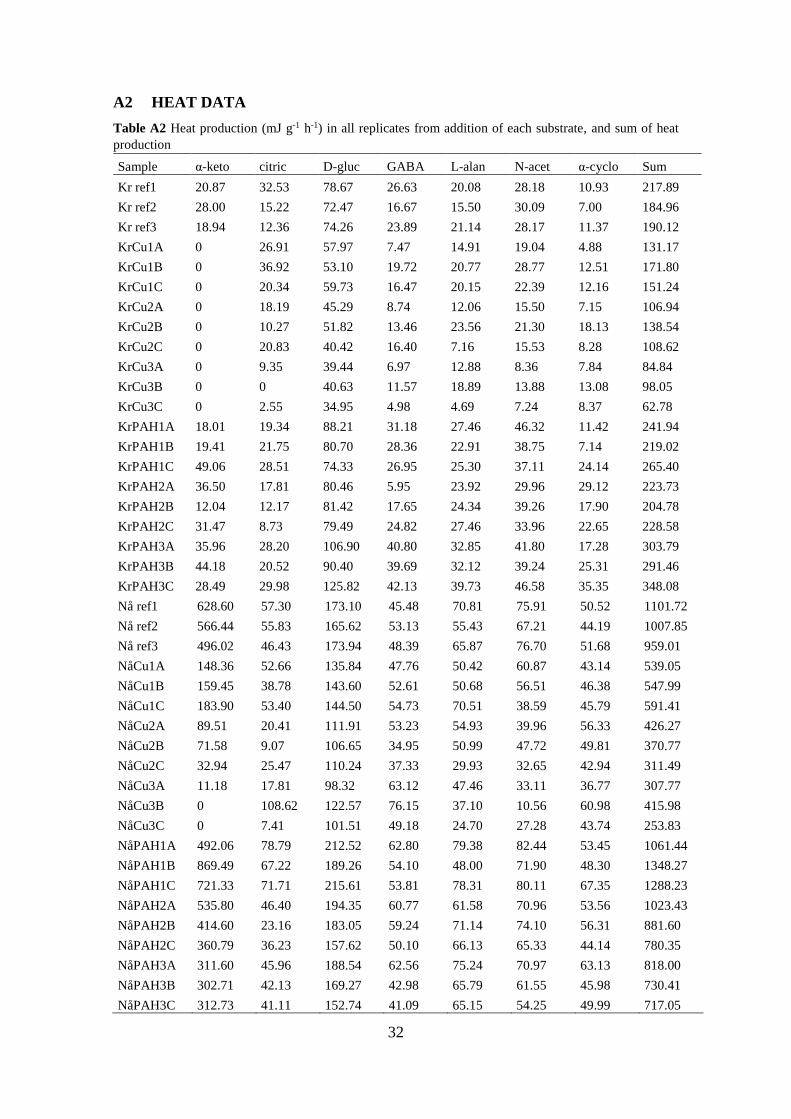
32
A2 HEAT DATA
Table A2 Heat production (mJ g-1 h-1) in all replicates from addition of each substrate, and sum of heat
production
Sample α-keto citric D-gluc GABA L-alan N-acet α-cyclo Sum
Kr ref1 20.87 32.53 78.67 26.63 20.08 28.18 10.93 217.89
Kr ref2 28.00 15.22 72.47 16.67 15.50 30.09 7.00 184.96
Kr ref3 18.94 12.36 74.26 23.89 21.14 28.17 11.37 190.12
KrCu1A 0 26.91 57.97 7.47 14.91 19.04 4.88 131.17
KrCu1B 0 36.92 53.10 19.72 20.77 28.77 12.51 171.80
KrCu1C 0 20.34 59.73 16.47 20.15 22.39 12.16 151.24
KrCu2A 0 18.19 45.29 8.74 12.06 15.50 7.15 106.94
KrCu2B 0 10.27 51.82 13.46 23.56 21.30 18.13 138.54
KrCu2C 0 20.83 40.42 16.40 7.16 15.53 8.28 108.62
KrCu3A 0 9.35 39.44 6.97 12.88 8.36 7.84 84.84
KrCu3B 0 0 40.63 11.57 18.89 13.88 13.08 98.05
KrCu3C 0 2.55 34.95 4.98 4.69 7.24 8.37 62.78
KrPAH1A 18.01 19.34 88.21 31.18 27.46 46.32 11.42 241.94
KrPAH1B 19.41 21.75 80.70 28.36 22.91 38.75 7.14 219.02
KrPAH1C 49.06 28.51 74.33 26.95 25.30 37.11 24.14 265.40
KrPAH2A 36.50 17.81 80.46 5.95 23.92 29.96 29.12 223.73
KrPAH2B 12.04 12.17 81.42 17.65 24.34 39.26 17.90 204.78
KrPAH2C 31.47 8.73 79.49 24.82 27.46 33.96 22.65 228.58
KrPAH3A 35.96 28.20 106.90 40.80 32.85 41.80 17.28 303.79
KrPAH3B 44.18 20.52 90.40 39.69 32.12 39.24 25.31 291.46
KrPAH3C 28.49 29.98 125.82 42.13 39.73 46.58 35.35 348.08
Nå ref1 628.60 57.30 173.10 45.48 70.81 75.91 50.52 1101.72
Nå ref2 566.44 55.83 165.62 53.13 55.43 67.21 44.19 1007.85
Nå ref3 496.02 46.43 173.94 48.39 65.87 76.70 51.68 959.01
NåCu1A 148.36 52.66 135.84 47.76 50.42 60.87 43.14 539.05
NåCu1B 159.45 38.78 143.60 52.61 50.68 56.51 46.38 547.99
NåCu1C 183.90 53.40 144.50 54.73 70.51 38.59 45.79 591.41
NåCu2A 89.51 20.41 111.91 53.23 54.93 39.96 56.33 426.27
NåCu2B 71.58 9.07 106.65 34.95 50.99 47.72 49.81 370.77
NåCu2C 32.94 25.47 110.24 37.33 29.93 32.65 42.94 311.49
NåCu3A 11.18 17.81 98.32 63.12 47.46 33.11 36.77 307.77
NåCu3B 0 108.62 122.57 76.15 37.10 10.56 60.98 415.98
NåCu3C 0 7.41 101.51 49.18 24.70 27.28 43.74 253.83
NåPAH1A 492.06 78.79 212.52 62.80 79.38 82.44 53.45 1061.44
NåPAH1B 869.49 67.22 189.26 54.10 48.00 71.90 48.30 1348.27
NåPAH1C 721.33 71.71 215.61 53.81 78.31 80.11 67.35 1288.23
NåPAH2A 535.80 46.40 194.35 60.77 61.58 70.96 53.56 1023.43
NåPAH2B 414.60 23.16 183.05 59.24 71.14 74.10 56.31 881.60
NåPAH2C 360.79 36.23 157.62 50.10 66.13 65.33 44.14 780.35
NåPAH3A 311.60 45.96 188.54 62.56 75.24 70.97 63.13 818.00
NåPAH3B 302.71 42.13 169.27 42.98 65.79 61.55 45.98 730.41
NåPAH3C 312.73 41.11 152.74 41.09 65.15 54.25 49.99 717.05
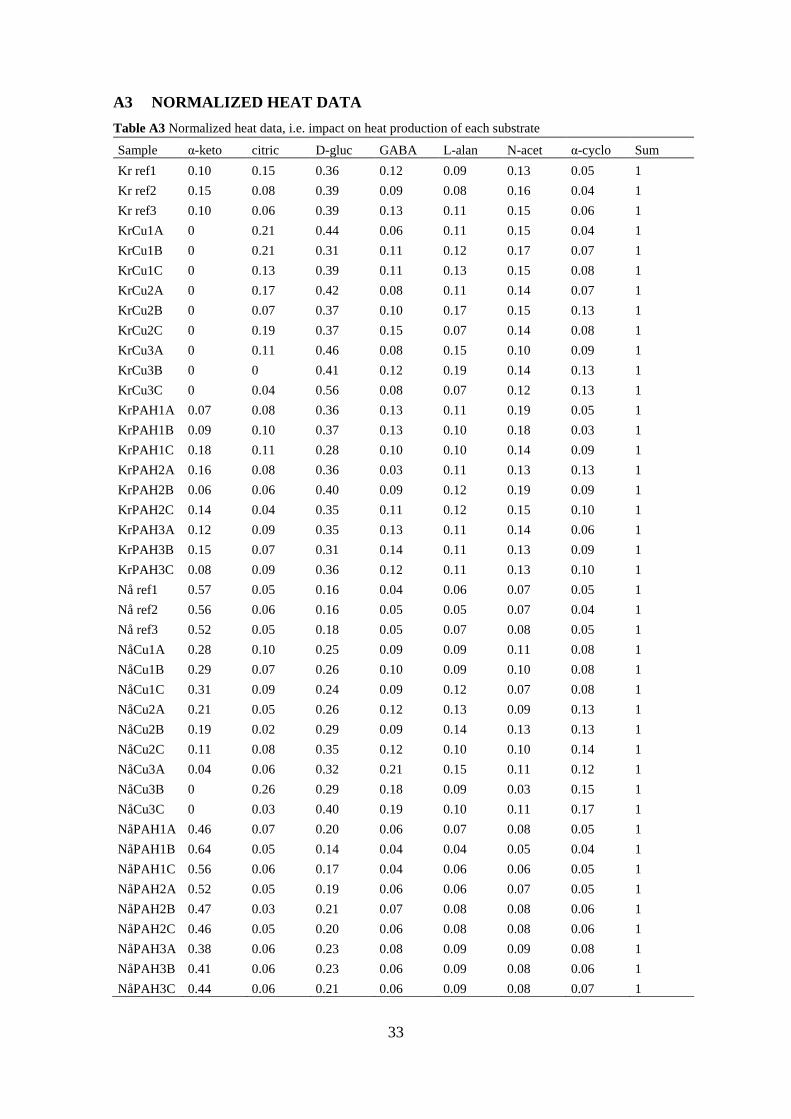
33
A3 NORMALIZED HEAT DATA
Table A3 Normalized heat data, i.e. impact on heat production of each substrate
Sample α-keto citric D-gluc GABA L-alan N-acet α-cyclo Sum
Kr ref1 0.10 0.15 0.36 0.12 0.09 0.13 0.05 1
Kr ref2 0.15 0.08 0.39 0.09 0.08 0.16 0.04 1
Kr ref3 0.10 0.06 0.39 0.13 0.11 0.15 0.06 1
KrCu1A 0 0.21 0.44 0.06 0.11 0.15 0.04 1
KrCu1B 0 0.21 0.31 0.11 0.12 0.17 0.07 1
KrCu1C 0 0.13 0.39 0.11 0.13 0.15 0.08 1
KrCu2A 0 0.17 0.42 0.08 0.11 0.14 0.07 1
KrCu2B 0 0.07 0.37 0.10 0.17 0.15 0.13 1
KrCu2C 0 0.19 0.37 0.15 0.07 0.14 0.08 1
KrCu3A 0 0.11 0.46 0.08 0.15 0.10 0.09 1
KrCu3B 0 0 0.41 0.12 0.19 0.14 0.13 1
KrCu3C 0 0.04 0.56 0.08 0.07 0.12 0.13 1
KrPAH1A 0.07 0.08 0.36 0.13 0.11 0.19 0.05 1
KrPAH1B 0.09 0.10 0.37 0.13 0.10 0.18 0.03 1
KrPAH1C 0.18 0.11 0.28 0.10 0.10 0.14 0.09 1
KrPAH2A 0.16 0.08 0.36 0.03 0.11 0.13 0.13 1
KrPAH2B 0.06 0.06 0.40 0.09 0.12 0.19 0.09 1
KrPAH2C 0.14 0.04 0.35 0.11 0.12 0.15 0.10 1
KrPAH3A 0.12 0.09 0.35 0.13 0.11 0.14 0.06 1
KrPAH3B 0.15 0.07 0.31 0.14 0.11 0.13 0.09 1
KrPAH3C 0.08 0.09 0.36 0.12 0.11 0.13 0.10 1
Nå ref1 0.57 0.05 0.16 0.04 0.06 0.07 0.05 1
Nå ref2 0.56 0.06 0.16 0.05 0.05 0.07 0.04 1
Nå ref3 0.52 0.05 0.18 0.05 0.07 0.08 0.05 1
NåCu1A 0.28 0.10 0.25 0.09 0.09 0.11 0.08 1
NåCu1B 0.29 0.07 0.26 0.10 0.09 0.10 0.08 1
NåCu1C 0.31 0.09 0.24 0.09 0.12 0.07 0.08 1
NåCu2A 0.21 0.05 0.26 0.12 0.13 0.09 0.13 1
NåCu2B 0.19 0.02 0.29 0.09 0.14 0.13 0.13 1
NåCu2C 0.11 0.08 0.35 0.12 0.10 0.10 0.14 1
NåCu3A 0.04 0.06 0.32 0.21 0.15 0.11 0.12 1
NåCu3B 0 0.26 0.29 0.18 0.09 0.03 0.15 1
NåCu3C 0 0.03 0.40 0.19 0.10 0.11 0.17 1
NåPAH1A 0.46 0.07 0.20 0.06 0.07 0.08 0.05 1
NåPAH1B 0.64 0.05 0.14 0.04 0.04 0.05 0.04 1
NåPAH1C 0.56 0.06 0.17 0.04 0.06 0.06 0.05 1
NåPAH2A 0.52 0.05 0.19 0.06 0.06 0.07 0.05 1
NåPAH2B 0.47 0.03 0.21 0.07 0.08 0.08 0.06 1
NåPAH2C 0.46 0.05 0.20 0.06 0.08 0.08 0.06 1
NåPAH3A 0.38 0.06 0.23 0.08 0.09 0.09 0.08 1
NåPAH3B 0.41 0.06 0.23 0.06 0.09 0.08 0.06 1
NåPAH3C 0.44 0.06 0.21 0.06 0.09 0.08 0.07 1
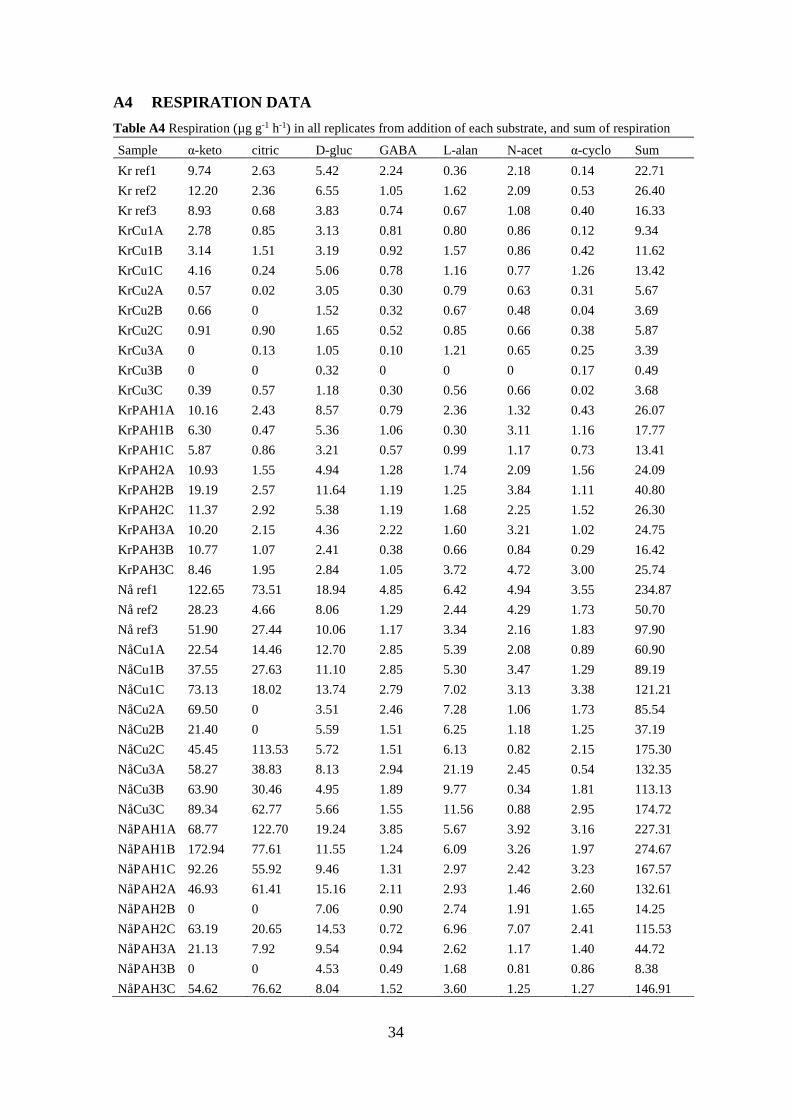
34
A4 RESPIRATION DATA
Table A4 Respiration (µg g-1 h-1) in all replicates from addition of each substrate, and sum of respiration
Sample α-keto citric D-gluc GABA L-alan N-acet α-cyclo Sum
Kr ref1 9.74 2.63 5.42 2.24 0.36 2.18 0.14 22.71
Kr ref2 12.20 2.36 6.55 1.05 1.62 2.09 0.53 26.40
Kr ref3 8.93 0.68 3.83 0.74 0.67 1.08 0.40 16.33
KrCu1A 2.78 0.85 3.13 0.81 0.80 0.86 0.12 9.34
KrCu1B 3.14 1.51 3.19 0.92 1.57 0.86 0.42 11.62
KrCu1C 4.16 0.24 5.06 0.78 1.16 0.77 1.26 13.42
KrCu2A 0.57 0.02 3.05 0.30 0.79 0.63 0.31 5.67
KrCu2B 0.66 0 1.52 0.32 0.67 0.48 0.04 3.69
KrCu2C 0.91 0.90 1.65 0.52 0.85 0.66 0.38 5.87
KrCu3A 0 0.13 1.05 0.10 1.21 0.65 0.25 3.39
KrCu3B 0 0 0.32 0 0 0 0.17 0.49
KrCu3C 0.39 0.57 1.18 0.30 0.56 0.66 0.02 3.68
KrPAH1A 10.16 2.43 8.57 0.79 2.36 1.32 0.43 26.07
KrPAH1B 6.30 0.47 5.36 1.06 0.30 3.11 1.16 17.77
KrPAH1C 5.87 0.86 3.21 0.57 0.99 1.17 0.73 13.41
KrPAH2A 10.93 1.55 4.94 1.28 1.74 2.09 1.56 24.09
KrPAH2B 19.19 2.57 11.64 1.19 1.25 3.84 1.11 40.80
KrPAH2C 11.37 2.92 5.38 1.19 1.68 2.25 1.52 26.30
KrPAH3A 10.20 2.15 4.36 2.22 1.60 3.21 1.02 24.75
KrPAH3B 10.77 1.07 2.41 0.38 0.66 0.84 0.29 16.42
KrPAH3C 8.46 1.95 2.84 1.05 3.72 4.72 3.00 25.74
Nå ref1 122.65 73.51 18.94 4.85 6.42 4.94 3.55 234.87
Nå ref2 28.23 4.66 8.06 1.29 2.44 4.29 1.73 50.70
Nå ref3 51.90 27.44 10.06 1.17 3.34 2.16 1.83 97.90
NåCu1A 22.54 14.46 12.70 2.85 5.39 2.08 0.89 60.90
NåCu1B 37.55 27.63 11.10 2.85 5.30 3.47 1.29 89.19
NåCu1C 73.13 18.02 13.74 2.79 7.02 3.13 3.38 121.21
NåCu2A 69.50 0 3.51 2.46 7.28 1.06 1.73 85.54
NåCu2B 21.40 0 5.59 1.51 6.25 1.18 1.25 37.19
NåCu2C 45.45 113.53 5.72 1.51 6.13 0.82 2.15 175.30
NåCu3A 58.27 38.83 8.13 2.94 21.19 2.45 0.54 132.35
NåCu3B 63.90 30.46 4.95 1.89 9.77 0.34 1.81 113.13
NåCu3C 89.34 62.77 5.66 1.55 11.56 0.88 2.95 174.72
NåPAH1A 68.77 122.70 19.24 3.85 5.67 3.92 3.16 227.31
NåPAH1B 172.94 77.61 11.55 1.24 6.09 3.26 1.97 274.67
NåPAH1C 92.26 55.92 9.46 1.31 2.97 2.42 3.23 167.57
NåPAH2A 46.93 61.41 15.16 2.11 2.93 1.46 2.60 132.61
NåPAH2B 0 0 7.06 0.90 2.74 1.91 1.65 14.25
NåPAH2C 63.19 20.65 14.53 0.72 6.96 7.07 2.41 115.53
NåPAH3A 21.13 7.92 9.54 0.94 2.62 1.17 1.40 44.72
NåPAH3B 0 0 4.53 0.49 1.68 0.81 0.86 8.38
NåPAH3C 54.62 76.62 8.04 1.52 3.60 1.25 1.27 146.91

35
A5 NORMALIZED RESPIRATION DATA
Table A5 Normalized respiration data, i.e. impact on respiration of each substrate
Sample α-keto citric D-gluc GABA L-alan N-acet α-cyclo Sum
Kr ref1 0.43 0.12 0.24 0.10 0.02 0.10 0.01 1
Kr ref2 0.46 0.09 0.25 0.04 0.06 0.08 0.02 1
Kr ref3 0.55 0.04 0.23 0.05 0.04 0.07 0.02 1
KrCu1A 0.30 0.09 0.33 0.09 0.09 0.09 0.01 1
KrCu1B 0.27 0.13 0.27 0.08 0.14 0.07 0.04 1
KrCu1C 0.31 0.02 0.38 0.06 0.09 0.06 0.09 1
KrCu2A 0.10 0 0.54 0.05 0.14 0.11 0.05 1
KrCu2B 0.18 0 0.41 0.09 0.18 0.13 0.01 1
KrCu2C 0.15 0.15 0.28 0.09 0.14 0.11 0.06 1
KrCu3A 0 0.04 0.31 0.03 0.36 0.19 0.07 1
KrCu3B 0 0 0.66 0 0 0 0.34 1
KrCu3C 0.11 0.15 0.32 0.08 0.15 0.18 0.01 1
KrPAH1A 0.39 0.09 0.33 0.03 0.09 0.05 0.02 1
KrPAH1B 0.35 0.03 0.30 0.06 0.02 0.17 0.07 1
KrPAH1C 0.44 0.06 0.24 0.04 0.07 0.09 0.05 1
KrPAH2A 0.45 0.06 0.21 0.05 0.07 0.09 0.06 1
KrPAH2B 0.47 0.06 0.29 0.03 0.03 0.09 0.03 1
KrPAH2C 0.43 0.11 0.20 0.05 0.06 0.09 0.06 1
KrPAH3A 0.41 0.09 0.18 0.09 0.06 0.13 0.04 1
KrPAH3B 0.66 0.07 0.15 0.02 0.04 0.05 0.02 1
KrPAH3C 0.33 0.08 0.11 0.04 0.14 0.18 0.12 1
Nå ref1 0.52 0.31 0.08 0.02 0.03 0.02 0.02 1
Nå ref2 0.56 0.09 0.16 0.03 0.05 0.08 0.03 1
Nå ref3 0.53 0.28 0.10 0.01 0.03 0.02 0.02 1
NåCu1A 0.37 0.24 0.21 0.05 0.09 0.03 0.01 1
NåCu1B 0.42 0.31 0.12 0.03 0.06 0.04 0.01 1
NåCu1C 0.60 0.15 0.11 0.02 0.06 0.03 0.03 1
NåCu2A 0.81 0 0.04 0.03 0.09 0.01 0.02 1
NåCu2B 0.58 0 0.15 0.04 0.17 0.03 0.03 1
NåCu2C 0.26 0.65 0.03 0.01 0.03 0 0.01 1
NåCu3A 0.44 0.29 0.06 0.02 0.16 0.02 0 1
NåCu3B 0.56 0.27 0.04 0.02 0.09 0 0.02 1
NåCu3C 0.51 0.36 0.03 0.01 0.07 0.01 0.02 1
NåPAH1A 0.30 0.54 0.08 0.02 0.02 0.02 0.01 1
NåPAH1B 0.63 0.28 0.04 0 0.02 0.01 0.01 1
NåPAH1C 0.55 0.33 0.06 0.01 0.02 0.01 0.02 1
NåPAH2A 0.35 0.46 0.11 0.02 0.02 0.01 0.02 1
NåPAH2B 0 0 0.50 0.06 0.19 0.13 0.12 1
NåPAH2C 0.55 0.18 0.13 0.01 0.06 0.06 0.02 1
NåPAH3A 0.47 0.18 0.21 0.02 0.06 0.03 0.03 1
NåPAH3B 0 0 0.54 0.06 0.20 0.10 0.10 1
NåPAH3C 0.37 0.52 0.05 0.01 0.02 0.01 0.01 1