multipliers in an island economy: the case of the … · são paulo 2012. 1 multipliers in an...
TRANSCRIPT
MULTIPLIERS IN AN ISLAND ECONOMY:
THE CASE OF THE AZORES
Eduardo Haddad
Vasco Silva
Alexandre Porsse
Tomaz Dentinho
TD Nereus 09-2012
São Paulo
2012
1
Multipliers in an Island Economy:
The Case of the Azores
Eduardo Haddad1, Vasco Silva
2, Alexandre Porsse
3 and Tomaz Dentinho
4
Abstract. In this paper we present the interisland input-output system for the Azores. It
includes the economy of the nine islands of the archipelago, considering 25 different
economic activities. The paper also analyses the impacts of the main drivers of the
islands economy incorporating both spillover and feedback effects in the evaluation of
the multipliers: i) dairy and beef exports; ii) external public support; and iii) tourism,
both from the rest of the country and from abroad. It is shown that: i) the economic
structure of the islands is quite different from each other; ii) the specific economic base
of the islands are also different and, as expected, the biggest islands not only capture an
important part of the impact of external pushes done in smaller islands but also they
constitute important drivers of smaller islands.
1. Introduction
Insularity results from the combination of smallness, associated with limiting factors,
and remoteness, linked to the distant location of its final demand. Smallness can be
viewed as land insufficiency, lack of specialized labour or shortage of venture capital,
reduced markets and scale diseconomies, also in standardized public services. Insularity
is then a technological specificity, where some resources are available but bounded, that
shapes the social structures and geographical identities. The combination of smallness
with remoteness explains the occurrence of export monocultures because the whole
island stays within the same Von Thünen ring influenced by local capabilities and by
distant external markets. Being so, small changes in market conditions or in external
accessibilities can produce great modifications in the export base generating economic
cycles with strong effects in the islands livelihoods. Finally the overwhelming pressure
for monoculture creates rents over the scarce economic resources whose spatial
allocation depends on the control over transport value chains and on the structure of
ownership. Being so, the regional coefficients of the input-output (IO) matrix of each
island can be quite different from the one observed in another island or in the mainland,
1 Universidade de São Paulo, São Paulo, Brasil; CNPq scholar
2 Universidade dos Açores, Angra do Heroísmo, Portugal
3 Universidade Federal do Paraná, Curitiba, Brasil
4 Universidade dos Açores, Angra do Heroísmo, Portugal
2
either because there is some limiting factor or because the income generated migrates
elsewhere.
The challenge of this paper is to analyze the effects of insularity in the economy looking
into the IO multiplier effects in archipelagic economies for the case of the nine islands
of the Azores. Input-Output modelling – linked to the Economic Tables of François
Quesnay (1758) and with the idea of general equilibrium proposed in the book Elements
d'Économie Politique Pure written by Léon Walras in 1874 – was first developed by
Leontieff (1951), Leontieff et al. (1953) and Chenery and Clark (1959), and since then
there has been many applications and developments, reviewed in the book of Input-
Output Analysis (Miller and Blair, 2009).
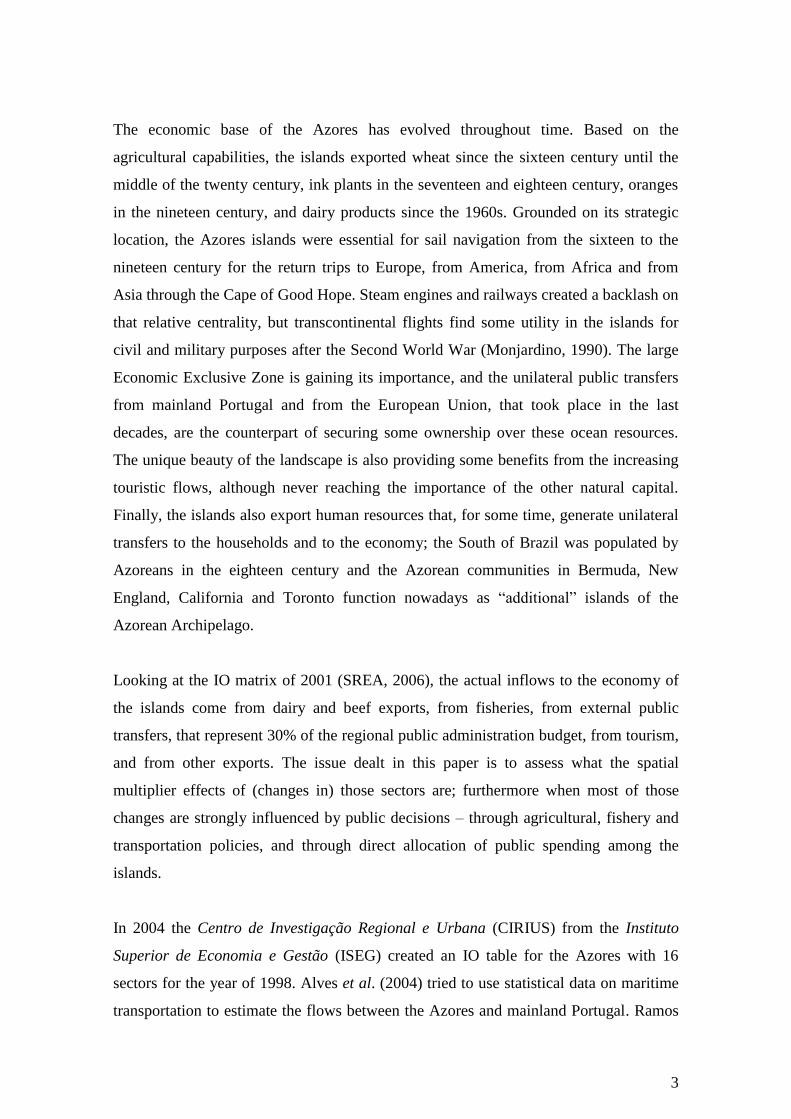
The Azores are nine small islands (Figure 1) spread across 600 km – East-West – in the
North Atlantic, half way between Portugal and Newfound Land. The islands are wet and
green, warm but windy, with average temperatures between 16ºC in January and 22ºC
in August and with rainfall ranging between 762 and 1525 mm. Less than a quarter of a
million Portuguese people live in the islands, quite different in size and population and
with very different distances from each other. The economy of the Azores, like any
other place, rests on its human, social and productive capital moulded by four main
natural features: good conditions for agriculture, strategic location, unique beauty, and a
large Exclusive Economic Zone. The use of these potentialities, driven by outside
markets and by outwards strategic equilibriums, evolved through time determining the
performance of the economy, its crises and recoveries (Dentinho, 1995).
Figure 1. The Azores Archipelago
3
The economic base of the Azores has evolved throughout time. Based on the
agricultural capabilities, the islands exported wheat since the sixteen century until the
middle of the twenty century, ink plants in the seventeen and eighteen century, oranges
in the nineteen century, and dairy products since the 1960s. Grounded on its strategic
location, the Azores islands were essential for sail navigation from the sixteen to the
nineteen century for the return trips to Europe, from America, from Africa and from
Asia through the Cape of Good Hope. Steam engines and railways created a backlash on
that relative centrality, but transcontinental flights find some utility in the islands for
civil and military purposes after the Second World War (Monjardino, 1990). The large
Economic Exclusive Zone is gaining its importance, and the unilateral public transfers
from mainland Portugal and from the European Union, that took place in the last
decades, are the counterpart of securing some ownership over these ocean resources.
The unique beauty of the landscape is also providing some benefits from the increasing
touristic flows, although never reaching the importance of the other natural capital.
Finally, the islands also export human resources that, for some time, generate unilateral
transfers to the households and to the economy; the South of Brazil was populated by
Azoreans in the eighteen century and the Azorean communities in Bermuda, New
England, California and Toronto function nowadays as “additional” islands of the
Azorean Archipelago.
Looking at the IO matrix of 2001 (SREA, 2006), the actual inflows to the economy of
the islands come from dairy and beef exports, from fisheries, from external public
transfers, that represent 30% of the regional public administration budget, from tourism,
and from other exports. The issue dealt in this paper is to assess what the spatial
multiplier effects of (changes in) those sectors are; furthermore when most of those
changes are strongly influenced by public decisions – through agricultural, fishery and
transportation policies, and through direct allocation of public spending among the
islands.
In 2004 the Centro de Investigação Regional e Urbana (CIRIUS) from the Instituto
Superior de Economia e Gestão (ISEG) created an IO table for the Azores with 16
sectors for the year of 1998. Alves et al. (2004) tried to use statistical data on maritime
transportation to estimate the flows between the Azores and mainland Portugal. Ramos
4
and Sargento (2003) disaggregated the IO matrix for 1995 for seven Portuguese regions,
including the Azores. The Serviço Regional de Estatística dos Açores (SREA)
published in 2006 an enlarged table of employment for the Azores in 2001, with 25
sectors. Ferreira (2006) built up the regional IO table for the Azores with 45 sectors,
using information on the employment and production according to the method described
in Almond (2000). Then, based on disaggregation methods (Flegg, 1994) and bi-
proportional techniques (Jackson, 2004), in the particular form of crossed entropy
methods (Robinson, 2001), Ferreira was able to disaggregate that table for the Azores
into three regional IO tables: São Miguel, Terceira and the Rest of the Azores,
nevertheless without looking into the interisland flows.
The aim now is to generate an interregional IO system, including all the islands of the
Azores, through the estimation of the inter-industry and interisland economic flows and
their association with the existing structure of the transport and communication system.
There has been many approaches to merge IO models with transportation network
analysis (Boyce, 2002) along the models reviewed by (Batten et al. 1986) and following
the initial work by Wilson (1970) on interregional commodity flows. Other contributors
include Polenske (1980), Hewings (1985) and, more recently, Haddad et al. (2011).
Summing up: first, the application of IO models to archipelagos cannot be done
assuming that the productive system is totally explained by the technological
coefficients of the whole archipelago without considering the decisive role of
transportation networks and bounded resources; second, it is advisable to create
spatially disaggregate models for archipelagos because policies and their effects are
necessarily spatially disaggregated; and, finally, recent techniques and improved data
allow the development of operational models suitable to support decision makers. In
this context, the aim of this paper is to analyze the effects of insularity in the economy
looking at the IO multiplier effects of the economic base in archipelagic economies for
the case of the nine islands of the Azores. More specifically, the aim is to provide
insights and support for the analysis of the impacts of the main basic activities in the
archipelagos, namely agricultural and dairy, fishery, external public transfers, and
tourism.
5
To address these issues, the study is divided in four distinct parts beyond the
introduction. Section 2 describes the methodological framework to be used in the
analysis, describing the interisland IO model for the archipelago. Section 3 briefly
discusses the main aspects related to the estimation of the interisland IO system, which
serves as the basis for the application that is carried out in section 4 to analyze
differential multiplier effects of the main components of the economic bases of the
island economies. Final remarks follow.
2. Methodology
The conventional input-output model is given by the system of matrix equations:
(1)
(2)
where x and f are the vectors of gross output and final demand, respectively; A consists
of input coefficients aij defined as the amount of product i required per unit of product j
(in monetary terms), for i, j = 1,…, n; and B is known as the Leontief inverse.
Let us consider systems (1) and (2) in an interregional context, with R different regions,
so that:
;
; and
(3)
and
(4)
6
Focusing on the elements directly related to the economic base, let us also consider the
different components of f, which include tourists expenditures in the islands, both from
the rest of Portugal, t, and from abroad, i, exports of goods and services to Mainland
Portugal, p, and to foreign markets, s, government expenditures financed by external
unilateral transfers5, c, and other final demand expenditures, e.
Thus, we can re-write (4) as:
(5)
With (5), we can then compute the contribution of the components of the economic base
to the islands output. It is clear from (5) that an island output depends, among others, on
direct money injections in the island itself and, depending on the degree of interregional
integration among the islands in the Azores, also on injections in other islands.
3. The Interisland Input-Output Model for the Azores
This section provides an overview of the process through which the Interisland Input-
Output Model for the Azores (IIOMA) was constructed, based on the available data.
The departure point was the Input-Output Table for the Azores (2001) which includes
25 sectors.
5 Regarding public transfers, there would be a need to include the discrimination of public expenditures
supported by external unilateral transfers to the islands, both from the rest of Portugal and from abroad.
Even though this information can be obtained from the regional accounts, which provide the monetary
values of supports coming mostly from Mainland Portugal and from the European Union, we did not
make this distinction. The reason is that we have assumed the same structure of public expenditures in the
islands regardless the source of financing. Thus, the p vector was estimated as a share of government
expenditures.
7
The first step was to disaggregate the Azorean data into the 9 islands, using information
provided by the Serviço Regional de Estatística dos Açores (SREA) on employment by
sector and by island, average wages per island and average wages per sector in the
whole of Portugal, the balance of supply and demand per sector in each one of the
islands, and on the distances between the islands corrected for the cost of embark and
disembark.6
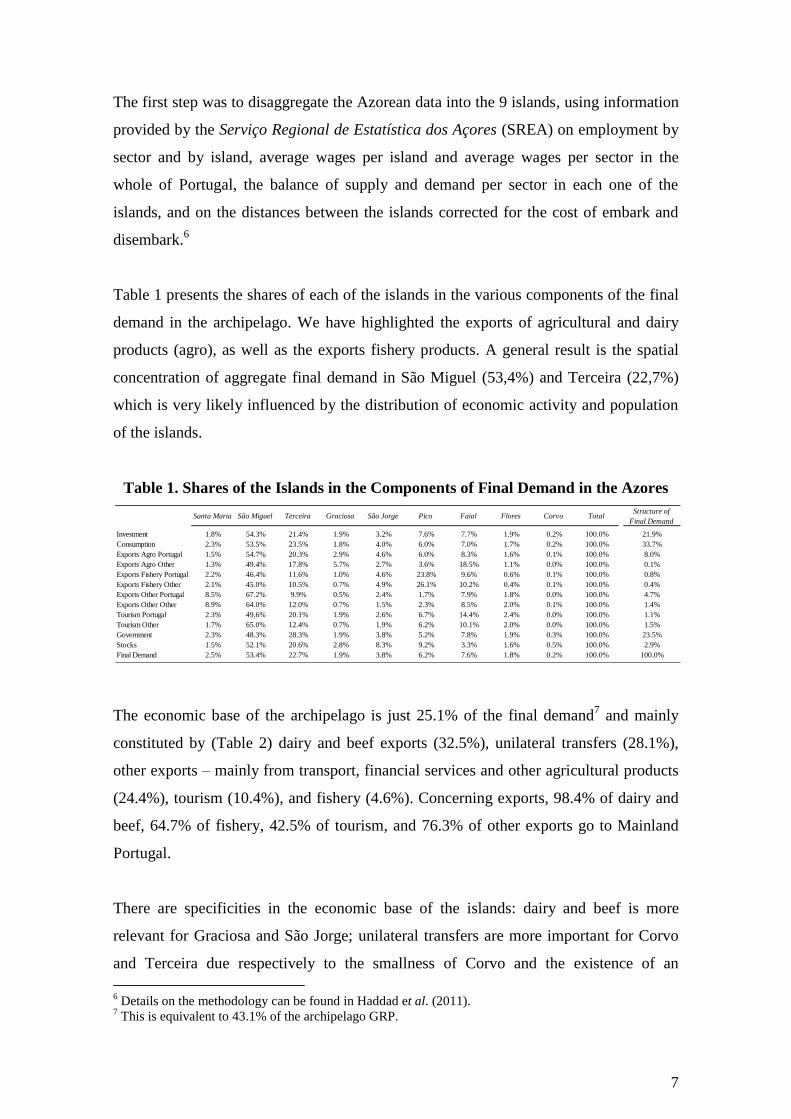
Table 1 presents the shares of each of the islands in the various components of the final
demand in the archipelago. We have highlighted the exports of agricultural and dairy
products (agro), as well as the exports fishery products. A general result is the spatial
concentration of aggregate final demand in São Miguel (53,4%) and Terceira (22,7%)
which is very likely influenced by the distribution of economic activity and population
of the islands.
Table 1. Shares of the Islands in the Components of Final Demand in the Azores
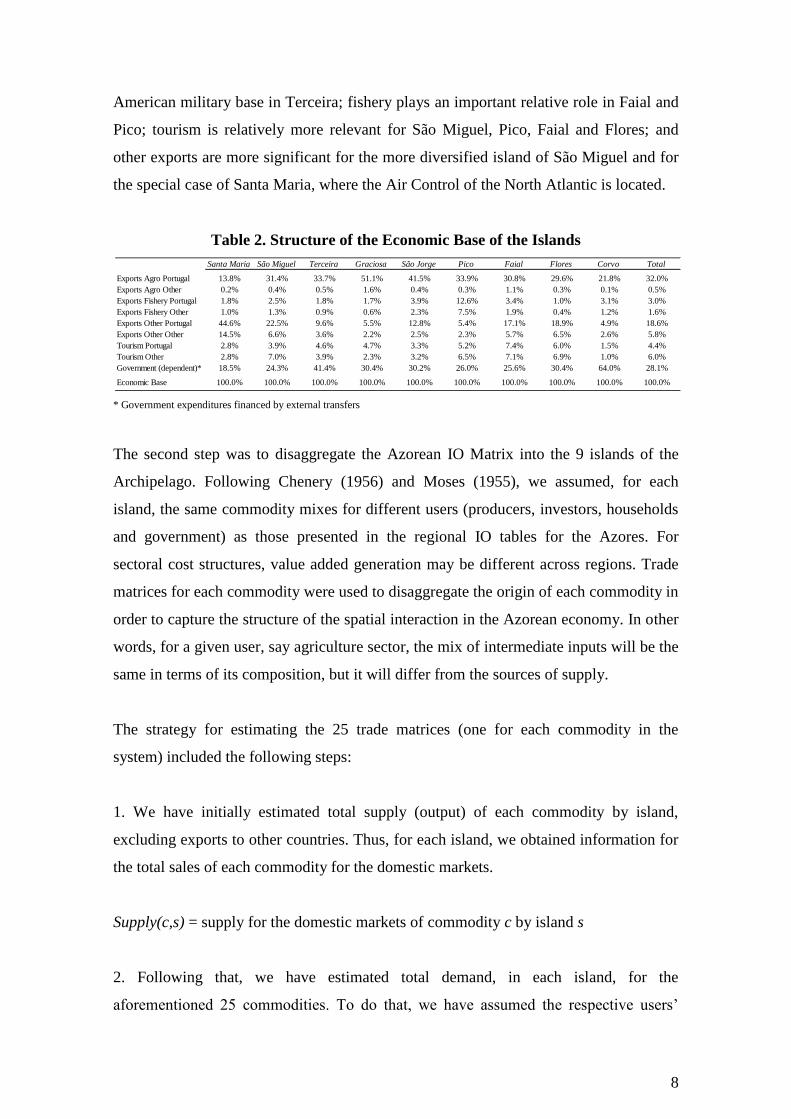
The economic base of the archipelago is just 25.1% of the final demand7 and mainly
constituted by (Table 2) dairy and beef exports (32.5%), unilateral transfers (28.1%),
other exports – mainly from transport, financial services and other agricultural products
(24.4%), tourism (10.4%), and fishery (4.6%). Concerning exports, 98.4% of dairy and
beef, 64.7% of fishery, 42.5% of tourism, and 76.3% of other exports go to Mainland
Portugal.
There are specificities in the economic base of the islands: dairy and beef is more
relevant for Graciosa and São Jorge; unilateral transfers are more important for Corvo
and Terceira due respectively to the smallness of Corvo and the existence of an
6 Details on the methodology can be found in Haddad et al. (2011).
7 This is equivalent to 43.1% of the archipelago GRP.
Santa Maria São Miguel Terceira Graciosa São Jorge Pico Faial Flores Corvo TotalStructure of
Final Demand
Investment 1.8% 54.3% 21.4% 1.9% 3.2% 7.6% 7.7% 1.9% 0.2% 100.0% 21.9%
Consumption 2.3% 53.5% 23.5% 1.8% 4.0% 6.0% 7.0% 1.7% 0.2% 100.0% 33.7%
Exports Agro Portugal 1.5% 54.7% 20.3% 2.9% 4.6% 6.0% 8.3% 1.6% 0.1% 100.0% 8.0%
Exports Agro Other 1.3% 49.4% 17.8% 5.7% 2.7% 3.6% 18.5% 1.1% 0.0% 100.0% 0.1%
Exports Fishery Portugal 2.2% 46.4% 11.6% 1.0% 4.6% 23.8% 9.6% 0.6% 0.1% 100.0% 0.8%
Exports Fishery Other 2.1% 45.0% 10.5% 0.7% 4.9% 26.1% 10.2% 0.4% 0.1% 100.0% 0.4%
Exports Other Portugal 8.5% 67.2% 9.9% 0.5% 2.4% 1.7% 7.9% 1.8% 0.0% 100.0% 4.7%
Exports Other Other 8.9% 64.0% 12.0% 0.7% 1.5% 2.3% 8.5% 2.0% 0.1% 100.0% 1.4%
Tourism Portugal 2.3% 49.6% 20.1% 1.9% 2.6% 6.7% 14.4% 2.4% 0.0% 100.0% 1.1%
Tourism Other 1.7% 65.0% 12.4% 0.7% 1.9% 6.2% 10.1% 2.0% 0.0% 100.0% 1.5%
Government 2.3% 48.3% 28.3% 1.9% 3.8% 5.2% 7.8% 1.9% 0.3% 100.0% 23.5%
Stocks 1.5% 52.1% 20.6% 2.8% 8.3% 9.2% 3.3% 1.6% 0.5% 100.0% 2.9%
Final Demand 2.5% 53.4% 22.7% 1.9% 3.8% 6.2% 7.6% 1.8% 0.2% 100.0% 100.0%
8
American military base in Terceira; fishery plays an important relative role in Faial and
Pico; tourism is relatively more relevant for São Miguel, Pico, Faial and Flores; and
other exports are more significant for the more diversified island of São Miguel and for
the special case of Santa Maria, where the Air Control of the North Atlantic is located.
Table 2. Structure of the Economic Base of the Islands
* Government expenditures financed by external transfers
The second step was to disaggregate the Azorean IO Matrix into the 9 islands of the
Archipelago. Following Chenery (1956) and Moses (1955), we assumed, for each
island, the same commodity mixes for different users (producers, investors, households
and government) as those presented in the regional IO tables for the Azores. For
sectoral cost structures, value added generation may be different across regions. Trade
matrices for each commodity were used to disaggregate the origin of each commodity in
order to capture the structure of the spatial interaction in the Azorean economy. In other
words, for a given user, say agriculture sector, the mix of intermediate inputs will be the
same in terms of its composition, but it will differ from the sources of supply.
The strategy for estimating the 25 trade matrices (one for each commodity in the
system) included the following steps:
1. We have initially estimated total supply (output) of each commodity by island,
excluding exports to other countries. Thus, for each island, we obtained information for
the total sales of each commodity for the domestic markets.
Supply(c,s) = supply for the domestic markets of commodity c by island s
2. Following that, we have estimated total demand, in each island, for the
aforementioned 25 commodities. To do that, we have assumed the respective users’
Santa Maria São Miguel Terceira Graciosa São Jorge Pico Faial Flores Corvo Total
Exports Agro Portugal 13.8% 31.4% 33.7% 51.1% 41.5% 33.9% 30.8% 29.6% 21.8% 32.0%
Exports Agro Other 0.2% 0.4% 0.5% 1.6% 0.4% 0.3% 1.1% 0.3% 0.1% 0.5%
Exports Fishery Portugal 1.8% 2.5% 1.8% 1.7% 3.9% 12.6% 3.4% 1.0% 3.1% 3.0%
Exports Fishery Other 1.0% 1.3% 0.9% 0.6% 2.3% 7.5% 1.9% 0.4% 1.2% 1.6%
Exports Other Portugal 44.6% 22.5% 9.6% 5.5% 12.8% 5.4% 17.1% 18.9% 4.9% 18.6%
Exports Other Other 14.5% 6.6% 3.6% 2.2% 2.5% 2.3% 5.7% 6.5% 2.6% 5.8%
Tourism Portugal 2.8% 3.9% 4.6% 4.7% 3.3% 5.2% 7.4% 6.0% 1.5% 4.4%
Tourism Other 2.8% 7.0% 3.9% 2.3% 3.2% 6.5% 7.1% 6.9% 1.0% 6.0%
Government (dependent)* 18.5% 24.3% 41.4% 30.4% 30.2% 26.0% 25.6% 30.4% 64.0% 28.1%
Economic Base 100.0% 100.0% 100.0% 100.0% 100.0% 100.0% 100.0% 100.0% 100.0% 100.0%
9
structure of demand followed the Azorean pattern. With the island levels of sectoral
production, investment demand, household demand and government demand, we have
estimated the initial values of total demand for each commodity in each island, from
which the demand for imported commodities were deducted. The resulting estimates,
which represent the island total demand for Azorean goods, were then adjusted so that,
for each commodity, demand across islands equals supply across islands.
Demand(c,d) = demand of commodity c by island d
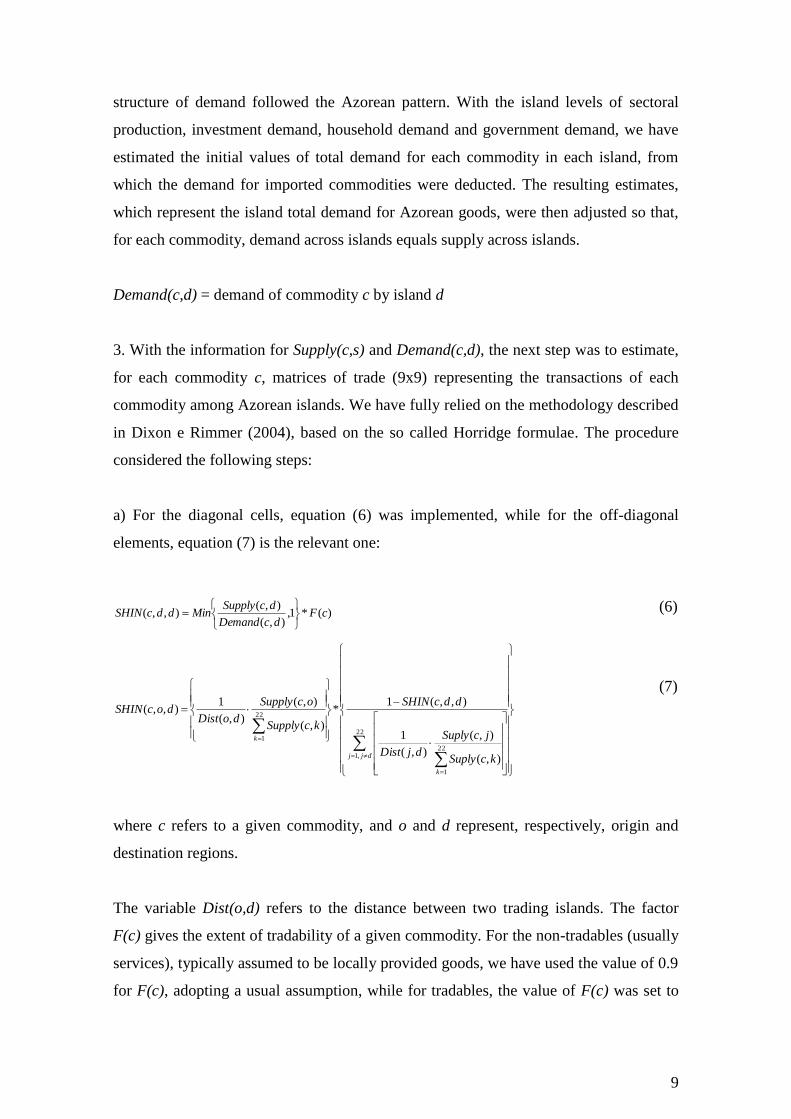
3. With the information for Supply(c,s) and Demand(c,d), the next step was to estimate,
for each commodity c, matrices of trade (9x9) representing the transactions of each
commodity among Azorean islands. We have fully relied on the methodology described
in Dixon e Rimmer (2004), based on the so called Horridge formulae. The procedure
considered the following steps:
a) For the diagonal cells, equation (6) was implemented, while for the off-diagonal
elements, equation (7) is the relevant one:
)(*1,),(
),(),,( cF
dcDemand
dcSupplyMinddcSHIN
(6)
22
,122
1
22
1
),(
),(
),(
1
),,(1*
),(
),(
),(
1),,(
djj
k
k
kcSuply
jcSuply
djDist
ddcSHIN
kcSupply
ocSupply
doDistdocSHIN
(7)
where c refers to a given commodity, and o and d represent, respectively, origin and
destination regions.
The variable Dist(o,d) refers to the distance between two trading islands. The factor
F(c) gives the extent of tradability of a given commodity. For the non-tradables (usually
services), typically assumed to be locally provided goods, we have used the value of 0.9
for F(c), adopting a usual assumption, while for tradables, the value of F(c) was set to
10
0.5. It can be shown that the column sums in the resulting matrices add to one. What
these matrices show are the supply-adjusted shares of each island in the specific
commodity demand by each island of destination.
Once these share coefficients are calculated, we then distribute the demand of
commodity c by region d (Demand(c,d)) across the corresponding columns of the SHIN
matrices. Once we adopt this procedure, we have to further adjust the matrices to make
sure that supply and demand balance. This is done through a RAS procedure.
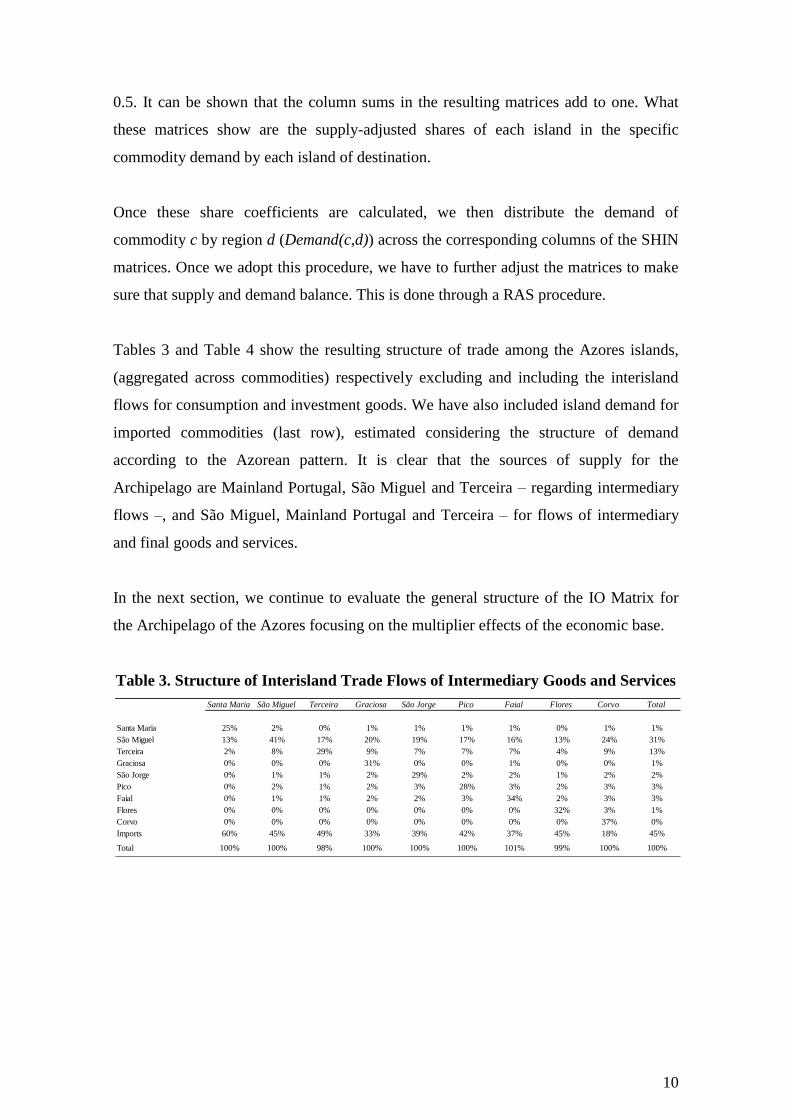
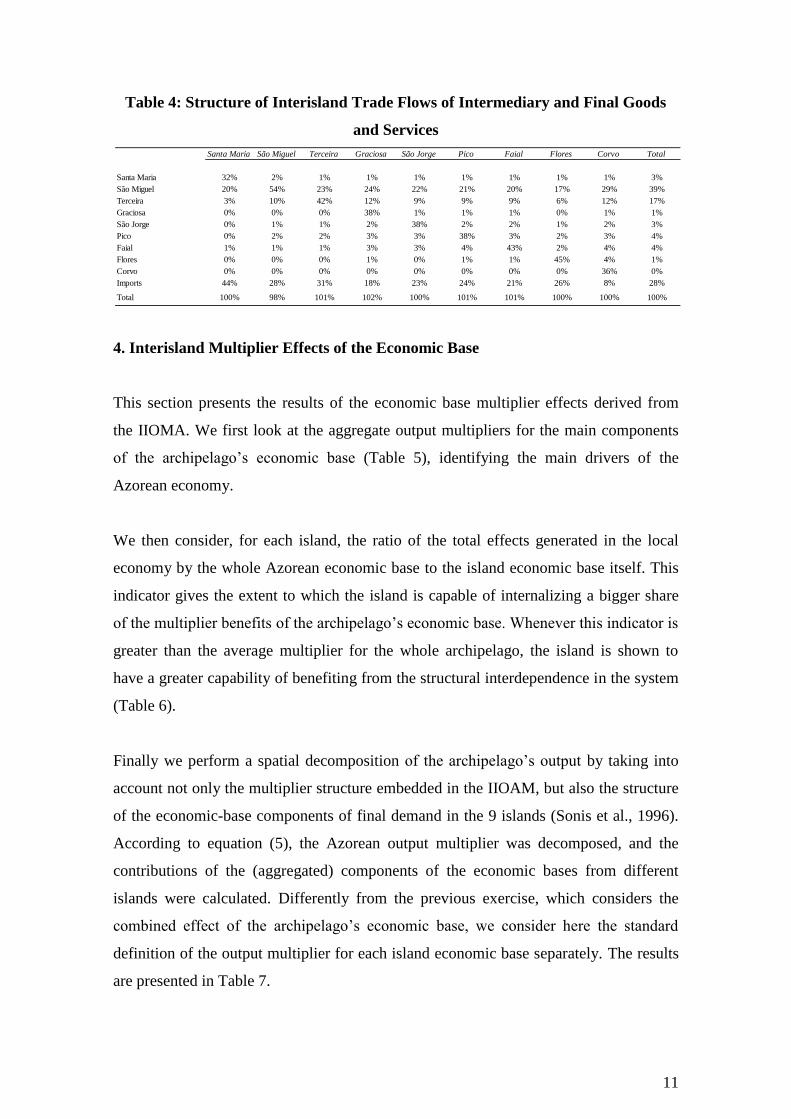
Tables 3 and Table 4 show the resulting structure of trade among the Azores islands,
(aggregated across commodities) respectively excluding and including the interisland
flows for consumption and investment goods. We have also included island demand for
imported commodities (last row), estimated considering the structure of demand
according to the Azorean pattern. It is clear that the sources of supply for the
Archipelago are Mainland Portugal, São Miguel and Terceira – regarding intermediary
flows –, and São Miguel, Mainland Portugal and Terceira – for flows of intermediary
and final goods and services.
In the next section, we continue to evaluate the general structure of the IO Matrix for
the Archipelago of the Azores focusing on the multiplier effects of the economic base.
Table 3. Structure of Interisland Trade Flows of Intermediary Goods and Services
Santa Maria São Miguel Terceira Graciosa São Jorge Pico Faial Flores Corvo Total
Santa Maria 25% 2% 0% 1% 1% 1% 1% 0% 1% 1%
São Miguel 13% 41% 17% 20% 19% 17% 16% 13% 24% 31%
Terceira 2% 8% 29% 9% 7% 7% 7% 4% 9% 13%
Graciosa 0% 0% 0% 31% 0% 0% 1% 0% 0% 1%
São Jorge 0% 1% 1% 2% 29% 2% 2% 1% 2% 2%
Pico 0% 2% 1% 2% 3% 28% 3% 2% 3% 3%
Faial 0% 1% 1% 2% 2% 3% 34% 2% 3% 3%
Flores 0% 0% 0% 0% 0% 0% 0% 32% 3% 1%
Corvo 0% 0% 0% 0% 0% 0% 0% 0% 37% 0%
Imports 60% 45% 49% 33% 39% 42% 37% 45% 18% 45%
Total 100% 100% 98% 100% 100% 100% 101% 99% 100% 100%
11
Table 4: Structure of Interisland Trade Flows of Intermediary and Final Goods
and Services
4. Interisland Multiplier Effects of the Economic Base
This section presents the results of the economic base multiplier effects derived from
the IIOMA. We first look at the aggregate output multipliers for the main components
of the archipelago’s economic base (Table 5), identifying the main drivers of the
Azorean economy.
We then consider, for each island, the ratio of the total effects generated in the local
economy by the whole Azorean economic base to the island economic base itself. This
indicator gives the extent to which the island is capable of internalizing a bigger share
of the multiplier benefits of the archipelago’s economic base. Whenever this indicator is
greater than the average multiplier for the whole archipelago, the island is shown to
have a greater capability of benefiting from the structural interdependence in the system
(Table 6).
Finally we perform a spatial decomposition of the archipelago’s output by taking into
account not only the multiplier structure embedded in the IIOAM, but also the structure
of the economic-base components of final demand in the 9 islands (Sonis et al., 1996).
According to equation (5), the Azorean output multiplier was decomposed, and the
contributions of the (aggregated) components of the economic bases from different
islands were calculated. Differently from the previous exercise, which considers the
combined effect of the archipelago’s economic base, we consider here the standard
definition of the output multiplier for each island economic base separately. The results
are presented in Table 7.
Santa Maria São Miguel Terceira Graciosa São Jorge Pico Faial Flores Corvo Total
Santa Maria 32% 2% 1% 1% 1% 1% 1% 1% 1% 3%
São Miguel 20% 54% 23% 24% 22% 21% 20% 17% 29% 39%
Terceira 3% 10% 42% 12% 9% 9% 9% 6% 12% 17%
Graciosa 0% 0% 0% 38% 1% 1% 1% 0% 1% 1%
São Jorge 0% 1% 1% 2% 38% 2% 2% 1% 2% 3%
Pico 0% 2% 2% 3% 3% 38% 3% 2% 3% 4%
Faial 1% 1% 1% 3% 3% 4% 43% 2% 4% 4%
Flores 0% 0% 0% 1% 0% 1% 1% 45% 4% 1%
Corvo 0% 0% 0% 0% 0% 0% 0% 0% 36% 0%
Imports 44% 28% 31% 18% 23% 24% 21% 26% 8% 28%
Total 100% 98% 101% 102% 100% 101% 101% 100% 100% 100%
12
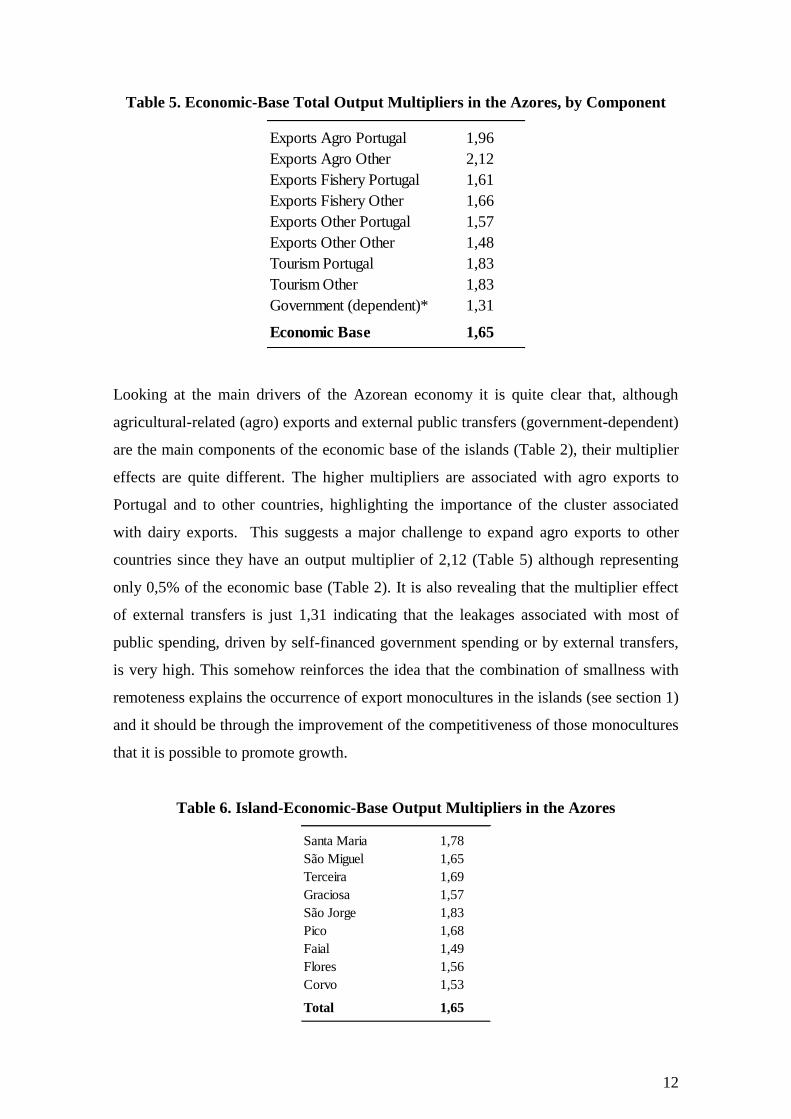
Table 5. Economic-Base Total Output Multipliers in the Azores, by Component
Looking at the main drivers of the Azorean economy it is quite clear that, although
agricultural-related (agro) exports and external public transfers (government-dependent)
are the main components of the economic base of the islands (Table 2), their multiplier
effects are quite different. The higher multipliers are associated with agro exports to
Portugal and to other countries, highlighting the importance of the cluster associated
with dairy exports. This suggests a major challenge to expand agro exports to other
countries since they have an output multiplier of 2,12 (Table 5) although representing
only 0,5% of the economic base (Table 2). It is also revealing that the multiplier effect
of external transfers is just 1,31 indicating that the leakages associated with most of
public spending, driven by self-financed government spending or by external transfers,
is very high. This somehow reinforces the idea that the combination of smallness with
remoteness explains the occurrence of export monocultures in the islands (see section 1)
and it should be through the improvement of the competitiveness of those monocultures
that it is possible to promote growth.
Table 6. Island-Economic-Base Output Multipliers in the Azores
Exports Agro Portugal 1,96
Exports Agro Other 2,12
Exports Fishery Portugal 1,61
Exports Fishery Other 1,66
Exports Other Portugal 1,57
Exports Other Other 1,48
Tourism Portugal 1,83
Tourism Other 1,83
Government (dependent)* 1,31
Economic Base 1,65
Santa Maria 1,78
São Miguel 1,65
Terceira 1,69
Graciosa 1,57
São Jorge 1,83
Pico 1,68
Faial 1,49
Flores 1,56
Corvo 1,53
Total 1,65
13
The results of Table 6 can be explained by the smallness and remoteness of the different
islands that compose the Azorean Archipelago, as well as the spatial hierarchy within
the Azores. As expected, the economic base of São Miguel, representing more than half
of the islands’ economy, presents a multiplier effect of its economic base very close to
the multiplier effect of the economic base of the archipelago. With exception of Santa
Maria, very much closed and linked to São Miguel, all the other smaller and more
remote islands – Graciosa, Faial, Flores and Corvo – have stronger leakages associated
with their economic base multiplier effects when compared to the average economic
base multiplier effect of the Azores. Furthermore, the islands that present relatively
lower leakages than the average are relatively larger and are also closer to each other –
Terceira, Pico and São Jorge.
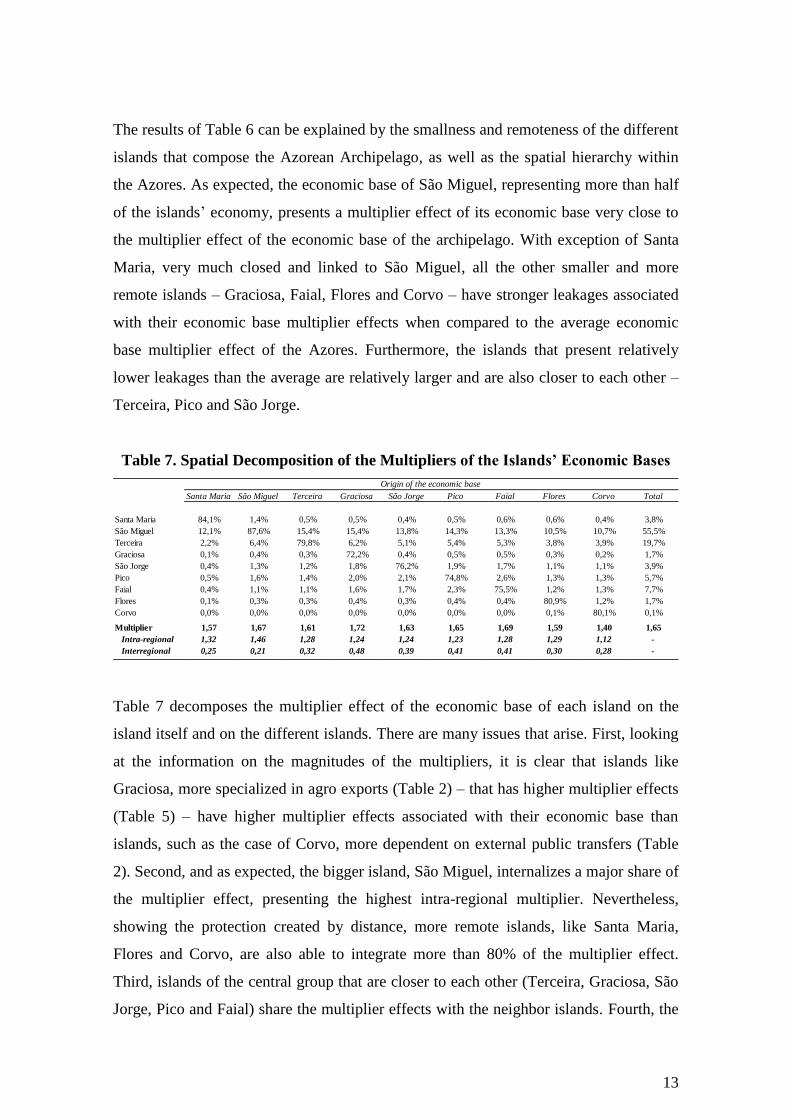
Table 7. Spatial Decomposition of the Multipliers of the Islands’ Economic Bases
Table 7 decomposes the multiplier effect of the economic base of each island on the
island itself and on the different islands. There are many issues that arise. First, looking
at the information on the magnitudes of the multipliers, it is clear that islands like
Graciosa, more specialized in agro exports (Table 2) – that has higher multiplier effects
(Table 5) – have higher multiplier effects associated with their economic base than
islands, such as the case of Corvo, more dependent on external public transfers (Table
2). Second, and as expected, the bigger island, São Miguel, internalizes a major share of
the multiplier effect, presenting the highest intra-regional multiplier. Nevertheless,
showing the protection created by distance, more remote islands, like Santa Maria,
Flores and Corvo, are also able to integrate more than 80% of the multiplier effect.
Third, islands of the central group that are closer to each other (Terceira, Graciosa, São
Jorge, Pico and Faial) share the multiplier effects with the neighbor islands. Fourth, the
Santa Maria São Miguel Terceira Graciosa São Jorge Pico Faial Flores Corvo Total
Santa Maria 84,1% 1,4% 0,5% 0,5% 0,4% 0,5% 0,6% 0,6% 0,4% 3,8%
São Miguel 12,1% 87,6% 15,4% 15,4% 13,8% 14,3% 13,3% 10,5% 10,7% 55,5%
Terceira 2,2% 6,4% 79,8% 6,2% 5,1% 5,4% 5,3% 3,8% 3,9% 19,7%
Graciosa 0,1% 0,4% 0,3% 72,2% 0,4% 0,5% 0,5% 0,3% 0,2% 1,7%
São Jorge 0,4% 1,3% 1,2% 1,8% 76,2% 1,9% 1,7% 1,1% 1,1% 3,9%
Pico 0,5% 1,6% 1,4% 2,0% 2,1% 74,8% 2,6% 1,3% 1,3% 5,7%
Faial 0,4% 1,1% 1,1% 1,6% 1,7% 2,3% 75,5% 1,2% 1,3% 7,7%
Flores 0,1% 0,3% 0,3% 0,4% 0,3% 0,4% 0,4% 80,9% 1,2% 1,7%
Corvo 0,0% 0,0% 0,0% 0,0% 0,0% 0,0% 0,0% 0,1% 80,1% 0,1%
Multiplier 1,57 1,67 1,61 1,72 1,63 1,65 1,69 1,59 1,40 1,65
Intra-regional 1,32 1,46 1,28 1,24 1,24 1,23 1,28 1,29 1,12 -
Interregional 0,25 0,21 0,32 0,48 0,39 0,41 0,41 0,30 0,28 -
Origin of the economic base
14
bigger island of São Miguel and also, to some extent, the second biggest island
(Terceira) are able to capture some of the multiplier effects of the economic base of the
other islands revealing the centralities of the Archipelago. Finally, there are clear signs
of spatial spillovers between Faial and Pico made possible by the short distance (5 Km)
and interconnection (frequent ferryboat) between those two islands.
5. Concluding Remarks
The argument of this paper is that economic models for archipelagic regions should be
disaggregate into the different islands in order to understand the functioning of the
economy and to evaluate policy impacts more accurately. With the data available and
using IO disaggregation methodology, we show that: i) the economic structure of the
islands is quite different from each other; ii) the specific economic base of the islands
are also different and, as expected, the biggest islands not only capture an important part
of the impact of external pushes done in smaller islands but also they constitute
important drivers of smaller islands.
References
Almond, C. (2000). Product-to-product tables via product-technology with no negative
flows. Economic Systems Research, 12 (1):27-43.
Alves, Martins et al. (2004) – Sistemas de Matrizes Regionais de Input-Output para a
Região Autónoma dos Açores 1998. Relatório Metodológico e Resultados.
Subsecretário Regional do Planeamento e Assuntos Europeus. Direcção
Regional de Estudos e Planeamento, Abril de 2004.
Batten, D.F. and Boyce, D.E. (1986) Spatial Interaction, Transportation and
Interregional Commodity Flow Models. In P.Nijkamp, ed. Handbook of
Regional and Urban Economics, Volume I. Amsterdam, North-Holland, pp.357-
406.
Boyce, D. (2002) Combined Model of Interregional Commodity Flows on a
Transportation Network. In Trade, Networks and Hierachies, Modelling
Regional and Interregional Economies. Edited by Hewings, J.D.; Sonis, M. and
Boyce, D. Springer
15
Chenery, H. B. (1956). Interregional and International Input-Output Analysis. In: T.
Barna (ed.), The Structure Interdependence of the Economy, New York: Wiley,
pp. 341-356.
Chenery and Clark (1959) Interindustry economics. Wiley. New York.
Dentinho, TP (1995) – Information and Communication Technologies and Regional
Development. The case of the Azores dairy value chain. PhD Thesis. University
of Newcastle – upon – Tyne. United Kingdom.
Dixon, P. B. and Rimmer, M. T. (2004). Disaggregation of Results from a Detailed
General Equilibrium Model of the US to the State Level. General Working Paper
No. 145, Centre of Policy Studies, April.
Ferreira, P (2006) - Projecção Espacial da Tabela Input-Output dos Açores. Tese de
Mestrado. Departamento de Economia e Gestão. Universidade dos Açores.
Flegg, A. T. (1994) On the appropriate use of location quotients in generating regional
input-output tables. Regional Studies, 29(6): 547-561
Haddad, EH, Samaniego JMG, Porsse AA, Jimenez, DAO, Moreno WSO, Souza, LGA
(2011) - Interregional Input-Output System for Equador, 2007: Methodology
and Results. TD Nereus 03-2011, São Paulo.
Hewings,G.J.D.(1985): Regional Input-Output Analysis. Beverly Hills, Sage
Publications Inc.
Jackson, R. (2004) Alternative input-output matrix updating formulations. Economic
Systems Research, 16 (2):135-148.
Leontieff, W.W. (1951) The structure of the American economy, 1919-1939. Oxford
University Press, New York.
Leontieff W.W. et al. (1953): Studies in the Structure of the American Economy.
Oxford University Press, New York.
Miller, R. e Blair, P. (2009), Input-Output Analysis – Foundations and Extensions, 2.ª
Edition, Cambridge University Press. Cambridge, UK.
Monjardino, A (1989) – Os Açores no contexto do Atlântico. Relações transatlânticas
no limiar do século XXI, Universidade dos Açores, pg. 205-212.
Moses, L. N. (1955). The Stability of Interregional Trading Patterns and Input-Output
Analysis, American Economic Review, vol. XLV, no. 5, pp. 803-832.
Polenske, K.R. (1980) The U.S. Multiregional Input-Output Accounts and Model.
Lexington Books (D.C. Heath and Co.), Lexington, Mass.
16
Ramos, P and Sargento, A (2003) Estimating trade flows between Portuguese regions
using an input-output approach. 43th Congress of the European Regional
Science Association, Jywaskyla (Finland), August 27-30, 2003.
Robinson, S. & Cattaneo, M.E.- S. (2001) Updating and estimating a social accounting
matrix using cross entropy methods. Economic Systems Research, 13(1):47-64.
SREA (2006) – Matrizes Intersectoriais dos Açores, 2001. Serviço Regional de
Estatística dos Açores.
Wilson, A.G. (1970) Interregional Commodity Flows: Entropy Maximizing Procedures.
Geographical Analysis, 2, 255-282.
17
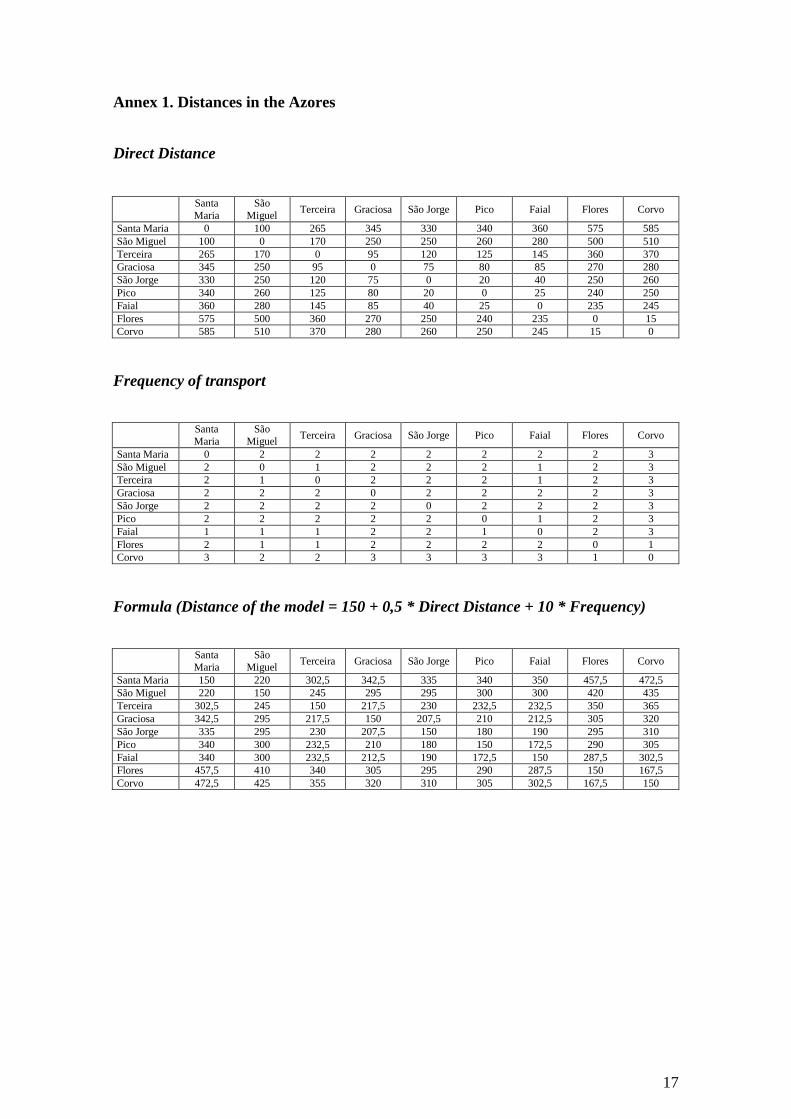
Annex 1. Distances in the Azores
Direct Distance
Santa
Maria
São
Miguel Terceira Graciosa São Jorge Pico Faial Flores Corvo
Santa Maria 0 100 265 345 330 340 360 575 585
São Miguel 100 0 170 250 250 260 280 500 510
Terceira 265 170 0 95 120 125 145 360 370
Graciosa 345 250 95 0 75 80 85 270 280
São Jorge 330 250 120 75 0 20 40 250 260
Pico 340 260 125 80 20 0 25 240 250
Faial 360 280 145 85 40 25 0 235 245
Flores 575 500 360 270 250 240 235 0 15
Corvo 585 510 370 280 260 250 245 15 0
Frequency of transport
Santa
Maria
São
Miguel Terceira Graciosa São Jorge Pico Faial Flores Corvo
Santa Maria 0 2 2 2 2 2 2 2 3
São Miguel 2 0 1 2 2 2 1 2 3
Terceira 2 1 0 2 2 2 1 2 3
Graciosa 2 2 2 0 2 2 2 2 3
São Jorge 2 2 2 2 0 2 2 2 3
Pico 2 2 2 2 2 0 1 2 3
Faial 1 1 1 2 2 1 0 2 3
Flores 2 1 1 2 2 2 2 0 1
Corvo 3 2 2 3 3 3 3 1 0
Formula (Distance of the model = 150 + 0,5 * Direct Distance + 10 * Frequency)
Santa
Maria
São
Miguel Terceira Graciosa São Jorge Pico Faial Flores Corvo
Santa Maria 150 220 302,5 342,5 335 340 350 457,5 472,5
São Miguel 220 150 245 295 295 300 300 420 435
Terceira 302,5 245 150 217,5 230 232,5 232,5 350 365
Graciosa 342,5 295 217,5 150 207,5 210 212,5 305 320
São Jorge 335 295 230 207,5 150 180 190 295 310
Pico 340 300 232,5 210 180 150 172,5 290 305
Faial 340 300 232,5 212,5 190 172,5 150 287,5 302,5
Flores 457,5 410 340 305 295 290 287,5 150 167,5
Corvo 472,5 425 355 320 310 305 302,5 167,5 150