muncie community schools - indiana presentation - mcs baule...scope of mcs september 2016 •serve...
TRANSCRIPT

Muncie Community Schools
Fiscal Situation & Deficit
Reduction Plan
Updated 5/1/2017

Scope of MCS September 2016• Serve children from age 3 to 22 and adults working towards a HS
diploma
• 5650 Traditional Students
• 597.5 Permanent Staff (24% reduction)
Administrators 33 (9% reduction)
Faculty 408 (9% reduction)
Non-certified Staff 149 ( 43% reduction)
• Fifteen Locations
Nine Elementary Schools (PK-5)
Two Middle Schools (6-8)
Muncie Central High School (9-12)
Muncie Area Career Center (9+)
Youth Opportunity Center (6-12)
Camp Adventure

Projections for September 2017• Serve children from age 3 to 22 and adults working towards a HS
diploma
• 5300 Traditional Students
• 528 Permanent Staff (13% reduction from 2016)
Administrators 27-29 (projected)
Faculty 365 (projected)
Non-certified Staff 140 (additional reductions in process)
Twelve Locations
Six Elementary Schools (PK-5)
Two Middle Schools (6-8)
Muncie Central High School (9-12)
Muncie Area Career Center (9+)
Youth Opportunity Center (6-12)
Camp Adventure

Enrollment Based upon Fall Reporting
4000
4500
5000
5500
6000
6500
7000
7500
2010 2011 2012 20132014
20152016
20172018
20192020
7212
70196940
6802
6602
6115
5893
56505569
5319
5109
4880
Yellow bar shows projected enrollment from Mike Reuter’s financial projections 3/6/2016

Finances: Calendar YearGeneral Fund Revenue v. Expenses
$35,000,000.00
$40,000,000.00
$45,000,000.00
$50,000,000.00
$55,000,000.00
$60,000,000.00
2008 2009 2010 2011 2012 2013 2014 2015 2016 2017 2018

General Fund Surplus/Deficit by Calendar Year
-$1,972,563.90
-$6,502,166.01
$3,464,728.53
-$1,660,552.42
-$4,328,262.23-$4,136,425.79
-$1,451,982.53-$1,759,887.60
-$4,653,826.80
-$679,056.00
-$8,000,000.00
-$6,000,000.00
-$4,000,000.00
-$2,000,000.00
$0.00
$2,000,000.00
$4,000,000.00
2007 2008 2009 2010 2011 2012 2013 2014 2015 2016

Long-term General Fund Structural Deficit
Calendar Year Revenue Expenses Deficit2007 $55,711,885.51 $57,684,449.41 -$1,972,563.90
2008 $49,822,771.73 $56,324,937.74 -$6,502,166.012009 $56,526,821.57 $53,062,093.04 $3,464,728.532010 $53,221,161.64 $54,881,714.06 -$1,660,552.422011 $50,729,780.46 $55,058,042.69 -$4,328,262.232012 $49,763,185.41 $53,899,611.20 -$4,136,425.792013 $50,284,264.41 $51,736,246.94 -$1,451,982.532014 $47,408,430.20 $49,168,317.80 -$1,759,887.602015 $43,493,646.96 $48,147,473.76 -$4,653,826.802016 $42,988,994.00 $43,668,050.00 -$679,056.00
Total -$23,679,994.75

Current Situation• Cash flow is at crisis point
• According to the State Board of Accounts Audit from 2015, $9.7 million* in unfunded liabilities from 2013, 2014 & 2015 remained
• Enrollment continues to decline at faster than predicted rates (Enrollment already lower than Performance Services 2014
study anticipated for 2021)
• Property Tax Caps have significant impact on MCS; second highest percentage loss in the state among school corporations
• No significant additional bonding authority
• No ability to fund capital projects within the current funding pattern
* Originally, stated $10.2 included $500K in restricted funds

Muncie Community Schools
Cash on Hand-Banks
12/31/2016
AVAILABLE CASH
Cash-Checking @ First Merchants Bank (4,237,543.65)
Cash-Payroll @ Old National Bank 32,016.69
Total Cash Available (4,205,526.96)
RESTRICTED CASH
JP Morgan Chase-Union Checking 717,418.56
JP Morgan Chase-Union HRA 771,241.72
Star Financial Bank Non-Union HRA 859.10
Star Financial Bank Non-Union Health Insurance Acct. 1,686.45
Star Financial Bank Non-Union "105" Acct. 34,065.42
JP Morgan Chase-Union "105" 41,297.21
JP Morgan Chase-Union Hi Yield Savings 350,761.95
Total Cash Available 1,917,330.41
TOTAL CASH IN BANKS
Total Cash in Banks (2,288,196.55)

Key Factors - Financial Indicator 2014-2015 Projected 2017-2018
Space Utilization Rate 71% 80%
(94% pending referendum)
Student:Teacher Ratio 13:1 14.77:1
Number of Administrators 49 28-29*
Number of Teachers 467 365
Past due bills from General
Fund
$9,755,837** $3,740,760***
*Depends upon grant funding: currently one administrator is entirely grant funded
** According to 4/2016 SBoA Audit
*** Projected

Key Factors - Academic
Indicator Current Status
High School Graduation rate 92.2% (Above state average)
AP course participation rate Participation up 82% over the past five
years
Dual credit participation rate Participation up 412% over the past five
years
Student discipline incidents Down 20% over last year
ISTEP+ Scores No failing schools
Extra-curricular participation Participation is up at all secondary
schools (60% at MCHS)
Vocational students 90% earned some type of industry
standard certification
Pre-school Students Began program this year currently
serving 43 students through community
grants

Reductions Already Made• $7,981,322.42 in annualized reductions
• $1,380,000.00 in one time revenue since 7/2015
• $419,059.32 Admin $3,205,425.90 Non-certified staff
• $357,700.00 Facilities $1,882,000 Teaching staff
• $97,637.20 Supplies & Equipment

Reductions In Process
•$1,333,000
•New Transportation Contract $1,100,000*
•Move to solar power for buildings $188,000
•Modify the way we pay routine bills $22,000
•Further streamline printing costs $25,000

Reductions made on 4/11/2017
•Reduction of administrative office support staff (3 positions) $151,423.00
Reductions made on 4/13/2017
•Closure of three elementary schools $2,919,725.00
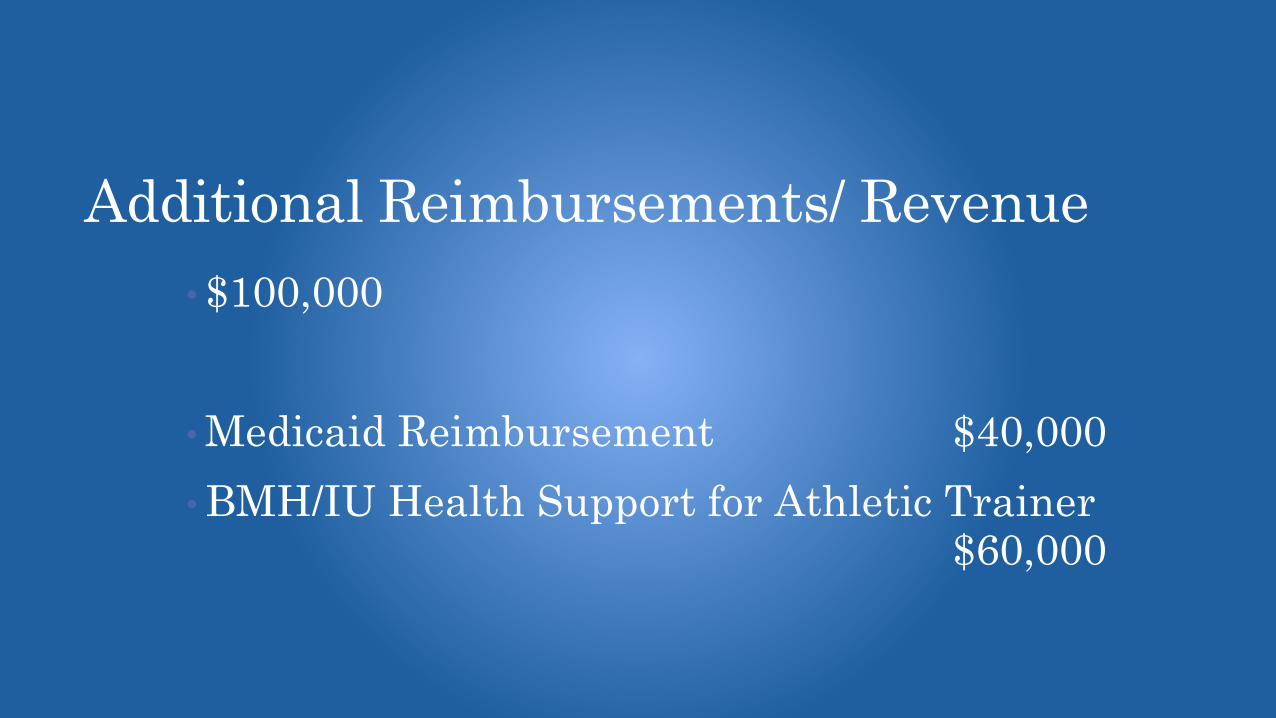
Additional Reimbursements/ Revenue
• $100,000
•Medicaid Reimbursement $40,000
•BMH/IU Health Support for Athletic Trainer$60,000
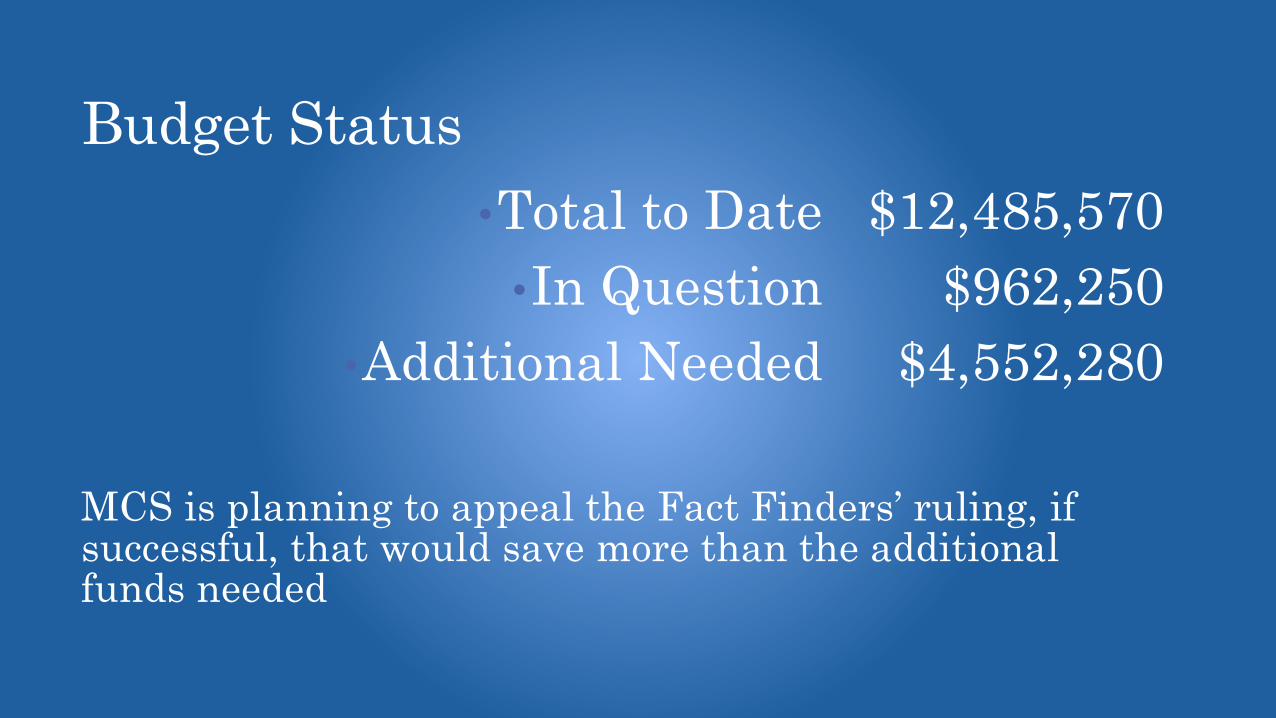
Budget Status
•Total to Date $12,485,570
•In Question $962,250
•Additional Needed $4,552,280
MCS is planning to appeal the Fact Finders’ ruling, if successful, that would save more than the additional funds needed

Facilities Maintenance ExpendituresCalendar Year Expenditures
$0
$500,000
$1,000,000
$1,500,000
$2,000,000
$2,500,000
$3,000,000
$3,500,000
$4,000,000
$4,500,000
2007 2008 2009 2010 2011 2012 2013 2014 2015 2016
$2,286,738 $2,090,518
$4,360,741
$1,049,778 $1,267,752
$1,740,752
$969,517
$497,145 $335,793
$551,872
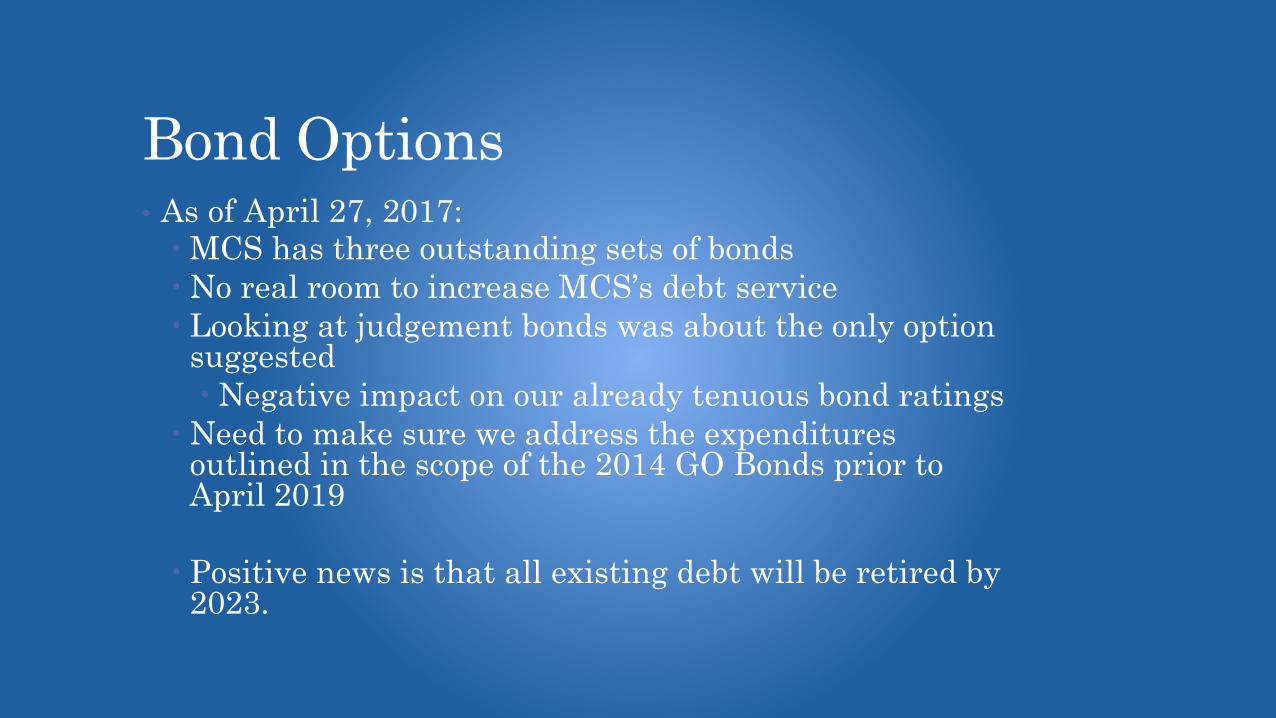
Bond Options• As of April 27, 2017:
MCS has three outstanding sets of bonds
No real room to increase MCS’s debt service
Looking at judgement bonds was about the only option suggested
Negative impact on our already tenuous bond ratings
Need to make sure we address the expenditures outlined in the scope of the 2014 GO Bonds prior to April 2019
Positive news is that all existing debt will be retired by 2023.


Grants & Partnerships
• Last year staff brought in more than $1.1 million in grant funding for MCS
87 Faculty & Staff received
123 individual grants
• An Example:
Partnership with Meridian Health Services have brought additional nine social services support personnel into schools

Next Steps• Review our existing vendor contracts to further reduce costs in food service, facilities
management and nursing services
• Review additional options for reducing health care insurance costs with teachers’ union (MTA); reconsider participation in the City of Muncie health clinic
• Review remaining instructional and support staffing to find additional ways to consolidate or eliminate positions
• Continue to find ways to automate existing clerical and administrative tasks in order to reduce administrative burdens and reduce clerical staffing
• Look for ways to collaborate with partners such as BSU to share services, obtain in kind services, etc.
• Look for ways to raise additional revenue through selling off real and other properties, advertising, naming rights, etc.
• Schedule a community referendum on whether or not to retain a two middle school solution for MCS (Nov. 2017?); If the referendum fails, MCS will combine NMS and SMS into a single middle school for 2018-2019.
• Set up a community-based financial advisory panel to help the MCS Board review financial options to address the ongoing financial issues

Action Proposed Timeline
Reduce eight administrative positions Acted on February 28, 2017
Reduce additional support staff positions Acted on April 11, 2017 & ongoing
Act to close three elementary schools Acted on April 13, 2017
Appeal IEERB Fact Finding opinion Filed on April 28, 2017; IEERB Hearing set for June 13, 2017
Establish a MCS Education Foundation to support
additional activities and programming
Next meeting set for April 24, 2017; should be completed prior to
January 1, 2018.
Meet with vendor partners to reduce contracts based upon
smaller physical footprint
Initial meetings set for April 25, 2017
Meet with MTA to discuss insurance cost savings proposals Set for May 15, 2017
Determine staffing for 2017-2018, making approximately 30-
50 FTE of certified reductions
Prior to June 1, 2017
Begin process to sell off surplus property or acquire renters In process, anticipate significant completion by October 1, 2017,
pending referendum
Develop a committee to consider a referendum for facilities
work and on whether or not to construct a new middle school
First meeting scheduled for April 20, 2017 (Referendum
tentatively planned for November 2017.)
Collaborate with BSU & Ivy Tech to consider ways to create
efficiencies
Ongoing; last BSU meeting, April 12, 2017; last Ivy Tech
meeting April 7, 2017
Collaborate with the City of Muncie to determine its
potential level of financial support
Prior to October 1, 2017
Establish a community advisory board to assist MCS in
reviewing its financial issues
Establish the board prior to June 15, 2017

Projected General Fund Balances
Indicator Cash Balance
Cash Balance 12/31/2016 (11,056,444)
Projected Cash Balance 12/31/2017 (9,375,254)
Projected Cash Balance 12/31/2018 (4,733,400)

Questions