munich personal repec archive - uni-muenchen.de · munich personal repec archive global stock...
TRANSCRIPT
MPRAMunich Personal RePEc Archive
Global Stock Markets Development andIntegration: with Special Reference toBRIC Countries
Krishna Reddy Chittedi
Centre for Development Studies –JNU, Trivandrum, Kerala
8. March 2009
Online at http://mpra.ub.uni-muenchen.de/18602/MPRA Paper No. 18602, posted 13. November 2009 18:52 UTC
1
Global Stock Markets Development and Integration: with Special Reference to
BRIC Countries
Krishna Reddy Chittedi Doctoral Scholar,
Centre for Development Studies –JNU Prashanth Nagar, Ullor
Trivandrum, Kerala, India Email: [email protected], [email protected]
Web page: http://people.cds.ac.in/krishna08d
Paper Presented in “Issues in Finance and Economic Development in Developing Countries
during Globalization Era” from 6th to 7th November, 2009, at Shri Ram College of
Commerce, University of Delhi.
2
Abstract
In a country like India where the stock market is undergoing significant transformation with
liberalization measures, and the analysis of the nature of integration with other developed and
emerging markets would not only give an idea of the possible gains to be reaped out of portfolio
diversification from Indian market, but may also provide some indication of the vulnerability of the
country’s stock market in case of a regional financial crisis and consequent reversal of capital flows
from the region. In the context the study examined the integration of the stock market among the
BRIC (Brazil, Russia, India and China) economies in general and their integration with the developed
countries stock markets such as US, UK and Japan, which can be analyzed by using the Granger
causality, Johansen co integration and Error correction Mechanism methodology, based on daily
data for the period January1998- Aug 2009. The results of co integration shows co integration
relationship found between BRIC countries and Developed countries namely USA, UK and Japan.
The results of Error correction model reveal that Sensex, Nikki225, moscowtimes, FTSE 100,
and Bovespa are significant. It implies that these markets share the forces of short run
adjustment to long run equilibrium.
Keywords: Stock Market integration, Johansen Julius co integration test, ECM, Engel Granger
Casualty test, emerging countries, developed countries
JEL Classification: F30, G15
3
Introduction
The global growth of stock markets and the emerging market boom have attracted the attention of
academics, practitioners, and policy makers. A number of countries, including India and China, are
reforming regulations and laws to foster stock market development and attract foreign portfolio flows.
The speed and extent of stock market development in developing countries have been unprecedented
and have led to fundamental shift both in the financial structures of less developed countries and in
the capital flows from developed nations. India has the distinction of having the second largest
number of listed companies after the USA. As per Standard and Poor’s Fact Book 2007, India ranked
8th in terms of market capitalization and 15th in terms of turnover ratio as of December 2007. India
posted a turnover ratio of 84% at end 2007. Recent research on stock market development shows that
modern communications technology and increased financial integration have resulted in more cross-
border capital flows, a stronger presence of financial firms around the world, and the migration of
stock exchange activities to international exchanges. Many firms in emerging markets now cross-list on
international exchanges, which provides them with lower cost capital and more liquidity-traded shares.
However, this also means that exchanges in emerging markets may not have enough financial activity
to sustain them, putting pressure on them to rethink their operations. One of the most enduring
debates in finance during the last decade is whether stock market integration causes economic growth
or whether increased economic growth is a consequence of financial development. This issue had been
extensively studied nearly three decades ago by Shaw (1973) and McKinnon (1973), who resulted in
significant evidence that financial development promotes economic growth, mainly through a raise in
the level of saving and investment.
In a country like India where the stock market is undergoing significant transformation with
liberalization measures, and the analysis of the nature of integration with other developed and
emerging markets would not only give an idea of the possible gains to be reaped out of portfolio
diversification from Indian market, but may also provide some indication of the vulnerability of the
country’s stock market in case of a regional financial crisis and consequent reversal of capital flows
from the region. The globalization of financial systems and the acceleration of information
transmission have increased the risk of financial crises, as a crisis in one country can spread to other
countries and bring about worldwide crises. However, in recent times, with the growing activities of
foreign portfolio investors who track international indices and continuously move funds between
4
markets, as well as further linkages with foreign markets through the route of ADR/GDR issues and
other channels, correlation between Indian and global stock markets has increased significantly
warranting a detailed in depth study.
The contribution of stock markets to economic growth
There is a lot of discussion about the relation of the stock markets and the economic growth of a
country. The main reasons for this phenomenon are that stock exchanges:
Increase liquidity and constitutes a mechanism for diversification of risk (risk management
device), therefore making market participants more prone to invest.
Improve the flow of information about activities of companies, which results to the
improvement of corporate control and eventually to better corporate governance. In other
words, the organizational and managerial structure of the corporations becomes more
effective.
Give the possibility to society’s savings to direct to alternative investment ways that are more
productive. Existence of an exchange increases the stock of funding available for riskier investment
projects prerequisite to economic growth. In general, it can be said that stock markets contribute to
both capital accumulation and technological innovation. It is very interesting to see stock market
development in emerging countries.
Stock Market Development in Emerging Markets
As economies grow and stock markets develop more, further development of stock markets leads to a
relative increase of equity financing in the economy. In other words, given that stock market
development depends on growth, the bank debt/equity ratio in the economy tends to increase at low
levels of capital accumulation and to decrease only when stock markets have reached a reasonable size.
The market capitalization of all listed companies taken together on all markets stood at US $ 64.56
trillion in 2007 up from US $ 53.38 trillion in 2006. The share of US in worldwide market
capitalization decreased from 36.39 % as at end-2006 to 30.90 % at end 2007, while Indian listed
companies accounted for 2.82% of total market capitalization as at end 2007 (an increase from 1.53%
at end of 2006). In 2007, United States reported the highest market capitalisation of US $ 19,947,284
million followed by China at US$ 6,226,305 million and Japan at US $4,453,475 million. Among the
top 20 countries by Market Capitalisation, 22 were from the developed markets while the other 18
were from the emerging market economies. India ranked 8th in the world with the market
capitalization of US $ 1,819,101 million.
5
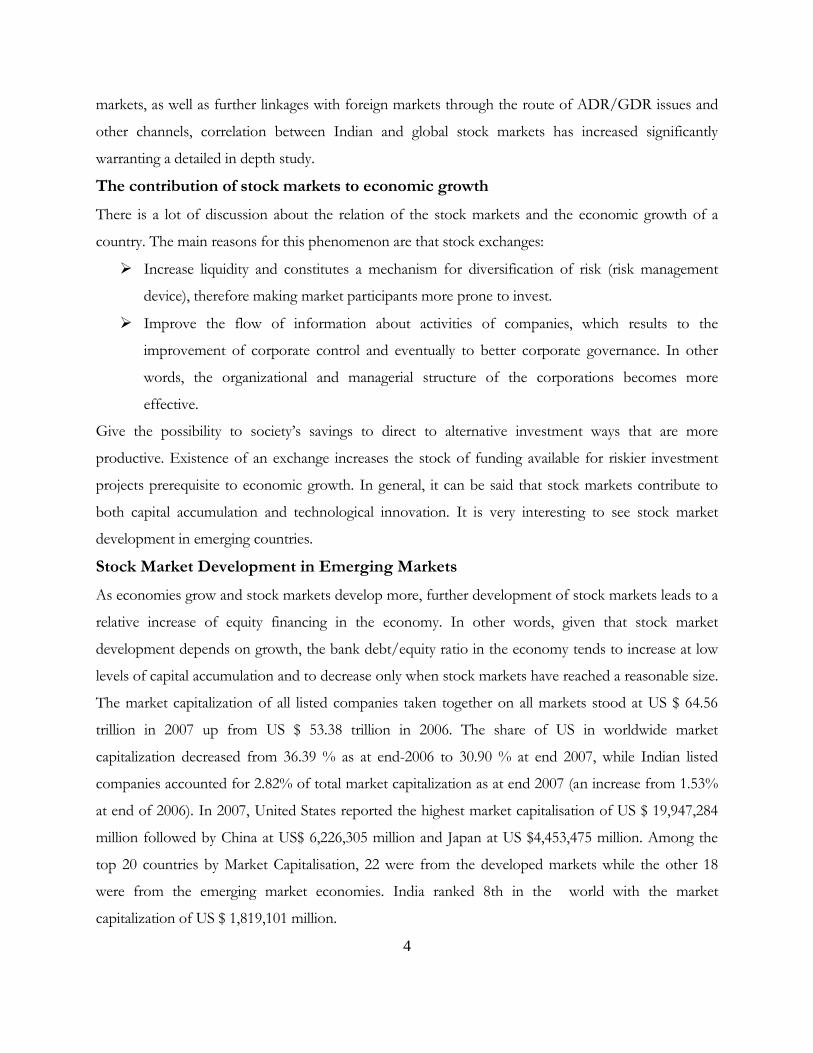
Figure 1
0 20 40 60 80 100 120 140 160 180 200
Brazil
India
China
Russia
Japan
USA
UK
Market Capitalisation as a % of GDP
2000 2006
Source: Indian Securities Market Review, 2008
The securities market facilitates the internationalization of an economy by linking it with the rest of the
world. This linkage assists through the inflow of capital in the form of portfolio investment. Moreover,
a strong domestic stock market performance forms the basis for well performing domestic corporate
to raise capital in the international market. This implies that the domestic economy is opened up to
international competitive pressures, which help to raise efficiency. It is also very likely that existence of
a domestic securities market will deter capital outflow by providing attractive investment opportunities
within domestic economy.
6
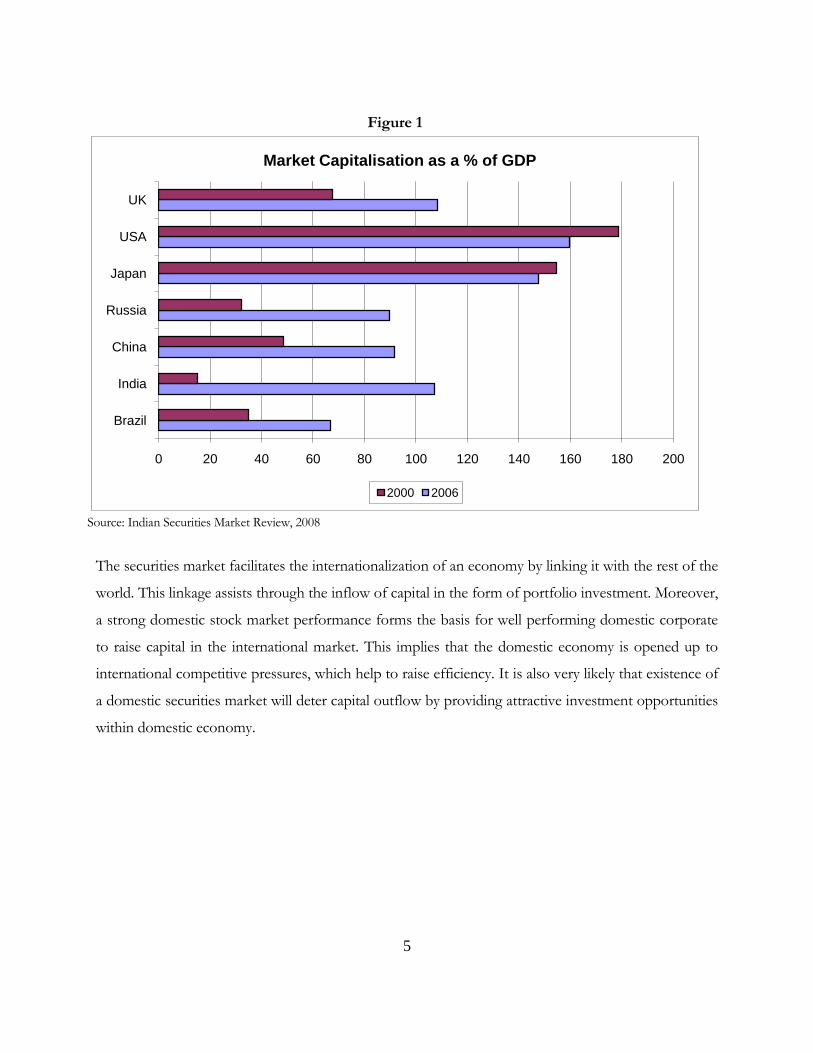
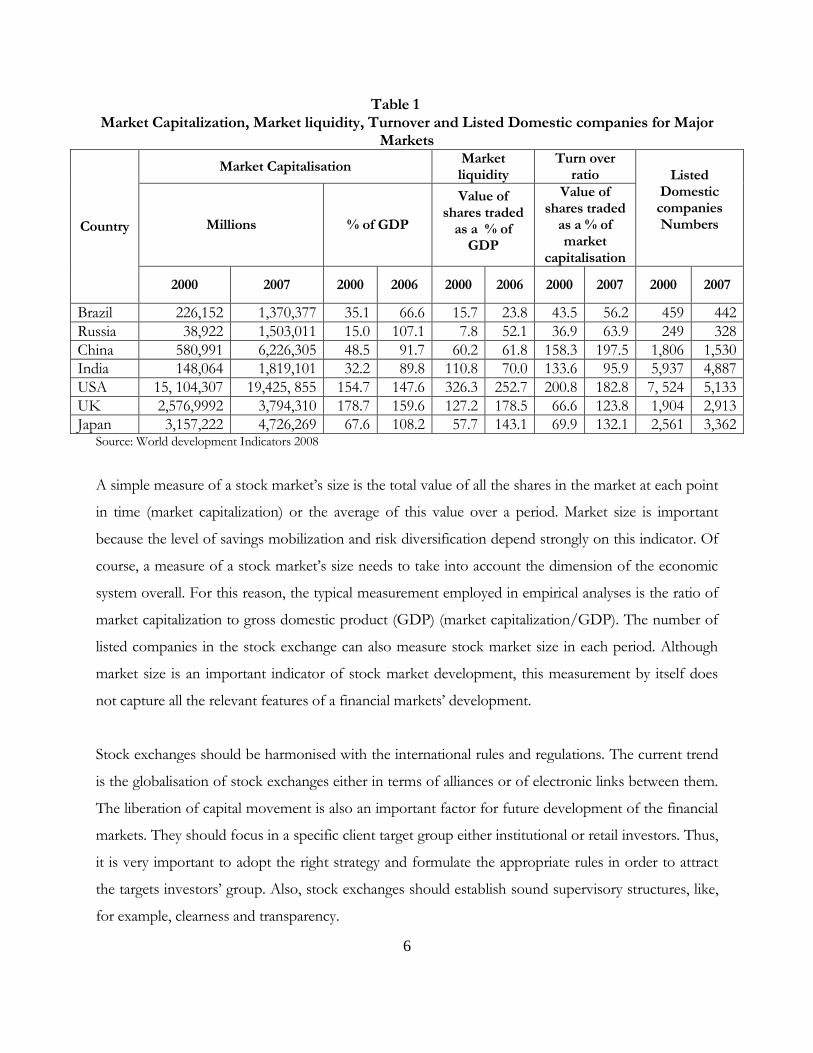
Table 1 Market Capitalization, Market liquidity, Turnover and Listed Domestic companies for Major
Markets
Country
Market Capitalisation Market liquidity
Turn over ratio Listed
Domestic companies Numbers
Millions % of GDP
Value of shares traded
as a % of GDP
Value of shares traded
as a % of market
capitalisation
2000 2007 2000 2006 2000 2006 2000 2007 2000 2007
Brazil 226,152 1,370,377 35.1 66.6 15.7 23.8 43.5 56.2 459 442
Russia 38,922 1,503,011 15.0 107.1 7.8 52.1 36.9 63.9 249 328
China 580,991 6,226,305 48.5 91.7 60.2 61.8 158.3 197.5 1,806 1,530
India 148,064 1,819,101 32.2 89.8 110.8 70.0 133.6 95.9 5,937 4,887
USA 15, 104,307 19,425, 855 154.7 147.6 326.3 252.7 200.8 182.8 7, 524 5,133
UK 2,576,9992 3,794,310 178.7 159.6 127.2 178.5 66.6 123.8 1,904 2,913
Japan 3,157,222 4,726,269 67.6 108.2 57.7 143.1 69.9 132.1 2,561 3,362 Source: World development Indicators 2008
A simple measure of a stock market’s size is the total value of all the shares in the market at each point
in time (market capitalization) or the average of this value over a period. Market size is important
because the level of savings mobilization and risk diversification depend strongly on this indicator. Of
course, a measure of a stock market’s size needs to take into account the dimension of the economic
system overall. For this reason, the typical measurement employed in empirical analyses is the ratio of
market capitalization to gross domestic product (GDP) (market capitalization/GDP). The number of
listed companies in the stock exchange can also measure stock market size in each period. Although
market size is an important indicator of stock market development, this measurement by itself does
not capture all the relevant features of a financial markets’ development.
Stock exchanges should be harmonised with the international rules and regulations. The current trend
is the globalisation of stock exchanges either in terms of alliances or of electronic links between them.
The liberation of capital movement is also an important factor for future development of the financial
markets. They should focus in a specific client target group either institutional or retail investors. Thus,
it is very important to adopt the right strategy and formulate the appropriate rules in order to attract
the targets investors’ group. Also, stock exchanges should establish sound supervisory structures, like,
for example, clearness and transparency.
7
Benefits and Costs of market integration
Theoretically, the integration of capital markets is ideal and preferable to segmentation, although there
are reservations concerning the feasibility of full-scale integration (Dornbusch, 1988). Several
arguments are presented for the desirability of international stock market integration. Based on
competitive auction-model, Akdogan (1995) pointed out that in case of no barriers to capital
movement, stock market integration leads to a more efficient allocation of the world's resources, and
capital will seek higher returns to investment, moving from capital market where capital is relatively
abundant to another where capital is relatively scarce. These characteristics of capital markets enable
the competitive auction-model to function more effectively to economically equilibrate the markets.
1. In case of integration among all stock markets, the systematic risk (market risk) becomes an
unsystematic risk (firm-specific risk), and this kind of risk can be diversified or eliminated away
by including the security as part of diversifiable portfolio.
2. It has been argued that corporate financial strategies depend on whether international stock
markets are integrated or not. In case of integrated market, all firms can raise their capital with
lower costs than firms do in a segmented market. Also capital budgeting decisions for firms
normally depends on their exposure to international capital that is the marginal cost of capital
of a firm that uses international sources is lower than the marginal cost of capital of firm that
uses only domestic sources.
Generally, any potential gain from the international diversification of a portfolio is inversely related to
the extent of stock market integration. A low correlation between returns of national and overseas
indices allows investors to minimize portfolio risk through international diversification. Thus, an
analysis of the long-run co-movement of national stock prices with that of overseas stock prices and
the short-run temporal relationship between the two is important for managing an international
portfolio. Additionally, interdependent international stock prices reflect economic integration in the
form of trade linkages and foreign direct investment. Co movement of underlying macroeconomic
variables across nations may lead to co-movement of stock prices.
However, integration, regional or global, is not without its costs. In a world with imperfect capital
markets, financial integration can heighten a country’s vulnerability to macroeconomic and financial
crisis. In particular, contagion and reversals in capital flows can result in higher output volatility and
8
even lower average growth for a certain periods. Regional integration might be even more costly if
sudden stops are more frequent within a region than globally.
Evidence about the link between financial integration and volatility is inconclusive (Rogoff et al 2006).
What seems clear is that countries with well-developed financial systems are less vulnerable to crisis,
but it is also true that financially developed countries are usually financially integrated with rest of the
world (Lane and Mislesi- ferretti 2006). More specifically, vulnerability is especially high if certain
institutions and polices are not in place before a country liberalizes its financial system (Demirguc-kunt
and Detragiache 1999). The string of international financial crises in the 1990’s demonstrated that
eliminating barriers to the international movement of certain types of financial capital might induce
volatility if countries do not have strong institutions and sound macroeconomic polices. Some have
also suggested that minimizing the risks of nitration requires the existence of well functioning
domestic financial markets (Alfaro et al 2005).
The rest of the paper is arranged as follows: section 2 gives a brief review of existing literature relevant
with this study. Section 3 the results of the empirical exercise. Section 4 concludes with a summary of
the results.
Review of Literature
In this chapter an attempt is made to present a review of select and recent studies relating to India and
outside, that are relevant to studies, the present topic.
Amanulla and Kamaiah (1995) conducted a study to examine the Indian stock market efficiency by
using Ravallion co integration and error correction market integration approaches. The data used are
the RBI monthly aggregate share indices relating to five regional stock exchanges in India, viz Bombay,
Calcutta, Madras, Delhi, Ahmedabad during 1980-1983. The study revealed a long-run equilibrium
relation between the price indices of five stock exchanges and error correction models indicated short
run deviation between the five regional stock exchanges. The study found that there is no evidence in
favour of market efficiency of Bombay, Madras, and Calcutta stock exchanges while contrary evidence
is found in case of Delhi and Ahmedabad.
9
Karajazyk (1995) found that the measure of market segmentation tends to be much larger for
emerging markets than for developed markets, which flows into or out of the emerging markets. The
measure tends to decrease over time, which is consistent with growing levels of integration. Large
values of adjusted mis-pricing occur around periods in which capital controls change significantly.
Finally, he found asymmetric integration relationship; stock markets of developed nations are more
integrated than those of emerging nations.
Janakiramanan and Lamba (1998) analyze the dynamic relationship between daily returns of eight
Pacific-Basin countries (Australia, Hong Kong, Japan, New Zealand, Singapore, Indonesia, Malaysia,
and Thailand) and the US over the period 1988-1996. The study uses vector autoregression (VAR),
The results exhibit a US influence on all other markets except for Indonesia, and when the study
excluded the US market from the VAR system it finds linkages between these markets, which in turn
and according to the study, are traced to the indirect influence of the US market. Also the study
finds a significant mutual influence between the markets that are geographically and economically
close to each other.
Ayuso and Blanco (1999) shown that during the 1990’s the linkages between national stock
exchanges seem to have increased. Not only as the weight of foreign assets in agents’ portfolio
increased but also have the correlation between stock indices and the ability of each market return to
explain the behavior of returns on other markets.
Scheicher (2001) studies the regional and global integration of stock markets in Hungary, Poland and
the Czech Republic and finds evidence of limited interaction: in returns, both regional and global
shocks are identified, but innovations to volatility exhibit a chiefly regional character. The markets
exhibit low correlations with international markets as well.
Chittedi (2007) Granger causality test results show that The US, Japan and France markets influences
Indian stock market. The UK and Australian markets have not influence the India. Similarly, in case of
UK, Japan and France, short run changes in the stock markets have a positive impact on short-run
changes in Indian stock market. In the case of the US, stock market has shown negative impact on
short run changes in Indian stock market. Though the results of the study are some what mixed, the
10
weight of evidence indicates that the stock market in India moves closely with the markets of the
developed countries.
Based on these theoretical postulates, financial integration at the empirical level is studied using several
de jure and de facto measures, although the latter, reflecting the actual degree of market linkages, have
been more popular (Prasad et al (2006), Yu et al (2007)). Following the seminal works of Engle and
Granger (1987), Johansen (1988) and Johansen and Juselius (1990), numerous studies beginning with
Taylor and Tonks (1989), Kasa (1992) and, subsequently, Masih and Masih (2001), Chowdhry (1997)
and Chowdhry et al (2007), among several others in the applied finance literature, have used the co
integration hypothesis to assess the international integration of financial markets. Until Taylor and
Tonks (1989) and Kasa (1992), studies relied on correlation and regression analyses to gauge the nature
of price convergence and international portfolio diversification across markets (Levy and Sarnat
(1970), Agmon (1972), Solnik (1974) and Panton et al (1976)). Kasa (1992) suggested that the short-
term return correlation between stock markets is not appropriate from the perspective of long-horizon
investors driven by common stochastic trends. A co integration model is useful since it not only
distinguishes between the nature of long-run and of short-run linkages among financial markets, but
captures the interaction between them as well. Given the wide popularity of the co integration
hypothesis, we refrain from rehashing the algebra of this methodology. What is striking about the
empirical literature is that studies on the subject have brought to the fore various useful perspectives
relating to price equalization, market equilibrium, market efficiency and portfolio diversification
(Chowdhry et al (2007)). Some of the studies investigated the relationship between international
integration and economic growth (Edison, klien et al. 2002, Edison, Levine et al. 2002; vo 2005a)
Obstfeld and Taylor (2001) provide a historical review of financial integration and capital markets.
Adam et al. (2002) investigated the capital market integration in the European Union. Prasad et al.
(2003) offer evidence on the effects of financial international integration on developing countries
The review reveals that the stock markets of different countries are both within and across the
country. Most of the studies confirm that when a security listed in both developed and emerging stock
markets, the price of such a security is mainly influenced by the shocks generated in the developed
market. Though there are a number of studies to test the stock market integration, only very few of
them revealed the genesis or causes of such a behavior of stock markets. Again, though there is a
11
continuous effort to conduct such a study in the developed countries, it is very rare in the emerging
countries like India and so far no study especially on BRIC markets.
Objective:
Given the background of the study, the main objective of this study is to examine stock market
integration among the emerging and developed countries. To attain this purpose, the study has set the
following specific objective:
i) To examine the integration of the stock market among the BRIC (Brazil, Russia, India and
China) nations in general and their integration with the developed countries stock markets
such as US, UK and Japan.
Nature and Source of Data
The study comprises daily stock market indices at closing times as collected from the
www.econstats.com and the validity of the data was checked from respective stock exchange
websites. Accordingly, our data series consist of the daily index values of the, NASDAQ, FTSE-100,
NIKKEI-225, Bovespa, Moscowtimes, Sensex and Shanghai for US, UK, Japan, Brazil, Russia, India
and China respectively. The period of study is based on the collected data series 1998 -2008.
Section III
Empirical results and Analysis:
To examine the stationary property of all the variables used in our study, we have carried out the ADF,
PP and KPSS unit roots. All the tests have been conducted both with intercept and with intercept and
trend, without intercept. Stock market integration between India and other BRIC countries and
developed countries (US, UK, and Japan,) is explained here with the help of co-integration techniques.
Hence, it is a necessary condition that the variables that appear in the stock market integration should
not be integrated of order zero i.e. (I (0). At the same time, it should be of the same order as variables
of same order only can co-integrate each other.
12
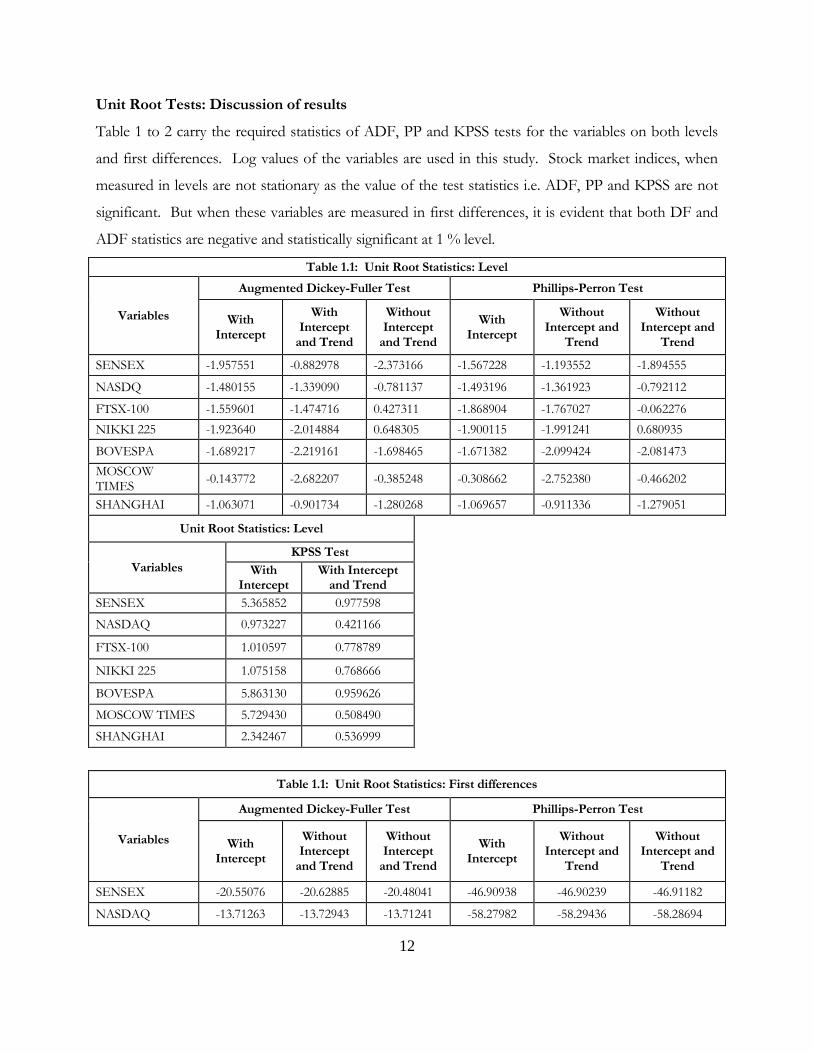
Unit Root Tests: Discussion of results
Table 1 to 2 carry the required statistics of ADF, PP and KPSS tests for the variables on both levels
and first differences. Log values of the variables are used in this study. Stock market indices, when
measured in levels are not stationary as the value of the test statistics i.e. ADF, PP and KPSS are not
significant. But when these variables are measured in first differences, it is evident that both DF and
ADF statistics are negative and statistically significant at 1 % level.
Table 1.1: Unit Root Statistics: Level
Variables
Augmented Dickey-Fuller Test Phillips-Perron Test
With Intercept
With Intercept
and Trend
Without Intercept
and Trend
With Intercept
Without Intercept and
Trend
Without Intercept and
Trend
SENSEX -1.957551 -0.882978 -2.373166 -1.567228 -1.193552 -1.894555
NASDQ -1.480155 -1.339090 -0.781137 -1.493196 -1.361923 -0.792112
FTSX-100 -1.559601 -1.474716 0.427311 -1.868904 -1.767027 -0.062276
NIKKI 225 -1.923640 -2.014884 0.648305 -1.900115 -1.991241 0.680935
BOVESPA -1.689217 -2.219161 -1.698465 -1.671382 -2.099424 -2.081473
MOSCOW TIMES
-0.143772 -2.682207 -0.385248 -0.308662 -2.752380 -0.466202
SHANGHAI -1.063071 -0.901734 -1.280268 -1.069657 -0.911336 -1.279051
Unit Root Statistics: Level
Variables
KPSS Test
With Intercept
With Intercept and Trend
SENSEX 5.365852 0.977598
NASDAQ 0.973227 0.421166
FTSX-100 1.010597 0.778789
NIKKI 225 1.075158 0.768666
BOVESPA 5.863130 0.959626
MOSCOW TIMES 5.729430 0.508490
SHANGHAI 2.342467 0.536999
Table 1.1: Unit Root Statistics: First differences
Variables
Augmented Dickey-Fuller Test Phillips-Perron Test
With Intercept
Without Intercept
and Trend
Without Intercept
and Trend
With Intercept
Without Intercept and
Trend
Without Intercept and
Trend
SENSEX -20.55076 -20.62885 -20.48041 -46.90938 -46.90239 -46.91182
NASDAQ -13.71263 -13.72943 -13.71241 -58.27982 -58.29436 -58.28694
13
FTSX-100 -27.06781 -27.06729 -27.06187 -54.93689 -54.93644 -54.93877
NIKKI 225 -52.71244 -52.69810 -52.69469 -52.72058 -52.70637 -52.69390
BOVESPA -37.23787 -37.23555 -37.22466 -52.03025 -52.02355 -51.99244
MOSCOW TIMES
-50.04980 -50.10086 -50.06111 -50.77003 -50.79445 -50.77986
SHANGHAI -27.18901 -27.18483 -10.43987 -50.84125 -50.83621 -50.84538
Unit Root Statistics: First differences
Variables
KPSS Test
With Intercept
With Intercept and Trend
SENSEX 0.166562 0.044598
NASDAQ 0.148532 0.123589
FTSX-100 0.100972 0.079589
NIKKI 225 0.103377 0.101638
BOVESPA 0.106362 0.047275
MOSCOW TIMES 0.371495 0.262439
SHANGHAI 0.133465 0.098562
Results of Granger tests
Granger causality test explain any pair of variables there is a possibility of unidirectional causality or
bidirectional causality or none. This can also be the case between two pairs of variables used in our
empirical analysis. The pre-condition for applying Granger Causality test is to ascertain the stationarity
of the variables in the pair.
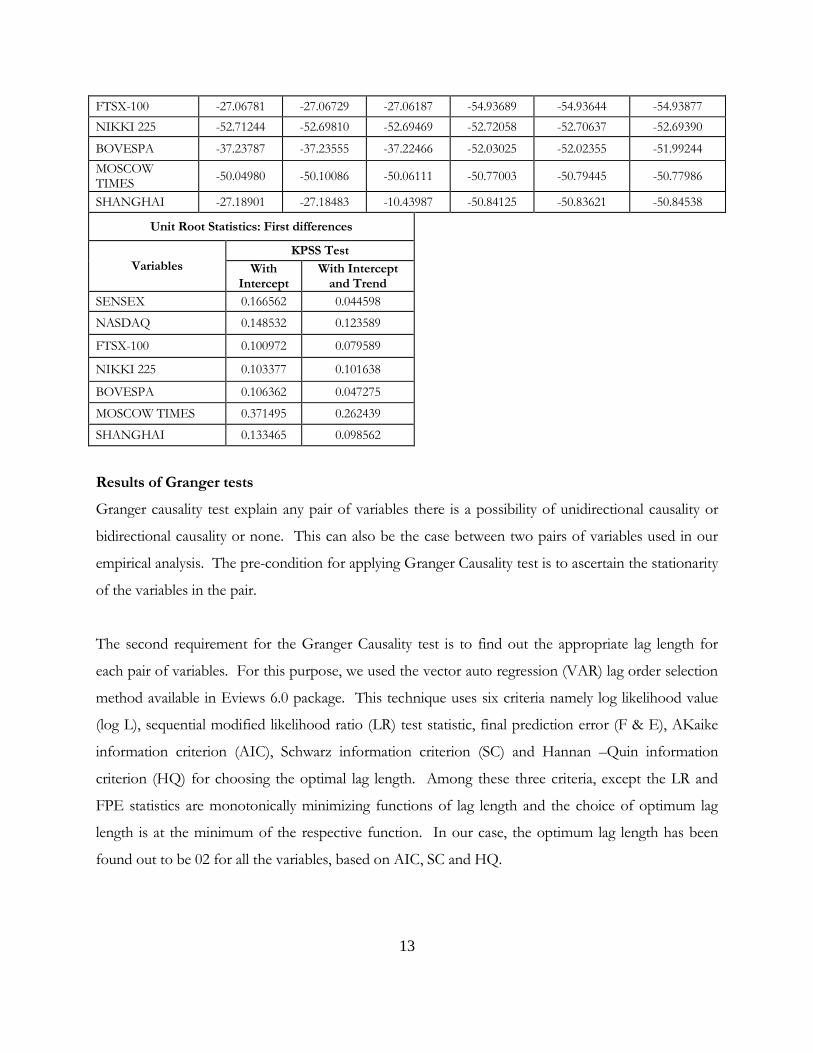
The second requirement for the Granger Causality test is to find out the appropriate lag length for
each pair of variables. For this purpose, we used the vector auto regression (VAR) lag order selection
method available in Eviews 6.0 package. This technique uses six criteria namely log likelihood value
(log L), sequential modified likelihood ratio (LR) test statistic, final prediction error (F & E), AKaike
information criterion (AIC), Schwarz information criterion (SC) and Hannan –Quin information
criterion (HQ) for choosing the optimal lag length. Among these three criteria, except the LR and
FPE statistics are monotonically minimizing functions of lag length and the choice of optimum lag
length is at the minimum of the respective function. In our case, the optimum lag length has been
found out to be 02 for all the variables, based on AIC, SC and HQ.
14
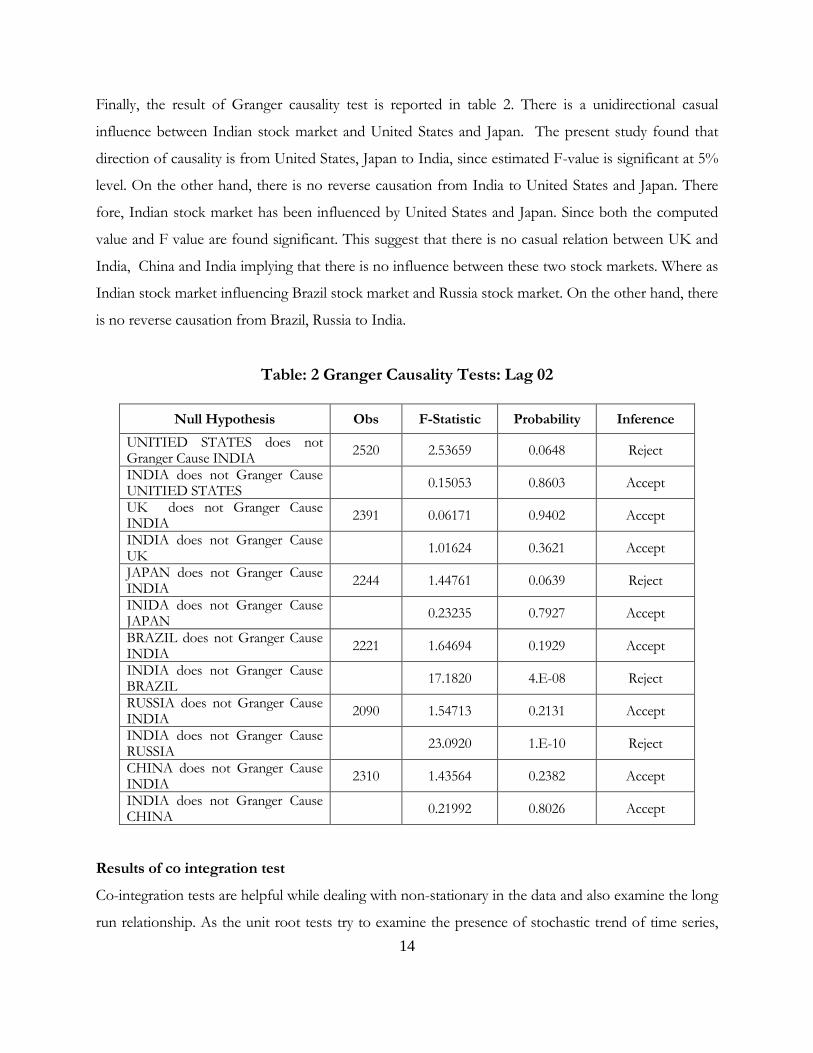
Finally, the result of Granger causality test is reported in table 2. There is a unidirectional casual
influence between Indian stock market and United States and Japan. The present study found that
direction of causality is from United States, Japan to India, since estimated F-value is significant at 5%
level. On the other hand, there is no reverse causation from India to United States and Japan. There
fore, Indian stock market has been influenced by United States and Japan. Since both the computed
value and F value are found significant. This suggest that there is no casual relation between UK and
India, China and India implying that there is no influence between these two stock markets. Where as
Indian stock market influencing Brazil stock market and Russia stock market. On the other hand, there
is no reverse causation from Brazil, Russia to India.
Table: 2 Granger Causality Tests: Lag 02
Null Hypothesis Obs F-Statistic Probability Inference
UNITIED STATES does not Granger Cause INDIA
2520 2.53659 0.0648 Reject
INDIA does not Granger Cause UNITIED STATES
0.15053 0.8603 Accept
UK does not Granger Cause INDIA
2391 0.06171 0.9402 Accept
INDIA does not Granger Cause UK
1.01624 0.3621 Accept
JAPAN does not Granger Cause INDIA
2244 1.44761 0.0639 Reject
INIDA does not Granger Cause JAPAN
0.23235 0.7927 Accept
BRAZIL does not Granger Cause INDIA
2221 1.64694 0.1929 Accept
INDIA does not Granger Cause BRAZIL
17.1820 4.E-08 Reject
RUSSIA does not Granger Cause INDIA
2090 1.54713 0.2131 Accept
INDIA does not Granger Cause RUSSIA
23.0920 1.E-10 Reject
CHINA does not Granger Cause INDIA
2310 1.43564 0.2382 Accept
INDIA does not Granger Cause CHINA
0.21992 0.8026 Accept
Results of co integration test
Co-integration tests are helpful while dealing with non-stationary in the data and also examine the long
run relationship. As the unit root tests try to examine the presence of stochastic trend of time series,
15
co integration tests search for the presence of a common stochastic trend among the variables from
the unit root test results, the required condition for co integration test that given series are not I (O) is
satisfied .At levels all the variables are non-stationary, where as first differenced stationary.
The concept of co integration, introduced by Granger (1986) and further developed by Engle and
Granger (1987), incorporates the presence of non stationary, long-term relationship and short-run
dynamics in the modeling process. The study proposed to test the presence of non-stationary and long
term relationship between India and BRIC countries and developed stock markets namely Brazil,
Russia, China,USA ,UK, and Japan. A financial time series is said to be integrated of one order i.e., I
(1), if it becomes stationary after differencing once. If two series are integrated of order one, there may
have a linear combination that is stationary without requiring differencing and, if they do, they are said
to be co integrated. To analyze long run relationship between Indian stock Market and other BRIC
countries and developed stock markets, Johansen co-integration model has adopted. For testing co-
integration, there are two test statistics to use. First, one is trace statistics and other one is Maximum
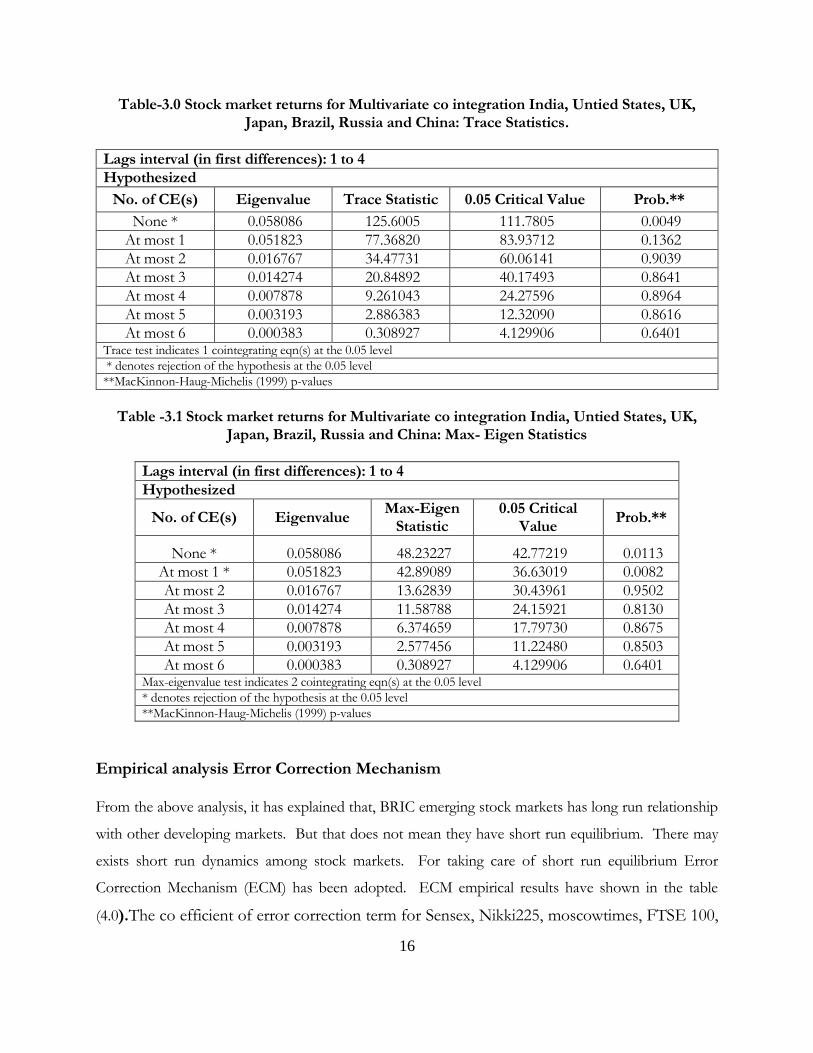
Eigen value statistics. The results are shown in table 3 and table 3.1. An empirical result of trace
statistic indicates that the rejection of null hypothesis at 0.05 critical values i.e. there are no co-
integration vector. In other words, Indian stock market has long relationship with other developed
markets i.e. USA, UK, and Japan and Other BRIC markets. Trace test also indicates that 1 co
integration equation at 5 % level of significance, tells about long run equilibrium between Indian stock
market and other BRIC markets and developed markets.
Similarly, the empirical results of Maximum Eigen value are shown in the table 5. The empirical result
indicates that the rejection of null hypothesis at 0.05 critical value i.e. no-co integration vector. It also
tells that Indian stock market has long run equilibrium with other developing markets. Maximum
Eigen value indicates that 2 co integration equation at 5 % level of significance.
16
Table-3.0 Stock market returns for Multivariate co integration India, Untied States, UK, Japan, Brazil, Russia and China: Trace Statistics.
Lags interval (in first differences): 1 to 4
Hypothesized
No. of CE(s) Eigenvalue Trace Statistic 0.05 Critical Value Prob.**
None * 0.058086 125.6005 111.7805 0.0049
At most 1 0.051823 77.36820 83.93712 0.1362
At most 2 0.016767 34.47731 60.06141 0.9039
At most 3 0.014274 20.84892 40.17493 0.8641
At most 4 0.007878 9.261043 24.27596 0.8964
At most 5 0.003193 2.886383 12.32090 0.8616
At most 6 0.000383 0.308927 4.129906 0.6401 Trace test indicates 1 cointegrating eqn(s) at the 0.05 level
* denotes rejection of the hypothesis at the 0.05 level
**MacKinnon-Haug-Michelis (1999) p-values
Table -3.1 Stock market returns for Multivariate co integration India, Untied States, UK,
Japan, Brazil, Russia and China: Max- Eigen Statistics
Lags interval (in first differences): 1 to 4
Hypothesized
No. of CE(s) Eigenvalue Max-Eigen
Statistic 0.05 Critical
Value Prob.**
None * 0.058086 48.23227 42.77219 0.0113
At most 1 * 0.051823 42.89089 36.63019 0.0082
At most 2 0.016767 13.62839 30.43961 0.9502
At most 3 0.014274 11.58788 24.15921 0.8130
At most 4 0.007878 6.374659 17.79730 0.8675
At most 5 0.003193 2.577456 11.22480 0.8503
At most 6 0.000383 0.308927 4.129906 0.6401 Max-eigenvalue test indicates 2 cointegrating eqn(s) at the 0.05 level
* denotes rejection of the hypothesis at the 0.05 level
**MacKinnon-Haug-Michelis (1999) p-values
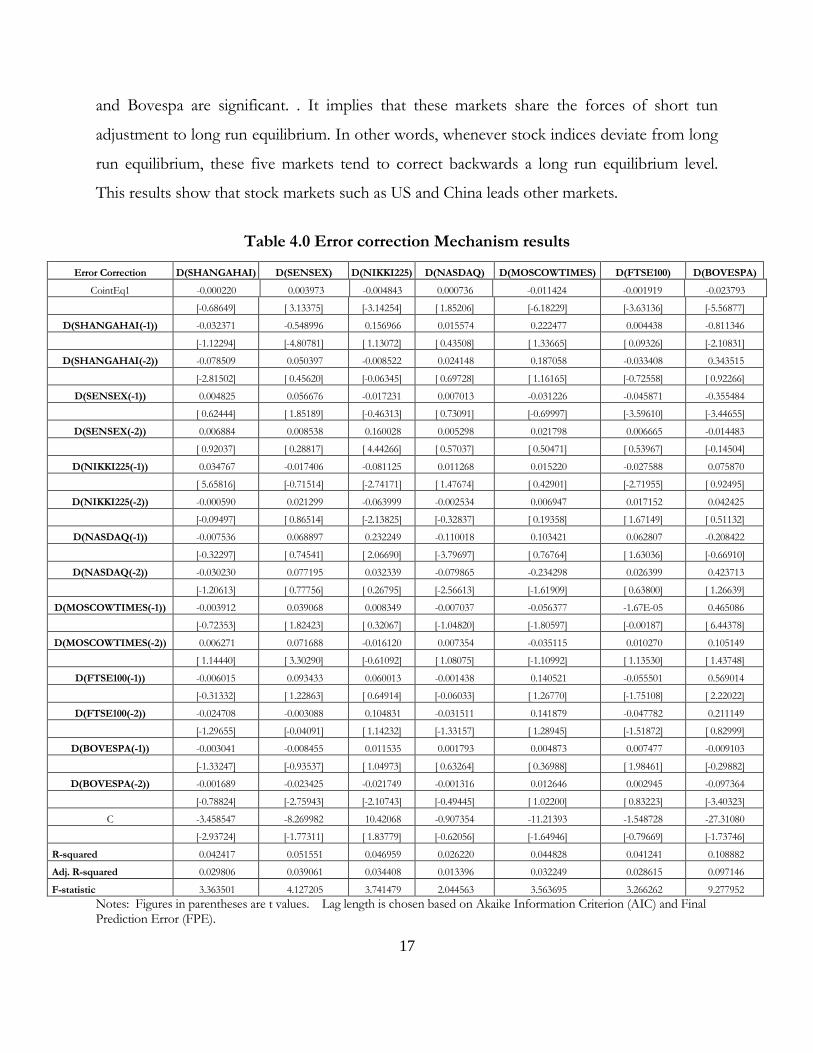
Empirical analysis Error Correction Mechanism From the above analysis, it has explained that, BRIC emerging stock markets has long run relationship
with other developing markets. But that does not mean they have short run equilibrium. There may
exists short run dynamics among stock markets. For taking care of short run equilibrium Error
Correction Mechanism (ECM) has been adopted. ECM empirical results have shown in the table
(4.0).The co efficient of error correction term for Sensex, Nikki225, moscowtimes, FTSE 100,
17
and Bovespa are significant. . It implies that these markets share the forces of short tun
adjustment to long run equilibrium. In other words, whenever stock indices deviate from long
run equilibrium, these five markets tend to correct backwards a long run equilibrium level.
This results show that stock markets such as US and China leads other markets.
Table 4.0 Error correction Mechanism results
Error Correction D(SHANGAHAI) D(SENSEX) D(NIKKI225) D(NASDAQ) D(MOSCOWTIMES) D(FTSE100) D(BOVESPA)
CointEq1 -0.000220 0.003973 -0.004843 0.000736 -0.011424 -0.001919 -0.023793
[-0.68649] [ 3.13375] [-3.14254] [ 1.85206] [-6.18229] [-3.63136] [-5.56877]
D(SHANGAHAI(-1)) -0.032371 -0.548996 0.156966 0.015574 0.222477 0.004438 -0.811346
[-1.12294] [-4.80781] [ 1.13072] [ 0.43508] [ 1.33665] [ 0.09326] [-2.10831]
D(SHANGAHAI(-2)) -0.078509 0.050397 -0.008522 0.024148 0.187058 -0.033408 0.343515
[-2.81502] [ 0.45620] [-0.06345] [ 0.69728] [ 1.16165] [-0.72558] [ 0.92266]
D(SENSEX(-1)) 0.004825 0.056676 -0.017231 0.007013 -0.031226 -0.045871 -0.355484
[ 0.62444] [ 1.85189] [-0.46313] [ 0.73091] [-0.69997] [-3.59610] [-3.44655]
D(SENSEX(-2)) 0.006884 0.008538 0.160028 0.005298 0.021798 0.006665 -0.014483
[ 0.92037] [ 0.28817] [ 4.44266] [ 0.57037] [ 0.50471] [ 0.53967] [-0.14504]
D(NIKKI225(-1)) 0.034767 -0.017406 -0.081125 0.011268 0.015220 -0.027588 0.075870
[ 5.65816] [-0.71514] [-2.74171] [ 1.47674] [ 0.42901] [-2.71955] [ 0.92495]
D(NIKKI225(-2)) -0.000590 0.021299 -0.063999 -0.002534 0.006947 0.017152 0.042425
[-0.09497] [ 0.86514] [-2.13825] [-0.32837] [ 0.19358] [ 1.67149] [ 0.51132]
D(NASDAQ(-1)) -0.007536 0.068897 0.232249 -0.110018 0.103421 0.062807 -0.208422
[-0.32297] [ 0.74541] [ 2.06690] [-3.79697] [ 0.76764] [ 1.63036] [-0.66910]
D(NASDAQ(-2)) -0.030230 0.077195 0.032339 -0.079865 -0.234298 0.026399 0.423713
[-1.20613] [ 0.77756] [ 0.26795] [-2.56613] [-1.61909] [ 0.63800] [ 1.26639]
D(MOSCOWTIMES(-1)) -0.003912 0.039068 0.008349 -0.007037 -0.056377 -1.67E-05 0.465086
[-0.72353] [ 1.82423] [ 0.32067] [-1.04820] [-1.80597] [-0.00187] [ 6.44378]
D(MOSCOWTIMES(-2)) 0.006271 0.071688 -0.016120 0.007354 -0.035115 0.010270 0.105149
[ 1.14440] [ 3.30290] [-0.61092] [ 1.08075] [-1.10992] [ 1.13530] [ 1.43748]
D(FTSE100(-1)) -0.006015 0.093433 0.060013 -0.001438 0.140521 -0.055501 0.569014
[-0.31332] [ 1.22863] [ 0.64914] [-0.06033] [ 1.26770] [-1.75108] [ 2.22022]
D(FTSE100(-2)) -0.024708 -0.003088 0.104831 -0.031511 0.141879 -0.047782 0.211149
[-1.29655] [-0.04091] [ 1.14232] [-1.33157] [ 1.28945] [-1.51872] [ 0.82999]
D(BOVESPA(-1)) -0.003041 -0.008455 0.011535 0.001793 0.004873 0.007477 -0.009103
[-1.33247] [-0.93537] [ 1.04973] [ 0.63264] [ 0.36988] [ 1.98461] [-0.29882]
D(BOVESPA(-2)) -0.001689 -0.023425 -0.021749 -0.001316 0.012646 0.002945 -0.097364
[-0.78824] [-2.75943] [-2.10743] [-0.49445] [ 1.02200] [ 0.83223] [-3.40323]
C -3.458547 -8.269982 10.42068 -0.907354 -11.21393 -1.548728 -27.31080
[-2.93724] [-1.77311] [ 1.83779] [-0.62056] [-1.64946] [-0.79669] [-1.73746]
R-squared 0.042417 0.051551 0.046959 0.026220 0.044828 0.041241 0.108882
Adj. R-squared 0.029806 0.039061 0.034408 0.013396 0.032249 0.028615 0.097146
F-statistic 3.363501 4.127205 3.741479 2.044563 3.563695 3.266262 9.277952
Notes: Figures in parentheses are t values. Lag length is chosen based on Akaike Information Criterion (AIC) and Final Prediction Error (FPE).
18
Section-IV
Summary and Conclusion
This paper empirically investigates the long run equilibrium relationship between the BRIC stock
markets and the stock market indices of three major developed countries as a using the multivariate co
integration. The multivariate co integration technique is used to investigate the long run relationship.
To asses the short run influence of one market on the other and to assess how many days each market
takes to factor out the influence Indian stock market, we have used the Granger causality test with 02
days. The present study found that US, and Japan market factors influencing Indian stock market. It
might be because of maximum international trade commercial activities between these countries.
Indian stock market is not influencing by UK, Brazil, Russia and China markets. But Brazil and Russia
markets are influencing by Indian stock market. The study finally conclude that India and developed
countries markets USA, UK, Japan, and other Emerging BRIC markets highly co integrating during
the period of the study.
Financial integration is key to delivering competitiveness, efficiency and growth. But will integration
also bring about financial stability? Not necessarily. Strong framework rules, closer co operation and in
particular a readiness to share information and co ordinate action across borders are necessary
complements. Countries such as India will, over the next 10 to 15 years, need to move towards far
greater integrated global financial world and policy makers in India need to rethink the framework for
such integration. India to a great extent is far less integrated with the global markets and is fortunate in
its leadership at the policy level. Our policy makers will navigate India through the present crisis. That
is the least of our worries. We need to exercise restraint and build a regulatory framework for the
economy at a much faster rate. Further, we need to pause to ensure that we do not get carried away
with blind faith in the doctrine that there is a direct relationship between growth and economic
freedom.
19
References Agmon, T (1972), “The relationship among equity markets: a study of share price co movement in the United States, United Kingdom, Germany and Japan”, Journal of Finance, vol 27, pp 839–55. Alfaro, L, S Kalemli-Ozcan and V Volosovych (2005), “Capital flows in a globalised world: the role of policies and institutions”, NBER working papers, no 11696 Amanulla. S and B Kamaiah (1995): Market Integration as an Alternative test of Market Efficiency: A case of Indian stock Market. Artha Vijana, September N 3 PP 215-230 Ayuso, J and R.Blanco (1999) Has financial market integration has increased during the nineties? Ban code Espana service de estudios, document de trabajon 9923. Chittedi Krishna Reddy (2007) “Stock Market Integration in India” M.Phil dissertation, University of Hyderabad, Hyderabad, Andhra Pradesh. Chowdhry, A R (1994), “Stock market interdependencies: evidence from the Asian NIEs”, Journal of Macroeconomics, vol 16, no 4. Chowdhry, T, Lin Lu and Ke Peng (2007), “Common stochastic trends among Far Eastern stock prices: effects of Asian financial crisis”, International Review of Financial Analysis, vol 16 Demirguc-kunt, A and E Detragiache (1999), financial liberalization and fiancail fragility”, in B Pleskovic and J E Stiglitz, eds, Annual World bank Conference on Development Economics 1998, world bank, Washington DC. Engle, R F and C W J Granger (1987), “Co integration and error correction: representation, estimation, and testing”, Econometrica, vol 55, no 2, pp 251–76. Johansen, S (1988): “Statistical analysis of co integrating vectors”, Journal of Economic Dynamics and Control, vol 12, pp 231–54. Johansen, S and K Juselius (1990): “Maximum likelihood estimation and inferences on co integration – with applications to the demand for money”, Oxford Bulletin of Economics and Statistics, vol 52, no 2, pp 169–210. Kasa, Kenneth, (1992), "Common stochastic trends in international stock markets", Journal of Monetary Economics, 29, pp. 95-124. Korajczyk Robert A., “A Measure of stock market Integration for developed and emerging countries”, The World Bank Policy Research Department working paper No.1482 Lane, P R and G M Milesi-Ferretti (2006), “The external wealth of nations mark II: revised and extended estimates of foreign assets and liabilities, 1970-2004”, IMF working papers, no 06/69, March.
20
Levy, H and M Samat (1970) “International diversification of investment portfolios”, American Economic Review, vol 60, pp 668–75. Masih, Rumi and A. Mansur M. Masih (2001), "Long and short term dynamic causal transmission amongst international stock markets", Journal of International Money and Finance", 20, pp. 563-587 Prasad, Eswar S, Kenneth Rogoff, Shang-Jin Wei and M Ayhan Kose (2003), “Effects of financial globalization on developing countries: some empirical evidence”, IMF Occasional Papers, no 220. Scheicher, Martin (2001). The Comovements of Stock Markets in Hungary, Poland and the Czech Republic. International Journal of Finance and Economics, 6(1): 27-39. Solnik, B, C Boucrelle and Y Le Fur (1996), “International market correlation and volatility”, Financial Analysts Journal, vol 52, no 5, pp 17–34 Taylor, M P and I Tonks (1989), “The internationalization of stock markets and abolition of UK exchange control”, Review of Economics and Statistics, vol 71, pp 332–6. Yu, I, L Fung and C Tam (2007), “Assessing financial market integration in Asia – equity markets”, Hong Kong Monetary Authority Working Papers, no 04/2007.