munich personal repec archive - uni-muenchen.de · to account for the impact of exogenous factors...
TRANSCRIPT

MPRAMunich Personal RePEc Archive
Performance of microfinance institutionsin achieving the poverty outreach andfinancial sustainability: When age andsize matter?
Mahinda Wijesiri and Jacob Yaron and Michele Meoli
Indira Gandhi Institute of Development Research, The College ofManagement Academic Studies, Universita degli studi di Bergamo
2015
Online at https://mpra.ub.uni-muenchen.de/69821/MPRA Paper No. 69821, posted 4 March 2016 06:09 UTC

Performance of microfinance institutions in achieving the poverty outreach and financial
sustainability: When age and size matter?
Mahinda Wijesiri1, Jacob Yaron2, Michele Meoli3
Abstract
Using a two-stage DEA bootstrapped metafrontier approach, we investigate the effects of age
and size on efficiency estimates of microfinance institutions (MFIs). In the first-stage, we use a
metafrontier model combining with DEA bootstrapped procedure to obtain statistically robust
and comparable efficiencies. In the second-stage, we employ a bootstrapped truncated regression
to account for the impact of exogenous factors on both dimensions of efficiency. Results
highlight the importance of model specification for MFIs operating in different geographical
regions. Moreover, we find that although older MFIs perform better than younger ones in terms
of achieving financial results, they are relatively inefficient in achieving outreach objectives. We
also document that MFI size matters: larger MFIs tend to have higher financial and outreach
efficiency.
Keywords- Data envelopment analysis; Metafrontier; Bootstrap; Efficiency; Microfinance
JEL Classification: G21; O16
1 Indira Gandhi Institute of Development Research, Mumbai, India. Email: [email protected] 2 The College of Management Academic Studies, Israel 3 University of Bergamo, Italy

1. Introduction
In emerging markets, Microfinance Institutions (MFIs) are often considered to play an
increasingly critical role in the development of economic system. They serve the poor who have
been excluded from formal financial institutions, providing a wide range of financial services
and products ranging from simple credit facilities to savings, remittance, insurance and many
others. Despite several sustainable rural financial intermediations that have simultaneously
achieved dual objectives of financial sustainability and social outreach, a large number of MFIs
across the developing world still fail to address the widely demanded financial services in rural
markets in a cost effective way (Yaron, 1994; Hermes & Lensink, 2011; D'Espallier et al. 2013).
Since the successful MFIs appear to be larger and some of them grow faster than the less
successful MFIs, there is an emerging consensus among donors and policy makers that
performance of MFIs is influenced by age and size (Balkenhol, 2007). In this context,
determination of whether older MFIs perform well on the dual objectives of financial
sustainability and outreach than younger ones and whether larger MFIs are more effective on
both financial and social dimensions than smaller ones could shed light on important policy
implications.
Among the various possible ingredients, Gonzalez (2007) highlights age and size as major
drivers of inefficiency in microfinance provisions. Although there are several studies
investigating the MFIs efficiency and its determinants, there is as yet little information on the
potential impact of age and size on MFI efficiency, notably in terms of the double-bottom line
objective of serving the poor in a financially sustainable way. More recent evidence, though
anecdotal, show that older MFIs are superior in performance to younger (Paxton, 2007) whereas
the other findings reveal that younger MFIs perform better than older (Hermes et al., 2011).
Theoretical and empirical studies to investigate the impact of size on MFIs performance are
scarce, with the exception of Hartarska & Nadolnyak (2007) and Cull et al. (2011). Although the
relationships have been inconclusive and ambiguous in earlier empirical studies, it would be very
important to explore in this research how age and size influence on MFIs’ financial and outreach
efficiency measures. To the best of our knowledge, no research exists that focuses explicitly on
the effects of age and size simultaneously on both financial and outreach efficiency dimensions
of MFIs.
The purpose of the present study is to empirically investigate the impact of age and size on the
performance of MFIs, measured by dual objectives of financial sustainability and outreach.
While the term financial sustainability refers to ability of an MFI to achieve unsubsidized, full
cost recovery, outreach is taken to mean extending financial services to a large number of people
(breadth of outreach) and towards the lower income strata of the rural poor (depth of outreach).
See Yaron et al., 1997; Conning, 1999; Schreiner, 2002 for more details about different outreach
aspects. Though several methods are often used, there is no universal agreement on the
specification of evaluating and measuring financial institutions performance (Paradi & Zhu,
2013). The commonly used methods in MFIs performance appraisals include traditional financial
ratios (e.g., Hartarska, 2005; Strom et al, 2014), performance evaluation framework articulated
by Yaron (1992a) (e.g., Paxton, 2003; Hudon & Traca, 2011; Nawaz, 2010; Aveh et al., 2013;
Sharma, 2014) and production frontier based techniques (e.g., Gutiérrez-Nieto et al., 2007;
Paxton, 2007; Gutiérrez-Nieto et al., 2009; Hermes et al., 2011; Servin et al., 2012; Piot-Lepetit
& Nzongang, 2014; Wijesiri et al., 2015; Wijesiri & Meoli, 2015). While effective in some
circumstances, use of ratio measures to evaluate the performance of financial institutions has not
escaped serious criticism from academics. Athanassopoulos & Ballantine (1995), for example,
argue that traditional financial ratios are not suitable for considering the effects of economies of
scale and estimation of overall performance measures due to their univariate nature. Especially,
MFIs are concerned, as some financial ratios designed for evaluating MFIs financial
performance, like financial self-sufficiency (FSS) fail to capture subsidies associated with MFIs’
operations, including among others, the full opportunity cost of MFI’s equity that is considered
a free cost item in accounting terms and the full value of subsidies embedded in the MFI's
concessionary borrowing (Yaron 1992a; Francisco et al., 2008; Manos & Yaron, 2009a). Yaron
(1992a) addresses these issues that are inherent in traditional ratios, in the context of
microfinance industry, by proposing an alternative performance evaluation framework that uses
self–sustainability and outreach of MFIs as two primary assessments criteria, measured by
subsidy dependent index (SDI) and outreach index (OI), respectively. Subsidy granted to MFI
and measured by the SDI is an input of social cost of subsidized MFIs and one of the most
heavily weighted factors upon which further access to donor capital is conditioned (Conning,
1999), while the outreach is the social output. OI is different from econometric measurement of
MFI's impact of operations (e.g., Randomized control tests). It is a hybrid, arbitrary, flexible

index that measures the achievement of MFIs with respect to its predetermined social objectives,
thereby, reflecting level of achievements along priorities set by policy makers and funds and
subsidies' providers namely, donors and states. Moreover, OI unlike econometric measurement
doesn't claim to capture the full impact of the MFI's operations on clients welfare but it is
friendly user and inexpensive to apply. In contrast econometric measurements are, much more
expensive to carry out, require high skills and therefore only rarely done. In general, SDI and OI
framework provide a fuller picture of MFIs overall performance in terms of the dual objectives
as it escapes from the possible contaminants in MFIs benchmarking such as influence of relief
from reserve requirements, access to concessionary borrowing grants, subsidies in form of free
technical aid received by MFIs (Yaron & Manos, 2007; Hudon & Traca, 2011). Thus, this
framework provides very useful insight for policy makers and donors in pursuit of improved
resource allocation and optimizing subsidies use (Conning, 1999). Nevertheless, SDI was
basically designed only to inform on the cost and subsidy involved and not on the full benefits to
society caused by the MFI's operation. For example, an MFI can be socially desirable to donors
in allocative terms and technically efficient under market constraints, although still subsidy
dependent. This could be the result of reaching deep poverty clients whose services are
associated with very high cost or by insisting on applying very low lending interest rates
following a belief that this is an important 'social' tool. In other words, subsidy independence
does not necessarily links with high efficiency level, nor does it necessarily label an MFI as
inefficient. Production frontier based techniques such as parametric methods like stochastic
frontier analysis (SFA) and non-parametric methods like data envelopment analysis (DEA) are
another widely used approaches in performance benchmarking of MFIs. Comparing with other
performance measuring metrics such as ratios analysis and SDI, the main advantage of frontier
method is that it offers overall objectively determined numerical efficiency scores with the
economic optimization mechanisms in complex service operational environments (Berger &
Humphrey, 1997). Both DEA and SFA techniques have inbuilt strengths and weaknesses. See
Berger & Humphrey (1997) and Berger & Mester (1997) for a detailed discussion and
comparison of both methods in financial context.
In the present paper, we use a two-stage DEA approach for a sample of 420 MFIs operating
across the world for simultaneously benchmarking the efficiency of MFIs along financial and
outreach dimensions. Given the sample of MFIs operating in different geographical regions that

are characterized by different social and economic norms, one of the important considerations in
this study is whether estimating a single frontier for our evaluation provides meaningful
efficiency scores. O’Donnell et al. (2008) point out that use of a common production frontier to
compare the efficiency of DUMs operating under different environmental characteristics leads to
yield inaccurate efficiency estimates. Since the MFIs in our sample are from different
geographical regions, they could have country specific characteristics in terms of demographic,
cultural and level of economic and technological advances. For example, in their empirical
analysis of MFI efficiency, Gutierrez-Niéto et al. (2009) find significant differences between
four different geographical regions including Asia, Latin America, Africa and Eastern Europe.
Thus, estimating a common frontier for the whole sample is likely to distort the efficiency
estimates yielded in the first-stage and subsequently the results of second-stage analysis (Dietsch
& Lozano-Vivas, 2000). In an attempt to overcome this limitation in conventional production
frontier models, Battese et al. (2004) propose a metafrontier method based on the notion of
metaproduction function defined by Hayami & Ruttan (1971). Battese et al. (2004) describes
metafrontier model as a deterministic parametric function and its values are no smaller than the
components of the production functions of the different groups involved. This approach enables
the calculation of comparable efficiencies for Decision Making Units (DMUs) operating under
different technologies while acknowledging any heterogeneity between them. Yet, they only use
parametric SFA in estimating the metafrontier. O’Donnell et al. (2008) further elaborate the
metafrontier model to use in estimation of DEA efficiencies too. The present study employs the
metafrontier model proposed by O’Donnell et al. (2008) in the analysis of the data on MFIs
located in Asia, Latin America, Africa and Eastern Europe. We use nonparametric DEA method
to construct the metafrontier model as it has several advantages over parametric SFA technique.
The main advantage of DEA is that it removes the requirement of making arbitrary assumption
regarding the functional form of the frontier. Instead of requiring a priori assumption about the
analytical form of the production function, DEA construct the best practice production function
on the basis of observed data. Since DEA requires no parametric assumption, it offers more-
flexible forms of the technology and distribution of inefficiency than does estimation of the
translog cost function (Wheelock & Wilson, 2000). Moreover, it allows choosing input and
output variables according to performance assessment objectives. However, traditional DEA
carries with it well known limitations. The main caveat is that the frontier is sensitive to outliers

and measurement errors since its inability to allow for random noise in efficiency measurement
and assumption of all deviations from the frontier indicate inefficiency, which may lead to distort
the resulted efficiency measures. We tackle this issue using the bootstrap method proposed by
Simar & Wilson (1998, 2000) that allows for random error by producing statistical inferences
without distorting any advantage of the DEA technique. It is also worthwhile to note that
dividing the whole sample into several groups based on the MFI operating geographical regions
leads to reduce the number of MFIs in each group. However, use of bootstrap method is a
remedy to the issues raised by small sample size (Halkos & Tzeremes, 2012; Song et al., 2013).
Then, in the second stage, bias corrected-efficiency scores are regressed on age, size and several
other control variables using the double bootstrap procedure proposed by Simar & Wilson (2007)
that has gained wide recognition for its ability in producing statistically robust estimates.
Results highlight the importance of model specification for MFIs operating in different
geographical regions. We also find evidence in supporting the presence of learning by doing in
terms of achieving financial goals. On the contrary, we find that older MFIs are relatively
inefficient in achieving their outreach objectives. Moreover, we find MFI size matters: larger
MFIs tend to have higher financial and outreach efficiency, attributing to presence of higher
scale economies. Additionally, we wish to claim that both Subsidy SDI and DEA methods
complement each other as efficiency is measured usually in comparison to peers while SDI
measures social cost and subsidies in operating supported microfinance institutions. The latter
facilitates computing and comparing derived specific financial ratios that are essential for
evaluation the justification of support given to MFIs such as annual subsidy per borrower, annual
subsidy per $ outstanding of loan portfolio of MFI and the ratio between the annual subsidy
given to the MFI and the interest and fees paid by the borrowers to the MFI. Moreover, we argue
that an MFI might be very effective when compared to its peers but yet highly dependent on
subsidies and therefore not necessarily worth being supported within a comprehensive cost-
benefit analysis. Thus, we wish to propose that both criteria might be used when deciding
whether supporting this MFI is warranted or not particularly when other instruments are also
considered candidates for helping the same target clientele.
Our main contribution is to extend the literature on MFIs efficiency by focusing explicitly on the
impacts of age and size simultaneously along financial and outreach efficiency dimensions. As
an empirical contribution, we use a bootstrap metafrontier DEA methodology that helps us to

make valid inference about the impact of age and size on efficiency estimates while
acknowledging the heterogeneity in MFIs operating in different geographical regions. Use of a
bootstrap metafrontier method to derive statistically significant efficiency estimates and
distinguish the patterns of efficiency estimates in different geographical regions could have
important policy implications for policy makers, states, donors, academics, incumbents of MFIs
and NGOs thinking of setting up MFIs. Especially, estimating the gap between regional frontiers
and the metafrontier could help decision makers to design realistic programs for improving the
performance of the relatively inefficient regions over time (see O’Donnell et al., 2008).
The rest of the paper is structured as follows. In the next section we provide the details of the
empirical methodology. This is followed by the data specification of input and output variables
employed. Next, the empirical results are explored. Finally, we discuss the main findings, and
note the research implications of our study.
2. Methodology
In the present study, we use a two-step DEA procedure to shed light on the impacts of age and
size simultaneously along financial and depth of outreach efficiency dimensions. In the first-
stage, integrating a bootstrapped DEA with metafrontier model, we estimate the efficiency of
each MFI from both financial and outreach perspectives. In the second stage, both dimensions of
efficiency estimates are separately regressed on age and size. Both steps are briefly discussed
below.
2.1 Data Envelopment Analysis
DEA is developed by Charnes et al. (1978) based on the work of Farrell (1957) and others. It is a
non-parametric linear programming technique used for evaluating relative efficiency of peer
DMUs that have same multiple inputs and outputs. Unlike the parametric methods, non-
parametric DEA efficient frontier is not determined by some specific functional form. Instead it
involves constructing a production frontier based on the actual input–output observations in the
sample. Thus, DEA efficiency score for a specific DMU is measure with respect to the
empirically constructed efficient frontier defined by the best performing DMUs (Paradi et al.
2011). DMUs with efficiency score equals to one are fully efficient and they lie on the
constructed frontier, and those are assigned the score less than one are relatively inefficient and
their input and output values locate some distance away from the corresponding reference point
on the production frontier. There are several DEA models with different assumptions in DEA.
Among them, CCR (Charnes et al., 1978) and BCC (Banker et al., 1984) are the frequently used
DEA models. The main difference between CCR and BCC models is based on the treatment of
return to scale for the inputs and outputs. The CCR model assumes that each DMU operate with
Constant Return to Scale (CRS). It is probably the most widely used DEA model (Barros, 2008)
and provides the overall technical efficiency of each DMU, aggregating pure technical efficiency
and scale efficiency into single value (Gollani & Roll, 1989). The BCC model, on the other hand,
assumes Variable Return to Scale (VRS) between inputs and outputs and delivers the
measurement of pure technical efficiency. Both CCR and BCC models can be formulated by
applying an input orientation or output orientation perspectives. In an input-oriented approach,
efficiency is measured as a proportional reduction in the input usage, with output levels held
constant whereas an output-oriented approach requires proportional increase of outputs with
constant levels of input (See, for details, Coelli et al., 2005). Note, however, that the CCR model
provides identical results irrespective of its orientation and that is not the case with the BCC
model that yields different results with the input and output formulations (Golany & Roll, 1989).
2.1.1 Metafrontier model
It is well-known that sample homogeneity is one of the fundamental assumptions of production
frontier methods. This assumption on efficiency makes it impossible comparing the efficiency of
DMUs operating under different production technologies (O’Donnell et al., 2008). Battese et al.
(2004) take steps to remedy this issue in the SFA framework. The metafrontier model developed
by them enables the measurement of comparable technical efficiencies for non-homogeneous
DMUs. O’Donnell et al. (2008) further elaborate the model to use in non-parametric DEA
platform too. The metafrontier model is a function that ‘envelops’ the individual group frontiers,
each having their specific technology and environmental factors (Battese et al., 2004). Thus, this
approach provides consistent and homogeneous efficiency comparison (Assaf et al., 2010). The
efficiencies measured with respect to the metafrontier can be decomposed into the components
of technical efficiency measured by the distance from an input–output point to the group frontier
and the metatechnology ratio (MTR) that measures how close the group-frontier is to the

metafrontier (O’Donnell et al., 2008). Thus, MTR for the DMUs in group k ( can be
defined as follows:
(1)
Where denotes the technical efficiency with respect to the metafrontier and refers to the
technical efficiency with respect to the group frontier. is always less than the and
calculated MTR ranges between 0 and 1 (Mitropoulos et al., 2015). For technical details about
metafrontier model in DEA framework, refer to O’Donnell et al., 2008.
2.1.2 DEA bootstrap approach
Although DEA has several undeniable advantages compared to the other frontier techniques, it
suffers from several limitations. As mentioned earlier, one major drawback of the conventional
DEA estimator is that efficiency is measured relative to an estimate of the true production
frontier, and consequently corresponding DEA estimates are biased by construction and are
sensitive to the sampling variations of the obtained frontier (Simar & Wilson, 1998). Thus,
conventional DEA applications offer only point estimates without a sense of the sampling
variation associated with them. The method introduced by Simar & Wilson (1998, 2000) based
on the bootstrap concept (Efron, 1979) remove this inbuilt drawbacks in the conventional DEA
method. The bootstrap procedure proposed by them provides confidence intervals and
corrections for the bias inherent in conventional DEA without distorting any advantage of the
DEA technique. The confidence intervals on the efficiencies attempt to capture the true efficient
frontier within the specific interval (Dyson & Shale, 2010).
In the present study, we use the bootstrapped DEA to construct the metafrontier model. First, we
estimate the metafrontier for the whole sample. Then, following Gutierrez-Niéto et al. (2009), we
group MFIs in our sample into four different groups (i.e., Asia, Latin America, Africa and
Eastern Europe), and construct group frontiers by using DEA for each group. We also calculate
the MTR of each region by applying the equation (1). When estimating both dimensions of
efficiency scores under metafrontier and groupfrontiers, we use the bootstrap DEA approach
proposed by Simar & Wilson (2000) to investigate the sensitivity of efficiency estimates and
MFI rankings to variations in sample composition. We execute input oriented DEA approach

where we assume that managers of MFIs have less control over the output quantities compared
to the available input resources. The next important issue with DEA is referred to return to scale
(RTS). Seiford & Zhu (1999b) argue that the sensitivity issue of RTS can be related to changes
in efficient frontier and changes of position of the efficient DMUs along the frontier. Use of
inappropriate returns to scale, therefore, results in statistically inconsistent estimates of
efficiency (Simar & Wilson, 2002). Thus, in the present paper, we follow the statistical
hypothesis testing procedure developed by Simar & Wilson (2002) to determine whether the
frontier globally exhibit constant or variable returns to scale. We define the null hypothesis ( )
as the technology is CSR and its alternative ( ) as the VRS as follows:
Considering a given set of observations of N MFIs, we calculate the test statistic (S) using the
mean of ratios of the efficiency scores (θ) as in (2).
(2)
We, then, formulate a critical value ( for S to determine whether we reject or not. If the
estimated test statistic (S) value is less than the critical value and
, we reject the null hypothesis and accept the
alternative hypothesis of VRS. In such a situation, another hypothesis testing procedure is
needed to be performed to determine whether the underlying technology exhibits increasing or
decreasing returns to scale.
2.2 Second-stage regressions
In the second stage, using a regression method, we examine the effect of age and size on
estimated bias-corrected efficiency estimates. The most commonly employed method in this
context is the Tobit estimator. However, use of Tobit estimator to estimate the model (3) in a
second stage analysis has been criticized by Simar & Wilson (2007). They argue that because of
explanatory variables (z) are correlated with the disturbance term (ε), the regression assumption
of ε is independent of z becomes invalid. Moreover, they point out that DEA efficiency estimates

are correlated with each other, and consequently yield inconsistent and biased estimates in the
second stage.
(3)
Where the subscript i = 1,…, N indicates the observations, θ is efficiency score, a is a constant
term and β is a vector of parameters.
In their studies with Monte Carlo experiments, Simar & Wilson, (2007) address these issues by
proposing an alternative double bootstrapped procedure that permits the valid inference and takes
into account the bias due to the serial correlation of the efficiency estimates.
3. Data and variables
3.1 Data
In the present paper, we use more recent database, from Microfinance Information Exchange
(MIX) for year 2013 (www.mixmarket.org). MIX is a global web-based microfinance platform
that provides high quality standardized information about a large number of MFIs operating in
different geographical regions (Servin et al. 2012). The financial and social information available
in MIX have used in several earlier studies (e.g. Gutierrez-Niéto et al., 2009; Nawaz, 2010;
Ahlin et al., 2011; Hermes et al., 2011; Servin et al., 2012; Louis et al., 2013). About 30 MFIs
are excluded from the study because information on their required variables was lacking. Finally,
in all, we have 420 MFIs operating in different countries in Asia, Africa, South America and
East European region. Our sample contains 154 Non Governmental Organizations (NGOs), 49
Credit Unions/ Cooperatives, 178 Non-Banking Financial Institutions (NBFIs) and 39 Banks.
The breakdown by geographical regions is as follows: 212 from Latin America, 136 from Asia,
44 from Africa and 28 from Eastern Europe. These ownership types and geographical regions are
those defined by MIX for its purpose of dissemination of data. We do not provide the dataset
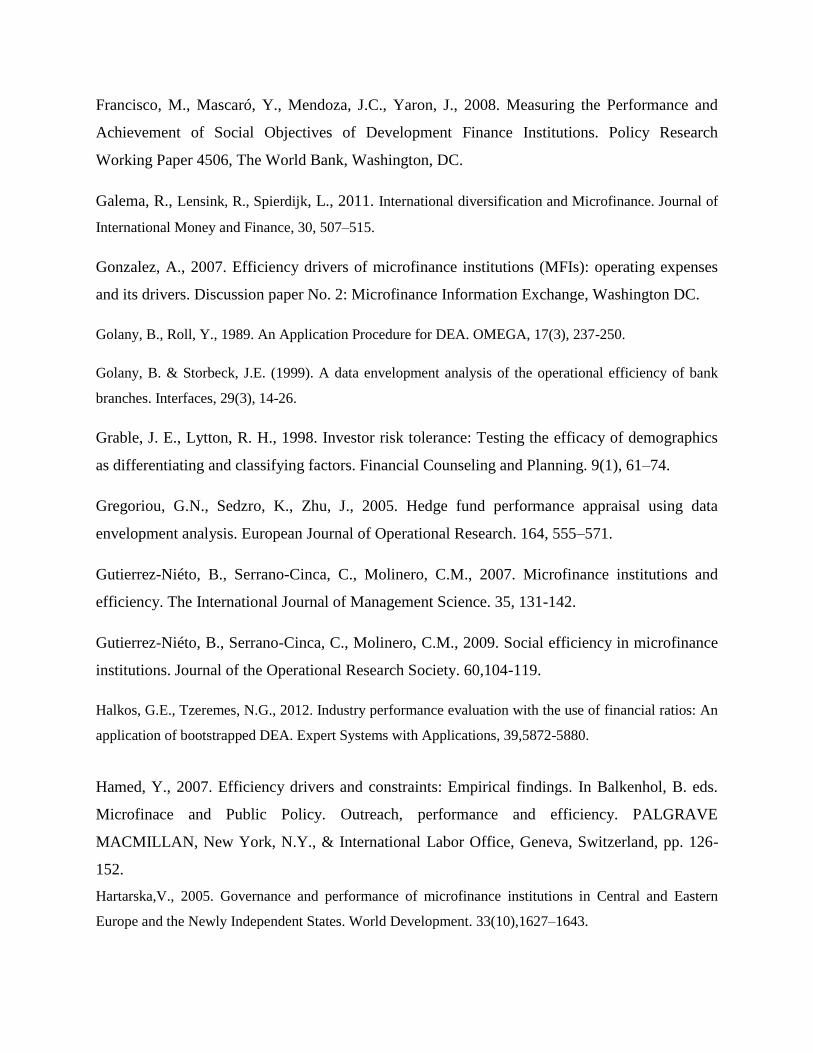
here as it covers 420 MFIs. Table 1 provides the number of observations per age and operating
region as well as size and operating region. According to the length of their survival (in years),
we divide MFIs into three categories: new (1 to 4 years), young (5 to 8 years) and matured (> 8
years). In this classification, we follow MIXMarket benchmarking procedure4. On the other
4 http://www.themix.org/, accessed in January, 2015

hand, in classifying the MFIs as small, medium and large, we follow Microfinance Tier
Definitions (www.microrate.com) and define small MFIs as those having less than US$ 5 million
total assets, medium MFIs as those having US$ 5-50 million total assets and large MFIs as those
having more than US$ 50 million total assets. Overall, the sample is dominated by matured and
medium size MFIs and many of which is located in Latin American region.
INSERT TABLE 1 HERE
3.2 Input and output variables
There continues to be some debate about explicit definition of inputs and outputs of a financial
institution. The choice of inputs and outputs needs to be consistent with the DEA approach to be
employed and activities carried out by firms (Gregoriou et al. 2005). There are three well-
recognized approaches commonly used in the literature: production, intermediation and
profitability models (Paradi et al. 2011). Under the production approach, the financial institutions
are defined as production units that produce services for their customers by using resources such
as capital and labor. The intermediation approach views the financial institutions as
intermediaries that employ labor, deposits and physical capital to produce loans and investments.
The main demerit of these approaches is their failure to address the role of deposits. Production
approach recognizes the deposits as output while the intermediation approach takes the deposits
as input to production of loans. The profitability approach, on the other hand, is used to measure
the profitability of DMUs that use inputs (expenses) to produce its outputs (incomes). There is no
straightforward agreement among researchers on what input and outputs should be considered in
the analysis (Berger & Humphrey, 1997). In general, the selection of appropriate model is based
on data availability (Paradi et al., 2011). Since most MFIs across the world are not deposit-taking
institutions (Galema et al., 2011), the role of deposit becomes an irrelevant factor in this study.
In the present study, we construct two DEA models using same inputs and different output
measures to estimate the efficiency of MFIs from both financial and social perspectives. Given
data availability and consistent with Gutiérrez-Nieto et al. (2007), we select two inputs (i.e.,
operating expenses and total number of employees). Also, following previous empirical literature
on MFI efficiency, we choose four outputs variables (i.e., gross loan portfolio, financial revenue,
inverse of average loan balance per borrower and number of active borrowers). These output

variables capture the MFI dual objectives of financial sustainability and poverty outreach.
Additionally, following Cooper et al. (2001), we observe a thumb rule to make sure that the
minimum number of DMUs is at least three times greater than the sum of input and output
variables [420 > 3 (2 + 2 )]. Observing of this heuristic in DEA studies is essential to avoid
model saturation effects (Edirisinghe & Zhang, 2010). Operating expenses and total number of
employees which have commonly been used in prior studies to investigate the efficiency of
banks (e.g., Berger & Humphrey, 1997; Berger & Mester, 1997; Athanassopoulos, 1997) and
MFIs (e.g., Gutiérrez-Nieto et al., 2007 & 2009; Wijesiri et al., 2015; Wijesiri & Meoli, 2015)
are selected as the input variable measures. On the other hand, with regard to choice of output
variables, selection is quite challengeable due to the heterogeneity in types of services and
products provided by MFIs. In general, output variables reflect a mix of quantitative and
qualitative measures of results expected (Golany & Storbeck, 1999). Thus, in order to find more
appropriate output variables, we consider the dual objectives pursued by MFIs. In line of earlier
literature on MFI efficiency (Gutiérrez-Nieto et al., 2007 & 2009; Piot-Lepetit & Nzongang,
2014; Wijesiri et al., 2015) and banks (Athanassopoulos, 1997; Seiford & Zhu, 1999a;
Tzerermes, 2015), we take gross loan portfolio and financial revenue as output measures to
construct the financial model. With regard to the outreach efficiency model, following Widiarto
& Emrouznejad, (2015), we include inverse of average loan balance per borrower and number of
active borrowers as output measures. Average loan balance per borrower, often taken to be a
proxy for the poverty level of customers (Cull et al., 2007), is measured by the average loan size
per borrower divided by the gross national income (GNI) per capita. Number of active
borrowers, on the other hand, is a proxy for breadth of poverty outreach. All else constant, the
number of borrowers served by an MFIs depends on the level of subsidies that it can attract
(Schreiner, 2002).
With respect to the social model, we acknowledge some potential with the indicator of benefit to
the poorest (PI) that is often used as social output measures in earlier studies (e.g., Gutiérrez-
Nieto et al., 2009 ; Piot-Lepetit & Nzongang, 2014), albeit we do not welcome it as an
appropriate output variables to construct the social model in our analysis. We use the following
simple example to illustrate one of the major problems associated with PI in DEA application.
Consider two MFIs, X and Y in a sample of 35 MFIs, whose standardized average loan balance

per borrower (K), number of active borrowers and number of women borrowers are shown in
Table 2.
INSERT TABLE 2 HERE
Then estimation of PI for both X and Y is obtained as (Gutiérrez-Nieto et al., 2009):
PI = X Number of active borrowers (4)
where K is measured by average loan balance per borrower over GNI per capita, Min (K) is the
minimum value of K over all MFIs and range of (K) is the difference between maximum value
of K and the minimum value of K over all MFIs.
Suppose Min (K) and Range of (K) for MFIs in this sample are 2 and 18, respectively. Using the
formula (4), the estimated PI for X and Y is 0 and 138, respectively. Since, MFIs with higher PI
values have more poverty outreach (Gutiérrez-Nieto et al., 2009), Y is more effective in
achieving the poverty objectives compared to X. However, as can be seen from the Table 2, X
claims for a larger number of active borrowers and all of whom are females (a proxy for depth of
outreach). This indicates the higher scale of outreach accomplished by X compared to its
counterpart Y. Thus, it is reasonable to argue that the conclusion made based on PI that Y is
more poverty oriented compared to X is not meaningful. On the other hand, the main
consideration guided us in choosing the number of active borrowers instead of number of women
borrowers is that MFIs operate in some geographical regions (for example countries dominated
by Islamic law) tend to focus on family borrowers (Widiarto & Emrouznejad, 2015). In other
words, despite the facts that loans to women have higher marginal impact than to men (Pitt &
Khandker, 1998), MFIs operating in some geographical areas do not lend directly to women. For
example, lending to women may be considered as a social goal in Bangladesh where women
have hardly access to borrowing but this is utterly a non issue in West Africa where women play
a major role in trade and businesses. Even in Bangladesh and similar countries that MFIs take
affirmative action and lend only or primarily to women, the issue is who decides what will be
done with the money-is it formal borrower, the women or the husband. Since our sample consists
of MFIs from all over the world, use of number of women borrowers as an output variable in the

social model may result in biased efficiency estimates. Thus, we use number of active borrowers
as an output variable.
Table 3 presents the variables used in the DEA analysis along with descriptive statistics, the
mean and standard deviation. Overall, the mean values of all variables are larger than the
respective standard deviations (Std. dev.). Thus, MFIs in our sample differ substantially with
respect to their input usage and output production. Table 4 illustrates definitions of input and
output variables used in the analyses. All financial variables are measured in United States
Dollars (US$).
INSERT TABLE 3 HERE
INSERT TABLE 4 HERE
3.3 Environmental Variables
3.3.1 MFI Age
Age of an MFI is measured in years since its inception. It can be taken as an indicator of the
experience and managerial ability of microfinance programs. The effect of age on technical
efficiency can be twofold. Some researchers (Ledgerwood, 1998; Paxton, 2007) argue that
efficiency improves as an MFI get mature. This can be due to several factors: it could be the
result of higher operating costs experienced by MFIs that first get off the market (Paxton, 2007).
Until they establish in the market by implementing suitable business models (“learning by
doing”), they may have to bear higher operating costs. It could also be due to the ability of older
firms to cushion the short term losses compared with younger firms (Grable & Lytton, 1998). On
the other hand, others (e.g., Hermes et al., 2011) provide evidence that age is negatively
associated with technical efficiency. This may be due to the fact that as firms age, they become
less able to respond to the new challenges (Barron et al. 1994).
3.3.2 MFIs Size
Literature on efficiency of banks and MFIs provide evidence that size is an important source of
bank efficiency. Size reflects the capacity of firms to compete with others in the market
(Gonzalez, 2007; Staub et al. 2010) as well as firm’s market’s awareness (Nhung & Okuda,
2015). Moreover, institutional size helps to account for the effects of differences in technology,

diversification, investment opportunities and other factors related to size (Berger & di Patti,
2006). Thus, we included size as an exogenous variable to see if the MFI’s size is related to its
degree of both dimension of efficiency estimates. Given the data availability, we measure the
size of MFIs in terms of their total assets.
Additionally, several variables that are likely to influence efficiency estimates are included to
control for the strategic niche of MFIs. These variables include: type of ownership (TYPE),
return on assets (ROA), debt to equity ratio (DEQR) and the geographical regions of MFIs
operate (REGION). Including of these variables further improves the comparability of efficiency
estimates. MFI ownership type is measured with TYPE dummy variable and it accounts for
effect of governance and regulatory models on financial and outreach efficiency estimates.
Following Servin et al. (2012), we include four types of ownerships: Credit Unions (CU), Non-
Bank Financial Intermediaries (NBFI), Banks (BANK) and Non-Governmental Organizations
(NGO). We assume that financial and outreach efficiencies of MFIs depend on their ownership
types as MFIs belong to different ownership structures seek different trade-offs of financial
sustainability and poverty outreach. In other words, the relative weights of financial and outreach
objectives differ by type of ownership (Servin et al. 2012). As a proxy for profitability, we
include the ROA, calculated as MFI profit after tax divided by total assets. It measures how
effectively assets of MFIs are being used to generate profits. Moreover, we include DER as a
proxy for MFIs leverage intensity that could be more of a tendency of donors to support more the
'social' 'MFIs with lending, particularly concessionary lending.
In order to determine the relationship between MFIs efficiency and age and size, following
regression model for both financial and outreach efficiency measures is separately estimated.
(5)
Where is the bias-corrected efficiency of the MFI yielded in the first stage, AGE indicates
the operation years of an MFI since inception. It is a dummy variable (equals one if a MFI is
new, equals zero otherwise; equals one if a MFI is young, equals zero otherwise), SIZE is the
size of an MFI. It measures in terms of total assets that include total of all net assets. TYPE is a
dummy variable (equals one if a MFI is CU, equals zero otherwise; equals one if a MFI is NBFI,
equals zero otherwise; equals one if a MFI is bank, equals zero otherwise), ROA is the net profit

before tax divided by total assets, DER is a proxy for MFIs leverage intensity and measured by
total liabilities divided by total equity, REGION is a dummy variable (equals one if a MFI has
been in operation in Asia, equals zero otherwise; equals one if a MFI has been in operation in
Latin America, equals zero otherwise; equals one if a MFI has been in operation in Africa, equals
zero otherwise), and ε is statistical noise.
The bootstrap estimates are produced using 2000 bootstrap replications. We use FEAR package
(Wilson, 2008) in the platform of R software to estimate the DEA efficiency estimates and
second stage truncated regression results. For the sake of brevity, we do not present the bootstrap
algorithms employed in the present paper. Interested readers are encouraged to consult Simar &
Wilson (1998, 2000, and 2007) for technical details.
4. Results
4.1 Return to scale test
A statistical hypothesis testing procedure as proposed by Simar & Wilson (2002) is undertaken
to determine the type of return to scale technology defined by the best performers in the sample.
Table 5 presents the estimation result of equation 2. Since tests statistic (S) values for both
models are greater than the respective critical values (α), we do not reject the null hypothesis.
Thus in the present study we employ the CCR model assuming that each MFI in our sample
operate with global CRS technology. The choice of CCR model to measure efficiency in this
study can also be justified based on the fact that CCR scores have traditional more variation and
its ability to identify the overall efficiency compared with BCC scores (Golany & Roll, 1989;
Barros & Dieke, 2008).
INSERT TABLE 5 HERE
4.2 First-stage results
Table 6 provides the summary of bootstrapped metafrontier results for MFIs in each
geographical region. The first 3 panels of the table depict the mean and standard deviations (std.
dev.) of group technology original efficiency (GTOE), group technology bias-corrected
efficiency (GTBCE) and the lower bound (LB) and upper bound (UB) of the 95% confidence
interval for group frontiers (GTCI). Then next 3 panels provide the mean and standard deviations
of metatechnology original efficiency (MTOE), metatechnology bias-corrected efficiency
(MTBCE) and LB and UB of the 95% confidence interval for metafrontier (MTCI). The last
panel of the table shows the MTR for MFIs in each region. MTR is measured by the gap between
groupfrontier and metafrontier as indicated in equation (1). Note that calculation of MTR using
bias-corrected efficiency scores lead to generate values greater than 1 for some regional frontiers.
Thus, following Fallah-Fini et al. (2012), we use original efficiency scores for calculating MTR
that falls between 0 and 1.
As can be seen from the table, mean GTOE and MTOE values for financial efficiency (FE) and
outreach efficiency (OE) remain outside the respective confidence intervals (CI) whereas mean
GTBCE and MTBCE values for both dimensions of efficiency remain inside the respective
confidence intervals of lower bound (LB) and upper bound (UB). This inconsistency between
original efficiency and bias-corrected efficiency scores can be explained by the fact that original
efficiency scores are based on the conventional DEA that fails to account for the measurement
error in the estimation of efficiency. Thus, it is clear that relying on original efficiency estimates
could lead to misleading policy conclusions.
Looking now at the mean values of GTBCE, we observe that mean FE scores range between
0.22 (Asia) and 0.62 (Africa).This indicates a high degree of heterogeneity in FE scores for MFIs
in 4 different geographical regions in the estimated group frontiers. Mean OE values range
between 0.28 (Africa) and 0.43 (Eastern Europe), indicating the same trend as above. It is also
notable that the standard deviation of OE is considerably higher than that of FE scores. The
smaller standard deviations for FE indicate a high degree of financial efficiency homogeneity in
each region whereas the considerably higher standard deviations for OE indicate higher
heterogeneity of outreach efficiency within each region, with the exception of Latin American
MFIs that is the largest group of the sample selected (212 observations). Looking at the mean
values of MTBCE, it is interesting to note that Asian MFIs that claim the lowest mean FE value
under group technology are replaced by African MFIs that however show the highest mean FE
value with respect to its group frontier. In other words, although African MFIs show the highest
FE (0.61) with respect to the group frontiers, the score considerably changes to 0.18 when we
consider the metafrontier. This indicates that the output vector is 61% of the maximum output
that could be produced on average when MFIs in the same region are compared, and that output

is 18% if the maximum output if the metatechnology is considered. Moreover, when consider the
OE under the metafrontier, Asian MFIs show the highest average OE whereas MFIs in Eastern
Europe show the lowest. Overall, the comparison of mean efficiency scores under group and
metafrontier technologies emphasizes the importance of model specification for MFIs operating
in different geographical regions. The last panel of the table 6 deliver calculated MTR for MFIs
in each region. Results reveal that MFIs in Asia have the highest MTR for both financial and
outreach dimensions with average of 0.981 and 1, respectively. This means that MFIs in Asia
financially and socially operate close to the metafrontier. The average MTR value of 1 for OE
indicates that MFIs in Asia is equally efficient in terms of poverty outreach with respect to both
group and metafrontier. On the contrary, the lowest mean MTR for FE and OE shown by MFIs
located in Africa and Eastern Europe, respectively. African MFIs are on average producing 28%
of their potential output taking into account their inputs and consequently, their potential
improvement is estimated at 72% on average. On the other hand, the average MTR for MFIs in
Eastern Europe (0.223) suggests that East European MFIs could produce 22.3% of the output
that could be produced using the same inputs and metatechnology. Thus, their average potential
improvement is estimated at 77.7%.
INSERT TABLE 6 HERE
4.3 Second-stage results
Table 7 presents the estimated bias-adjusted coefficients for FE and OE estimates. Note that
following Simar & Wilson (2007), we use the confidence interval for hypothesis testing to
determine whether estimated coefficients are statistically significant or not. If the value of zero
does not fall within the confidence interval, then the corresponding measure is statistically
significant. To preserve space, we do not report the confidence intervals, but these are available
on request.
Since some variables can be highly correlated, we first test for multicollinearity of the all
independent and control variables using the Variance Inflation Factor (VIF). Following the
thumb rule that VIFs of all regressors should be less than 10 (see Cohen et al., 2003), we find no
multicollinearity between environmental variables (mean VIF = 1.17). We also conduct a
robustness test by rerunning the control variables in two different ways. We examine whether the

variables that are significant in the model 1, still remain significant after dropping those
insignificant variables as presented in model 2. All statistically significant environmental
variables in the model 1 have the same directions in model 2 confirm the robustness of our
findings.
The results concerning the relationship between MFI age and efficiency estimates are mixed. The
coefficient concerning the relationship between new MFIs and financial efficiency is not
significantly different from zero suggesting that new MFIs make no effect on financial
efficiency. However, coefficient for young MFIs (YOUNG) remains negative and statistically
significant with financial efficiency suggesting that older MFIs perform better than younger ones
in terms of achieving financial results. This result is congruent with the results of Caudill et al.
(2008), Wijesiri et al. (2015) and Lebovics et al. (2014). A possible explanation for this result
might be that MFIs may take reasonable time period to capture the market. It is commonly
acknowledged that mutual understanding and trust between an MFI and its clients are very
important factors for the success of an MFI, especially for those which adopt group lending
methodology and this takes time (age) to grow. The negative relationship between financial
efficiency and age is, therefore, an indicator of the presence of learning by doing effect in the
industry. This result may also be explained by the fact that as MFIs age, some of them tend to
transform into different legal forms (for example from NGO to a NBFI), that allow them not
only to widen the range of products including savings services that are usually more important to
poor clients than lending (Vogel, 1984) but also to diversify their ownership and governance
structure, improve the management information systems and improve the transparency and
efficiency (Ledgerwood & White, 2006). With respect to the relationship between new MFIs and
OE, we find no evidence that new MFIs make significant effect on MFI outreach efficiency.
However, positive and statistically significant correlation between young MFIs and OE suggests
that mature MFIs are relatively inefficient in their outreach objectives. This finding is consistent
with Wijesiri et al. (2015) who argue that as MFIs age, they tend to diversify their portfolio
towards to the less poor. Consistent with Hartarska & Nadolnyak (2007), SIZE contributes
positively to both financial and outreach efficiency, suggesting that larger MFIs are more
efficient in terms of financial sustainability and poverty outreach. The reason can possibly be
attributed to the ability of larger MFIs to reduce the costs from economies of scale. Another
possible explanation for this positive relationship is that larger MFIs may use more sophisticated

technologies (i.e., advanced management information system, teller machines, online
transactions, mobile banking) and their ability to diversify products and services (i.e. savings
mobilization, remittance, insurance, leasing) through well-established branches network to
improve the financial inclusion in more cost effective way, compared to smaller MFIs that
depend on time and labor consuming outdated methods. This finding could also be due to the
fact that large MFI become a large one because repeat borrowers tend to take out increasingly
larger loans (for example Bank Rakyat Indonesia allowed doubling the loan value each year
provided the prior loan was repaid promptly). Hence, the client credit worthiness is well known
to the MFI, it requires less screening cost per loan and even much less per dollar of outstanding
loan portfolio, the larger loan is clearly more profitable product than the past smaller one as
higher income is received and cost per dollar lent are reduced. On the other hand, information
asymmetry between a larger MFI and its clients could be very low as larger firms have higher
society’s awareness that eventually lead to reduce agency costs (Nhung & Okuda, 2015). In
general, this finding is in line with the casual empiricism theory that argues that small financial
institutions are more likely to fail (Wheelock & Wilson, 2000). Considering control variables, it
is clear that estimated coefficient for CU dummy variable exhibits significant and positive
relationship with financial efficiency. However, this relationship is significant and negative with
outreach efficiency suggesting that credit unions are more market oriented. These results may be
due to the fact that credit unions are being member service organizations cater to people with a
common bond, not necessarily the poor (Hamed, 2007) and often they tend to lend less risky,
middle-class salaried borrows (Robinson, 2001). With regards to the coefficients for NBFI
dummy variable, it is positive and significant with financial efficiency implying that NBFIs are
more financially efficient. However, the negative and significant relationship between NBFI and
OE suggest that NBFIs are not efficient in terms of reaching to the poor. As shown in the table,
the estimated coefficient for BANK dummy variable is significant and positive with financial
efficiency implying that banks are financially more efficient compared to NGOs. On the other
hand, significant and negative coefficient for BANK dummy variable with outreach efficiency
suggests that banks are inefficient in outreach to the poor compared with NGOs. This finding is
in line with Gutierrez-Niéto et al. 2009; Servin et al., 2012 and Barry & Tacneng, 2014. In
general, the positive correlations between financial efficiency and all ownership types excluding
NGOs, may attributable to the fact that different financing options including savings

mobilizations available to them. In other words, compared with NGOs that are not allowed to
accept public deposits, regulated MFIs that have a large savings value as a % of total loan
portfolio are likely to have a different production function (e.g. lower cost of capital because
interest paid on saving is lower than interest paid on unsubsidized loans but also relatively higher
administrative cost resulted from handling saving services) and tend to operate more efficiently.
On the other hand, we find a positive and significant relationship between NGO and outreach
efficiency, suggesting that NGOs are more effective in terms of achieving social objectives. This
finding confirms the earlier findings (e.g., Gutierrez-Niéto et al. 2009; Wijesiri et al., 2015) and
consistent with the view that NGOs put more weight on social objectives (Morduch, 1999;
Servin et al., 2012). As concern the ROA, it is clear that ROA exhibits positive and statistically
significant relationship with financial efficiency. This positive effect of ROA on financial
efficiency may reflect the fact that more profitable MFIs tend to have higher financial efficiency.
This finding is also consistent with the view that in order to achieve financial sustainability,
MFIs have to be financially more efficient. However, the coefficient concerning the relationship
between ROA and outreach efficiency is not significant suggesting that financial performance
measured by ROA makes no effect on outreach efficiency. This finding is in line with Gutiérrez-
Nieto et al. (2009) and Lebovics et al. (2014). The reason for this is not clear but it perhaps can
be explained by the notion of donor expectations. In real life some donors expect and push MFIs
to go for more poverty impact (Balkenhol, 2007) despite the fact, that higher operating costs per
dollar lent are involved. In such a situation, subsidies fuel them to set their outreach objectives,
irrespective of whether they are profitable or not. Thus, it seems that profitability and social
efficiency do not necessarily go hand in hand. The coefficient concerning the relationship
between DER and financial efficiency is negative, but not statistically significant. This suggests
that DER does not exert any perceptible bearing on financial efficiency. On the other hand, DER
shows a negative and statistically significant relationship with outreach efficiency suggesting
that MFIs with higher outreach efficiency, ceteris paribus, uses less debt financing. One possible
reason for this negative relationship is that debt financing is not common in MFIs that focus
more on mitigating poverty as some commercial lenders are reluctant to lend for such highly
risky business. This result also indicates that when an MFI just start operating, it may be
financed only by a grant that is converted to equity followed by donor's underscoring and
preferring working on outreach aspects primarily, only when they grow and "prove" themselves

they might become a candidate for borrowing. With regard to the REGION dummy variables,
they all show negative and statistically significant relationship with financial efficiency and
positive and statistically significant with outreach efficiency. This result suggests that MFIs in
Latin America (LA), Asia (ASIA) and Africa (AFRICA) are financially inefficient but efficient
in terms of outreach to the poor. MFIs in Eastern Europe (EE), on the other hand, show an
opposite relationship. Though financially efficient, they are inefficient in terms of poverty
outreach. This finding is in line with the findings of Gutierrez-Niéto et al. (2009). Note that the
same substantive findings with model 2 confirm that results in model 1 are robust.
INSERT TABLE 7 HERE
5. Conclusion, research implications and future research agenda
When we feed back our findings to the more theoretical observations discussed in the
introduction, we can make the following comments.
This study advances the literature on MFIs efficiency by investigating the impacts of age and
size simultaneously along financial and depth of outreach efficiency dimensions. Because the
sample of MFIs in our study is from several geographical regions, estimating a single frontier for
the whole sample assuming that all MFIs use the same technology is likely to result in biased
efficiency estimates. Thus, we use a metafrontier model that takes into account any heterogeneity
between MFIs operate in different regions in the comparison of efficiency scores. We use the
bootstrapped DEA method proposed by Simar & Wilosn (1998, 2000) to construct the
metafrontier model and subsequently obtain bias-corrected efficiency scores. Then, bias-
corrected efficiency scores are regressed on age, size and several control variables using the
double bootstrap truncated regression approach proposed by Simar & Wilson (2007).
Our results highlight the importance of model specification for MFIs operating in different
geographical regions. Moreover, we find that although older MFIs perform better than younger
ones in terms of achieving financial goals, they are relatively inefficient in achieving their
outreach objectives. Additionally, we find, not surprisingly, size of MFIs matters: the bigger
MFIs that may have more assets, staff, clients and more credit lines tend to have higher financial
and outreach efficiencies. Collectively, our findings support the view that it is old and large
MFIs that are more likely to be allowed to mobilize voluntary savings than young and small ones

and consequently become more efficient in terms of financial intermediation and addressing
demand for savings that is highly appreciated by savers.
Findings of this study make reliable and up-to-date policy conclusions that would be of
importance to a number of interested groups. Since efficiency reflects on and are affected by the
policy decisions (Mukherjee et al. 2002) understanding the impact of age and size on both
dimensions of efficiency estimates helps policy makers to evaluate the strengths and weaknesses
of current policy choices. Moreover, identifying how age and size influence on both dimensions
of efficiency is of utmost importance for incumbent MFIs and perhaps more importantly for
NGOs that think of setting up microfinance programs to design viable business models to
compete and join the better performers in the increasingly becoming crowded market.
Additionally, donors who have a growing interest in financial and social performance of MFIs
within which they could evaluate whether the funding support is warranted, can use the findings
of the present study to design viable mechanisms that are directly linked to clear quantifiable
milestone achievements of financial sustainability and outreach of target clientele.
In qualifying our conclusions, we recognize following caveats and research implications in our
study.
I. Because of paucity of available time-series data for individual MFIs, we conduct this
empirical study based on a sample of cross-sectional data. Thus, the present study does
not acknowledge the shifts in the frontier of MFIs in response to changes in regulatory
and technical instruments in the market.
II. Given the data availability, we use total assets to measure MFI size. Use of total assets as
a proxy for MFI size would be more appropriate in the context of financial model.
However, we believe a measurement of the size based on the number of clients seems
more relevant in the outreach model. Thus, future research adding the size in number of
clients may provide new insights on the impact of the size variable on MFI performance.
III. While our sample drawn from MIX has several strengths, it also has some weaknesses.
Data available in MIX are reported voluntarily and in most cases financial ratios are
systematically, only partially adjusted for subsidies compared to what they should. For
example, financial performance of MFIs as measured by ROA and the widely- used
Financial Self-Sufficiency (FSS) as presented in MIX publications suffer from two basic
distortions that usually result in presenting 'adjusted' ROAs that underestimate subsidies
received by the MFI, or alternatively put, presenting higher financial sustainability than
the actual one as elaborated in Manos and Yaron (2009b). First, the shadow prices used
by MIX to charge the average annual equity of the MFI (that is a cost free item in
accounting terms) is the annual inflation rate. No investor, whether private or public
would agree to accept zero return on equity measured in real terms as an adequate return.
Hence, the real cost of equity is higher than the inflation rate and in developing countries
it is usually much higher. Therefore, the lower is the DER ratio the higher is the subsidy
ingredient which is not captured by the ROA that MIX presents. Second, MIX applies the
deposit interest rate prevailing in the country concerned, as the shadow price for
concessionary borrowing of the MFIs, instead of the lending rate (plus an often needed
upward adjustment). This practice clearly underestimates subsidies received by the MFI
and overstates financial sustainability.
IV. There are a number of studies that use production frontier methods to determine a
possible trade-off between outreach and sustainability. While some studies (e.g., Hermes
et al., 2011; Abate et al., 2013) reveal a trade-off between increasing outreach to the poor
and gaining financial sustainability, some others (e.g., Gutierrez-Nieto et al., 2009;
Mersland & Strom, 2010) conclude that both complement each other. One of the major
reasons for these inconclusive and ambiguous findings is that these studies use efficiency
as a criterion to measure the sustainability. In the context of microfinance, “financial
sustainability” refers to ability of MFIs to operate free from subsidized inputs (Morduch,
1999). For example, Conning (1999) writes “In most discussions sustainability is taken to
mean full cost recovery or profit making, and is associated with the aim of building
microfinance institutions that can last into the future without continued reliance on
government subsidies or donor funds”. There are a large number of MFIs across the
world that relies on various levels of subsidies to cover their costs (Quayes, 2012; Piot-
Lepetit & Nzongang, 2014) and some of which can be fully efficient as subsidies can
improve the MFI efficiency (Hudon & Traca, 2011). For example, our results show that
some MFIs are fully efficient when compared to its peers. Though fully efficient, some of
them could be highly subsidized as much of the success of microfinance has been
dependent on the role of continuing subsidies (Morduch, 1999). Thus, this finding does

not necessarily mean that those MFIs that lie on the constructed frontier are sustainable
(or subsidy independent). We, therefore, wish to claim that relying on only efficiency
scores yielded from production frontier methods is not adequate to determine the existing
of either compatibility or trade-off between MFI dual objectives. Instead, applying jointly
the production frontier and the SDI methodologies could upgrade evaluation and
measurement of MFIs' efficiency, their financial performance and subsidy dependence,
thereby generating improved understanding of their actual benefits and costs- a
prerequisite for meaningful and effective support granted to the MFI industry. Applying
these methodologies would also allow useful comparison with the benefits and cost of
other poverty reducing instruments that also aspire to enhance the welfare of the same
target clientele, could improve resource allocation and better use of public funds as well
as facilitate linking support to MFI to achieving of measurable objectives of outreach,
financial sustainability and efficiency. Thus, future investigations using data for multiple
years and using jointly the production frontier and the SDI methodologies would be an
important extension to the present paper.

References
Abate, G.T., Borzaga, C., Getnet, K., 2014. Cost efficiency and outreach of microfinance
institutions: Trade-offs and the role of ownership. Journal of International Development. 26(6),
923-932.
Assaf, A., Barros, C. P., Josiassen, A., 2010. Hotel efficiency: A bootstrapped metafrontier
approach. International Journal of Hospitality Management, 29(3), 468-475.
Ahlin, C., Lin, J., Maio, M., 2011. Where does microfinance flourish? Microfinance institution
performance in macroeconomic context. Journal of Development Economics. 95, 105–120.
Athanassopoulos, A.D., 1997. Service quality and operating efficiency synergies for
management control in the provision of financial services: Evidence from Greek bank branches.
European Journal of Operational Research. 98, 300-313.
Athanassopoulos, A.D., Ballantine, J.A., 1995. Ratio and Frontier Analysis for Assessing
Corporate Performance: Evidence from the Grocery Industry in the UK. The Journal of the
Operational Research Society. 46(4), 427-440.
Aveh, F.K., Krah, R.Y., Dadzie, P.S., 2013. An evaluation of sustainability and subsidy
dependence of microfinance institutions in Ghana. International Business and Management, 6
(1), 55-63.
Balkenhol, B., 2007. Efficiency and sustainability in microfinance. In Balkenhol, B. eds.
Microfinace and Public Policy. Outreach, performance and efficiency. PALGRAVE
MACMILLAN, New York, N.Y., & International Labor Office, Geneva, Switzerland, pp. 3-23.
Banker, R.D., Charnes, A., Cooper, W.W., 1984. Some models for estimating technical and scale
inefficiencies in data envelopment analysis. Management Science. 30 (9),
1078-1092.
Barron, D.N., West, E., Hannan, M.T., 1994. A Time to Grow and a Time to Die: Growth and
Mortality of Credit Unions in New YorkCity, 1914-1990. American Journal of Sociology.
100(2), 381-421.

Barros, C.P., 2008. Airports in Argentina: Technical efficiency in the context of an economic
crisis. Journal of Air Transport Management, 14, 315–319.
Barros, C.P., Dieke, P.U.C., 2008. Measuring the economic efficiency of airports: A Simar-
Wilson methodology analysis. Transportation Research Part E, 44, 1039–1051.
Barry, T.A., Tacneng, R., 2014. The Impact of Governance and Institutional Quality on MFI
Outreach and Financial Performance in Sub-Saharan Africa. World Development. 58, 1–20.
Battese, G.E., Rao, D.S.P., O’Donnel, C.J., 2004. A Metafrontier Production Function for
Estimation of Technical Efficiencies and Technology Gaps for Firms Operating Under Different
Technologies. Journal of Productivity Analysis, 21, 91–103.
Berger, A. N., Humphrey, D.B., 1997. Efficiency of financial institutions: International survey
and directions for future research. European Journal of Operational Research. 98(2),175–212.
Berger, A.N., Mester, L.J., 1997. Inside the black box: What explains differences in the
efficiencies of financial institutions? Journal of Banking & Finance. 21, 895-947.
Berger, A.N., di Patti, E.B., 2006. Capital structure and firm performance: A new approach to
testing agency theory and an application to the banking industry. Journal of Banking & Finance.
30,1065–1102.
Caudill, S.B., Gropper, D.M., Hartarska, V., 2009. Which Microfinance Institutions Are
Becoming More Cost Effective with Time? Evidence from a Mixture Model. Journal of Money,
Credit and Banking. 41(4), 651-672.
Charnes, A., Cooper, W., Rhodes, E., 1978. Measuring the efficiency of decision making units.
European Journal of Operational Research. 2, 429-444.
Coelli, T. J., Prasada Rao, D. S., O’Donnell, C. J., Battese, G. E., 2005. An Introduction to
Efficiency and Productivity Analysis. Springer Science + Business Media, Inc., New York,
USA.
Cohen, J., Cohen, P., West, S. G., Aiken, L., 2003. Applied multiple regression/correlation
analysis for the behavioral sciences (3rd ed.). Mahwah, NJ: Lawrence Erlbaum.

Cooper, W., Li, S., Seiford, L., Thrall, R.M., Zhu, J., 2001. Sensitivity and stability analysis in
DEA: some recent developments. Journal of Productivity Analysis. 15(3), 217-246.
Conning, J., 1999. Outreach, sustainability and leverage in monitored and peer-monitored
lending. Journal of Development Economics. 60, 51-77.
Cull, R., Demirguc-Kunt, A., Morduch, J., 2007. Financial performance and outreach: a global
analysis of leading microbanks. The Economic Journal. 117, 107-133.
Cull, R., Demirguc-Kunt, A., Morduch, J., 2011. Does Regulatory Supervision Curtail
Microfinance Profitability and Outreach? World Development. 39( 6), 949–965.
D’Espallier, B., Hudonc, M., Szafarz, A., 2013. Unsubsidized microfinance institutions.
Economics Letters. 120, 174–176.
Dietsch, M., Lozano-Vivas, A., 2000. How the environment determines banking efficiency: A
comparison between French and Spanish industries. Journal of Banking and Finance. 24, 985–
1004.
Dyson, R.G., Shale, E.A., 2010. Data Envelopment Analysis, Operational Research and
Uncertainty. The Journal of the Operational Research Society, 61(1), 25-34.
Edirisinghe, N.C.P, Zhang, X., 2010. Input/output selection in DEA under expert
information,with application to financial markets. European Journal of Operational Research.
207, 1669–1678.
Efron, B., 1979. Bootstrap methods: Another look at the Jackknife. Annals of Statistics. 7, 1–16.
Fallah-Fini, S., Triantis, K., de la Garza, J.M., Seaver, W.L., 2012. Measuring the efficiency of
highway maintenance contracting strategies: A bootstrapped non-parametric meta-frontier
approach. European Journal of Operational Research. 219, 134–145.
Farrell, M.J., 1957. The measurement of productive efficiency. Journal of Royal Society of
Statistics. 120(3), 253-290.
Francisco, M., Mascaró, Y., Mendoza, J.C., Yaron, J., 2008. Measuring the Performance and
Achievement of Social Objectives of Development Finance Institutions. Policy Research
Working Paper 4506, The World Bank, Washington, DC.
Galema, R., Lensink, R., Spierdijk, L., 2011. International diversification and Microfinance. Journal of
International Money and Finance, 30, 507–515.
Gonzalez, A., 2007. Efficiency drivers of microfinance institutions (MFIs): operating expenses
and its drivers. Discussion paper No. 2: Microfinance Information Exchange, Washington DC.
Golany, B., Roll, Y., 1989. An Application Procedure for DEA. OMEGA, 17(3), 237-250.
Golany, B. & Storbeck, J.E. (1999). A data envelopment analysis of the operational efficiency of bank
branches. Interfaces, 29(3), 14-26.
Grable, J. E., Lytton, R. H., 1998. Investor risk tolerance: Testing the efficacy of demographics
as differentiating and classifying factors. Financial Counseling and Planning. 9(1), 61–74.
Gregoriou, G.N., Sedzro, K., Zhu, J., 2005. Hedge fund performance appraisal using data
envelopment analysis. European Journal of Operational Research. 164, 555–571.
Gutierrez-Niéto, B., Serrano-Cinca, C., Molinero, C.M., 2007. Microfinance institutions and
efficiency. The International Journal of Management Science. 35, 131-142.
Gutierrez-Niéto, B., Serrano-Cinca, C., Molinero, C.M., 2009. Social efficiency in microfinance
institutions. Journal of the Operational Research Society. 60,104-119.
Halkos, G.E., Tzeremes, N.G., 2012. Industry performance evaluation with the use of financial ratios: An
application of bootstrapped DEA. Expert Systems with Applications, 39,5872-5880.
Hamed, Y., 2007. Efficiency drivers and constraints: Empirical findings. In Balkenhol, B. eds.
Microfinace and Public Policy. Outreach, performance and efficiency. PALGRAVE
MACMILLAN, New York, N.Y., & International Labor Office, Geneva, Switzerland, pp. 126-
152.
Hartarska,V., 2005. Governance and performance of microfinance institutions in Central and Eastern
Europe and the Newly Independent States. World Development. 33(10),1627–1643.

Hartarska, V., Nadolnyak, D., 2007. Do regulated microfinance institutions achieve better
sustainability and outreach? Cross-country evidence. Applied Economics. 39, 1207–1222.
Hayami, Y., Ruttan. V.W., 1971. Agricultural Development: An International Perspective.
Baltimore: Johns Hopkins University Press, (pp. 82).
Hermes, N., Lensink, R., 2011. Microfinance: Its impact, outreach, and sustainability. World
Development. 39(6), 875–881.
Hermes, N., Lensink, R., Meesters, A., 2011. Outreach and efficiency of microfinance
institutions. World Development. 39(6), 938-948.
Hudon, M., Traca, D., 2011. On the Efficiency Effects of Subsidies in Microfinance: An
Empirical Inquiry. World Development. 39(6), 966-973.
Lebovics, M., Hermes, N., Hudon, M., 2014. Are financial and social efficiency mutually
exclusive? A case study of Vietnamese microfinance institutions. Centre Emile Bernheim,
Solvay Business School, CEB Working Paper N° 14/009.
Ledgerwood, J., 1998. Microfinance handbook: An institutional and financial perspective. World Bank-
free PDF, The World Bank, Washington, D.C.
Ledgerwood, J., White. V., 2006. Transforming microfinance institutions: Providing full
financial services to the poor. The World Bank, Washington, DC.
Louis, P., Sert, A., Baesens, B., 2013. Financial Efficiency and Social Impact of Microfinance
Institutions Using Self-Organizing Maps. World Development. 46, 197-210.
Manos, R., Yaron, J., 2009a. Key issues in assessing the performance of microfinance
institutions. Canadian Journal of Development Studies, 29(1-2), 101-122.
Manos, R, Yaron, J., 2009b. What is wrong with 'adjusted' accounting ratios that are commonly
used by the microfinance industry to measure financial performance? Journal of Financial
Decision Making. 5(1), 27-38.
Mersland, R., Strom, R., 2010. Microfinance mission drift? World Development, 38, 28–36.

Mester, L.J., 1996. A study of bank efficiency taking into account risk preferences. Journal of
Banking and Finance. 20, 1025-1045.
Mitropoulos, P., Taliasb, M.A., Mitropoulos, I., 2015. Combining stochastic DEA with Bayesian
analysis to obtain statistical properties of the efficiency scores: An application to Greek public
hospitals. European Journal of Operational Research. 243, 302–311.
Morduch, J., 1999. The microfinance promise. Journal of Economic Literature. 37, 1569–1614.
Mukherjee, A., Nath, P, Pal, M.N., 2002. Performance benchmarking and strategic homogeneity
of Indian banks. International Journal of Bank Marketing. 20(3), 122-139.
Nawaz, A., 2010. Performance of microfinance: the role of subsidies. Savings and
Development,34, 97-138.
Nhung, L.T.P., Okuda, H., 2015. Effects of state ownership on companies’ capital structure and
profitability: Estimation analysis before and after the Lehman shock. Journal of Asian
Economics. 38, 64-78.
O’Donnell, C., Rao, D., Battese, G., 2008. Metafrontier frameworks for the study of firm-level
efficiencies and technology ratios. Empirical Economics 34, 231–255.
Paradi, J.C., Rouatt, S., Zhu, H., 2011. Two-stage evaluation of bank branch efficiency using
data envelopment analysis. Omega. 39, 99-109.
Paradi, J.C., Zhu, H., 2013. A survey on bank branch efficiency and performance research with
data envelopment analysis. Omega. 41,61-79.
Paxton, J., 2003. A poverty outreach index and its application to microfinance. Economics
Bulletin, 9, 1–10.
Paxton, J., 2007. Technical Efficiency in a semi-formal financial sector: The case of Mexico.
Oxford Bulletin of economics and Statistics. 69(1), 57-74.

Piot-Lepetit, I., Nzongang, J., 2014. Financial sustainability and poverty outreach within a
network of village banks in Cameroon: A multi-DEA approach. European Journal of Operational
Research. 234(1), 319-330.
Pitt, M. M., Khandker, S. R. (1998). The impact of group-based credit programs on poor
households in Bangladesh: Does the gender of participants matter? Journal of political
economy, 106(5), 958-996.
Robinson, M., 2001. The microfinance revolution: Sustainable finance for the poor. The World
Bank, Washington, DC, pp. 92.
Schreiner, M., 2002. Aspects of outreach: A framework for discussion of the social benefits of
microfinance. Journal of International Development. 14, 591-603.
Seiford, L.M., Zhu, J., 1999a. Profitability and marketability of the top 55 U.S. commercial
banks. Management Science. 45(9), 1270-1288.
Seiford, L.M., Zhu, J., 1999b. An investigation of returns to scale in data envelopment analysis.
Omega. 27(1), 1-11.
Servin, R., Lensink, R., van den Berg, M., 2012. Ownership and technical efficiency of
microfinance institutions: Empirical evidence from Latin America. Journal of Banking &
Finance. 36, 2136–2144.
Sharma, P. P., 2014. Financial Performance and Sustainability Issues of Subsidized and Non-
Subsidized Entities in North East India. Arthshastra: Indian Journal of Economics &
Research, 3(6), 32-42.
Simar, L., Wilson, P., 1998. Sensitivity analysis of efficiency scores: how to bootstrap in
nonparametric frontier models. Management Science. 44,49-61.
Simar, L., Wilson, P.W., 2000. A General Methodology for Bootstrapping in Non-Parametric
Frontier Models. Journal of Applied Statistics. 27(6),779-802.

Simar, L., Wilson, P.W., 2002. Non-parametric tests of returns to scale. European Journal of
Operational Research. 139, 115-132.
Simar, L., Wilson, P.W., 2007. Estimation and inference in two-stage, semi-parametric models
of production processes. Journal of Econometrics. 136, 31–64.
Song, M., Zhang, L., Liu, W., Fisher, R., 2013. Bootstrap-DEA analysis of BRICS’ energy
efficiency based on small sample data. Applied Energy. 112, 1049-1055.
Staub, R.B., da Silva e Souza, G., Tabak, B.M., 2010. Evolution of bank efficiency in Brazil: A
DEA approach. European Journal of Operational Research. 202, 204–213.
Strom, R.O., D’Espallier, B., Mersland, R., 2014. Female leadership, performance, and
governance in microfinance institutions. Journal of Banking & Finance. 42, 60–75.
Tzeremes, N.G., 2015. Efficiency dynamics in Indian banking: A conditional directional distance
Approach. European Journal of Operational Research. 240, 807–818.
Vogel, R.C., 1984. Savings mobilization: The forgotten half of rural finance. In Adams, D.W.,
Graham, D.H., & Von Pischke, J.D. eds. Undermining rural development with cheap credit.
Westview Press, Inc. USA.
Wheelock, D.C., Wilson, P.W., 2000. Why Do Banks Disappear? The Determinants of U.S.
Bank Failures and Acquisitions. The Review of Economics and Statistics. 82(1),127-138.
Widiarto, I., Emrouznejad, A., 2015. Social and financial efficiency of Islamic microfinance
institutions: A Data Envelopment Analysis application. Socio-Economic Planning Sciences. 50,
1–17.
Wijesiri, M., Viganò, L., Meoli, M., 2015. Efficiency of microfinance institutions in Sri Lanka: a
two-stage double bootstrap DEA approach. Economic Modelling. 47, 74-83.
Wijesiri, M., Meoli, M., 2015. Productivity change of microfinance institutions in Kenya: A
bootstrap Malmquist approach. Journal of Retailing and Consumer Services. 25, 115–121.

Wilson, P. W., 2008. FEAR: a software package for frontier efficiency analysis with R. Socio-
Economic Planning Sciences. 42, 247-254.
Yaron, J., 1992a. Successful rural finance institutions. Discussion paper No 150, World Bank.
Washington, D.C.
Yaron, J., 1994. What makes rural financial institutions successful? The World Bank Research
Observer. 9(1), 49-70.
Yaron, J., Benjamin, M., Piprek, G., 1997. Rural finance: Issues, design, and best practices.
Environmentally sustainable development studies and Monographs series, The World Bank,
Washington, D.C.
Yaron, J., Manos, R., 2007. Is the microfinance industry misleading the public regarding its
subsidy dependence? Savings & Development. 2,131-160.
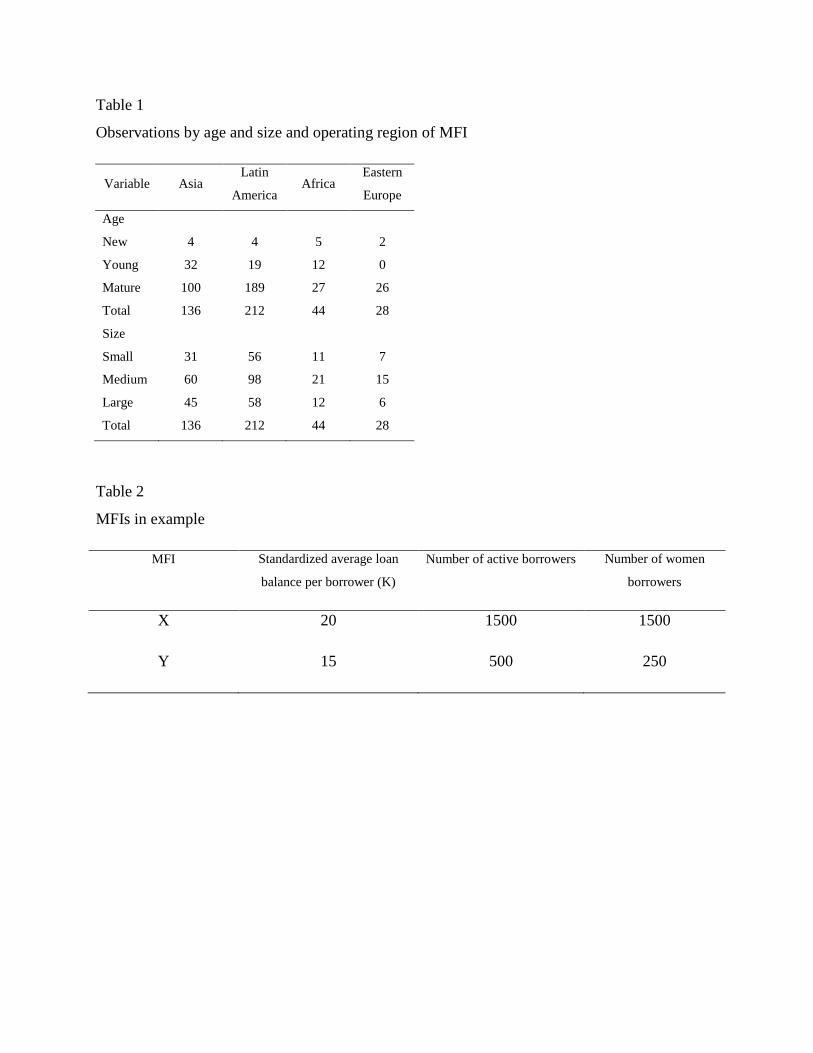
Table 1
Observations by age and size and operating region of MFI
Variable Asia Latin
America Africa
Eastern
Europe
Age
New 4 4 5 2
Young 32 19 12 0
Mature 100 189 27 26
Total 136 212 44 28
Size
Small 31 56 11 7
Medium 60 98 21 15
Large 45 58 12 6
Total 136 212 44 28
Table 2
MFIs in example
MFI Standardized average loan
balance per borrower (K)
Number of active borrowers Number of women
borrowers
X 20 1500 1500
Y 15 500 250

Table 3
Main descriptive statistics for variables used in this study
Variable All MFIs
MFIS (Asia)
MFIs (Latin
America) MFIs (Africa)
MFIs (Eastern
Europe)
OPEX' 000
Mean
11,301
10,371
12,193
13,080
6,263
Std. dev.
24,089
20,482
25,769
31,244
11,040
Personnel
Mean
610
1,030
386
661
179
Std. dev.
1,452
2,252
702
1,117
240
GLP' 000
Mean
92,708
129,838
78,784
74,545
46,031
Std. dev.
346,883
528,469
205,182
274,023
108,139
Revenue' 000
Mean
2,078
24,018
20,334
19,864
9,937
Std. dev.
50,134
57,923
45,952
56,970
19,493
ALB
Mean
6.88
6.31
8.40
3.28
3.77
Std. dev.
8.53
5.74
10.42
4.17
6.03
AB'000

Mean
135
319
44
77
18
Std. dev.
576
979
94
153
28
Note: OPEX = Operating expenses; GLP = Gross loan portfolio; ALB = Standardized average loan
balance per borrower (inverse value); AB = Number of active borrowers
Table 4
Input and output variable definitions
Variable Unit Definition
Operating expenses US$ Expenses related to operations, including all personnel expense, depreciation
and amortization, and administrative expense.
Total number of employees
Number
The number of individuals who are actively employed by MFI.
Gross loan portfolio (GLP) US$ All outstanding principals due for all outstanding client loans. This includes
current, delinquent, and renegotiated loans, but not loans that have been
written off. It does not include interest receivable.
Financial revenue
US$
Revenues from the loan portfolio and from other financial assets are broken
out separately and by type of income (interest, fee).
Standardized average loan
balance (inverse value)
Number Average loan balance per borrower/ GNI per capita
Number of active borrowers Number The number of individuals who currently have an outstanding loan balance
with the MFI or are primarily responsible for repaying any portion of the
GLP.
Note: All definitions are compiled from MixMarket database, accessed in April, 2015
(http://www.mixmarket.org/about/faqs/glossary)
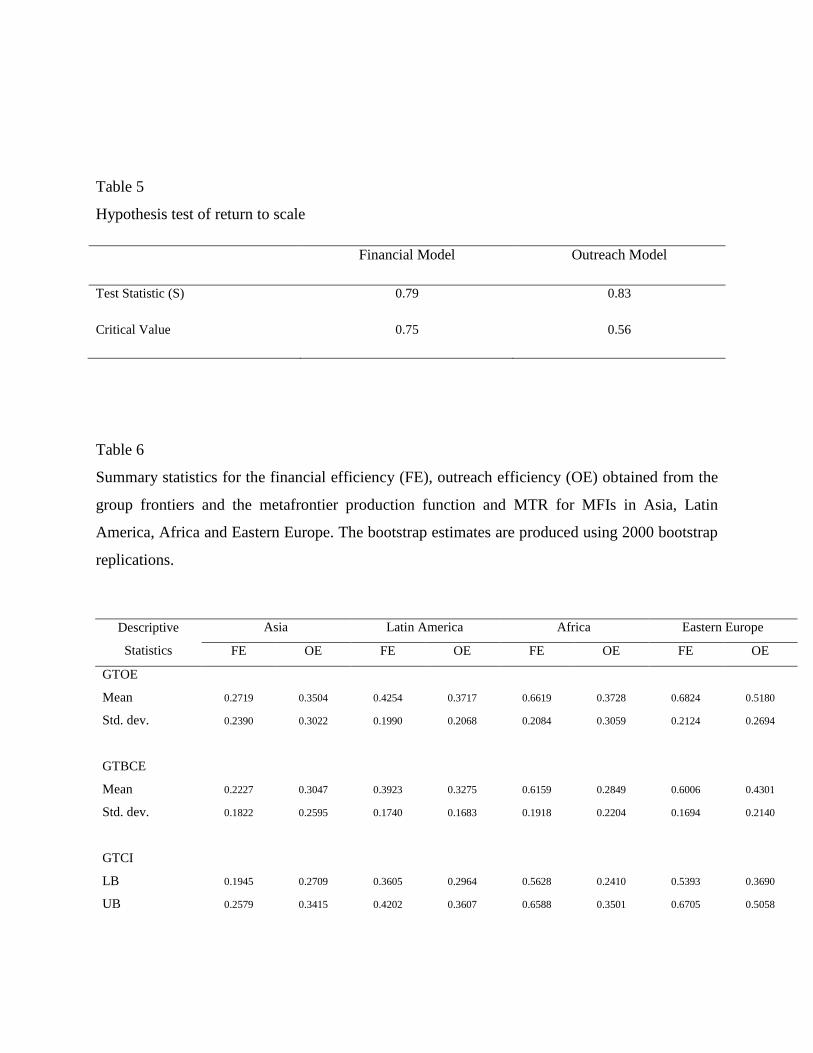
Table 5
Hypothesis test of return to scale
Financial Model Outreach Model
Test Statistic (S) 0.79 0.83
Critical Value 0.75 0.56
Table 6
Summary statistics for the financial efficiency (FE), outreach efficiency (OE) obtained from the
group frontiers and the metafrontier production function and MTR for MFIs in Asia, Latin
America, Africa and Eastern Europe. The bootstrap estimates are produced using 2000 bootstrap
replications.
Descriptive
Statistics
Asia Latin America Africa Eastern Europe
FE OE FE OE FE OE FE OE
GTOE
Mean 0.2719 0.3504 0.4254 0.3717 0.6619 0.3728 0.6824 0.5180
Std. dev. 0.2390 0.3022 0.1990 0.2068 0.2084 0.3059 0.2124 0.2694
GTBCE
Mean 0.2227 0.3047 0.3923 0.3275 0.6159 0.2849 0.6006 0.4301
Std. dev. 0.1822 0.2595 0.1740 0.1683 0.1918 0.2204 0.1694 0.2140
GTCI
LB 0.1945 0.2709 0.3605 0.2964 0.5628 0.2410 0.5393 0.3690
UB 0.2579 0.3415 0.4202 0.3607 0.6588 0.3501 0.6705 0.5058

MTOE
Mean 0.2614 0.3504 0.3539 0.1687 0.1902 0.1506 0.3565 0.1185
Std. dev. 0.2198 0.3022 0.1781 0.1177 0.1036 0.1186 0.1492 0.0863
MTBCE
Mean 0.2135 0.2908 0.3238 0.1484 0.1795 0.1332 0.3224 0.1076
Std. dev. 0.1862 0.2443 0.1490 0.0966 0.0980 0.1053 0.1194 0.0745
MTCI
LB 0.2132 0.2551 0.2995 0.1326 0.1679 0.1194 0.2967 0.0972
UB 0.2550 0.3337 0.3465 0.1648 0.1881 0.1466 0.3475 0.1164
MTR
Mean 0.9816 1.0000 0.8245 0.4459 0.2803 0.4720 0.5235 0.2226
Std. dev. 0.0488 0.0000 0.0383 0.0862 0.1053 0.1382 0.1159 0.0668
Table 7
Truncated bootstrap second stage regression
Variable FE SE
Model 1 Model 2 Model 1 Model 2
Constant -0.9971*** -1.0072*** 0.9737*** 0.7711***
New 0.0534 0.0548 -0.1219 -0.0945
Young -0.1235** -0.1257** 0.0831** 0.0849**
Size 0.0000009*** 0.0000009*** 0.0000011*** 0.0000011***
CU 0.2871*** 0.2863*** -0.0965** -0.0967**
NBFI 0.0907** 0.0906** -0.0595* -0.0581*
Bank 0.2665*** 0.2666*** -0.2941*** -0.3009***
ROA 1.3713*** 1.3667*** -0.2102
DER -0.0002
-0.0042** -0.0042**
Latin America -0.0975* -0.0970* 0.1565** 0.1566**
Asia -0.2309*** -0.2311*** 0.2666*** 0.2630***
Africa -0.4339*** -0.4297*** 0.2075*** 0.2108***

(***), (**), (*): statistically significant at 1% , 5% and 10% respectively; total number of iterations = 2000