municipal groundwater monitoring in waterloo region - solinst · municipal groundwater monitoring...
TRANSCRIPT

Tammy Middleton, M.Sc. P.Geo.
Senior Hydrogeologist
Regional Municipality of Waterloo
Municipal GroundwaterMunicipal GroundwaterMonitoring in WaterlooMonitoring in Waterloo
RegionRegion

Presentation OverviewPresentation Overview
• Waterloo Region
• Groundwater
monitoring programs
– Overview and
examples
• Clean Water Act
• Next Steps/Lessons
Learned

7 Municipalities
525,000 people
12.5 Billion Igal
17 water supply
systems
13 waste water
systems (2009)

Water SourcesWater Sources
• Surface Water
– Intake at Grand
River (Kitchener)
– Treatment at
Mannheim WTP
– 20%

Water SourcesWater Sources
Groundwater Wells
– 120 wells
– GUDI Wells (under
influence of surface
water)
– Aquifer Storage &
Recovery Wells
– Waterloo Moraine,
Fractured Rock, and
River Collector wells
– 80%

Water Sources
Rural
& Urban
Elmira
Cambridge

HydrogeologyHydrogeology
& Source Water Group& Source Water Group
Education/
Awareness
Contamination
Assessment
Source
Protection
PoliciesCompliance
Resource
Monitoring
Well
Upgrades
Well
Maintenance
New
Supplies
Water
Supply

Monitoring ProgramsMonitoring Programs
• 120 Production Wells
• 50 Monitoring Well nests (quality)
• 170 Monitoring Well nests (levels)
• RoW Laboratory
• On-line analyzers
• Monitoring Scope:
– Regulatory &
– “Beyond-Regulatory”

Monitoring Program ObjectivesMonitoring Program Objectives
Compliance with Legislation
Proactive monitoring - early warning of
supply or contamination issues
Sustainable management of groundwater
resources
Understanding the hydrogeological systems
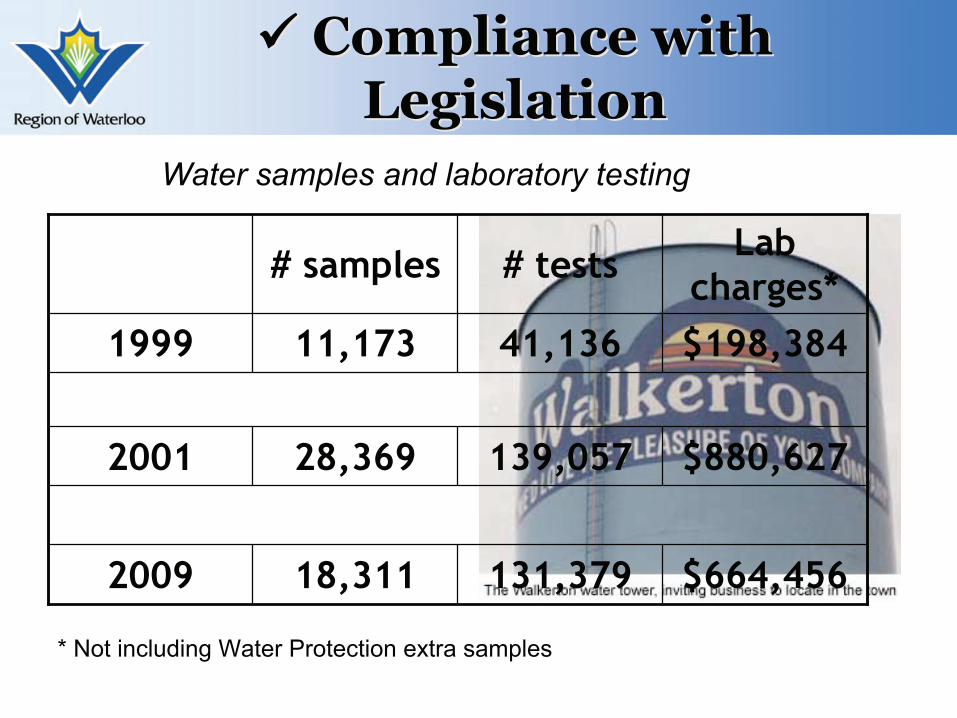
Compliance with Compliance with
LegislationLegislation
$664,456
$880,627
$198,384
Labcharges*
139,05728,3692001
41,13611,1731999
131,37918,3112009
# tests# samples
* Not including Water Protection extra samples
Water samples and laboratory testing

Proactive Monitoring Proactive Monitoring
GreenbrookGreenbrook Wellfield Wellfield
• 5 overburden wells (Waterloo moraine)
• Park/residential area
• GUDI wellfield
• 2.5 million gal/day (125 L/s) production
• Fe, Mn treatment

• Studied since the
1970s by University
of Waterloo
• Operated since~1900
• Water quality
database to 1970s
• Water level database
to 1950s


Beyond Compliance testingBeyond Compliance testing
• Testing each source (raw wells,
monitoring wells)
• More frequent testing (eg seasonal
trends, early warning monitoring)
• Non-regulated chemicals
– TCA, MTBE, NDMA, 1,4-dioxane, ….

In The NewsIn The News
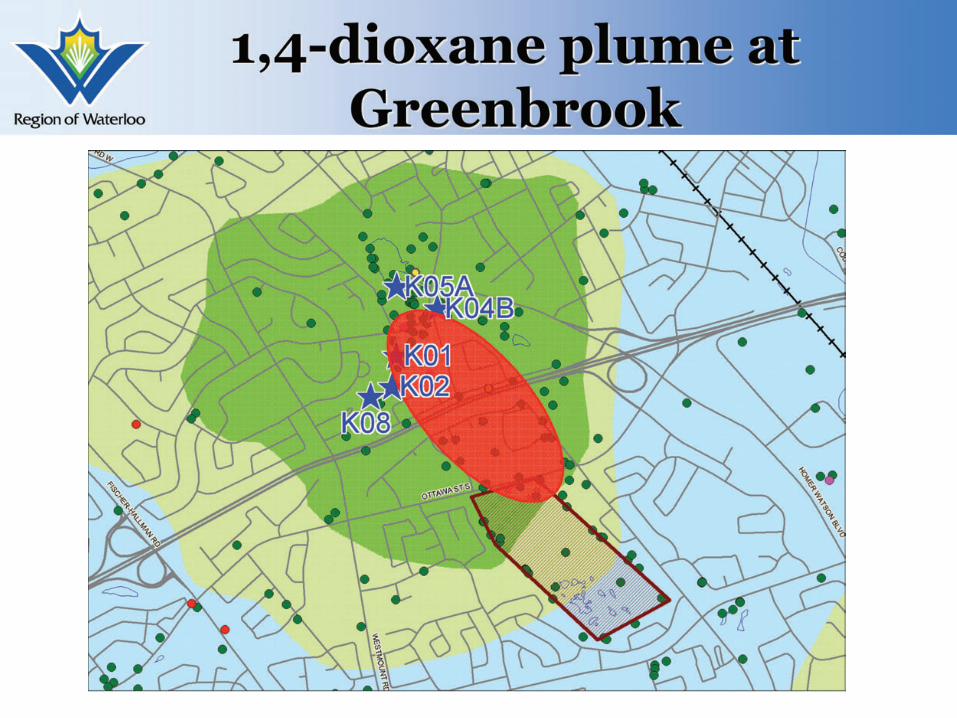
1,4-dioxane plume at1,4-dioxane plume at
GreenbrookGreenbrook

UV - Hydrogen Peroxide

Aside: The challenges of well fields in developed areas

SustainableManagement
Well/Aquifer
optimization
GUDI research
Well
decommissioning

Greenbrook Water Level Monitoring
300
305
310
315
320
325
330
1980
1985
1990
1995
2000
2005
2010
m A
SL
M4-94B OW1-76


Understanding HydrogeologicalUnderstanding Hydrogeological
Systems Systems - Middleton St. Wellfield- Middleton St. Wellfield
• 5 bedrock wells
(Guelph/Gasport fms)
• Residential/Industrial area,
Cambridge
• GUDI wellfield
• 5 mil gal/day (250 L/s), 40%
of Cambridge water supply
• Under construction for TCE
treatment
• Must ensure un-interrupted
wellfield operation

250
255
260
1-Sep-09
2-Sep-09
3-Sep-09
4-Sep-09
5-Sep-09
6-Sep-09
7-Sep-09
8-Sep-09
Ele
va
tio
n m
as
l
MW1A-08
MW1B-08
MW1C-08
• Importance of appropriate water level monitoring
to understand hydrogeology
• Cost effective
250
255
260
1-Sep-09
2-Sep-09
3-Sep-09
4-Sep-09
5-Sep-09
6-Sep-09
7-Sep-09
8-Sep-09
Ele
va
tio
n m
as
l
MW1A-08
MW1B-08
MW1C-08


• Regulatory requirement
to complete long-term
GUDI monitoring
• Operational constraints-
ensure continuous supply
AND manage TCE levels
in finished water
• Continuous turbidity
meters
• SCADA
• Electronic water level
measurements
GUDI monitoring at anGUDI monitoring at an
operating wellfieldoperating wellfield

• Continuous waterlevels, onlineturbidity, now akey component ofmanagementduring Middletonstationconstruction
• Reliable, cost-effective,minimuminterference withconstructionschedule

OntarioOntario’’s Clean Water Acts Clean Water Act
Four Steps:
• Stage 1: Establish LocalFramework
– SP Committee, TOR
• Stage 2: Watershed/SourceWater Assessment *
– Technical Rules and provincialguidance
• Stage 3: Protection PlanDevelopment
• Stage 4: Protection PlanImplementation
* Now completing

Grand River SourceGrand River Source
Protection AreaProtection Area


CWA CWA ““Threats & IssuesThreats & Issues””
• Threat: potential source of groundwater
contamination
• Condition: area that is already
contaminated
• Issue: documented contamination within
a water intake– According to Technical Rules- must use data to
identify contamination and/or trends

IssuesIssues Assessment Assessment
ResultsResults
• Issues at 13 wellfields
• Urban & rural
• “Issue Contributing
Areas” defined
• Related Threats
become significant
within ICAs
• Nitrate
• Salt (chloride,
sodium)
• Trichloroethylene
• ROW already
monitoring and
addressing these
issues

Example: TCEExample: TCE
TCE TRENDS
MIDDLETON STREET WELLFIELD
0
1
2
3
4
5
6
7
8
9
10
11
12
01-Ja
n-02
01-Ja
n-04
01-Ja
n-06
01-Ja
n-08
01-Ja
n-10
DATE
TC
E C
ON
CE
NT
RA
TIO
N (
ug
/L)
G01 G01A G02 G14 G03
Reservoir
Concentration =
~2.5 ppb

Example: SaltExample: Salt
0
100
200
300
400
1970
1975
1980
1984
1990
1995
2000
2005
2010
CH
LO
RID
E
mg
/L
G01 G01A G02 G03 G14
Chloride Trends- Middleton St. Wellfield

Salt Sources – Parking Lots

72 74 76 78 80 82 84 86 88 90 92 94 96 98 00 02 04 06 08Year
0
50
100
150
200
250
300
350
400m
g/L
LegendSodium Concentration
Chloride Concentration
Regional Supply Well G5
ODWS for Chloride
ODWS for Sodium‘94 ‘98

Example: NitrateExample: Nitrate
NITRATE -WILMOT CENTRE
0
2
4
6
8
10
19801984
19901995
20002005
2010
NIT
RA
TE
m
g/L
K50 K51

Next: Possible SPP ActivitiesNext: Possible SPP Activities
Financial Incentives for
improved farm
management
Land purchase of most
vulnerable areas
Business
inspections
Risk management
plans
Financial incentives
to reduce spill risk
Municipal road-salt
management plans
Smart about Salt
accreditation
Salt management
for new
development
Update Official
Plan
• Studies and
restrictions

Challenges/Lessons LearnedChallenges/Lessons Learned
• Large program- 38
wellfields
– Have monitoring objectives
and prioritize
– Look for technology,
efficiency, simplicity
– Allocate manpower,
resources
– I take suggestions!

Challenges/Lessons LearnedChallenges/Lessons Learned
Effective Monitoring– Set monitoring program
objectives
– Plan ahead - what datawill you need in 1 year?10 years?
– Tailor monitoring toyour objectives andreport accordingly
– Contingency plans torespond to monitoringdata

Challenges/Lessons LearnedChallenges/Lessons Learned
• Data
– Set procedures for data review
and management (SOPs)
– ROW datasets too large for usual
computer tools
– Team with data experts,
automate as much as possible
– Integrate with the lab
– Make QA/QC a priority
– New technology, GIS databases
– Avoid proprietary programs for
data storage
20,482
2,6913,572
21ppm
39
86%
3467
2
IPZ
6m bgs
OW1-90
Non-agricultural source
material
365.23 m asl
37
919
20
69
139
14%
6
818 Road salt
Condition
Solvent
TCE
Moderate
3
91
ODWS
2,691
13
39
86%
DNAPL
20
6.8
9
Condition
TCE
91
39685
Significant
919
13
14%
6
3
91
WHPA-A
13
9
Travel blank 91
turbidity


Challenges/Lessons LearnedChallenges/Lessons Learned
• Large and aging monitoring
network
– Regulatory burden: work
with MOE inspectors to
prioritize, anticipate
– Plan and carry out an
inspection/maintenance
program
– Technology- finding and
replacing/plugging aging
wells
– Limit new permanent
installations (technology?)

Challenges/Lessons LearnedChallenges/Lessons Learned
• Working in an increasingly
regulated environment
– Communicate with MOE, foster
professional relationships
– Get legal advice
– Comply, but don’t be afraid to
challenge, MOE will listen
– Be careful about communicating
monitoring results, to avoid
time-wasting “compliance”
misunderstanding, eg.
Preliminary results vs final
– Look ahead, stay educated for
new rules (eg Clean Water Act)

Questions?Questions?