municipality of anchorage drainage design … of anchorage drainage design guidelines march 2007...
TRANSCRIPT

Municipality of Anchorage DRAINAGE DESIGN GUIDELINES Document Number WMP CPg09001 March 2007 ver 4.09 Project Management & Engineering Department

Municipality of Anchorage Drainage Design Guidelines March 2007
DRAINAGE DESIGN CRITERIA REVISION LOG
Rev. No.
Date Executed Description
Sections Revised or Added
New/*Revised* Template
1. 1/26/2007 Removed “DRAFT”; Inserted Section 7 – Sizing &Designing Storm Water Controls Section 7 2. 3/2008 Break out discrete sections; added and rearranged appendices All 3 4/2009 Add WMS Document number and update version number Title page 4 4/2009 Revise zoning for single lot residential Page 2-1 5 4/2009 Revise Figure 2-1 for project categorization, but not design requirements Page 2-2 6 4/2009 Add Table 3-1, showing what design criteria are required for each project type Page 3-1 7 4/2009 Revise water quality protection criteria to cover single-lot residential if more than 2
dwelling units Page 3-1
8 4/2009 Clarify preliminary and final drainage report requirements Page 4-2 9 4/2009 Clarify preliminary and final drainage report requirements Page 4-4 10 4/2009 Clarify reporting requirements Page 4-5 11 4/2009 Orographic factor to nearest one-hundredth; major drainageway volume 1.77 inch Page 6-3 12 4/2009 CN for B soils, lawn, flat slopes Table 7-1 13 4/2009 Corrected Tt equations Page 7-13 14 4/2009 Design infiltration rate versus field infiltration rate Page 9-7 15 4/2009 Clarification and renumbering of outline, including requirement to submit computer
model input and output electronically Appendix A
16 4/2009 Drainage Project Notification Form Appendix C 17 4/2009 Drainage Certification - rearranged sections to clarify what is being certified Appendix C 18 4/2009 Drainage Statement of Compliance – removed penalty of law clauses and references
to those who manage the system Appendix C

Municipality of Anchorage Drainage Design Guidelines March 2007
Page i
TABLE OF CONTENTS
Abbreviations and acronyms............................................................................................................v
Glossary ........................................................................................................................................ vii
1 GENERAL PROVISIONS..................................................................................................... 1-1 1.1 Jurisdiction....................................................................................................................... 1-1 1.2 Enforcement Responsibility............................................................................................. 1-1 1.3 Document Revision.......................................................................................................... 1-1 1.4 Using This Document ...................................................................................................... 1-2 1.5 Review and Approval ...................................................................................................... 1-2 1.6 Interpretation.................................................................................................................... 1-2 1.7 Guidelines Limitations..................................................................................................... 1-3 1.8 Relationship to Other Standards, Permits, and Plans....................................................... 1-3 1.9 Design Variances ............................................................................................................. 1-3
2 PROJECT CATEGORIZATION AND DESIGN REQUIREMENTS ............................. 2-1 2.1 Project Category............................................................................................................... 2-1 2.2 Threshold Runoff Rates or Minimum Infiltration Provision ........................................... 2-3 2.3 Receiving Waters ............................................................................................................. 2-3
3 DESIGN CRITERIA AND EXEMPTIONS......................................................................... 3-1 3.1 Conveyance Design ......................................................................................................... 3-1 3.2 Wetland Retention ........................................................................................................... 3-1 3.3 Water Quality Protection ................................................................................................. 3-1 3.4 Extended Detention.......................................................................................................... 3-2 3.5 Flood Hazard Protection .................................................................................................. 3-2 3.6 Project Flood Bypass ....................................................................................................... 3-2 3.7 Downstream Impact Analysis .......................................................................................... 3-3
4 REPORTS AND REVIEW SUBMITTALS ......................................................................... 4-1 4.1 Required Methods and Parameters .................................................................................. 4-1 4.2 Required Submittals......................................................................................................... 4-1
4.2.1 Drainage Project Notification .............................................................................. 4-2 4.2.2 Preliminary Drainage Report ............................................................................... 4-4 4.2.3 Drainage Report ................................................................................................... 4-4
4.3 Project Reporting Requirements ...................................................................................... 4-5 4.3.1 Crossing Project ................................................................................................... 4-5 4.3.2 Single-Lot Residential Project ............................................................................. 4-5 4.3.3 Small Project........................................................................................................ 4-5 4.3.4 Large Project........................................................................................................ 4-6
5 BASIN CHARACTERIZATION .......................................................................................... 5-1 5.1 Required Basin Feature Reporting................................................................................... 5-1 5.2 Information Sources......................................................................................................... 5-1 5.3 Conveyance and Streams ................................................................................................. 5-2

Municipality of Anchorage Drainage Design Guidelines March 2009
Page ii
5.4 Contributing Areas (Drainage Basins)............................................................................. 5-3 5.5 Landcover ........................................................................................................................ 5-4
5.5.1 Pre-Development Landcover ............................................................................... 5-4 5.5.2 Post-Development Landcover.............................................................................. 5-4 5.5.3 Use of Empirical Landcover Coefficients............................................................ 5-4 5.5.4 Required Landcover Characterization ................................................................. 5-4 5.5.5 Landcover Archetypes ......................................................................................... 5-6 5.5.6 Community Management Landcover Adjustments ............................................. 5-8
5.6 Soil ................................................................................................................................... 5-9 5.7 Slope ................................................................................................................................ 5-9 5.8 Surface Roughness......................................................................................................... 5-10 5.9 Basin Mapping Procedures ............................................................................................ 5-10
5.9.1 Base Mapping .................................................................................................... 5-10 5.9.2 Downstream Mapping........................................................................................ 5-11
6 DESIGN STORMS ................................................................................................................. 6-1 6.1 Updated IDF Curves ........................................................................................................ 6-1 6.2 Storm Volume – Base and Adjusted................................................................................ 6-1 6.3 Storm Duration................................................................................................................. 6-4 6.4 Storm Distribution ........................................................................................................... 6-4 6.5 Storm Frequency.............................................................................................................. 6-5
7 RUNOFF RESPONSE............................................................................................................ 7-1 7.1 Precipitation Losses ......................................................................................................... 7-2
7.1.1 Infiltration and Depression Storage ..................................................................... 7-2 7.1.2 NRCS/SCS Methods............................................................................................ 7-3 7.1.3 Rational Method Runoff Coefficients.................................................................. 7-7 7.1.4 Adjusting for Drainage Connectivity................................................................... 7-9
7.2 Times of Concentration.................................................................................................. 7-10 7.2.1 Overland and Sheet Flow................................................................................... 7-11 7.2.2 Shallow Concentrated Flow............................................................................... 7-12 7.2.3 Channel Flow..................................................................................................... 7-13
7.3 Lag and Computation Times.......................................................................................... 7-15 7.3.1 Lag Time............................................................................................................ 7-15 7.3.2 Computation Time Interval and Hyetograph Time Step.................................... 7-15
7.4 Estimating Runoff Flows ............................................................................................... 7-16 7.4.1 Rational Method for Peak Flow......................................................................... 7-17 7.4.2 Unit Hydrograph Method................................................................................... 7-17 7.4.3 Kinematic Wave Method (Using Conceptual Methods).................................... 7-18 7.4.4 Time-Area Method (Using Flow Travel Times)................................................ 7-19
7.5 Runoff Models and Programs ........................................................................................ 7-20
8 ROUTING STORM WATER RUNOFF.............................................................................. 8-1 8.1 Routing Analysis Applications and Tools ....................................................................... 8-1 8.2 10% Method Routing Analyses ....................................................................................... 8-2
8.2.1 Considerations for Storage................................................................................... 8-3 8.2.2 Step-Wise Analysis.............................................................................................. 8-3

Municipality of Anchorage Drainage Design Guidelines March 2009
Page iii
8.3 10% Routing Reporting Requirements ............................................................................ 8-7
9 SIZING AND DESIGNING STORMWATER CONTROLS............................................. 9-1 9.1 Detention Facilities .......................................................................................................... 9-2
9.1.1 Storm Detention Design....................................................................................... 9-2 9.1.2 Extended Detention Design ................................................................................. 9-2
9.2 Infiltration Controls ......................................................................................................... 9-3 9.2.1 Testing Infiltration Capacity ................................................................................ 9-4 9.2.2 Infiltration Control Design................................................................................... 9-6
10 CHANNEL EROSION AND ICING CONTROLS......................................................... 10-1 10.1 Channel Erosion Control Design ................................................................................. 10-1 10.2 Icing Control Design.................................................................................................... 10-1
11 SELECTED REFERENCES ............................................................................................. 11-1
APPENDICES
Appendix A.................................................................................Drainage Report Contents Outline Appendix B ......................................................................................Threshold Runoff Calculations Appendix C ................................................................................................................General Forms Appendix D............................................................................Type 1 24-Hour Rainfall Distribution Appendix E .................................................................................................... Example Calculations Appendix F .......................................................................................................Information Sources Appendix G.............................................................................. 10% Method Downstream Analysis

Municipality of Anchorage Drainage Design Guidelines March 2009
Page iv
TABLES AND FIGURES
List of Tables
Table 2-1: Threshold Runoff Rates............................................................................................. 2-3 Table 3-1: Design Requirements by Project Type...................................................................... 3-1 Table 5-1: Community Management Landcover Adjustments................................................... 5-9 Table 6-1: Base Intensities and Depths for Different Frequency Rainfall Events...................... 6-1 Table 6-2: MOA Base Storm Volumes....................................................................................... 6-3 Table 6-3: MOA Water Quality Treatment/Wetland Retention Design Storm .......................... 6-4 Table 7-1: Infiltration and Depression Storage Parameters for Conceptual Loss Methods ....... 7-3 Table 7-2: SCS Criteria for Hydrologic Soil Groups.................................................................. 7-4 Table 7-3: Saturated Hydraulic Conductivity for SCS Soils ...................................................... 7-4 Table 7-4: SCS Curve Numbers ................................................................................................. 7-5 Table 7-5: Rational Equation Runoff Coefficients ..................................................................... 7-8 Table 7-6: Adjustment Factors for Indirectly Connected Impervious Surfaces .......................... 7-9 Table 7-7: Roughness Coefficient for Overland and Sheet Flow............................................. 7-12 Table 7-8: “k” Value for Shallow Concentrated Flow.............................................................. 7-13 Table 7-9: Manning’s “N” Values for Channel Flow............................................................... 7-14 Table 7-10: Hydrologic Modeling Programs............................................................................ 7-20 Table 8-1: Public Domain Hydrologic Routing Programs ......................................................... 8-1 Table 9-1: Testing Schedule For Infiltration Controls................................................................ 9-4 Table 9-2: Soils Testing For Infiltration Controls ....................................................................... 9-6
List of Figures
Figure 2-1: Design Requirement Flowchart ............................................................................... 2-2 Figure 6-1: Intensity-Duration-Frequency Relationships for Anchorage Alaska....................... 6-2

Municipality of Anchorage Drainage Design Guidelines March 2009
Page v
Abbreviations and Acronyms % percent < less than = equals > greater than ≤ less than or equal to ≥ greater than or equal to ADT Average Daily Traffic AMC Anchorage Municipal Code ARDSA Anchorage Roads and Drainage Service Area ASTM American Society for Testing and Materials C Rational Method runoff coefficient cfs cubic feet per second CN SCS-method curve number CPQ Coastal Project Questionnaire DCM Design Criteria Manual DEC Alaska Department of Environmental Conservation DOT Alaska Department of Transportation and Public Facilities EPA United State Environmental Protection Agency Fc infiltration rate FHWA Federal Highway Administration GIS geographical information systems Guidelines Municipality of Anchorage Drainage Design Guidelines HEC Hydrologic Engineering Center HMS Hydrologic Modeling System HSG Hydrologic Soil Groups IDF intensity-duration-frequency ILLUDAS Illinois Urban Drainage Analysis Simulator LID low impact development Lt lag time MOA Municipality of Anchorage MS4 Municipal Separate Storm Sewer System “n” Manning’s Coefficient (distinct and different values for overland versus channel
flow) NCDC National Climatic Data Center NPDES National Pollutant Discharge Elimination System NRCS Natural Resources Conservation Service (formerly SCS) PM&E Project Management and Engineering Department RAP recycled asphalt pavement ROW right-of-way ROWs rights-of-way SCS Soil Conservation Service (now NRCS) SWMM Storm Water Management Model Tc time of concentration TP-47 National Weather Service Technical Paper 47 TSAIA Ted Stevens Anchorage International Airport

Municipality of Anchorage Drainage Design Guidelines March 2009
Page vi
UAF University of Alaska - Fairbanks USACE United States Army Corps of Engineers WMS Watershed Management Services

Municipality of Anchorage Drainage Design Guidelines March 2009
Page vii
Glossary
10% Area - The total area associated with a single project drainage area, exclusive of any upstream contributing area, that contributes surface water flows to the 10% point. (See Appendix G.)
10% Conveyance Route - An actual flow route taken by some or all post-development project surface runoff waters from a project discharge point to a 10% point. A 10% conveyance route is aligned along the first part or all of a downstream conveyance route.
10% Point - The point downstream along a 10% conveyance route at which the project drainage area represents just 10% of the total drainage area, exclusive of any upstream contributing areas. (See Appendix G.)
Adjusted Storm - Any design storm whose volume is based on multiplication of a base storm by an orographic factor, provided in Chapter 2 of the DCM, selected in context with local conditions.
Average Daily Traffic - The number of vehicles that pass a particular point on a roadway during a period of 24 consecutive hours, averaged over a period of 365 days.
Base Storm - Any Municipally-approved design storm (and associated precipitation volume) directly based on analysis of data collected by the National Weather Service station located at the Ted Stevens Anchorage International Airport.
Contributing Area - All land area that contributes flows to a design point.
Critical Point - Any location along a 10% conveyance route at which post-development flows may be conducive to failure or overtopping of the conveyance system. Critical points include, at minimum:
• The project discharge point; • The 10% point; • Confluences of any runoff basins tributary to the 10% conveyance route; • Crossings, conduit, or channel sections along the 10% conveyance route at which
overflow may occur; and • Points where flow constriction, backwater, changes in flow momentum, or channel or
bank erosion are likely to occur.
D50 - Diameter in the particle size distribution curve corresponding to 50% finer.
Design Point - Any point along a watercourse (streams or drainageways) that requires analysis for estimating surface water flow characteristics. Any point at which typical or local design conditions are to be determined for drainage conveyances or controls.
Detention – temporary storage of runoff for later, metered release

Municipality of Anchorage Drainage Design Guidelines March 2009
Page viii
Downstream Area - The entire fraction of the 10% area that lies downstream of a project discharge point and that contributes surface water flows to the 10% point. The downstream area may include one or more separate drainage basins (downstream contributing areas) that input surface water flows at specific points along the 10% conveyance route.
Downstream Contributing Area - Any drainage basin, developed or undeveloped, that contributes, or will contribute, flows to a project’s 10% conveyance route; also, a lateral inflow area.
Downstream Conveyance Route - The actual flow route taken by some or all post-development surface runoff flows from a project discharge point to the first receiving water or to tidewater.
Drainageway - A watercourse that does, or under developed conditions, is likely to, convey storm water flows. Drainageways are characteristically ephemeral, conveying flows only in direct response to storm water runoff and for limited durations. Drainageways may be identified along undeveloped land, even if surface flows do not currently occur, if it can be reasonably shown that constructed or natural drainageways likely will be required to convey storm flows, or will naturally develop as a result of increased runoff due to anticipated future land development. Drainageways do not carry perennial flows except when these flows result from contributions from constructed subsurface or other human-induced drainage (e.g., foundation drains, or ditches or storm drains that intercept groundwater). Drainageways may exist naturally along topographic flow lines or they may be constructed.
Extended detention - Provision of a minimum 6-hour time difference between the center of mass of the inflow hydrograph (entering the detention control) and the center of mass of the outflow hydrograph (leaving the detention control).
Higher Density - For the purposes of hydrologic analysis and planning, a lower density parcel will generally include any parcel zoned Residential District R4; all Commercial, Mixed Use, and Industrial Districts; and high density residential, commercial, and other Girdwood Districts and for residential use proposed for >35% impervious at full development.
Hydraulic radius (R) - the ratio of the cross sectional area to the wetted perimeter of a conveyance or conduit.
Impervious – A surface that permits insignificant or no infiltration of runoff water over the duration of a single storm water runoff event; any surface with little or no capacity to transmit water.
Landcover Archetype - A mapped, existing development for which the relative distribution of landcover types, areas, and percentages (other than Roads Impervious) have been formally approved by the Municipality of Anchorage, and for which orthophotographic imagery and tabulated landcover characteristics have been recorded.
Landcover - A direct characterization of the nature of a land surface, or of materials placed over the land surface, that influence the perviousness of that surface to precipitation and surface runoff.

Municipality of Anchorage Drainage Design Guidelines March 2009
Page ix
Landcover Adjustment – Adjustments to runoff parameters for pre-development conditions that provide somewhat higher runoff than actual conditions would indicate.
Lateral Inflow Area - Any drainage basin, developed or undeveloped, that contributes or will contribute flows to a project’s 10% conveyance route; also a downstream contributing area.
Lower Density - For the purposes of hydrologic analysis and planning, a lower density parcel will generally include any parcel zoned for residential use and proposed for a low ratio of pervious to impervious surfaces (<35% impervious) at full development. Municipal zoning for residential districts R1, R2, R3, R5, R6, R7, R9, R10; low density residential Girdwood Districts; and Other Districts PLI, PR, OL, and AF may generally qualify as low-density residential.
Major Drainageway - A drainageway with a contributing area of more than 40 acres.
Mean Higher High Water Line - The mean higher high water line is generally defined as the elevation of the mean of all higher high tidal water lines occurring over a set period of time. Definitions of tidal elevations included in Municipal digital mapping are adopted generally from NOAA.
Minor Drainageway - A drainageway with a contributing area less than or equal to 40 acres.
Natural - Built or shaped for the most part by geologic, meteorologic, hydrologic, or non-human biologic processes; not the predominant result of human intervention or activity.
Ordinary High Water Line - The mark on the shores of all waters that will be found by examining the bed and banks, and ascertaining where the presence and action of waters are so common and usual, and so long continued in ordinary years as to mark upon the soil or vegetation a character distinct from the abutting upland. In any area where the ordinary high water line cannot be found along a stream, it is the elevation of the mean annual flood.
Orographic Factor - A multiplier applied to adjust base precipitation data obtained from a single permanent weather station to fit local conditions; within the Municipality of Anchorage, increasing local precipitation is strongly related to proximity to the Chugach Mountains and thus generally termed “orographic.”
Perennial Stream Flow - A stream flow that occurs throughout the year, except for extended periods of drought or cold.
Pervious - A surface that permits significant infiltration of runoff water over the duration of a single storm water runoff event; any surface with significant capacity to transmit water in context with typical Anchorage storm volumes and durations.
Project Discharge Point - Any point at which surface flows carried by project conveyances, or generated within a project drainage area, exit the project.
Project Drainage Area - All or some part of a project that drains to a project discharge point.
Municipality of Anchorage Drainage Design Guidelines March 2009
Page x
Project - The area encompassed by all platted land parcels that ultimately will be developed, modified, or included under a specific plan of action that may be comprised of multiple phases.
Receiving Water - Surface water that is a water of the United States, including lakes, rivers, streams (including intermittent streams), mudflats, sandflats, wetlands, sloughs, prairie potholes, wet meadows, playa lakes, or natural ponds.
Regulated Stream - Any watercourse meeting the criteria of a stream, as specified by the Municipality of Anchorage, and along which flood hazard areas have been mapped and approved by the Federal Emergency Management Agency, or any stream designated as a regulated stream by the Project Management and Engineering Department.
Retention – prevention of runoff. Storm water is retained and remains indefinitely, with the exception of the volume lost to evaporation, plant uptake or infiltration.
Storm Water - Flows originating from surface runoff of rainfall or snow melt.
Storm Water Routing - Analyses performed to estimate the changes in timing and storm water wave magnitude as a storm water wave moves down a channel.
Stream - A watercourse perennially or intermittently conveying waters not solely the result of constructed subsurface drainage. When a stream does flow, it conveys more water than that contributed from a single storm event. In Municipal mapping, each stream exists as a non-branched watercourse with only one headwater source and one outlet or mouth, but any stream may have one or more tributary streams associated with it that contribute to its flow. A natural stream displays a bed and banks except that these features may not be present locally where flow is intermittent (either spatially or temporally), or where the stream has been piped or otherwise substantially modified. Thus, a stream retains its identity as a single continuous feature over its whole length even though its flow may periodically break up and disappear along its alignment. A stream’s continuity from reach to reach is established through a reasonable demonstration of its actual or historic continuity of flow (perennially or intermittently) and its continuity along contiguous topographic flow lines.

Municipality of Anchorage Drainage Design Guidelines March 2009
Page xi
Stream order – A stream network classification system based on Strahler (1957) that designates 1st order streams as ‘fingertip’ headwater features at the source of a stream network; a 2nd order stream as the feature resulting from the confluence of two 1st order streams; a 3rd order stream as the feature resulting from the confluence of two 2nd order streams, etc. Stream order designations for Municipality of Anchorage stream mapping are developed and assigned by the Project Management and Engineering Department’s Watershed Management Services (WMS) and proposed ordering of streams not yet mapped must be approved by WMS.
Tidewater - The coastal boundary in Municipal digital mapping; approximately the mean higher high water line. Thus this boundary generally reflects the approximate landward extent of tidal influence on the geologic and biologic character of terrestrial lands. The coastal boundary delineates the landward edge of Municipal coastlands (where no coastlands are present, this boundary coincides with the Municipal shoreline).
Topographic Flow Line - A line of continuous fall in elevation across a land surface.
Tributary - A stream whose outlet is located along the course of another stream; a stream that flows into another stream.
Upstream Contributing Area – Any upstream drainage area, developed or undeveloped, that contributes or will contribute surface water flows to any project drainage area conveyance; also an upstream inflow area.
Upstream Inflow Area - Any upstream drainage area, developed or undeveloped, that contributes or will contribute surface water flows to any project drainage area conveyance; also an upstream contributing area.

Municipality of Anchorage Drainage Design Guidelines March 2009
Page xii
Watercourse - A natural channel produced wholly or in part by the flow of surface water, or any artificial channel constructed for the conveyance of surface water. Also, any topographic flow line that either does, or under developed conditions is likely to, accumulate and convey substantial storm water flows. Also, any conveyance, whether an open channel or closed conduit, constructed wholly or in part for the transport of storm water runoff. Watercourses include all surface water conveyance features and can be further classified under the Municipal classification system as either streams or drainageways.
Wetted perimeter (P) - is the length of the wetted surface of a conveyance or conduit.
Wetland - A landform feature so designated under the Anchorage Wetlands Management Plan. An area that is inundated or saturated by surface or groundwater at a frequency and duration sufficient to support, and that under normal circumstances does support, a prevalence of vegetation typically adapted for life in saturated soil conditions. Wetlands generally include swamps, marshes, bogs, and similar areas.
Municipality of Anchorage Drainage Design Guidelines March 2009
Page 1-1
1 GENERAL PROVISIONS
The Municipality of Anchorage (MOA) Drainage Design Guidelines is a companion to the MOA Project Management and Engineering (PM&E) Design Criteria Manual (DCM). This document has been incorporated into the DCM by reference and is enforceable policy of the MOA. This manual, together with all future changes and amendments, shall be known as the MOA Drainage Design Guidelines (hereafter called Guidelines).
This document is generally structured to support a stepwise approach to performing hydrologic analyses required by the DCM, and specifically includes discussions of:
Section 2 Identification of project type
Section 3 Basic hydrologic design criteria and elements
Section 4 Report and submittal requirements
Section 5 Required basin characterization including mapping of spatial and feature information
Section 6 Development of applicable design storms
Section 7 Methods and parameters for estimating runoff flows
Section 8 Methods and parameters for routing runoff flows and downstream impact analysis
Section 9 Methods and parameters for sizing and designing detention and infiltration facilities
Section 10 Methods for designing channel erosion and glaciation controls
The document also includes a list of references, a glossary of technical terms, and a number of appendices containing forms, checklists, and additional explanatory material.
1.1 Jurisdiction
These Guidelines shall apply to all land within the incorporated areas of the MOA, including any public lands. These Guidelines shall apply to all facilities constructed on MOA rights-of-way (ROWs), easements dedicated for public use, and to all privately owned and maintained drainage facilities, including, but not limited to, detention facilities, storm sewers, inlets, manholes, culverts, swales, and channels.
1.2 Enforcement Responsibility
It shall be the duty of the Municipal Engineer to enforce the provisions of these Guidelines, in coordination with the Municipal Attorney, as appropriate.
1.3 Document Revision
The Guidelines were first published in January 2007 as a companion to the 2007 release of the DCM. This current revision supersedes the 2007 edition. Revisions to the Guidelines are anticipated and revised Guidelines will update and supercede all previous editions.

Municipality of Anchorage Drainage Design Guidelines March 2009
Page 1-2
1.4 Using This Document
The Guidelines are intended to support compliance with the DCM for hydrologic analyses; to guide basic data compilation and analyses by designers; to improve consistency in the performance of analyses, and the presentation of analysis results; to point to useful tools; and to ease and speed review of required project submittals by PM&E. While these Guidelines provide technical guidance, they are not intended to be a comprehensive hydrology textbook and are not intended to replace professional knowledge and experience, nor to obstruct safe and practical design. In all cases, where a designer’s professional judgment indicates the use of an alternative practice, method, or parameter is necessary or preferable, these alternatives shall be submitted for review by the MOA as discussed in Section 1.9.
1.5 Review and Approval
The MOA will review all drainage submittals for general compliance with these Guidelines. An approval by the MOA does not relieve the owner, engineer, or designer from responsibility for ensuring that the calculations, plans, specifications, construction, and record drawings are in compliance with the Guidelines and will accomplish the necessary or desired drainage objectives.
The MOA may require submittals be made to other agencies that have an interest or responsibility for drainage and / or water quality issues. Other review agencies may include federal and state agencies responsible for floodplains, water quality, wetlands, water rights, and other storm water related issues, as well as other affected jurisdictions.
In addition to the criteria presented in these Guidelines, at the sole discretion of the Municipal Engineer, the MOA may impose greater standards and criteria when deemed appropriate to protect the safety and welfare of the public.
1.6 Interpretation
In the interpretation and application of the provisions of the Guidelines, the following shall govern:
• The Guidelines shall be regarded as the minimum requirements for the protection of the public health, safety, and welfare of the residents of Anchorage.
• If other laws, ordinances, or regulations cover the same subject as these Guidelines, the stricter standard shall apply.
• These Guidelines shall not abrogate or annul any permits or approved drainage reports, construction plans, easements, or covenants issued before the effective date of these Guidelines.
The Municipal Engineer shall have final authority to resolve any conflicting interpretation of these Guidelines.

Municipality of Anchorage Drainage Design Guidelines March 2009
Page 1-3
1.7 Guidelines Limitations
These Guidelines summarize the MOA’s standards for drainage analyses. Approaches to drainage analyses are dependent upon availability of local analyses and data that allow calibration of storm events to runoff response of different types of drainage basins. The MOA has only limited precipitation and storm water runoff data. As a result, a calibrated and comprehensive drainage model or set of models is not yet available for most of the MOA and will take a number of years to develop. In lieu of locally calibrated models, the current Guidelines focus on application of local design criteria using widely accepted analytical and modeling approaches, and parameters standardized to local conditions. This strategy is intended to enforce application of consistent, standard methods and parameters in order to ensure compliance with drainage criteria designed to obtain community protection at specified risk levels.
The Guidelines do not provide the detailed information needed to comply with all regulations. The standardized methods and parameters are specifically to address Chapter 2 of the DCM.
1.8 Relationship to Other Standards, Permits, and Plans
If the state or federal government imposes stricter criteria, standards, or requirements, those shall apply in addition to these Guidelines. Permits from other regulatory agencies may be required for some of the work covered by these Guidelines. The property owner has the responsibility to apply for all other required permits.
1.9 Design Variances
The submittal and review process for variance requests is described in Chapter 2 of the DCM.
In general, documentation submitted with a variance request must be complete and provide a detailed description of the proposed alternative methods and parameters, including any mathematical formulation proposed for use, compelling technical arguments for special use of the alternate method or parameter, and complete documentation, data, and other evidence supporting use of the alternative method or parameter. Technical review of requests for variances will be based on the following:
• Completeness: A request for variance must include a complete description of the method or parameter, sufficient for testing, publication, and use in these Guidelines or for assessment at a specific location. A complete description shall include any algorithms used in the method, published source of the method or parameter, and citation or included technical description and discussion of the experimental, or technical and mathematical development and basis of the method or parameter.
• Rationale: The request must include compelling technical arguments for using the proposed method or parameter as an alternate to methods and parameters already contained in these Guidelines. A request based on local conditions must clearly demonstrate that the specific conditions have been reasonably represented by the tests and assumptions used in the applicant’s analysis. Request for use of different but equal methods or parameters alone is not necessarily a sufficient rationale for use of an

Municipality of Anchorage Drainage Design Guidelines March 2009
Page 1-4
alternative method or parameter, though such a request will be considered if supporting documentation clearly confirms similarity between methods and parameters.
Faulty, incorrect, or inaccurate MOA methods or parameters are always valid reasons for a request for a variance and for modification of these Guidelines. However, these Guidelines are based on broadly applied and widely published national standard methods and parameters adjusted where necessary to match local conditions and requirements. Where faulty MOA Guidelines methods or parameters are proposed as the basis for a variance, the applicant must demonstrate through citation of a range of current research, published through mainstream or public agencies, that the Guidelines methods and parameters are widely held to be incorrect or non-representative. It is the MOA’s intent to support reasonably conservative results while maintaining practicable application in performing drainage analyses, and this will be a basic test when selecting, adjusting, or revising drainage analysis methods and parameters.
• Representativeness: Experimentation, data, analyses, or other documentation used to support a proposed variance must be representative of the process or condition in question. Sampling performed must demonstrate that it will adequately reflect important variations in response or character across both time and space, specific to the question at hand. For example, where a precise local condition is offered as a reason for variance, the applicant must demonstrate that that precise condition actually holds over the entire project area or at the critical design points at issue, and not just over some small fraction of the area or at some area outside the critical design area. Similarly, measurements of a process must be performed using appropriate and standard methodologies that will characterize the process in question at the appropriate critical time and place. For example, test methods used to assess onsite performance of subsurface infiltration may not be adequate to assess surface infiltration, and point-in-time measurements of stream flows will not necessarily be sufficient to represent stream response under some other seasonal condition.
• Documentation: Applicants for a variance must submit complete documentation supporting proposed alternative methods or parameters. Documentation supporting variances must include multiple citations of current research and manuals of practice published or sponsored by well-known public and private agencies. Supporting documentation must indicate some broad national technical support for the proposed alternative method or parameter. Supporting documentation must include at least one or more detailed technical discussions of the development of, and basis for, the method and parameter. Applications based on local sampling or measurements must include complete documentation of local data collection, sampling and measurement methods, data analyses, and conclusions, including citation of published sources for sampling, measurement, and analytical methods used during testing. All documentation must be currently in the possession of the MOA or complete copies of supporting documentation must be provided as part of the application.

Municipality of Anchorage Drainage Design Guidelines March 2009
Page 2-1
2 PROJECT CATEGORIZATION AND DESIGN REQUIREMENTS
Section 2 of the Guidelines will direct the user in identification of their project category, and the design requirements and criteria specific to the project. In general, drainage design criteria and reporting requirements specified in these Guidelines are based on the relative size and the estimated runoff performance of a particular project’s proposed drainage. Smaller, simpler projects require less characterization and analytical effort than larger projects. Relative project size is defined by project category types described in Section 2.1. Runoff performance, relative to Threshold Runoff Rates established in these Guidelines (Table 2-1), is used to further define design requirements for some projects. For smaller projects, drainage designs that do not exceed the threshold runoff rates are subject to less rigorous and detailed requirements for analysis, runoff control, and reporting.
These Guidelines are laid out to allow applicants to quickly determine the drainage requirements for their project by first identifying their Project Category and then, as necessary, estimating and comparing the runoff response of the proposed project to the Threshold Runoff Rates and receiving waters to determine the project type and design elements. This decision process is summarized in the flow chart shown in Figure 2-1.
Identifying the project type to derive applicable drainage criteria and reporting requirements is a 3-step process:
1. Identify the category of the project
2. Estimate project runoff and compare to minimum infiltration depths and/or threshold runoff values
3. Identify the receiving waterbody
Basin mapping data (Section 5.9) and standard design storm data (Section 6) should be sufficient to determine the project category, perform estimates of post-development runoff, and identify receiving waters. These three steps provide the information for determining the project type.
2.1 Project Category
Projects fall into one of four categories as defined below. In identifying the appropriate category of a project, all phases of the project shall be considered. The intent is to ensure that, when a series of small projects that will ultimately be served by the same interconnected storm water system is planned for construction over a period of years, the individual storm drainage systems will be designed as an integrated whole.
• Crossing Project: All phases of a proposed project will encompass only a crossing on a stream or drainageway.
• Single-Lot Residential: All phases of a proposed project will encompass only development or redevelopment of a single lower density parcel that is zoned residential (Residential Districts R1, R2, R5, R6, R7, R9, R10; and Girdwood zoning districts gR-2, gR-2A and gR-3).

Municipality of Anchorage Drainage Design Guidelines March 2007
Page 2-2
Figure 2-1: Project Type Flowchart
Crossing Project Small Project Large Project
All phases of a planned development will encompass 5 or fewer separate parcels; a total of 5
or fewer individual residences or building sites; and the total area of the complete planned development
is 5 acres or less
All phases of a proposed project will encompass only development or redevelopment of a single lower density parcel that is zoned residential; specifically, in zoning districts R1, R2A, R2D, R5, R6, R7, R9, R10, gR-2,
gR-2A, or gR-3
All phases of proposed project will encompass only a
crossing on a stream or drainageway
All other projects
Discharge directly to stream of 4th order or greater? or
Discharge directly to tidewater or lake greater than 5 acres? or
Base 1-year 24-hour volume infiltrated? or
Runoff of <0.22 cfs/acre for the base 1-year, 24-hour storm?
Runoff of >0.22 cfs/acre for the adjusted 1-year, 24-hour?
or >0.41 cfs for the adjusted 10-year 24-hour storm?
Discharge directly to tidewater or lake greater than
5 acres? or
Base 1-year 24-hour volume infiltrated
Runoff <0.41 cfs for the adjusted 10-year 24-hour storm?
Runoff <0.41 cfs for the adjusted 10-year 24-hour storm?
Discharge directly to tidewater or lake greater than 5 acres
or Base 1-year 24-hour volume infiltrated
Complex Small or Large Project
Simple Small Project
Class 1C Residential Project
Class 1B Residential Project
Class 1D Residential Project
Crossing Project
YES NO
YES
NO
YES
NO
YES
YES
NO
YES NO
NO
Simple Large Project Class 1A Residential Project
Single Lot Residential
General Project Description Project size, zoning, land use Receiving water and hydrologic criteria Project Type

Municipality of Anchorage Drainage Design Guidelines March 2007
Page 2-3
• Small Project: All phases of a planned development will encompass five or fewer separate parcels; a total of five or fewer individual residences or building sites; and the total area of the complete planned development is five acres or less.
• Large Project: All phases of a planned development will encompass more than five separate parcels; a total of more than five individual residences or building sites; or the total area of the complete planned development is greater than five acres.
Projects for community streets and drainage fall under either the Small or Large project categories, as will development of commercial or industrial parcels.
2.2 Threshold Runoff Rates or Minimum Infiltration Provision
For Single-Lot Residential and Small Project types, design and reporting requirements can be reduced if estimated runoff performance is below the Threshold Rates shown in Table 2-1. A simplified method for conducting the threshold runoff calculation (based on Rational Method coefficients and simplified assumptions) and a form for reporting results are provided in Appendix B.
Table 2-1: Threshold Runoff Rates
Design Storm Threshold Runoff Rates 1-year, 24-hour 0.22 cfs/acre 10-year, 24-hour 0.41 cfs/acre
The project may be also exempt from some design requirements where preliminary calculations demonstrate that proposed land development or drainage controls will completely infiltrate the 1-year, 24-hour storm volume.
2.3 Receiving Waters
Determine whether the project will discharge directly to any surface water body. If it does, determine whether that waterbody is a 3rd order stream or smaller (see Glossary). Discharge of a project’s storm water runoff directly from the project to a 4th order or greater stream or tidewater can significantly reduce analytical and design requirements.

Municipality of Anchorage Drainage Design Guidelines March 2007
Page 2-4

Municipality of Anchorage Drainage Design Guidelines March 2007
Page 3-1
3 DESIGN CRITERIA AND EXEMPTIONS
Design criteria defined in the DCM are generally applicable to design of drainage infrastructure covered by these Guidelines. Once a project category and type is determined, required design criteria specific to that project can be determined by referencing Table 2-1 of the DCM. This section presents a summary of those design criteria as they apply to the project types described in Table 2-1. The design requirements are summarized by project type in Table 3-1.
Table 3-1: Design Requirements by Project Type
Project Type Conveyance
Design
Project Flood
Bypass Wetland
Detention
Water Quality
ProtectionExtended Detention
Flood Hazard
Protection
Downstream Impact Control
Crossing Y Y N N N N N Residential A Y Y N N N B Y Y N Y * N C Y Y Y * N N
D Y Y
Required if more than 2
dwelling units Y * Y * N
Small Simple Y Y Y N Y * N Complex Y Y Y Y Y Y
Large Simple Y Y Y N Y Y Complex Y Y
Required if Corps fill permit
is required
Y Y Y Y
Y – required N – not required Y * - not required if drainage certification is provided (Sections 4.3.2 and 4.3.3)
3.1 Conveyance Design
The DCM sets out the minimum design storm that must be used for sizing a conveyance. Complete design will require characterization of contributing basins (Section 5), selection and development of design storms (Section 6), and estimation of peak flows (Section 7). This is a requirement for all conveyance design.
3.2 Wetland Retention
Wetland retention is only required when jurisdictional wetlands disturbances occur that are subject to a U.S. Army Corps Section 404 permit. The requirement is intended to guide the designer in developing controls that are adequately sized to satisfy conditions in a U.S. Army Corps Section404 permit, if issued for the project. Design will require selection of appropriate design storm parameters (Section 6) and estimation of runoff (Section 7) as outlined in these Guidelines.
3.3 Water Quality Protection
Water quality protection is intended to treat stormwater to the maximum extent practicable. This is a requirement for all Small and Large projects and for single-lot residential if there will be three or more dwelling units. Design flow rates and volumes are specified in the DCM. The

Municipality of Anchorage Drainage Design Guidelines March 2007
Page 3-2
DCM also provides design criteria for a number of water quality control facilities, including detention basins, oil-grit separators, and biofiltration swales.
3.4 Extended Detention
Extended detention is intended to protect streams and channels from post-development increases in annual flood peaks. This requirement addresses adequate sizing of detention facilities to control annual flood peaks to no greater than pre-development levels for all project discharge points. Detention facilities must be sized to detain post-development project runoff in excess of the pre-development project runoff for the 1-year, 24-hour storm for a period of 6 hours.
Extended detention is required for Class 1C and Class 1D Single-Lot Residential Projects and Complex Small or Large Projects. Projects are exempted from this requirement when:
• The project involves only the crossing of a stream or drainageway; • The project storm water flows discharge directly to tidewater; • The entire base 1-year, 24-hour storm volume is infiltrated; • The project storm water flows of the development or re-development of a single
lower density parcel discharge directly to a 4th order or larger stream or to tidewater • The post-development peak discharge from development or re-development of a
Single-Lot Residential Project for the base 1-year, 24-hour storm is less than 0.22 cfs/acre; or
• The post-development peak discharge from development of a Small Project for the adjusted 1-year, 24-hour storm is less than 0.22 cfs/acre.
3.5 Flood Hazard Protection
Flood hazard protection is intended to control project post-development peak flows to a rate no greater than 1.05 times the pre-development peak for the 10-year, 24-hour storm event. Landcover adjustments are allowed in specifically zoned and managed areas which may increase pre-development flows thereby allowing for larger post-development flows (see Section 5.5.6 for details).
Only Crossing and Single-Family Residential Class 1A and Class 1C are exempted from this requirement.
3.6 Project Flood Bypass
This is a requirement for all conveyance design. Designers are required to consider the impacts of a 100-year, 24-hour storm to project drainage controls and conveyances, and the surrounding area. The designer must ensure that designed structures will withstand the 100-year, 24-hour storm, and must demonstrate an unobstructed bypass flood route exists that will not incur damage to properties or structures. Where necessary, design must include adequate sizing of 100-year, 24-hour storm runoff bypass conveyance.

Municipality of Anchorage Drainage Design Guidelines March 2007
Page 3-3
3.7 Downstream Impact Analysis
Downstream impact analysis requires designers to provide for control of post-project impacts at downstream locations. Project peak flows shall be controlled to ensure post-development peaks at less than 1.05 times pre-development peak flow rates at all downstream critical points.
Designers must adequately size detention to control the design storm runoff peaks specified in the DCM at downstream locations. Projects are exempted from this requirement when:
• The project involves only the crossing of a stream or drainageway; • The project is development or re-development of a single residential lower density
parcel; or • Small Projects for which the post-development peak discharge for the adjusted 10-
year, 24-hour storm is less than 0.41 cfs/acre.

Municipality of Anchorage Drainage Design Guidelines March 2007
Page 3-4

Municipality of Anchorage Drainage Design Guidelines March 2007
Page 4-1
4 REPORTS AND REVIEW SUBMITTALS
These Guidelines depend in part upon application of standardized methods and parameters to ensure consistent and acceptably conservative compliance with MOA drainage design criteria. To this end, the Guidelines require that all drainage designs:
• Use standard methods and method parameters as specified in these Guidelines; and • Report data, methods, and parameters applied in all project drainage analyses.
4.1 Required Methods and Parameters
Methods and parameters accepted by the MOA as standard are listed and described throughout these Guidelines. These standard methods and parameters shall be applied in all drainage analyses except when an application for variance has been approved for an alternative method or parameter. Design variances must be approved prior to submittal of the Drainage Report. See Section 1.9 for additional information on design variances.
A distinction is made by these Guidelines, and will be made during drainage report reviews, between methods, parameters, models, and programs. Methods are specific algorithms or closely related series of algorithms and methodologies used to address analytical tasks. Parameters are specific constants, coefficients, or other values required as non-data input to a method or algorithm. Software developers create programs that typically include access to combinations of computer-automated methods and tables of parameters, and provide computer-assisted tools for data input and reporting of results. Finally, analysts create models designed to predict or estimate the characteristics or response of a specific real-world area by compilation and use (whether through a software program or through manual computation) of a number of different methods, parameters, and project-specific data.
These Guidelines require that the methods and parameters used to perform drainage analyses conform to MOA standards and that those used be clearly reported in Drainage Reports. Otherwise, it is the intent of these Guidelines that the widest range of programs is permitted for use in MOA drainage analyses, to the extent they comply with MOA standard methods and parameters.
4.2 Required Submittals
Designers submitting drainage analyses for review by PM&E shall meet the basic reporting requirements specified in the DCM and these Guidelines. Some basic calculation and data forms are included to aid summary of mapping, data tabulation, and analyses, and may be required as submittals in Drainage Reports. Use of these aids will speed PM&E’s review of these documents and help designers ensure complete submittals.
There are three general types of reports required by these Guidelines:
1. Drainage Project Notification; 2. Preliminary Drainage Report; and a 3. Final Drainage Report.
Municipality of Anchorage Drainage Design Guidelines March 2007
Page 4-2
Required content and submittal schedules for these reports are explained in the following sections. These submittals are interrelated with other required project development tasks not specifically discussed in these Guidelines including:
• Plat applications: Watercourse mapping must be approved through a Drainage Project Notification or a Preliminary or Final Drainage Report before plat applications will be accepted for review.
• Final plat approval: Final Drainage Report is required. • Site plan and conditional use approvals. A Preliminary Drainage Report is required. • Building permits. Final Drainage Report is required. • Subdivision agreements: Final Drainage Report is required. • Improvements to Public Places Agreements: Final Drainage Report is required.
4.2.1 Drainage Project Notification
A Drainage Project Notification form is required for all project types and serves two purposes:
1. Provide the MOA with the applicant’s preliminary watercourse mapping for the project area; and
2. Request watercourse mapping services and review, and provide permission for MOA entry into the project area.
All projects subject to these criteria are required to prepare and submit mapping of streams and major drainageways within the project area that has been reviewed and approved by Watershed Management Services (WMS). WMS review and approval is required for all watercourse mapping before submittal of plat applications, Drainage Reports, or other MOA permits required for drainage projects.
Watercourse mapping must completely and accurately identify all waters of the United States and major drainageways in the project area, for both pre- and post-development conditions. For stream mapping, applicants may either prepare mapping independently and submit it to the MOA for review, or may request mapping services as outlined in the following section. In all stream mapping cases, MOA digital streams mapping shall be used as a minimum representation of the presence and location of streams, and / or WMS will perform onsite inspections and prepare digital location maps at a base-map accuracy level. Details on WMS mapping standards and accuracy levels are available in Municipal Stream Classification: Anchorage, Alaska (MOA, 2004) and Municipality of Anchorage Stream Mapping Standards (MOA, November 2005).
Where available from earlier platting or subdivision activities, watercourse mapping previously approved by WMS or the MOA Planning Department’s wetlands staff will be accepted as approved as long as it is accompanied by a certification from the applicant that the provided watercourse mapping accurately represents current conditions.
For Crossing and Single-Lot Residential Projects, a Drainage Project Notification may meet all drainage reporting requirements for these types of projects (Section 4.2). If the notification submittal is approved and found to meet Drainage Report requirements, no additional submittals will be required.

Municipality of Anchorage Drainage Design Guidelines March 2007
Page 4-3
For Small and Large Project types, a separate Drainage Project Notification must be submitted prior to submittal of Preliminary or Final Drainage Reports. The Notification submittal will be used as a preliminary screening tool for review of watercourse mapping by WMS, and its receipt and approval is required before any Drainage Report will be accepted for review. The review process for Drainage Project Notifications submitted for Small Projects will also include a determination of Preliminary and Final Drainage Report requirements for these projects.
In addition to the completed Notification form (Appendix C), a complete Drainage Project Notification submittal shall include:
• A plan sketch, drawn to-scale, of the proposed project showing reconnaissance-level locations of known watercourses (streams and major drainageways);
• Location(s) of receiving waters for project runoff; and • Threshold runoff calculations (Single-Lot Residential and Small Projects only).
All Drainage Project Notifications must provide written permission for MOA to access and enter the property for reconnaissance.
Applicants are encouraged to request stream mapping services from WMS early in the project development. To request these services, applicants must prepare reconnaissance-level mapping of stream features known to exist within the proposed project area and provide written permission for WMS to access the properties on foot. The Drainage Project Notification form is used to make this request.
Upon receipt of the written request, WMS will:
• Prioritize and schedule review services, based on Planning Department priorities, request receipts, and seasonal constraints;
• Perform reconnaissance of all or part of the site (from May 1 to October 1) depending upon site conditions and snow or ice cover;
• Flag lower-order stream features (upon request of the applicant); and • Prepare field-grade maps and a written report specifying the stream and major
drainageway features located during the reconnaissance.
WMS can not guarantee that services will be available or performed in accordance with applicant provided timelines, however, reasonable attempts will be made to meet applicant needs.
WMS field-grade mapping is typically performed using map-grade GPS technology and orthophotographic imagery, and generally yields point locations within several feet of true ground position. These services are intended to speed required MOA mapping reviews and guide applicants in watercourse identification, but do not relieve the applicant of their responsibility to completely and accurately identify and map all waters of the United States in the project area. Whether or not watercourse features are identified and correctly located by WMS or any other agency, the applicant is obligated to report watercourse features upon discovery.

Municipality of Anchorage Drainage Design Guidelines March 2007
Page 4-4
4.2.2 Preliminary Drainage Report
All Large Projects require both a Preliminary and Final Drainage Report submittal. Preliminary Drainage Reports may also be required for Small Projects, particularly where project drainage will discharge to sensitive systems or to systems with limited capacity. PM&E will make this determination. Preliminary Drainage Reports must be submitted for specific authorizations as described in the Design Criteria Manual Section 2.4.C.1. Preliminary Drainage Reports are intended to:
• Define the nature and scope of the proposed project; including privately-owned improvements and associated improvements to public places, if any;
• Describe all existing conditions including potential downstream impacts; and • Propose controls needed to comply with MOA drainage criteria. The proposed controls
need to be defined to the conceptual level and do not need to be developed into full design drawings.
Preliminary Drainage Reports will have the same general form but not the same level of detail as final drainage reports, and need not contain a Statement of Compliance. Preliminary Drainage Reports must be submitted to the Municipality prior to acceptance of Final Drainage Reports, final plats, and other MOA permits. In some cases, the level of detail of a Preliminary Drainage Report will be sufficient for PM&E’s approval of final plats and other MOA permits. However, most projects will require approval of the Final Drainage Report.
4.2.3 Drainage Report
Drainage Reports are complete compilations of the final analyses and designs for proposed drainage systems, and are submitted as a final report. Where a Preliminary Drainage Report is required, a Drainage Report shall be submitted as the final resolution of problems and conceptual plans raised in the review of the Preliminary Drainage Report. Drainage Reports differ in detail and content depending on the drainage project type. At a minimum, the drainage report should contain the following, which are further described in Appendix A.
• A signed statement of compliance. This statement, provided in Appendix C, confirms that the Drainage Report is prepared in accordance with municipal, state, and federal requirements.
• Project description. • Basin characterization • Description of runoff analyses and stormwater conveyance and stormwater
management design • Appendices containing
o Complete drainage mapping of all relevant drainage system elements o Analyses and design calculations.
• Electronic copy of input files used for hydrologic modeling

Municipality of Anchorage Drainage Design Guidelines March 2007
Page 4-5
4.3 Project Reporting Requirements
Appendix A provides two outlines: one for Crossing Projects and one for the other project types. Specific project types can be identified by referencing Figure 2-1. Specific reporting requirements and reduced reporting opportunities based on project type are provided in the following text.
4.3.1 Crossing Project
All Crossing Projects are categorized in a single group, though required drainage design criteria may vary from project to project depending upon the size of the conveyance.
The drainage report may be waived for Crossing Projects where the applicant submits a Drainage Certification that the crossing requires only an equivalent 18-inch diameter circular pipe or smaller to convey the peak storm event required for conveyance design as specified in the DCM and the proposed structure will otherwise meet all MOA design criteria for crossings. The certification form is included in Appendix C.
4.3.2 Single-Lot Residential Project
The four Single-lot Residential Projects types are described in Table 2-1. In addition to the reduction in reporting requirements outlined in Table 3-1, pre-development drainage report requirements may be waived if either of the following can be provided:
• Certification that the fractions of impervious, lawn or other landscaping, and naturally vegetated landcover types present at pre-development will not change by more than 5% as a result of the proposed development.
• Certification of intent to comply through conformance with building covenants along with copies of active subdivision covenants and associated documentation that demonstrates covenant practices will meet threshold runoff rates for the parcel.
The certification form is included in Appendix C.
4.3.3 Small Project
Small Projects are divided into 2 types – simple and complex. A Simple Small Project has runoff below threshold runoff values, or discharges directly to tidewater, or infiltrates the base 1-year, 24-hour storm volume. A Complex Small Project exceeds threshold runoff values, and does not discharge directly to tidewater or infiltrate the base 1-year, 24-hour storm volume.
If the Small Project involves a single lot, the pre-development drainage report requirements may be waived if the following is provided:
• Certification that the fractions of impervious, lawn or other landscaping, and naturally vegetated landcover types present at pre-development will not change by more than 5% as a result of the proposed development.

Municipality of Anchorage Drainage Design Guidelines March 2007
Page 4-6
The Drainage Report for these projects must provide backup documentation for the certification and appropriate information for conveyance and project flood bypass design.
All other Small Projects must comply with all elements of the Drainage Report outline in Appendix A, except that Simple Small Projects are not required to include extended detention facilities or evaluate downstream impacts.
4.3.4 Large Project
Large Projects are divided into 2 subcategories – simple and complex. A Simple Large Project either discharges directly to tidewater, or infiltrates the base 1-year, 24-hour storm volume. All other large projects are categorized as complex.
All Large Projects must comply with all elements of the Drainage Report outline in Appendix A, except that Simple Large Projects are not required to include extended detention facilities.

Municipality of Anchorage Drainage Design Guidelines March 2007
Page 5-1
5 BASIN CHARACTERIZATION
All projects are required to provide basin characterization. Basin characterization refers to both mapping of spatial features and tabulation of related feature information. All characterizations should clearly identify and separately summarize:
• Pre-development (existing) conditions for project and upstream areas;
• Post-development conditions for project and upstream areas; and
• Existing conditions for downstream contributing basins for Large Projects and Complex Small Projects.
The following sections outline the minimum requirements for basin characterization. All basin characterization information used in analyses must clearly identify the information source, and where information is assumed, it should clearly identify the assumption rationale and supporting references.
5.1 Required Basin Feature Reporting
Basin features shall be clearly and consistently label basin features. Where available, terminology, system relationships, and naming conventions used in these Guidelines shall apply in Drainage Reports. At a minimum, the following basin features must be mapped and characterized:
• Contributing and project areas (drainage basin locations and boundaries);
• Landcover characteristics;
• Conveyance and stream locations, and characterization (pipes, culverts, open channels, streams, and representative overland flow paths used in calculations);
• Soils;
• Slopes; and
• Proposed and existing control structures.
5.2 Information Sources
Some drainage system mapping and feature characterization is publicly available. Designers are encouraged to use available information. A sampling of information sources known to the MOA is included in Appendix F. Designers are ultimately responsible for identifying and characterizing important basin features relative to their project. The sources of all information should be clearly identified in Drainage Reports.
PM&E, through the WMS, regularly updates and prepares detailed drainage feature mapping throughout the MOA, including mapping of natural stream features, drainageway networks, including natural, constructed, piped, and open channel features, and the subbasins associated with these networks. Where available, PM&E will use WMS mapping as a basis of its review and will provide access to this mapping as it is published. However, project analysts will remain

Municipality of Anchorage Drainage Design Guidelines March 2007
Page 5-2
responsible for correctly identifying the drainage networks and subbasins associated with their project, and for mapping any additional necessary detail, or any missing or incorrect information in current WMS map data.
5.3 Conveyance and Streams
Primary watercourses (major drainageways and streams) entering, crossing and exiting the project area must be identified. Smaller projects will generally require detailed mapping of watercourses within the project area, some less detailed mapping of upstream contributing areas, and limited mapping of the position of the downstream conveyance route below the project. Larger projects will require similar mapping but with some additional mapping of major flow paths within contributing basins downstream of the project (sufficient to calculate input hydrographs) and more detailed characterization of the downstream conveyance route. Project storm water may be conveyed by a range of watercourse types including streams, sometimes including intermittent features, natural and constructed open channel drainageway features, and piped drainageways. Where required, all of these conveyances must be accurately mapped for both pre- and post-development conditions. Important hydraulic characteristics of these features must also be estimated and the information tabulated for review as necessary for analysis.
All watercourse mapping must be performed at an accuracy sufficient for representative analysis. Post-development mapping must show proposed drainageways within the project area to scale and at correct relative positions to pre-development watercourse features. Watercourse mapping for upstream and downstream contributing areas need only be representative within these basins, but locations of confluences with proposed project drainages and the downstream conveyance route must be sufficiently accurate to allow reasonable representation of actual hydraulic performance of the network. Finally, the location of pre-development watercourses features forming the downstream conveyance route must be mapped in the field sufficiently accurately to ensure that the downstream 10% conveyance route (see Appendix G) identified is in fact the route that storm drainage from the project area will follow. Computer automated methods to identify flow paths may be useful in initially identifying approximate drainage directions, but designers and analysts shall ultimately be responsible for accurate location of drainage features, particularly along the 10% conveyance route.
Streams reviewed and approved by WMS during the Drainage Project Notification process will provide the basis for all stream mapping. Any additional stream features or adjustments to mapped stream features discovered or proposed during project development must be immediately reported to WMS as supplementary information to the original Drainage Project Notification for review and approval.
Characterization of watercourses includes, at a minimum, the following, along with any other characteristics required for analysis and design:
• Material types (e.g. pipes, channel lining);
• Slopes;
• Roughness characterization;
• Cross-sectional geometry (e.g., shapes, widths, flow areas);

Municipality of Anchorage Drainage Design Guidelines March 2007
Page 5-3
• Lengths;
• Overtopping, bypass, or overflow elevations (e.g., maximum headwater depth); and
• Stage-storage discharge relationship for existing outlet controls.
5.4 Contributing Areas (Drainage Basins)
The basins contributing to identified watercourses must be mapped and characterized. Basin boundaries defining contributing areas can be identified through topographic mapping, survey data, aerial photographs, and street, streams and drainageways watercourse mapping, and less commonly through field reconnaissance. Basins must be identified based on actual surface water flow. Basin mapping must identify a basin discharge point at the location the basin connects to the project drainage network (for upstream contributing areas) or to the downstream conveyance route (for downstream contributing areas). The boundaries of contributing areas should be shown on mapping, and all contributing basins and / or subbasins used in the project drainage analysis given unique identities for use in characterization of features.
Accurate flow estimation for a basin depends significantly on recognizing areas with uniform distribution of important characteristics within that basin (McCuen et al., 2002). Basins must be generally uniform from the perspective of precipitation and basin landcover. Basin landcover characteristics will be considered homogenous if impervious, landscaped, and naturally vegetated landcover surface types are reasonably evenly and uniformly distributed across the basin.
A drainage basin can be considered hydrologically homogenous if, for post-development conditions (existing conditions for downstream contributing areas), the following conditions are met:
1. Orographic factors do not differ by more than 20% across the project area or 40% across upstream and downstream contributing basins;
2. (%Total Impervious)/(%Lawns and Landscaped Pervious) for any 3-acre basin fraction is within +30% of this ratio when compared to any other 3-acre fraction of the basin; for any basin less than 6 acres, any area representing 25% of the proposed basin, must be within +30% of this ratio when compared to any other 25% portion within the same basin.
3. (%Total Impervious)/(%Total Naturally Vegetated Pervious) for any 3-acre basin fraction is within +30% of this ratio when compared to any other 3-acre fraction of the basin; for any basin less than 6 acres, any area representing 25% of the proposed basin, must be within +30% of this ratio when compared to any other 25% portion within the same basin.
Where a basin does vary significantly in precipitation or landcover distribution, partitioning of the basin and routing subbasin flows is required.
Homogeneity is important in drainage analysis even where drainage conveyances serving the basin vary significantly in character from one portion of the basin to another. The effects of storage must also be recognized, and where significant storage is available, designers are
Municipality of Anchorage Drainage Design Guidelines March 2007
Page 5-4
cautioned that basins must be further partitioned and routing methods applied to properly address the effects.
5.5 Landcover
Landcover is an explicit characterization of the pervious or impervious nature of land surfaces, or the structures covering those land surfaces. Landcover, for the purposes of these Guidelines, shall not be considered adequately characterized solely through use of runoff response numbers, such as SCS curve numbers or Rational Method coefficients. Rather, landcover must be characterized by direct mapping or estimation of future conditions resulting in identification and tabulation of area and percent coverage of classes of pervious and impervious surfaces as identified in these Guidelines. Landcover character must be mapped and summarized for each contributing basin and subbasin as necessary to support a design.
5.5.1 Pre-Development Landcover
Estimates of pre-development landcover conditions shall be based on existing conditions prior to any site preparation for the project, except for designs where zoning adjustments in pre-development landcover are applicable (see Section 5.5.6).
5.5.2 Post-Development Landcover
Post-development landcover characterization of the project area and upstream inflow areas must assume a fully developed condition based on zoning or platting notes, if the platting notes specifically limit and specify landcover. For example, hydrologic analyses for post-development conditions of a single phase of a multi-phased project shall consider the fully developed conditions of all future phases that will contribute flows to design points within the phase under current design. Post-development landcover for downstream lateral inflow basins shall always assume pre-development (or existing) landcover conditions.
5.5.3 Use of Empirical Landcover Coefficients
Where empirical approaches, such as SCS-method curve numbers (CNs) or Rational Method runoff coefficients (C), are used to estimate a rainfall runoff response, landcover as defined in this section must always first be mapped and tabulated, and submitted as a basis of the curve number or runoff coefficient assignments. Composite curve numbers and runoff coefficients are often tabulated in the literature for basins with unique distributions and percentages of landcover types. However, published composite runoff numbers can only be used where the analyst first shows that the landcover conditions of the referenced composite basin are reasonably similar (+2% for impervious surfaces and +5% for other landcover types) to those of the design basin. In cases where published composite values are applied, street landcover shall be separately mapped and reported for the project area.
5.5.4 Required Landcover Characterization
Landcover characterization requires mapping of spatial and attribute information. Attribute information should be tabulated and clearly referenced to spatially mapped features. Landcover may be mapped in detail, calculated from averaged conditions determined from detailed mapping

Municipality of Anchorage Drainage Design Guidelines March 2007
Page 5-5
of representative areas, or extrapolated from one or more landcover archetypes approved by PM&E (Section 5.5.5).
At a minimum, all core landcover types indicated in the following bold text shall be identified and mapped. Characterization information tabulated for these landcover types shall include at minimum:
• Landcover type as area in square feet or acres for each basin;
• Landcover type as a percentage of each total basin area; and
• Landcover type as an average percentage or area per lot or other land use type (e.g., roads), as required.
A sample reporting tabulation is provided at the end of Appendix C as a guide. Additional information to be tabulated for each landcover type is included in the following descriptions.
Total Impervious - Total Impervious landcover as a type includes all surfaces that are effectively impervious, or that do not permit significant penetration or passage of water over the duration of a single storm event.
• Roads Impervious - represents all road surfaces, public and private, both paved and unpaved. Adjoining paved walkways, bike paths, and street parking are included as road surfaces. For the project area, roads shall be tabulated as total linear feet at a stated average surface width. Where roads within the project area have significantly different surface widths, width classes shall be specified and information for each width class tabulated. For contributing inflow areas, only a sum total estimate of Roads Impervious landcover will be required and existing road landcover may be estimated from MOA or other mapping. Reporting of Roads Impervious landcover shall include total per road width class.
• Lots Impervious - A specific lot type is a class of individual building parcels that are similar in size and do, or will have, similar relative landcover fractions. Lots Impervious represents all effectively impervious surfaces on individual lots and land parcels including roofs, driveways, and Other Impervious surfaces, as follows:
• Roofs - includes all structure and building roofs;
• Driveways - includes all driveways and walkways; and
• Other lot impervious - includes other effectively impervious surfaces including decks, playing courts, patios, etc.
Lots Impervious can be subdivided into roofs, driveways, and other lot impervious surfaces or the areas of these surfaces can be summed as Lots Impervious.
Where these are separately mapped and tabulated, designers may propose runoff adjustment for indirectly connected impervious surfaces (see Section 5.1.5). Where impervious surfaces are not mapped in detail by the following types, all impervious surfaces shall be assumed to act as directly connected impervious surfaces.
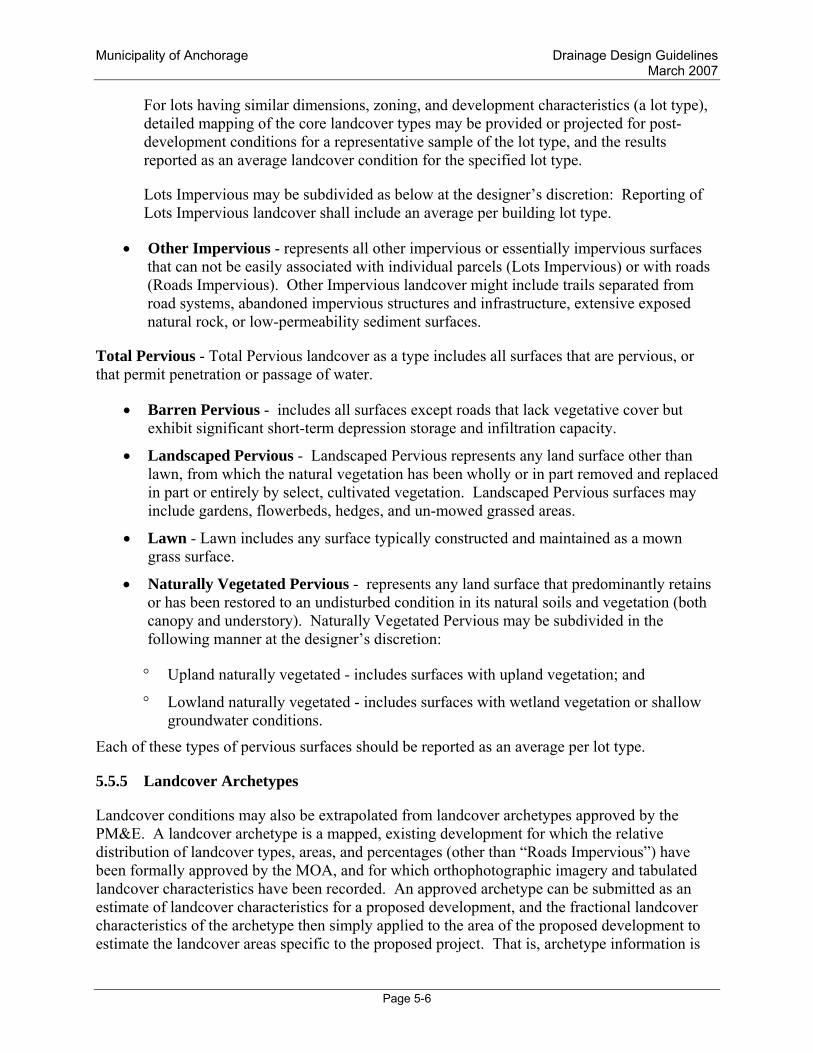
Municipality of Anchorage Drainage Design Guidelines March 2007
Page 5-6
For lots having similar dimensions, zoning, and development characteristics (a lot type), detailed mapping of the core landcover types may be provided or projected for post-development conditions for a representative sample of the lot type, and the results reported as an average landcover condition for the specified lot type.
Lots Impervious may be subdivided as below at the designer’s discretion: Reporting of Lots Impervious landcover shall include an average per building lot type.
• Other Impervious - represents all other impervious or essentially impervious surfaces that can not be easily associated with individual parcels (Lots Impervious) or with roads (Roads Impervious). Other Impervious landcover might include trails separated from road systems, abandoned impervious structures and infrastructure, extensive exposed natural rock, or low-permeability sediment surfaces.
Total Pervious - Total Pervious landcover as a type includes all surfaces that are pervious, or that permit penetration or passage of water.
• Barren Pervious - includes all surfaces except roads that lack vegetative cover but exhibit significant short-term depression storage and infiltration capacity.
• Landscaped Pervious - Landscaped Pervious represents any land surface other than lawn, from which the natural vegetation has been wholly or in part removed and replaced in part or entirely by select, cultivated vegetation. Landscaped Pervious surfaces may include gardens, flowerbeds, hedges, and un-mowed grassed areas.
• Lawn - Lawn includes any surface typically constructed and maintained as a mown grass surface.
• Naturally Vegetated Pervious - represents any land surface that predominantly retains or has been restored to an undisturbed condition in its natural soils and vegetation (both canopy and understory). Naturally Vegetated Pervious may be subdivided in the following manner at the designer’s discretion:
° Upland naturally vegetated - includes surfaces with upland vegetation; and
° Lowland naturally vegetated - includes surfaces with wetland vegetation or shallow groundwater conditions.
Each of these types of pervious surfaces should be reported as an average per lot type.
5.5.5 Landcover Archetypes
Landcover conditions may also be extrapolated from landcover archetypes approved by the PM&E. A landcover archetype is a mapped, existing development for which the relative distribution of landcover types, areas, and percentages (other than “Roads Impervious”) have been formally approved by the MOA, and for which orthophotographic imagery and tabulated landcover characteristics have been recorded. An approved archetype can be submitted as an estimate of landcover characteristics for a proposed development, and the fractional landcover characteristics of the archetype then simply applied to the area of the proposed development to estimate the landcover areas specific to the proposed project. That is, archetype information is

Municipality of Anchorage Drainage Design Guidelines March 2007
Page 5-7
applied by selecting an appropriate archetype, and multiplying the archetype landcover percentages by the basin or lot areas of the new proposed development.
Approved landcover archetypes will be archived by WMS and available for public inspection and use. Archetypes should not be mistaken for landcover composite characterizations, typically published in the literature to support selection of curve numbers and runoff coefficients. Landcover archetypes may be used for all pre-development landcover characterizations and for post-development upstream and downstream inflow area land characterizations. Estimates of post-development project area landcover may use archetypes only to estimate Lot Impervious and Pervious landcover types. Use of an archetype resulting in a Total Impervious landcover for the project area less than the densest allowed by zoning will not be permitted without platting notes explicitly specifying and limiting landcover percentages.
Landcover archetypes are developed by analyzing an existing, fully developed area. The representative area is mapped and landcover characteristics cataloged as described above using orthophotographic imagery. Documentation of the characterization shall be submitted to PM&E for review and approval.
Archetype approval submittals must include at a minimum:
• Proposed archetype name;
• Description of the proposed archetype including at a minimum:
o Total area;
o Land use(s);
o Lot sizes;
o Soil types;
o Topography; and
o Zoning or plat restrictions.
• Digital map consisting of a clear, reproducible orthophotographic image with landcover types, a bar scale, and photo date clearly identified; and a
• Table summarizing landcover types, areas, and percentages as required in this section.
Where archetypes are used in drainage calculations, applicants must submit landcover characterizations as provided by this section and separately indicate:
• The archetype applied (by name and approval date);
• Tabulated adjusted areas and percent areas;
• Separate tabulated landcover values for Roads Impervious landcover type; and
• Clear indications of which calculations are based on the archetype landcover values.

Municipality of Anchorage Drainage Design Guidelines March 2007
Page 5-8
Applicants are further required to provide a statement indicating the reason for selecting the archetype, its applicability, and certification that they are developing their property in accordance with the archetype description.
5.5.6 Community Management Landcover Adjustments
Landcover adjustments are allowed for extended detention, flood hazard protection, and downstream impact analyses in areas meeting specific zoning and management requirements. Landcover adjustments are authorized only for projects in specifically zoned areas of the MOA and may be applied only as pre-development landcover characterization.
Adjustments assume larger pre-development flows that are higher than actually exist and thereby decrease the need for controls on post-development flows. Since the adjustments may result in real, undesired post-development peak flow increases, an adjustment is only justified where unified, community storm water management of drainage exists. This requirement is to ensure incorporation of additional controls needed to mitigate the potentially higher post-development peaks. Unified storm water management entails the following:
• Management and operations integrated across entire drainage networks (incorporating whole subbasins as identified in WMS subbasins mapping);
• Public commitment to construction and maintenance of conveyances and end-of-pipe controls sufficient to address increased peaks; and
• Ongoing compliance with all MOA National Pollutant Discharge Elimination System (NPDES) permit requirements as coordinated by WMS.
Currently the only area achieving such management is the Anchorage Roads and Drainage Service Area (ARDSA).
Landcover adjustments are applied to the project area by assuming pre-development landcover percentages higher than may be present. To do this, post-development landcover areas are tabulated and the corresponding pre-development landcover percentage chosen from Table 5-1 chosen based on either zoning or type of street project. Several examples of the pre-development landcover adjustment are shown in Appendix E.
When submitting a Drainage Report that includes landcover adjustments, applicants must include:
• Tabulated adjusted areas and percent areas;
• Appropriate zoning boundaries on mapping; and
• Clear indications of which calculations are based on the adjusted landcover.

Municipality of Anchorage Drainage Design Guidelines March 2007
Page 5-9
Table 5-1: Community Management Landcover Adjustments
Adjusted Pre-Development % Area Impervious1
Proposed Development Land Use New Development Re-Development Lower-Density 3
(Residential Districts R1, R2, R3, R5, R6, R7, R9, R10; low-density residential Girdwood districts) All landcover types 0 35
Higher-Density 3 (Residential District R4; all Commercial, Mixed Use, and Industrial Districts;
and high density residential, commercial, and other Girdwood Districts) Paved Surface/Open Parking 35 35
Building/Structured Parking 90 90
Commercial Access Street 80 80
Industrial Yard 80 80
Other Land Use No adjustment allowed No adjustment allowedStreets2
(Road construction projects in ROW not part of other lot or parcel development or re-development) Lane
0-600 Average Daily Traffic (ADT)60 70
Local/Collector(>600-2000 ADT)
70 80
Collector/Arterial(>2000ADT)
90 95
1 New development applies only to projects on undeveloped, vegetated, or cleared and grubbed parcels. Development on parcels having any previous development (e.g. structures, long term clearing, roadways) will require use of the re-development column.
2 Street adjustments are applied across the full project ROW width. 3 See Glossary for definition.
5.6 Soil
Some characterization of soil is required for all projects. Analysts are required to report soil characteristics as used in design. These parameters are discussed further in Section 7.1.2 and should be tabulated as basin characteristics unless soil types apply to the entire project area.
Where natural soils are disturbed, compacted, or replaced by graded and compacted soils, analysts must appropriately adjust the soil character to reflect the changes, especially infiltration rates. Soil parameters must be supported by documentation and must reflect reasonably anticipated developed conditions. Clogging of natural and manufactured sediments must also be addressed.
5.7 Slope
Land and conveyance slopes are critical to estimating hydrologic flows. Characterization of all features – land surfaces, conveyance structures, drainageways – should include slope in the tabulation. Slopes are also necessary for estimating hydrologic response of overland flow paths and storm water conveyances. Assumptions, methods, and data sources used in estimating land and conveyance slopes shall be specified. Post-development project-area slopes shall be estimated from platting and land development maps. Where features have significantly different
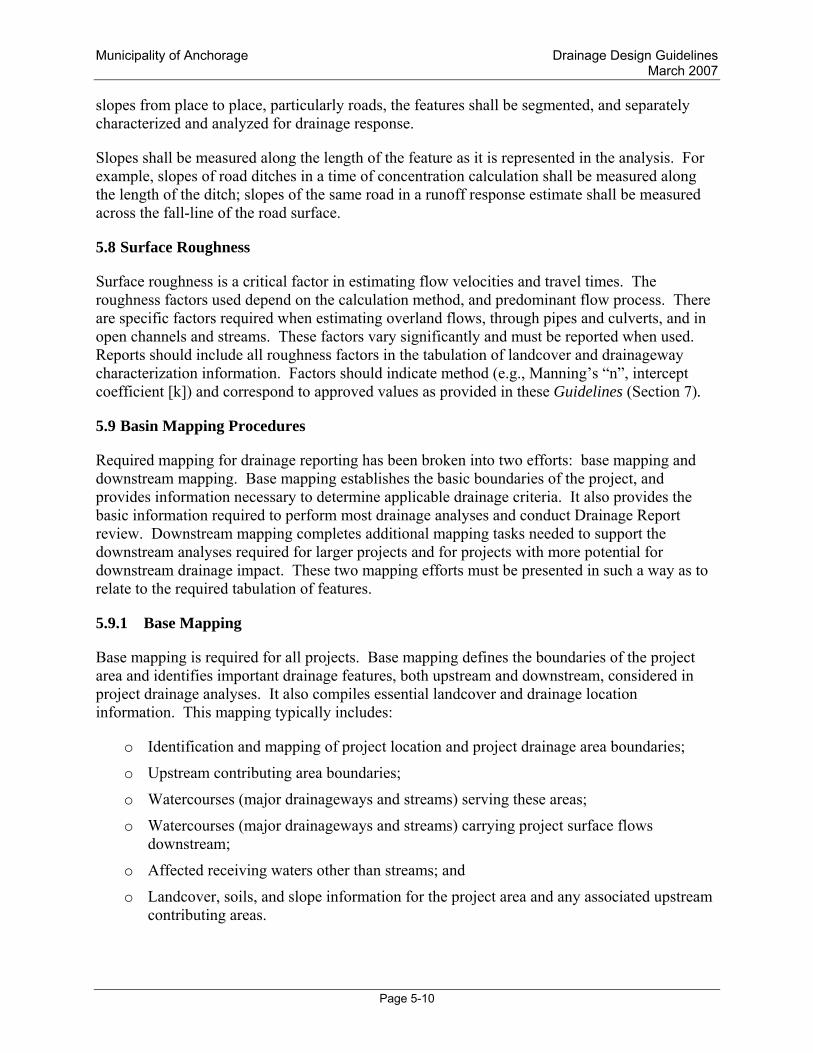
Municipality of Anchorage Drainage Design Guidelines March 2007
Page 5-10
slopes from place to place, particularly roads, the features shall be segmented, and separately characterized and analyzed for drainage response.
Slopes shall be measured along the length of the feature as it is represented in the analysis. For example, slopes of road ditches in a time of concentration calculation shall be measured along the length of the ditch; slopes of the same road in a runoff response estimate shall be measured across the fall-line of the road surface.
5.8 Surface Roughness
Surface roughness is a critical factor in estimating flow velocities and travel times. The roughness factors used depend on the calculation method, and predominant flow process. There are specific factors required when estimating overland flows, through pipes and culverts, and in open channels and streams. These factors vary significantly and must be reported when used. Reports should include all roughness factors in the tabulation of landcover and drainageway characterization information. Factors should indicate method (e.g., Manning’s “n”, intercept coefficient [k]) and correspond to approved values as provided in these Guidelines (Section 7).
5.9 Basin Mapping Procedures
Required mapping for drainage reporting has been broken into two efforts: base mapping and downstream mapping. Base mapping establishes the basic boundaries of the project, and provides information necessary to determine applicable drainage criteria. It also provides the basic information required to perform most drainage analyses and conduct Drainage Report review. Downstream mapping completes additional mapping tasks needed to support the downstream analyses required for larger projects and for projects with more potential for downstream drainage impact. These two mapping efforts must be presented in such a way as to relate to the required tabulation of features.
5.9.1 Base Mapping
Base mapping is required for all projects. Base mapping defines the boundaries of the project area and identifies important drainage features, both upstream and downstream, considered in project drainage analyses. It also compiles essential landcover and drainage location information. This mapping typically includes:
o Identification and mapping of project location and project drainage area boundaries;
o Upstream contributing area boundaries;
o Watercourses (major drainageways and streams) serving these areas;
o Watercourses (major drainageways and streams) carrying project surface flows downstream;
o Affected receiving waters other than streams; and
o Landcover, soils, and slope information for the project area and any associated upstream contributing areas.
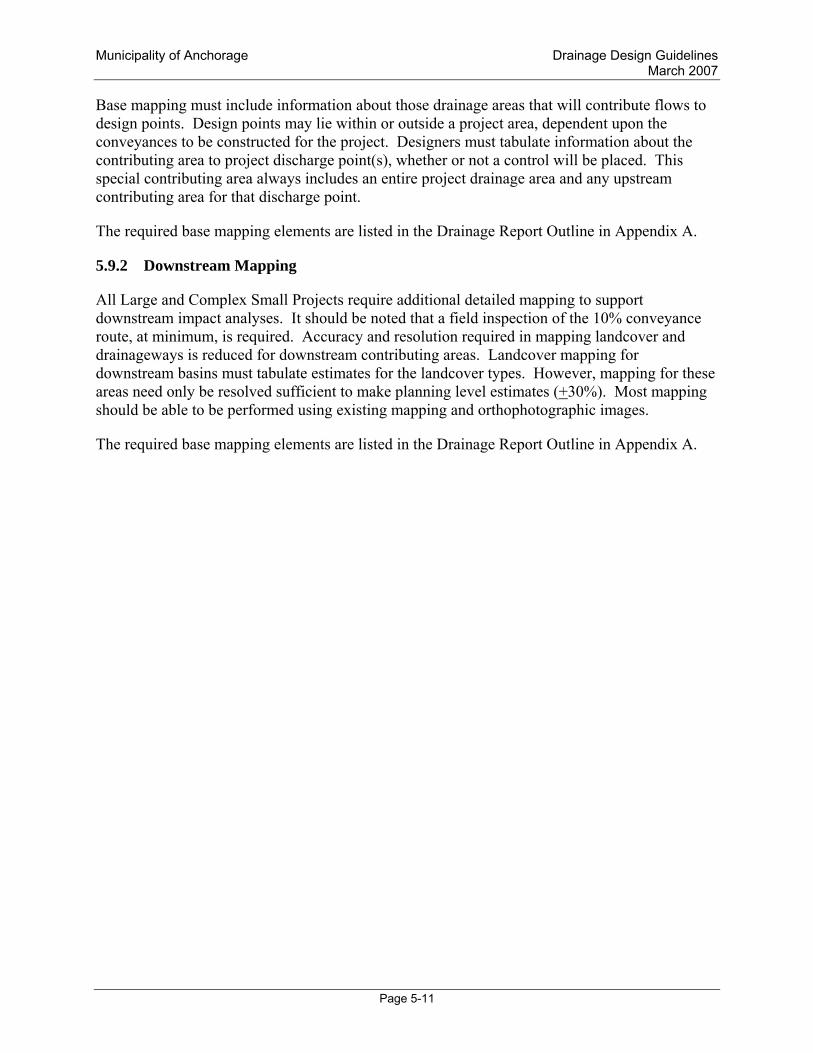
Municipality of Anchorage Drainage Design Guidelines March 2007
Page 5-11
Base mapping must include information about those drainage areas that will contribute flows to design points. Design points may lie within or outside a project area, dependent upon the conveyances to be constructed for the project. Designers must tabulate information about the contributing area to project discharge point(s), whether or not a control will be placed. This special contributing area always includes an entire project drainage area and any upstream contributing area for that discharge point.
The required base mapping elements are listed in the Drainage Report Outline in Appendix A.
5.9.2 Downstream Mapping
All Large and Complex Small Projects require additional detailed mapping to support downstream impact analyses. It should be noted that a field inspection of the 10% conveyance route, at minimum, is required. Accuracy and resolution required in mapping landcover and drainageways is reduced for downstream contributing areas. Landcover mapping for downstream basins must tabulate estimates for the landcover types. However, mapping for these areas need only be resolved sufficient to make planning level estimates (+30%). Most mapping should be able to be performed using existing mapping and orthophotographic images.
The required base mapping elements are listed in the Drainage Report Outline in Appendix A.

Municipality of Anchorage Drainage Design Guidelines March 2007
Page 5-12

Municipality of Anchorage Drainage Design Guidelines March 2007
Page 6-1
6 DESIGN STORMS
Selection and development of design storms are required as the basis for most drainage designs where inflow hydrographs are not otherwise specified. Characteristics of base design storms for use in MOA rainfall runoff analysis and design applications are summarized below.
6.1 Updated IDF Curves
The Anchorage IDF curves have recently been updated based on data collected at Ted Stevens Anchorage International Airport (TSAIA) between 1962 and 2002 (USKH, 2006). The updated IDF curves are presented in Figure 6-1. These IDF curves are only to be used:
1. With the Rational Method as allowed in these Guidelines OR 2. To obtain the 24-hour storm depth for different frequency events
A tabulation of depths and intensities for durations of 5 to 15 minutes for use with the Rational Method is included in Table 6-1. The SCS Type I distribution is to be used to distribute the 24-hour storm depth over a 24-hour period. A tabulation of the 24-hour depths is included in Table 6-2.
Table 6-1: Base Intensities and Depths for Different Frequency Rainfall Events
Duration Frequency Frequency min hrs 1-year 10-year 25-year 50-year 100-year 1-year 10-year 25-year 50-year 100-year Depth, inches Intensity, inches per hour
5 0.083 0.061 0.115 0.136 0.153 0.170 0.730 1.380 1.636 1.837 2.038 6 0.100 0.067 0.126 0.149 0.167 0.185 0.668 1.255 1.487 1.669 1.851 7 0.117 0.072 0.135 0.160 0.180 0.199 0.619 1.159 1.372 1.540 1.706 8 0.133 0.077 0.144 0.171 0.191 0.212 0.580 1.082 1.280 1.435 1.590 9 0.150 0.082 0.153 0.181 0.202 0.224 0.547 1.018 1.203 1.349 1.494 10 0.167 0.087 0.161 0.190 0.213 0.236 0.520 0.964 1.139 1.276 1.413 11 0.183 0.091 0.168 0.199 0.223 0.246 0.496 0.917 1.084 1.214 1.344 12 0.200 0.095 0.175 0.207 0.232 0.257 0.475 0.877 1.035 1.160 1.283 13 0.217 0.099 0.182 0.215 0.241 0.267 0.457 0.841 0.993 1.112 1.230 14 0.233 0.103 0.189 0.223 0.250 0.276 0.440 0.810 0.955 1.069 1.183 15 0.250 0.106 0.195 0.230 0.258 0.285 0.426 0.781 0.921 1.031 1.141
6.2 Storm Volume – Base and Adjusted
Volumes for local design rainfall events, presented in Table 6-1, are based on the updated Anchorage IDF curves presented in Figure 6-1. These volumes represent the “base” volume for storms with the specified duration and frequency.
The mountainous and peninsular geography of Anchorage along the path of the North Pacific jet stream results in pronounced and generally predictable differences in precipitation amounts along the mountain fronts (an orographic effect). PM&E drainage criteria require application of
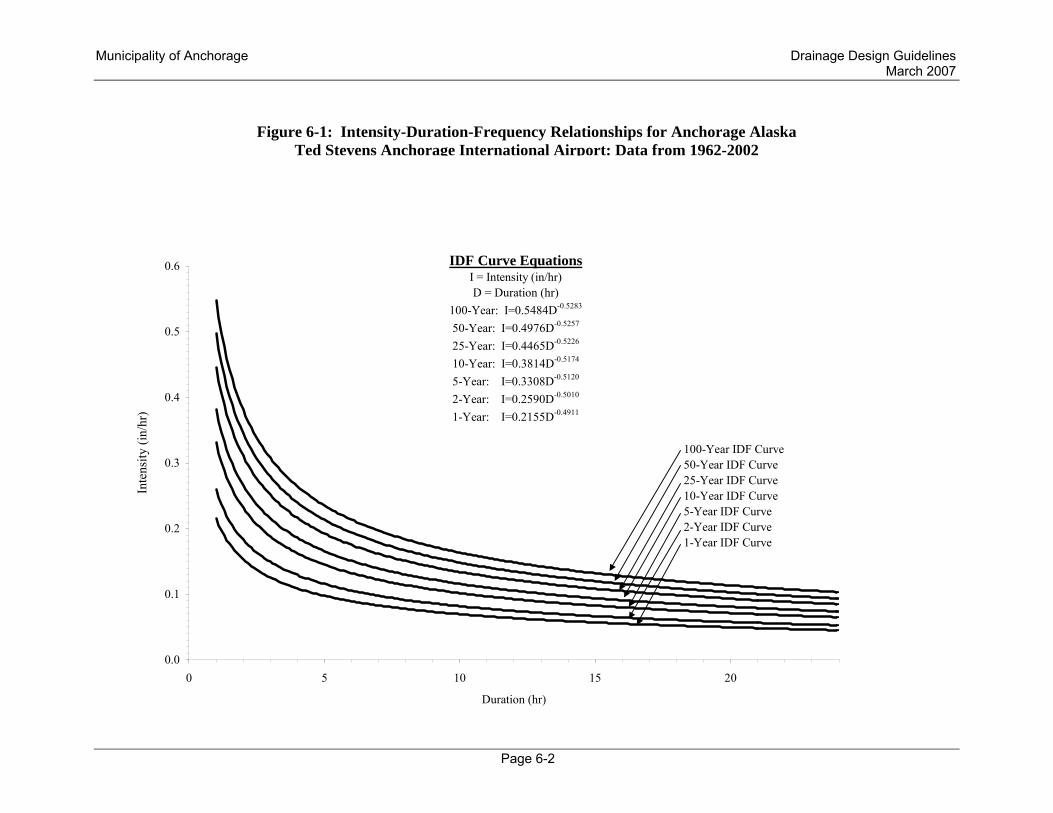
Municipality of Anchorage Drainage Design Guidelines March 2007
Page 6-2
Figure 6-1: Intensity-Duration-Frequency Relationships for Anchorage Alaska Ted Stevens Anchorage International Airport: Data from 1962-2002
Figure 4.1Intensity-Duration-Frequency Relationships for Anchorage, Alaska
Ted Stevens Anchorage International Airport: Data from 1962 - 2002
0.0
0.1
0.2
0.3
0.4
0.5
0.6
0 5 10 15 20
Duration (hr)
Inte
nsity
(in/
hr)
IDF Curve EquationsI = Intensity (in/hr)D = Duration (hr)
100-Year: I=0.5484D-0.5283
50-Year: I=0.4976D-0.5257
25-Year: I=0.4465D-0.5226
10-Year: I=0.3814D-0.5174
5-Year: I=0.3308D-0.5120
2-Year: I=0.2590D-0.5010
1-Year: I=0.2155D-0.4911
100-Year IDF Curve50-Year IDF Curve25-Year IDF Curve10-Year IDF Curve5-Year IDF Curve2-Year IDF Curve1-Year IDF Curve

Municipality of Anchorage Drainage Design Guidelines March 2007
Page 6-3
an orographic factor to adjust the “base” volume for these effects, depending on the location of the project. Once the base volume of a design storm has been multiplied by the appropriate orographic factor, it is referred to as an “adjusted” design storm.
Maps indicating the appropriate orographic factor to be used for any location within the MOA are provided in Chapter 2 of the DCM. Where no rainfall intensity mapping is available for an area, proposed orographic factors must be submitted for approval by PM&E.
The orographic factor should be interpolated to the nearest hundrethmeasured at the centroid of the contributing area. Where the contributing area covers more than two contour intervals on the published maps, determine the orographic factor by performing an area-weighted average of all contour intervals within the contributing area or by analyzing the contributing area as multiple subbasins.
Table 6-2: MOA Base Storm Volumes
Design Requirement Base Design Storm
Application
Base Total Volume (inches)
Conveyance Design 10-year, 24-hour Minor Drainageway1 1.77 10-year, 24-hour Major Drainageway1 1.77 50-year, 24-hour Non-Regulated Stream of
1st and 2nd order1 2.25
100-year, 24-hour Non-Regulated Stream of ≥3rd order, or Regulated Stream1
2.48
Wetland Retention Retention Volume 2-year, 6-hour 3 Required Retention2 0.533
Extended Detention
1-year, 24-hour Channel Protection4 1.09 Flood Hazard Protection 10-year, 24-hour Peak Control4 1.77 10-year, 24-hour Channel Protection4 1.77 Project Flood Bypass 100-year, 24-hour Safety 2.48 Downstream Impact Control 10-year, 24-hour Peak Control4 1.77 100-year, 24-hour Peak Control4 2.48 Time of Concentration Calculations
2-year, 24-hour Overland flow calculation 1.26 1. See Glossary 2. When necessary to comply with conditions of a U.S. Army Corps of Engineers Section 404 as applicable to the project. 3. Volume and flow according to runoff from 2-year, 6-hour duration hyetograph developed by JMM Consulting Engineers, Inc.,
1991; presented in Table 6-3 4. Corresponding to design criteria specified in Chapter 2 of the MOA Design Criteria Manual (DCM). Note: Water Quality Protection rates and volumes apply to all events and are expressed in runoff flow and volume, not storm
volumes, unless specified otherwise in Chapter 2 of the DCM.

Municipality of Anchorage Drainage Design Guidelines March 2007
Page 6-4
6.3 Storm Duration
All design storms are based on a 24-hour duration, with the exception of wetlands retention design in compliance with a U.S. Army Corps of Engineers Section 404 permit. When applying a method that requires use of storm parameters for a rainfall duration smaller than 24 hours (e.g., as in the Rational Method), the average intensity used in the calculation shall be determined through application of the IDF curve equations shown in Figure 6-1 for the appropriate return period. However, all detention and hydrograph routing analyses and designs shall be based on volumes specified for the 24-hour duration events.
6.4 Storm Distribution
Design storms for MOA drainage applications have distributions based on either the 2-year, 6-hour design event (Table 6-3) or the SCS Type I, 24-hour duration storm distribution (Appendix D).
Table 6-3: MOA Water Quality Treatment/Wetland Retention Design Storm
2-year, 6-hour rainfall Time min. Precip. in. Time min. Precip. in. Time min. Precip. in.
5 0.004 125 0.007 245 0.007 10 0.004 130 0.007 250 0.006 15 0.004 135 0.007 255 0.006 20 0.004 140 0.008 260 0.006 25 0.004 145 0.008 265 0.006 30 0.005 150 0.009 270 0.006 35 0.005 155 0.009 275 0.006 40 0.005 160 0.010 280 0.005 45 0.005 165 0.011 285 0.005 50 0.005 170 0.013 290 0.005 55 0.005 175 0.015 295 0.005 60 0.005 180 0.062 300 0.005 65 0.005 185 0.016 305 0.005 70 0.005 190 0.015 310 0.005 75 0.005 195 0.014 315 0.005 80 0.005 200 0.011 320 0.005 85 0.005 205 0.010 325 0.005 90 0.006 210 0.009 330 0.005 95 0.006 215 0.009 335 0.005
100 0.006 220 0.008 340 0.004 105 0.006 225 0.008 345 0.004 110 0.006 230 0.007 350 0.004 115 0.006 235 0.007 355 0.004 120 0.007 240 0.007 360 0.004
Total volume: 0.53 inches From: JMM Consulting Engineers Inc, 1991

Municipality of Anchorage Drainage Design Guidelines March 2007
Page 6-5
6.5 Storm Frequency
The frequency (return period) of a design storm is selected based on the purpose of the analysis as specified in the DCM.
Municipality of Anchorage Drainage Design Guidelines March 2007
Page 6-6

Municipality of Anchorage Drainage Design Guidelines March 2007
Page 7-1
7 RUNOFF RESPONSE
Once design storms are compiled and basin geometry is mapped, these data must be applied to calculate runoff flows and flow responses along drainage systems. The storm water runoff response of a basin can be approximated by a number of techniques.
• For basins that are relatively small and homogenous in terms of slope, soil, landcover, rainfall, and drainage systems, relatively simple methods can be applied to estimate this response. For many drainage design purposes within the MOA, analysis of runoff response can be spatially “lumped” across the entire basin where these homogenous conditions exist. That is, peak flows and runoff hydrographs can be estimated as an effect of the basin as a whole. This section addresses estimation of peak flows and development of runoff hydrographs for these types of situations.
• For larger or more complex basins and groups of basins, separate estimation of runoff response may be required for each subbasin using simple techniques, followed by application of routing techniques to the individual hydrographs to accurately assess the response of the entire complex.
Basic runoff response calculations typically include estimates of:
o Peak flows at design points;
o Changes in flow rates with time at design points (hydrographs); and
o Changes in combined flows along drainage networks and controls (routing).
Basic calculation of peak flows and hydrographs using simple methods are described in this section. Routing runoff flows to determine downstream impacts and to provide a basis for design of detention devices to control peak flows is addressed in Sections 8 and 9.
Basic information and preliminary calculations required in a drainage analysis depends on the method chosen. However, for many simpler methods, estimating peak flows or developing runoff hydrographs at a design point very often requires some of the same basic initial calculations. These typically include:
o Representing the overall response of basin landcover to runoff in order to estimate precipitation losses;
o Representing and delineating a primary runoff flow path across the basin in order to estimate the time of concentration along the longest flow path in terms of time for a basin; and
o Estimating the time to peak flow (the lag time) or other factors in order to transform the runoff to a hydrograph at a design point.
Although each method and model used may require slightly different approaches in performing these tasks, many runoff models will require that these be addressed in some fashion.

Municipality of Anchorage Drainage Design Guidelines March 2007
Page 7-2
Pre-development runoff response may not be estimated using a different methodology than that used for post-development. If analysts propose to use any significant modification of standard methods or parameters to fit particular circumstances, a variance must be requested that includes justification with published research, or other information acceptable to PM&E.
7.1 Precipitation Losses
Storm runoff volume identified as excess precipitation is that fraction of rainfall available for runoff after initial abstractions and other losses have been satisfied. Separating precipitation losses from the runoff volume is typically the first step in calculating the overall runoff response of a basin. The range of methods used to estimate excess precipitation can generally be classed as conceptual (based on mathematical representations of the discrete physical processes involved) or empirical (based on statistical evaluation of the measured overall responses of real basins). Conceptual methods typically account for each runoff element by application of formulaic representations of the important physical processes. Empirical methods typically rely on extrapolation to the specific design case from analyses of groups of other basins where overall responses have been measured.
Conceptual methods require a sound understanding of the physical processes occurring during a rainfall runoff event and some specific knowledge of the parameters at the project site necessary to model these processes. Typically, depression storage (water trapped in small depressions on the surface), soil infiltration characteristics, and surface slopes are critical elements in determining excess precipitation with conceptual models. Evaporation may also be important when continuous models are used but, for the more commonly performed single storm event analysis, only antecedent soil moisture conditions need be known. Conceptual models are highly sensitive to parameters representing these elements, making it critical to identify and summarize the algorithms and parameters used in models to estimate runoff. Therefore, where parameters assigned by an analyst differ significantly from the norms specified in these Guidelines, use of the parameters must be supported by documentation and submitted for approval by PM&E.
Empirical methods use overall rainfall runoff responses measured in other basins to model a basin with similar characteristics where no response measurements are available. The SCS Method, for example, has represented the overall response of known basins, grouped by landcover characteristics, by use of curve numbers (CNs), lumping all abstractions and losses into that single parameter for given basin and storm types. The Rational Method also represents overall losses through a single runoff coefficient, C, that relates a maximum runoff to the net precipitation rate for a given storm, again based predominantly on landcover characteristics. Selection of an appropriate response factor in both these methods requires that the designer reliably compare and select a known basin having similar characteristics to the design basin.
7.1.1 Infiltration and Depression Storage
If a physically-based, conceptual loss method is used to model post-development runoff, infiltration and depression storage parameters shall be approved by the MOA. Currently, the parameters listed in Table 7-1 are established as norms by the MOA.
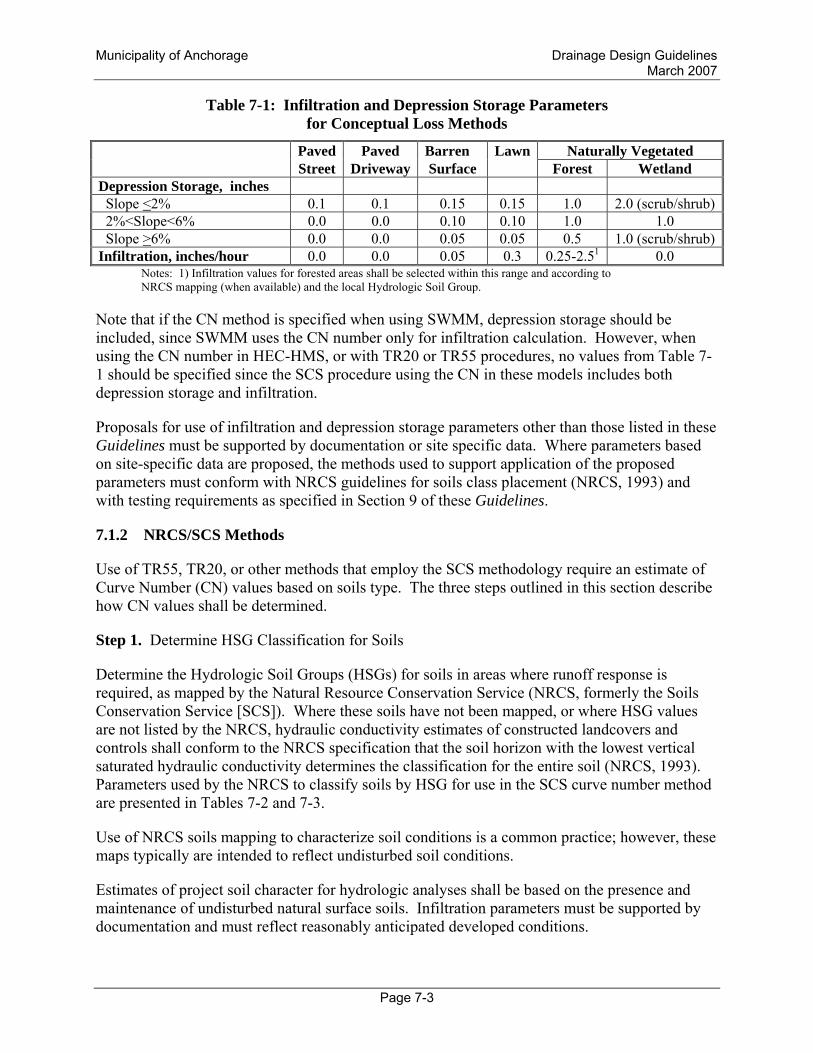
Municipality of Anchorage Drainage Design Guidelines March 2007
Page 7-3
Table 7-1: Infiltration and Depression Storage Parameters for Conceptual Loss Methods
Paved Paved Barren Lawn Naturally Vegetated Street Driveway Surface Forest Wetland Depression Storage, inches Slope <2% 0.1 0.1 0.15 0.15 1.0 2.0 (scrub/shrub) 2%<Slope<6% 0.0 0.0 0.10 0.10 1.0 1.0 Slope >6% 0.0 0.0 0.05 0.05 0.5 1.0 (scrub/shrub)Infiltration, inches/hour 0.0 0.0 0.05 0.3 0.25-2.51 0.0
Notes: 1) Infiltration values for forested areas shall be selected within this range and according to NRCS mapping (when available) and the local Hydrologic Soil Group.
Note that if the CN method is specified when using SWMM, depression storage should be included, since SWMM uses the CN number only for infiltration calculation. However, when using the CN number in HEC-HMS, or with TR20 or TR55 procedures, no values from Table 7-1 should be specified since the SCS procedure using the CN in these models includes both depression storage and infiltration.
Proposals for use of infiltration and depression storage parameters other than those listed in these Guidelines must be supported by documentation or site specific data. Where parameters based on site-specific data are proposed, the methods used to support application of the proposed parameters must conform with NRCS guidelines for soils class placement (NRCS, 1993) and with testing requirements as specified in Section 9 of these Guidelines.
7.1.2 NRCS/SCS Methods
Use of TR55, TR20, or other methods that employ the SCS methodology require an estimate of Curve Number (CN) values based on soils type. The three steps outlined in this section describe how CN values shall be determined.
Step 1. Determine HSG Classification for Soils
Determine the Hydrologic Soil Groups (HSGs) for soils in areas where runoff response is required, as mapped by the Natural Resource Conservation Service (NRCS, formerly the Soils Conservation Service [SCS]). Where these soils have not been mapped, or where HSG values are not listed by the NRCS, hydraulic conductivity estimates of constructed landcovers and controls shall conform to the NRCS specification that the soil horizon with the lowest vertical saturated hydraulic conductivity determines the classification for the entire soil (NRCS, 1993). Parameters used by the NRCS to classify soils by HSG for use in the SCS curve number method are presented in Tables 7-2 and 7-3.
Use of NRCS soils mapping to characterize soil conditions is a common practice; however, these maps typically are intended to reflect undisturbed soil conditions.
Estimates of project soil character for hydrologic analyses shall be based on the presence and maintenance of undisturbed natural surface soils. Infiltration parameters must be supported by documentation and must reflect reasonably anticipated developed conditions.

Municipality of Anchorage Drainage Design Guidelines March 2007
Page 7-4
Table 7-2: SCS Criteria for Hydrologic Soil Groups
Hydrologic Soil Group Criteria A Saturated hydraulic conductivity is very high or in the upper half of high and
internal free water occurrence is very deep B Saturated hydraulic conductivity is in the lower half of high or in the upper
half of moderately high and free water occurrence is deep or very deep. C Saturated hydraulic conductivity is in the lower half of moderately high or in
the upper half of moderately low and internal free water occurrence is deeper than shallow.
D Saturated hydraulic conductivity is below the upper half of moderately low, and / or internal free water occurrence is shallow or very shallow and transitory through permanent.
Note: The table has been adapted from NRCS (1993). The criteria are guidelines only. They are based on the assumption that the minimum saturated hydraulic conductivity occurs within the uppermost 1.6 feet. If the minimum occurs between 1.6 to 3.3 feet, then saturated hydraulic conductivity for the purpose of placement is increased one class. If the minimum occurs below 3.3 feet, then the value for the soil is based on values above 3 feet using the rules as previously given.
Table 7-3: Saturated Hydraulic Conductivity for SCS Soils
Class Ksat (µm/s)
Ksat (inches/hour)
Very High >100 >14.17 High 10 – 100 1.417 – 14.17 Moderately High 1 – 10 0.1417 – 1.417 Moderately Low 0.1 – 1 0.01417 – 0.1417 Low 0.01 – 0.1 0.001417 - 0.01417 Very Low <0.01 <0.001417
From: NRCS, 1993
Step 2. Choosing Appropriate CN values
In order to promote consistent results, the following protocols shall be applied to determine the CNs for individual landcover types.
Impervious Surfaces: Impervious surfaces include all exposed surfaces that either naturally shed water or are significantly treated to shed water.
• Paved and unpaved streets and road surfaces: For these surfaces, including service and access roads, use values for the appropriate category under “streets and roads” in Table 7-4. All recycled asphalt pavement (RAP)-covered or sealed roads shall be assessed as “paved” road surfaces for use of this table.

Municipality of Anchorage Drainage Design Guidelines March 2007
Page 7-5
Table 7-4: SCS Curve Numbers
HYDROLOGIC SOIL GROUP * LANDCOVER TYPE A B C D
CURVE NUMBER Impervious Surfaces Streets & Roads
Paved; curbs and storm sewers 98 98 98 98 Paved; open ditch including right-of-way 83 89 92 93 Gravel including right-of-way 76 85 89 91 Dirt, including right-of-way 72 82 87 89
Other Impervious Surfaces 98 98 98 98 Pervious Surfaces Barren --- 86 90 92 Lawn
Steep Slopes (S>6%) --- 79 86 89 Moderate Slopes (2%<S<6%) --- 69 79 84 Flat Slopes(S<2%) --- 61 74 80
Other Landscaped Surfaces --- Apply TR55 Table 2-2b, (NRCS, 1986)
Naturally Vegetated Surfaces Natural Forest
Poor condition (Forest litter, small trees, brush destroyed)
45 66 77 83
Fair (some forest litter) 36 60 73 79 Good (litter and brush adequately cover soil) 30 55 70 77
Natural Brush Poor condition (< 50% ground cover) 48 67 77 83 Fair condition (50% - 75% ground cover) 35 56 70 77 Good condition (> 75% ground cover) 30 48 65 73
Natural Grasslands 39 61 74 80 Wetlands
Forested --- --- 30 30 Scrub/Shrub --- --- 30 30 Aquatic Herbaceous --- --- 58 58
Where ground is seasonally saturated at 3 feet or less below ground surface, use C or D HSG class Curve Numbers --- indicates curve numbers for these Hydrologic Soil Groups are not applicable for MOA drainage studies. Values from: McCuen et al., 2002; NRCS, 1986, except for values fore wetlands and barren surfaces
• Other effectively impervious surfaces: For effectively impervious surfaces other than streets, either natural or constructed, including paved driveways, paved parking, paved tennis or other playing courts, paved patios, decks, all roofs, paved walkways and trails, and exposed low-permeability rock or mineral soil surfaces, use values for “paved parking lots, roofs, driveways, etc.” listed in Table 7-4.

Municipality of Anchorage Drainage Design Guidelines March 2007
Page 7-6
Pervious Surfaces:
Pervious surfaces include all surfaces that have significant short-term infiltration capacity and include both natural and constructed surfaces.
• Barren surfaces:
o For all constructed or natural surfaces that are generally free of vegetation but retain some pervious character including earthen staging or storage areas, new graded surfaces, natural fractured rock exposures (but excluding dirt and gravel road trafficking surfaces), use values for “roads, hard-surface” for the HSGs B, C, or D as tabulated in Table 7-4.
o CNs may be adjusted for designed pervious surfaces (e.g., pervious pavements, rain gardens, yard breaks, etc.) for which estimates of permeability have been made. Calculations to support adjustments to CNs should be performed using appropriate conceptual models and NRCS guidelines for classifying soils for infiltration (NRCS, 1993) and as specified for testing infiltration rates in Section 9 of these Guidelines.
• Lawn surfaces: For all regularly maintained residential, park, or other lawn and grassed surfaces, use values for “Urban Lawn” presented in Table 7-4, except that for soils classified HSG A, use values for HSG B.
• Other landscaped surfaces: For cultivated land surfaces where soils are not compacted, including agricultural applications, residential and commercial gardens, and non-lawn landscaping including shrubs and trees, use appropriate curve numbers from TR55 Table 2-2b (NRCS, 1986) applying an HSG one class less permeable (for HSGs A, B, and C) than the NRCS/SCS mapped undisturbed soil unit mapped for the site.
• Naturally vegetated surfaces:
o For undeveloped forested land, use Table 7-4 values for “Natural Forest” for the NRCS HSG mapped for the area. Note that this is the Naturally Vegetated Surfaces category.
o For land naturally vegetated in brush cover, use Table 7-4 values for “Natural Brush” for the NRCS Hydrologic Soil Group mapped for the area.
o For naturally vegetated grasslands, use Table 7-4 “good” values for “pasture” for the NRCS HSG mapped for the area. Note that this value is only appropriate for “ungrazed” and “unmown” grassland.
o For wetlands, use a CN of 30 for scrub/shrub or forested wetlands and 58 for aquatic herbaceous wetlands (wetlands with predominant fraction in open water or marshes). These features may also be weighted by fractional area to estimate a combined CN for large wetlands. Otherwise, wetlands runoff response may be estimated using methods described in WMS, November 2002b.

Municipality of Anchorage Drainage Design Guidelines March 2007
Page 7-7
Step 3 CN Adjustments
NRCS research indicates that compacted soils typically have infiltration rates greatly reduced from that of the natural soils they replace (OCSCD, 2001; Pitt et al., 2002).
Users of NRCS HSGs shall make appropriate adjustments when natural soils are disturbed or compacted and clearly indicate these adjustments to avoid rejection of values by MOA reviewers. Adjustments may be required based on the following:
• Where existing landcover is naturally vegetated and has not been disturbed, curve numbers shall reflect HSGs as mapped by the NRCS.
• Where natural vegetation has been cleared and grubbed, natural soil has been disturbed or compacted, or other constructed landscaping is anticipated, the HSG soil group used in the model shall be adjusted to reflect the next less permeable soil group to account for soil compaction or construction of new compacted surface soil layers.
• Where lawn-types of landscaping are anticipated, an HSG soil group of B, C or D shall be used in all runoff response modeling.
• Curve numbers shall be estimated for entire basins based on area-weighting of the curve numbers of the individual landcover types present.
7.1.3 Rational Method Runoff Coefficients
The Rational Method incorporates all losses into a factor called the runoff coefficient, C. Runoff coefficients shall be estimated for a basin by first estimating coefficients for all streets and for all other landcover types separately, and then preparing an area-weighted composite coefficient for the whole basin (McCuen et al., 2002). Runoff coefficients for landcover currently adopted by PM&E are shown in Table 7-5.
Composite runoff coefficients are often tabulated in the literature for basins with unique distributions and percentages of landcover types. Published composite runoff numbers shall only be used where the analyst demonstrates to the satisfaction of PM&E that the landcover conditions of the reference composite basin are reasonably similar (+2% for impervious surfaces and +5% for other landcover types) to those of the design basin. For runoff coefficients used in the Rational Method, urban composite classifications will be interpreted to have the same landcover percentages as for similar composites specified in published curve number tables. Where designers propose use of tables where an unspecified range of C values is assigned a single landcover or composite landcover condition, the lower end of the range will be applied to flatter sloping surfaces (<2%) and the upper end to steeper sloping surfaces (>6%). HSGs applied in estimating runoff coefficients shall first be adjusted for different landcover conditions in the same fashion as for curve numbers.
Street landcover types shall be assigned runoff coefficients separately from other landcover types, and the runoff coefficient for the entire basin estimated by area weighting of these values.

Municipality of Anchorage Drainage Design Guidelines March 2007
Page 7-8
Table 7-5: Rational Equation Runoff Coefficients
HYDROLOGIC SOILS GROUP A Soil B Soil C Soil D Soil Slope 0-
2% 2-
6% +6% 0-
2% 2-
6% +6% 0-
2% 2-
6% +6% 0-
2% 2-
6% +6%
Landcover Forest, brush
a* 0.05 0.08 0.11 0.08 0.11 0.14 0.10 0.13 0.16 0.12 0.16 0.20
b* 0.08 0.11 0.14 0.10 0.14 0.18 0.12 0.16 0.20 0.15 0.20 0.25 Wetland a 0.12 0.16 0.20 0.12 0.16 0.20 Parkland a 0.05 0.10 0.14 0.08 0.13 0.19 0.12 0.17 0.24 0.16 0.21 0.28 b 0.11 0.16 0.20 0.14 0.19 0.26 0.18 0.23 0.32 0.22 0.27 0.39 Cultivated a 0.08 0.13 0.16 0.11 0.15 0.21 0.14 0.19 0.26 0.18 0.23 0.31 b 0.08 0.14 0.22 0.16 0.21 0.28 0.20 0.25 0.34 0.24 0.29 0.41 Pasture a 0.12 0.20 0.30 0.18 0.28 0.37 0.24 0.34 0.44 0.30 0.40 0.50 b 0.15 0.25 0.37 0.23 0.34 0.45 0.30 0.42 0.52 0.37 0.50 0.62 Lawn a 0.17 0.22 0.35 0.17 0.22 0.35 0.17 0.22 0.35 0.17 0.22 0.35 Barren a 0.25 0.30 0.35 0.25 0.30 0.35 0.50 0.55 0.60 0.50 0.55 0.60 Graded slope
Gravel a 0.25 0.30 0.35 0.25 0.30 0.35 0.50 0.55 0.60 0.50 0.55 0.60 Earthen a 0.60 0.60 0.60 0.60 0.60 0.60 0.60 0.60 0.60 0.60 0.60 0.60
Drives, walks
a 0.75 0.80 0.85 0.75 0.80 0.85 0.75 0.80 0.85 0.75 0.80 0.85
Streets
Gravel a 0.50 0.55 0.60 0.50 0.55 0.60 0.50 0.55 0.60 0.50 0.55 0.60 Paved a 0.85 0.86 0.87 0.85 0.86 0.87 0.85 0.86 0.87 0.85 0.86 0.87
b 0.95 0.96 0.97 0.95 0.96 0.97 0.95 0.96 0.97 0.95 0.96 0.97 Impervious a 0.85 0.86 0.87 0.85 0.86 0.87 0.85 0.86 0.87 0.85 0.86 0.87 b 0.95 0.96 0.97 0.95 0.96 0.97 0.95 0.96 0.97 0.95 0.96 0.97
* - a, <25-year, 24-hour event; b, >25-year, 24-hour event Modified from: Rawls et al., 1981; WaDOT, March 2005.

Municipality of Anchorage Drainage Design Guidelines March 2007
Page 7-9
7.1.4 Adjusting for Drainage Connectivity
Where impervious surfaces are not mapped in detail by type, all impervious surfaces shall be assumed to act as directly connected impervious surfaces. Designers may elect to adjust weighted SCS-method curve numbers to reflect drainage connectivity factors based on the fraction of core landcover elements directly connected and / or indirectly connected. For subbasins in which the total impervious area does not exceed 30%, the following calculation may be used to adjust the composite CN:
CNc=CNp+(Pi/100)(98-CNp)(1-0.5R) (McCuen et al., 2002)
Where:
CNc = composited CN adjusted for indirectly connected impervious surfaces
CNp= composited CN for the pervious fraction of the basin
Pi= percent imperviousness (for Pi<30%)
R= ratio of unconnected impervious area to the Total Impervious area. Use values from Table 7-6 to compute this factor.
For basins with impervious area exceeding 30% of the total basin, separate calculations for indirectly connected landcover shall be performed to estimate losses resulting from cascading runoff from these surfaces across infiltrating surfaces.
Table 7-6: Adjustment Factors for Indirectly Connected Impervious Surfaces
Land Connected Impervious Cover Type of Development Indirectly Directly LID Design roofs, parking, driveways, and other paved surfaces 100% 0% Paved (impervious) streets
drained in whole or in part by curb and gutter and/or piped drainage 0% 100%
drained solely by ditches constructed in HSG soil types C or D or in soil types A or B at slopes greater than 6% 75% 25%
drained solely by ditches constructed in HSG soil types A or B at slopes less than 6% 100% 0%
Driveways and Parking served by pipe drainage 0% 100% served by ditches 50% 50% Roofs commercial 0% 100% residential served by pipe drainage 50% 50% residential in areas served by ditches 75% 25% "Other" impervious surfaces commercial "other" surfaces 0% 100% residential "other" surfaces served by ditches 75% 25% residential "other" surfaces served by pipe drainage 50% 50%

Municipality of Anchorage Drainage Design Guidelines March 2007
Page 7-10
7.2 Times of Concentration
Time of concentration, Tc, is a critical parameter in many runoff response methods, including the Rational Equation and most SCS curve number methods. Time of concentration is generally defined as the longest runoff travel time for contributing flow to reach the outlet or design point, or other point of interest. It is frequently, but not necessarily correctly, calculated along the longest flow path physically. Because differences in roughness and slope may lead to shorter paths yielding longer flow times, analysts shall demonstrate that they have reasonably considered alternative paths to select for the critical controlling condition. Similarly, types and distribution of landcover play a primary role in estimating appropriate times of concentration.
A reasonably representative estimate of this value is critical to consistent and accurate calculation of runoff rates and volumes using these methods. Estimating the time of concentration involves identification of an appropriate flow path or paths and estimating runoff travel times along the flow paths.
Where post-development conditions include significant pervious surfaces, the time of concentration for just impervious portions of the basin (based on a “short” flow path—and the associated reduced runoff area) may be required to calculate and compare peak flow response for the basin as a whole against that of the more rapidly-draining impervious surfaces alone. Flows generated only by the impervious landcover areas within a basin (i.e., without considering contributions from pervious surfaces) may in fact control peaks even though the impervious surfaces may represent only a fraction of the basin. This is because of the high runoff rates and very short times of concentration that can be produced by impervious surfaces alone (Bedient and Huber, 2002; McCuen et al., 2002; Urbonas and Roesner in Maidment, 1993).
The estimation process for time of concentration includes for each basin or subbasin is as follows:
1. Identify and map the longest flow path for the basin. For basins or subbasins that do, or under post-development conditions will, have 30% or more vegetated land surfaces, identify and map and segment an impervious surfaces “short” flow path, in which upgradient pervious surfaces are not included in the overall time of concentration estimation.
2. Segmentation of the representative longest (and as necessary the “short”) flow paths to appropriately reflect the presence of:
a. Upgradient overland sheet flow processes;
b. Middle segment shallow concentrated flow processes; and
c. Downgradient channel and pipe flow processes.
Where necessary to reflect changes in conveyance character (slope, roughness, geometry), each of these parts shall be further segmented and the associated flow parameters tabulated.
3. Characterize of the basic hydraulic qualities of the segmented flow paths including as appropriate:

Municipality of Anchorage Drainage Design Guidelines March 2007
Page 7-11
a. Length;
b. Slope along the line of flow;
c. Landcover surface type, or channel or pipe lining material, and associated roughness factors in appropriate terms for the flow process that will occur along the segment;
d. Channel or pipe geometry; and
e. Significant head loss factors, including losses due to inlets, contractions, and bends on longer conduit segments.
4. Calculate flow travel times for each segment along the longest (and as necessary the “short”) flow paths as based on the active flow process (overland sheet flow, shallow concentrated flow, and channel flow).
5. Sum the travel times along all segments to provide an estimate of the overall time of concentration along the longest (and as necessary the “short”) flow paths for the basin or subbasin.
The time of concentration must be five minutes or longer. In instances where times of concentration are estimated to be shorter than five minutes, a Tc of five minutes shall be applied.
Where naturally vegetated landcover types exceed 20%, or total landscape landcover types exceed 30% of either the total basin area or of individual lots, time of concentration and peak flows based on contributions from impervious surfaces alone shall be calculated separately and compared to peaks estimated for landcover and times of concentration, averaged for the whole basin, to see which Tc condition controls.
The following sections describe calculation of travel times for each of the three flow processes.
7.2.1 Overland and Sheet Flow
Overland flow occurring as non-integrated sheet flow across vegetated surfaces becomes concentrated into shallow flow in rills and small channels typically over distances of about 150 feet, and only rarely exceeding 300 feet (Merkel, 2001; NRCS, 2002). Overland flow lengths must be 150 feet or less.
PM&E uses the Kinematic Wave method as a normative means to calculate overland sheet flow travel times. There are a variety of programs available to apply the Kinematic Wave method (SWMM, HEC-HMS, etc.). A commonly used equation to calculate travel time for overland flow is Manning’s simplified solution of the kinematic wave equation, presented below.

Municipality of Anchorage Drainage Design Guidelines March 2007
Page 7-12
Tt=[0.007(NL)0.8]/[(P2)0.5(S)0.4] (McCuen, et al., 2002; NRCS, 1986)
Where:
Tt = travel time, hour
N = roughness coefficient for overland and sheet flow (see Table 7-7)
L = sheet flow length (<150 feet)
P2 = 2-year, 24-hour adjusted rainfall volume, inches (see Table 6-2)
S = slope of hydraulic grade line (land slope), feet/foot
Note: P2, 2-year, 24-hour rainfall volume, must be adjusted for orographic effects. It has been calibrated as a parameter for this equation for general use. That is, it is not necessary to use a different recurrent interval precipitation depth when using this equation for different recurrent interval runoff estimates.
Table 7-7: Roughness Coefficient for Overland and Sheet Flow
N Value Surface Description Constructed Surfaces
0.011 Smooth asphalt 0.012 Smooth concrete 0.013 Concrete lining 0.014 Good wood, brick with cement mortar 0.015 Vitrified clay, cast iron 0.024 Corrugated metal pipe, cement rubble surface
Cultivated Soils 0.050 Fallow (no residue) 0.060 Residue cover < 20% 0.170 Residue cover > 20% 0.130 Range (natural)
Grass Surfaces 0.150 Short grass prairie 0.240 Dense grasses (lawns) 0.410 Bermuda grass
Woods and Stem Vegetation* 0.400 Light underbrush 0.800 Dense underbrush
*For woody stems, consider cover to height of 30 mm (0.1 ft) only From: McCuen, et al., 2002
7.2.2 Shallow Concentrated Flow
Shallow concentrated flow occurs in rills, small gullies, and headwater gutters, and typically ranges from 1 to 4 inches in depth (McCuen, et al., 2002). Travel time depends primarily upon slope and surface roughness. Methods (calculators, nomographs) used to calculate shallow concentrated flow times must demonstrate use of the algorithm and parameters described below.

Municipality of Anchorage Drainage Design Guidelines March 2007
Page 7-13
V = 33kS0.5 (McCuen, et al., 2002)
Where:
V = velocity, feet/second
k = intercept coefficient, dimensionless (see Table 7-8)
S = slope, feet/feet
Tt = L / V / 3600
Where:
Tt = travel time, hours
V = velocity, feet/second
L = length, feet
Note that TR55 only offers the choice of Unpaved Surface and Paved Surface and this can underestimate the travel time for vegetated surfaces.
Table 7-8: “k” Value for Shallow Concentrated Flow
K value Landcover 0.076 Forest with heavy ground litter; hay meadow 0.152 Trash fallow or minimum tillage cultivation; woodland 0.213 Short grass pasture 0.274 Cultivated straight row 0.305 Nearly barren soil 0.457 Grassed waterway 0.491 Unpaved surface 0.619 Paved surface
From: McCuen, et al., 2002
7.2.3 Channel Flow
Channel flow occurs in channels carrying integrated flows, pipes (flowing partially full), and streams. Where storage is not significant, travel times can be estimated by applying Manning’s Equation, and using estimates of channel characteristics and appropriate roughness values for pipe, channel, or stream features as tabulated in Table 7-9.
V = [1.49/n][R2/3][S1/2] (Chow, 1959)
Where:
V = velocity, feet/second
n = Manning’s roughness coefficient for channel flow
S = slope, feet/foot
R = hydraulic radius, feet
Tt = L / V / 3600

Municipality of Anchorage Drainage Design Guidelines March 2007
Page 7-14
Where:
Tt = travel time, hours
V = velocity, feet/second
L = length, feet
Table 7-9: Manning’s “N” Values for Channel Flow
Conduit Material Manning’s “n” Closed conduits
Asbestos-cement pipe 0.011-0.015 Brick 0.013-0.017 Cast iron pipe Cement-lined & seal coated 0.011-0.015 Concrete pipe 0.011-0.015 Helically corrugated metal pipe (12” - 48”) 0.013-0.023 Corrugated metal pipe Plain annular 0.022-0.027 Plain helical 0.011-0.023 Paved invert 0.018-0.022 Spun asphalt lined 0.011-0.015 Spiral metal pipe (smooth) 0.012-0.015 Plastic pipe (corrugated) 3- 8 in. diameter 0.014-0.016 10- 12 in. diameter 0.016-0.018 Larger than 12 in. diameter 0.019-0.021 Plastic pipe (smooth interior) 0.010-0.015 Vitrified clay Pipes 0.011-0.015 Liner plates 0.013-0.017
Open Channels Lined channels a. Asphalt 0.013-0.017 b. Brick 0.012-0.018 c. Concrete 0.011-0.020 d. Rubble or riprap 0.020-0.035 e. Vegetation 0.030-0.40 Excavated or dredged Earth, straight and uniform 0.020-0.030 Earth, winding, fairly uniform 0.025-0.040 Rock 0.030-0.045 Unmaintained 0.050-0.14 Natural stream channels Fairly regular section 0.03-0.07 Irregular section with pools 0.04-0.10 Source: ASCE, 2005. Standard Guidelines for the Design of Urban Storm Sewer Systems

Municipality of Anchorage Drainage Design Guidelines March 2007
Page 7-15
7.3 Lag and Computation Times
7.3.1 Lag Time
Lag time is a common parameter used in establishing timing of peak flows and in developing hydrographs. Lag time, Lt, is defined as the time from the centroid of the excess precipitation of a storm event to the hydrograph peak (point of peak flow). Lag time can be calibrated for a specific basin but often this approach is not feasible. Approaches to estimating lag time often depend upon the runoff analysis method. Some methods (e.g., Snyder Unit Hydrograph), require significant runoff response information about the basin under study and, therefore, typically require calibration to the specific basin in order to obtain lag time. For application to the SCS synthetic unit hydrograph, lag time is typically, and more simply, defined as follows:
Lt = 0.6Tc (Feldman, 2000)
Where:
Lt = lag time
Tc = time of concentration
Alternatively, lag time for the SCS Method can be estimated as:
Lt = [ℓ0.8(S+1)0.7]/[1900y0.5] (Bedient and Huber, 2002)
Where:
Lt= lag time, hours
ℓ = length to basin divide, feet
y= average watershed slope, %
S= (1000/CN)-10, inches maximum possible retention
CN= weighted SCS curve number for basin
7.3.2 Computation Time Interval and Hyetograph Time Step
The selected calculation time interval for the analyses must also be appropriate to the method. For application of any SCS unit hydrograph technique, the computational time interval, or change in time (∆t), must be less than 0.29Lt (lag time) in order to adequately define the rising limb (Feldman, 2000). Other sources, for other methodologies, indicate that the computation time interval should be between 0.2Tc and o.33Tc. Where models require a rainfall distribution over time, or a hyetograph time step, the calculation time interval and hyetograph time step should be consistent (Haestad Methods and Durrans, 2003).

Municipality of Anchorage Drainage Design Guidelines March 2007
Page 7-16
7.4 Estimating Runoff Flows
Estimates of runoff for drainage design purposes are typically required either at a maximum flow rate (peak flow) or as a time series of flow rates for the entire runoff event (in the form of a hydrograph).
Generally only simple techniques, such as the Rational Method, are required to estimate peak flows. The Rational Method may be used to estimate peak flows. Application of the Rational Method to generate runoff hydrographs shall only be permitted for small or highly urbanized basins where Tc<15minutes
Where any peak flows need to be controlled or routed downstream (joined with contributing flows from other basins), detailed runoff hydrographs will have to be developed as well. Hydrographs are also required to design detention controls. To generate a hydrograph, excess precipitation must be transformed into a temporal pattern of surface flow. Excess precipitation can be transformed into a hydrograph using:
• A local unit hydrograph developed from basin-specific climate and runoff data;
• For basins with short times of concentration (<15 minutes), a triangular hydrograph method using peaks estimated from the SCS graphical triangular hydrograph method or Rational Method;
• The empirical SCS dimensionless unit hydrograph method (such as the SCS Unit Hydrograph Method described in the HEC-HMS program or the WinTR20 or WinTR55 programs); or
• A model based on the conceptual Kinematic Wave approach (such as that used in SWMM or available in the HEC-HMS program).
• A time-area unit hydrograph method (similar to the ILLUDAS program or the Tabular Hydrograph Method in the TR55 program) that relates travel times and contributing areas;
Methods used to generate hydrographs must be identified. Where a local unit hydrograph is applied, base data from multiple storm water runoff events ranging in size appropriate to the design application and used to develop the unit hydrograph must be submitted. Otherwise, where methods different than those generally described above are used, a detailed description of the approach must be submitted and approved.
To support this method-based approach to documenting hydrologic analyses within the MOA, brief descriptions of methods generally approved for use in drainage analyses are summarized below. Computer programs incorporating these methods and widely supported in the public domain as well as by private software companies and generally approved for use in MOA drainage analyses are listed in Section 7.5.

Municipality of Anchorage Drainage Design Guidelines March 2007
Page 7-17
7.4.1 Rational Method for Peak Flow
The Rational Method is commonly used to calculate peak flows. It is a relatively simple method that assumes peak discharge occurs when the entire basin is contributing runoff from a storm with a duration equal to the basin time of concentration, Tc. The basic Rational Method formula is:
Q = CiA
Where:
Q = peak flow, cfs
C = runoff coefficient, dimensionless
A = drainage area, acres
i = rainfall intensity for specified storm frequency and duration, inches/hour
Application of the Rational Method must conform to the following guidelines:
• Runoff coefficients are based on mapping and analysis of area-weighted landcover, and apply standard methods and parameters to identify runoff characteristics as described in these Guidelines.
• Rainfall for the design storm event does not vary across the basin by more than 20%.
• Rainfall intensity is calculated using the equations presented with the IDF curves included in Section 6 with a duration equal to the basin time of concentration.
• The total contributing area to the point of interest (design point) is not greater than 200 acres.
The Rational Method was developed for estimating peak flow rates. Some approaches apply triangular hydrograph methods to generate hydrographs using the Rational Hydrograph Method. However, these hydrograph methods may not be sufficient for the purposes of detailed routing or detention design (McCuen et al., 2002; NRCS, 1986).
7.4.2 Unit Hydrograph Method
A relatively common method to develop runoff hydrographs is with unit hydrographs. Unit hydrograph techniques assume that a basin has a common runoff response to all storms with a common duration. The method assumes that peaks and volumes are directly proportional to the size of the storm, but runoff hydrographs for all storms, large and small, will have the same relative shape and timing as long as they have the same duration. To practically apply this assumption, a hydrograph is established for a particular duration storm that results in a direct runoff volume of 1 inch—or a unit hydrograph. Different methods have been developed that allow manipulation of this unit runoff event to characterize basin runoff response for storms of other durations and volumes.
One of the most commonly applied of these unit hydrograph methods is that developed by the SCS. The formulations used in the SCS Method are based on empirical analyses of a wide range

Municipality of Anchorage Drainage Design Guidelines March 2007
Page 7-18
of basin-specific runoff response data (Kent, 1973; McCuen et al., 2002; Suphunvorranop, 1985; Woodward, et al., c2000). SCS used these analyses to establish rainfall-runoff relationships between direct runoff, rainfall volume, initial abstraction, and retention using landcover qualities expressed as SCS-defined CNs. SCS performed additional analyses to establish an SCS synthetic unit hydrograph that fit a theoretical average basin condition and, therefore, could be extrapolated to any ungaged basin (McCuen et al., 2002).
Many peak flow estimation and hydrograph development approaches are derived from the basic SCS Method. Current NRCS models, including WinTR55 and WinTR20 (NRCS, 2002), apply these relationships. Methods used in these models are based on SCS triangular or curvilinear synthetic unit hydrograph techniques and are suitable for most peak estimating applications as well as for many routing analyses and detention design. The SCS Graphical Peak Discharge and Tabular Hydrograph Methods used in the original TR55 program are less precise.
Acceptable application of SCS or other unit hydrograph methodologies for peak estimation for MOA drainage analysis assumes use of standard methods and parameters as described in these Guidelines. All hydrograph development must reflect specific limitations of the methods and models used. Use of SCS and most other unit hydrograph methodologies will typically require identification of appropriate curve numbers or other runoff response factors, soils, slopes, and times of concentration. Selection of these factors shall be based on mapping and area-weighted analyses of landcover, and shall apply standard methods and parameters as described in these Guidelines.
Hydrograph development may also require selection of one or more basin shape, slope, or location factors, which may require calibration to specific basins. Currently, PM&E accepts assumption of (McCuen et al., 2002), Kp, of 484 for application to standard SCS synthetic unit hydrograph analysis. Use of other peaking factors or of alternative methods requiring additional empirical coefficients (e.g., Snyder Unit Hydrograph) requires approval from PM&E.
7.4.3 Kinematic Wave Method (Using Conceptual Methods)
Kinematic Wave methods of estimating peaks are based on a conceptual model of runoff response. This method represents shallow flow across land surfaces using Kinematic Wave equations (Bedient and Huber, 2002; Feldman, March 2000), and routes the accumulated flows from these land surfaces along representative drainageway networks to create hydrographs. As a conceptual method (as opposed to empirical), the approach is robust because parameters necessary to build a model can be measured directly from the target basin. However, representation of runoff from real land surfaces using this type of model can be difficult. A good understanding of the model, runoff processes, and basin characteristics are necessary to set up a reasonably representative model.
There are a number of public-domain programs that offer Kinematic Wave-types of runoff modeling approaches, including the HEC-HMS and SWMM programs. These programs have a long development history, wide use, and are very well documented (Rossman, 2004; Feldman, 2000; Huber and Dickenson, 1992). The current version of the SWMM program is particularly useful as it has the capability of modeling the response of runoff flowing from an impervious surface onto a pervious surface (i.e., indirectly connected impervious surfaces). This
Municipality of Anchorage Drainage Design Guidelines March 2007
Page 7-19
functionality is more supportive of detailed analyses of the potential benefits on runoff of a low impact development (LID) design approach than empirical modeling methods.
Application of programs applying a Kinematic Wave method are acceptable for use in MOA peak flow analyses assuming model parameters are established as described in these Guidelines, and basins are reasonably represented within the constraints of the programs. However, careful attention must be paid to how the programs represent runoff surfaces and drainage networks if the runoff response of a real system is to be reasonably represented. Representational logic is particularly important in assessing the validity of these types of models. Therefore, concise sketches depicting how the real drainage system is intended to be represented by the elements used in the model along with a summary description of the logic used in building the specific model are required as submittals in all drainage analyses using conceptual models.
Kinematic Wave models may also be used for downstream impact routing (to the extent that no significant storage occurs along the downstream conveyance route). A more detailed description of the Kinematic Wave method, including equations and parameters, can be found in other sources (McCuen et.al., 2002).
7.4.4 Time-Area Method (Using Flow Travel Times)
Time-area hydrograph techniques are relatively simple methods used to estimate peaks based on flow travel times. This technique develops runoff hydrographs by sequentially accumulating flows from contributing fractions of the basin that have common travel times to the point of interest (Bedient and Huber, 2002; McCuen et al., 2002; Terstriep and Stall, 1974). The maximum cumulative flow generated at the basin outlet (design point) by this hydrograph development process is identified as the peak.
A number of models have been developed that use this technique, the best known being the ILLUDAS model, and the Clark and Modified Clark (ModClark) models. The Clark and ModClark models (available in the HEC-HMS suite of models) are currently not approved for use in estimating peak flows for MOA drainage analysis because these models require parameters that are not easily measured and, therefore, cannot be readily reviewed for reasonableness.
On the other hand, ILLUDAS (known as ILLUDRAIN outside the State of Illinois) has been commonly used in the MOA area for about 20 years. ILLUDAS was developed in the mid-1970’s to automate drainage analysis of highly urbanized Illinois basins. In the mid-1980’s, PM&E successfully calibrated the model to low sloping, highly urbanized basins in the Anchorage Bowl. However, model calibration to these basins required assumption of a relatively unrealistic “saturated” antecedent soil condition. In part, this calibration requirement may have been triggered by similarly unrealistically-high depression storage and initial infiltration rates enforced by the program. An additional weakness in broad application of the program is that it does not model flows from naturally vegetated surfaces. Model documentation even recommends exclusion of back and side yards because the typically resulting “..long flow path virtually removes such grassed areas from consideration during relatively short intense storms normally used for drainage design” (Terstriep and Stall, 1974).
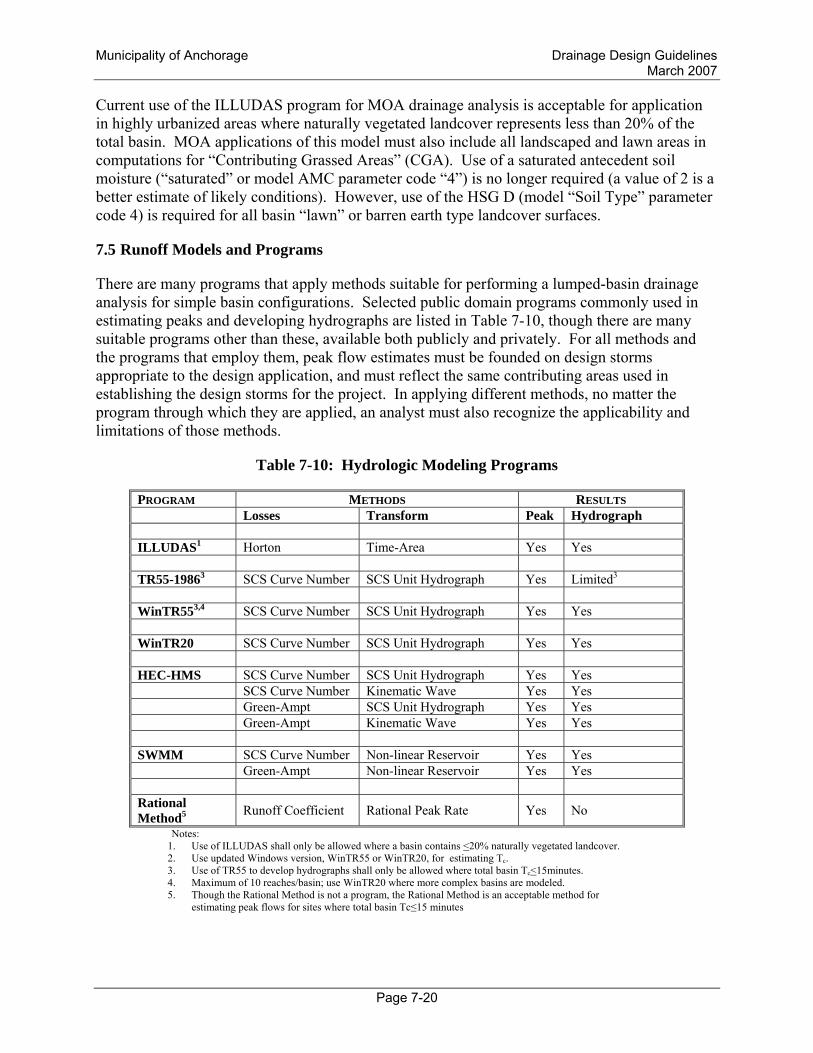
Municipality of Anchorage Drainage Design Guidelines March 2007
Page 7-20
Current use of the ILLUDAS program for MOA drainage analysis is acceptable for application in highly urbanized areas where naturally vegetated landcover represents less than 20% of the total basin. MOA applications of this model must also include all landscaped and lawn areas in computations for “Contributing Grassed Areas” (CGA). Use of a saturated antecedent soil moisture (“saturated” or model AMC parameter code “4”) is no longer required (a value of 2 is a better estimate of likely conditions). However, use of the HSG D (model “Soil Type” parameter code 4) is required for all basin “lawn” or barren earth type landcover surfaces.
7.5 Runoff Models and Programs
There are many programs that apply methods suitable for performing a lumped-basin drainage analysis for simple basin configurations. Selected public domain programs commonly used in estimating peaks and developing hydrographs are listed in Table 7-10, though there are many suitable programs other than these, available both publicly and privately. For all methods and the programs that employ them, peak flow estimates must be founded on design storms appropriate to the design application, and must reflect the same contributing areas used in establishing the design storms for the project. In applying different methods, no matter the program through which they are applied, an analyst must also recognize the applicability and limitations of those methods.
Table 7-10: Hydrologic Modeling Programs
PROGRAM METHODS RESULTS Losses Transform Peak Hydrograph ILLUDAS1 Horton Time-Area Yes Yes TR55-19863 SCS Curve Number SCS Unit Hydrograph Yes Limited3
WinTR553,4 SCS Curve Number SCS Unit Hydrograph Yes Yes WinTR20 SCS Curve Number SCS Unit Hydrograph Yes Yes HEC-HMS SCS Curve Number SCS Unit Hydrograph Yes Yes SCS Curve Number Kinematic Wave Yes Yes Green-Ampt SCS Unit Hydrograph Yes Yes Green-Ampt Kinematic Wave Yes Yes SWMM SCS Curve Number Non-linear Reservoir Yes Yes Green-Ampt Non-linear Reservoir Yes Yes Rational Method5 Runoff Coefficient Rational Peak Rate Yes No
Notes: 1. Use of ILLUDAS shall only be allowed where a basin contains <20% naturally vegetated landcover. 2. Use updated Windows version, WinTR55 or WinTR20, for estimating Tc. 3. Use of TR55 to develop hydrographs shall only be allowed where total basin Tc<15minutes. 4. Maximum of 10 reaches/basin; use WinTR20 where more complex basins are modeled. 5. Though the Rational Method is not a program, the Rational Method is an acceptable method for
estimating peak flows for sites where total basin Tc≤15 minutes

Municipality of Anchorage Drainage Design Guidelines March 2007
Page 7-21
Note that some of the programs listed in Table 7-10 have only limited capability for estimating hydrographs. The time-area model ILLUDAS may not be suitable for resolving hydrographs where the modeled basin has a high percentage of pervious surfaces. The Tabular Hydrograph Method available in TR55 (NRCS, 1986) may not be appropriate for analyses of larger project areas or projects with significantly different shaped or sized basins (NRCS, 1986). Similarly, because the Rational Method is based on an assumption of highly uniform conditions and determines only a single point on the hydrograph (the peak), it (and the programs employing it as a primary method) is not well suited for resolving hydrographs for larger or more complex basins (McCuen et al., 2002). Therefore, use of simple triangular hydrograph generation techniques applying the Rational Method (McCuen et al., 2002) or the SCS Tabular Hydrograph Method shall only be allowed where the basin time of concentration, Tc, is less than or equal to 15 minutes.
Designers must demonstrate that selected models and the parameters used by them are appropriate to the basin and analysis. Designers shall explicitly specify the methods used in their analyses. Note that naming the computer software that is applied to a problem is not the same as specifying a method. Often computer programs offer a selection of methods and can apply a wide variation in algorithms to estimate model parameters. Therefore, where software programs are used, in addition to naming the program itself, the method and basic algorithms used in the model shall be identified, specifying at minimum the analytical methods used for:
• Estimating losses and excess precipitation;
• Transforming excess precipitation to runoff, including methods used to estimate peaks and to compile runoff hydrographs; and
• Methods used to route and combine hydrographs.
Reports of software-generated peak estimates or hydrographs must also include a tabulation of basin characteristics and all parameters used in the model as well as other supporting documentation. Where analyses are not computer-aided, methods used to perform peak flow and all supporting calculations must be submitted with the actual peak flow estimate. Where simple triangular or graphical methods are used to develop runoff hydrographs, designers must identify the method and provide the tabulated calculations.
For analysis of simple drainage basins, standard parameter values identified throughout these Guidelines shall be generally applied. Values differing significantly from these must be justified and approved by PM&E. The designer remains responsible for selecting, correctly applying, and defending application of specific methods and parameters as appropriate to the conditions of his or her particular purpose, whether they are based on these Guidelines or an alternative.

Municipality of Anchorage Drainage Design Guidelines March 2007
Page 7-22

Municipality of Anchorage Drainage Design Guidelines March 2007
Page 8-1
8 ROUTING STORM WATER RUNOFF
PM&E design criteria for drainage require that post-development storm water runoff peaks (and occasionally volumes) be controlled. Routing analyses are required on some projects for the design of conveyance and detention structures, to protect water quality, and to protect against downstream flooding. Routing analyses are also required on some projects in order to evaluate downstream impacts using a 10% point analysis, termed the 10% Method. (A description of the 10% Method is provided in Appendix G.) For relatively complex projects, there may be other design requirements that require routing.
In this guidance, only two basic classes of routing analyses are discussed: open channel routing and detention routing. In order to meet the requirements of the Extended Detention design, the application of detention routing is required. In order to meet the requirements of flood hazard protection and downstream impact analysis design requirements, the application of open channel routing is required. In many cases, a proposed development may contain both open channel design features such as ditches and storm drains, as well as detention features such as wetlands and detention ponds. Additionally, in many cases the downstream conveyance to the 10% point may contain detention features such as undersized culverts, wetlands, or detention ponds. In these cases, a combination of both open channel routing and detention routing are required.
The following sections summarize approved PM&E methods and procedures for use when performing routing analyses.
8.1 Routing Analysis Applications and Tools
Table 8-1 presents a number of public domain hydrologic computer programs that can be used to perform routing analyses and each program’s corresponding methods.
Table 8-1: Public Domain Hydrologic Routing Programs
Program Methods Application HEC-HMS Kinematic Wave Slopes >0.0004 ft/ft, no channel storage present Modified Puls Backwater, reservoir/detention design1
WinTR202 Storage Indication3 Backwater, reservoir/detention design WinTR554 Storage Indication3 Backwater, reservoir/detention design5 SWMM Kinematic Wave Slopes >0.0004 ft/ft, no channel storage present Modified Puls Backwater, reservoir/detention design Full Dynamic Wave Momentum and pressure effects present6
ILLUDAS Linear Approximation of the Continuity Equation Slopes >0.0004 ft/ft, no channel storage present
1. Use of Modified Puls for reservoir routing requires a known control section with minimal tailwater at the outlet point. 2. WinTR55 uses a limited WinTR20 hydrograph engine; use WinTR20 to model more complex networks. 3. The Modified Puls Method is referred to in the documentation for these programs as the Storage Indication Method. 4. WinTR55 models all conveyances as open channel; pipe flow must be simulated by an appropriate channel shape. 5. WinTR55 is limited to a 2-point stage-storage curve; use WinTR20 for detailed rating curves and multi-stage detention design. 6. Full dynamic wave analysis is required when surcharge or significant momentum or velocity changes are expected.

Municipality of Anchorage Drainage Design Guidelines March 2007
Page 8-2
When computer programs are used that are capable of performing routing using both the full Saint-Venant equations and Kinematic Wave routing algorithms, the Kinematic Wave routing algorithm should not be used when the following relationships are true (Feldmen et al., 2002; Ponce, 1986):
S ≥ 0.0004 ft/ft, and
302
1
≥⎟⎠⎞
⎜⎝⎛
dgST
Where:
S= channel slope (ft/ft),
T= hydrograph duration (sec),
g= 32.2 ft/sec2, and
d= flow depth (ft)
The values used above should represent average flow conditions of the inflow hydrographs at the location of concern (Feldman, 2000). If these conditions are not met, a routing method that solves the full Saint-Venant equations (such as Full Dynamic Wave in SWMM) should be used.
8.2 10% Method Routing Analyses
As shown in Figure 2-1, complex Small Projects and all Large Projects will require routing analyses using the 10% Method in order to evaluate downstream impacts. The purpose of performing routing analyses with the 10% Method is to define the requirements for onsite (and in the case of channel protection, possibly offsite) storm water controls necessary to:
1. Assure that peaks generated during the adjusted 10-year, 24-hour storm, under post-development conditions, are controlled to match pre-development peaks at the project discharge point;
2. Assure that peaks generated during the adjusted 10-year, 24-hour storm, under post-development conditions, are controlled (using control at the project discharge point) to match pre-development peaks at downstream critical points considering inflows from basins along the 10% conveyance route;
3. Assure that the hydrographs generated during the adjusted 10-year, 24-hour storm, under post-development conditions, are controlled to protect against prolonged flooding and channel scour at downstream critical points; and
4. Assure sufficient bypass capacity for flows generated during the adjusted 100-year, 24-hour storm, under post-development conditions, at downstream critical points considering inflows from basins along the 10% conveyance route.

Municipality of Anchorage Drainage Design Guidelines March 2007
Page 8-3
Where routing analyses for the adjusted 10-year, 24-hour storm show new flooding and or channel scour along the 10% conveyance route resulting from post-development project flows, designers must implement detention controls at the project discharge point sufficient to achieve compliance. When routing analyses for the adjusted 100-year, 24-hour storm show insufficient bypass capacity resulting in flooding due to changes in post-development flows, designers must design detention controls at the project discharge point sufficient to achieve compliance.
8.2.1 Considerations for Storage
The complexity of a 10% Method routing analysis is dependant on the presence or absence of storage along the 10% conveyance route. Storage along the 10% conveyance route can exist in many forms. Examples include backwater along low-sloping reaches behind undersized culverts, reservoir storage in wetlands or other depressed basins along the conveyance route, and constructed detention facilities. At a minimum, these types of storage must be considered when present along the 10% conveyance route. Although it is understood that the widening and narrowing of stream banks can sometimes result in storage effects, analysts may elect to ignore such features as insignificant during a 10% Method routing analysis. Error introduced by such decisions is generally acceptable because performance is based on relative change in conveyance function and not necessarily on absolute performance.
Where no significant storage exists along the 10% conveyance route (i.e., features such as wetlands or detention facilities), a straightforward routing condition exists and relatively simple routing tools and methods can be applied.
Where significant storage exists along the 10% conveyance, more complex routing is required and routing tools must be selected that will model the effects of local storage. Factors to note:
• Simple tools and methods remain applicable for all non-storage reaches even in basins where storage exists locally.
• Because it is anticipated that typically very simple spatially-lumped models will be used to generate hydrographs for downstream and upstream contributing basins, storage effects within these basins may be accounted for with simple methodologies and will usually not require use of routing techniques.
• Although some field inspection of downstream conditions is always required, basic mapping information and vicinity mapping useful in characterizing locations of existing drainage and contributing basins is available from the Municipality and other sources (see Appendix F).
8.2.2 Step-Wise Analysis
In the following section, the application of the 10% Method routing analysis is discussed for both storage and no storage conditions. Storage conditions should be assumed when there is at least one storage feature along the 10% conveyance route. These discussions are provided in order to supply the engineering community with an understanding of the process and the kinds of tools that can be used during a 10% Method routing analysis.
Step 1. Establishment of the 10% Point
Municipality of Anchorage Drainage Design Guidelines March 2007
Page 8-4
From the project discharge point, use either existing mapping (maintained by WMS) or a site visit to identify confluences along the downstream conveyance route. If relying on a site visit to identify confluences, it is advised that preliminary review of topographic and storm drain mapping be conducted in order to estimate the downstream extent of field work required to identify the 10% point. Next, using existing mapping of topography, storm drains, and open channel features (available from a number of agencies including PM&E and WMS, at http://munimaps.muni.org/internet/index.htm and presented in U.S. Geological Survey [USGS] topographic maps), make approximate delineations of each contributing basin downstream of the project area until the sum of the areas of the contributing basins is at least 9 times the project area, or a 4th order stream or tidewater is reached along the conveyance route.
Step 2. Collection of Data Necessary to Create Runoff Hydrographs From Contributing Basins
Prior to the collection of data, select the calculation method that will be used to define the runoff hydrograph from each contributing basin. Runoff is discussed in Section 7 of this guidance. The parameters required to perform the selected runoff analysis technique can in most cases be estimated using aerial photography and topographic mapping. When this information cannot be collected from aerial photography and topographic mapping, field visits will be required to define required parameters. Typically, however, simple spatially-lumped models will be adequate to characterize upstream and downstream contributing basins sufficient to generate associated input hydrographs along the 10% conveyance route. Similar simple runoff modeling techniques may be used for the project area though complexities in post-development drainage improvements or landcover changes may require routing flood flows to generate representative hydrographs for this area. In all cases, however, the same method for calculating the runoff hydrographs should be applied to each contributing basin, and for the pre- and post-development condition.
Step 3. Preliminary Determination of Critical Point and Representative Section Locations
Prior to commencing field work, use available mapping to make preliminary determinations of the locations of critical points and representative sections between critical points (see Appendix G). Perform a field reconnaissance of the downstream conveyance route in order to confirm the preliminary determinations of critical points and representative sections, and to determine the location of any additional critical points not previously identified. The goal is to determine representative characteristics along representative reaches (i.e., average channel or conveyance conditions along significant lengths) and at other critical points (locations that are more likely to fail under flood flow conditions). In most cases it should not be necessary to complete detailed and comprehensive mapping of the full range of cross section and profile variations continuously along the 10% conveyance route, though field inspection of the entire route is required.
Step 4. Collection of Downstream Conveyance Critical Point and Representative Section Information
Segmenting and measuring hydraulic characteristics of the 10% conveyance route can be performed in part in the field and in part from existing mapping. Slopes can be estimated

Municipality of Anchorage Drainage Design Guidelines March 2007
Page 8-5
from topographic mapping. Headwater and overflow depths and conveyance sections can be adequately measured for typical sections in the field using only a hand tape, a level rod, and a hand level. However, in all cases, reconnaissance field location and inspection of the 10% route is required.
At each critical point and representative section, a minimum of the following information must be collected during periods of dry weather:
o Feature geometry as defined by the diameter of the structure for culverts and the general shape and dimensions of the cross section of constructed and natural channels;
o Culvert inlet and outlet configuration (e.g., headwall, projecting, mitered, etc.);
o Channel bed or culvert material type;
o Maximum water depth when water is present at the time of the site visit;
o Estimate of the channel Manning’s “n” value;
o Mean bed material particle size;
o Estimate of representative local channel or culvert slope;
o Overtopping depth; and
o Geometric data (where they exist) sufficient for hydraulic calculations to evaluate bypass structures for high flows.
The collection of the geometric information may be performed using simple tools such as a level rod, hand level, and tape measure. Detailed and exact measurements typically will not be necessary, but a field reconnaissance yielding a table of values at each critical point and representative section is required, and shall be submitted with all routing analysis reports.
Step 5. Hydrograph Calculations and Conveyance Routing
Routing analyses can be performed once the necessary information has been collected for each contributing basin, and for representative sections and critical points along the 10% conveyance route (Steps 2-4). During routing analyses, the representative geometries identified between each critical point are assigned to the full length of the conveyance between each critical point. Analyses are then performed using the methods selected during Step 2 in order to define the runoff hydrographs for each contributory basin for the adjusted 10-year and 100-year, 24-hour storm events. Each hydrograph is then routed along the conveyance route based on representative channel geometries (Step 4), channel lengths based on available mapping, and channel slope based on topographic mapping. Where flowing or standing water was present during the dry weather field visit, such conditions may require consideration during routing analyses.
For routes with significant storage or pressure flow, the routing analyses must include a method(s) to evaluate these effects. In the case of storage, a Storage-Outflow calculation (also known as a Modified Puls calculation) must be performed within the routing calculations. In the case of pressurized flow, the Saint-Venant equations must be used to perform the routing calculations. This is referred to as Full Dynamic Wave routing in SWMM, and shall be used in such cases instead of the Kinematic Wave Routing method. To

Municipality of Anchorage Drainage Design Guidelines March 2007
Page 8-6
apply the full Saint-Venant equations in SWMM, the Full Dynamic Wave routing method must be specified in the Simulation Options menu.
Both the basin runoff and conveyance routing analyses can be performed simultaneously using combinations of methods available in programs such as HEC-HMS and SWMM programs, or others identified in Tables 7-10 and 8-1. These analyses are performed twice, once using the pre-development project area information and once with the post-development project area. Peak flows for both the pre- and post-development condition are then tabulated at each critical point for the 10-year and 100-year, 24-hour storm events.
Step 6. Performance of Overtopping Analyses for Critical Crossings
A simple analysis can typically be performed to establish an approximate overtopping depth at each critical point for the peak flows estimated in Step 4. Note that a storage feature is to be considered a critical point. For example, at culvert crossings, a simple culvert analysis can be performed using published culvert design nomographs (Norman and Houghtalen, 2001) to estimate culvert entrance headwater depths at pre- and post-development peak flows, given typical culvert material type, geometry, slope, length, and inlet and outlet conditions. Similarly, Manning’s Equation can be applied to estimate stage at peak flow along open channel sections, given the knowledge of channel geometry and character. These estimated values can then be compared to overtopping heights measured in Step 3.
At critical points where calculations indicate that overtopping occurs during the pre-development analysis of the adjusted 10-year, 24-hour storm, the post-development goal is to limit the depth and duration of the overtopping to those of the pre-development condition. At critical points where overtopping does not occur during the pre-development condition, the post-development goal is to maintain this condition.
At each critical point, the goal is to assure sufficient bypass capacity for flows generated during the adjusted 100-year, 24-hour storm, under post-development conditions.
Step 7. Implementation of Detention Storage
If the goals discussed in Step 6 are not met, detention storage (or additional detention storage) will be required in order to control flows from the project area. Design of detention storage is discussed in Section 9.
Step 8. Test the Effect of the New Detention Storage
Repeat performance of Steps 5 through 7, applying the new project discharge peak(s) (as controlled by the detention structure designed in Step 7) until a detention control volume and timing is identified that meets the goals discussed in Step 6.
Step 9. Check for Channel Scour
Perform a routing analysis (incorporating any detention storage required by Step 7) in order to evaluate the potential for channel scour at the critical points that exist in channels. Calculate the erosion potential of both the pre-development condition for adjusted 10-year, 24-hour storm runoff, and the controlled post-development peak flows at critical points using methods provided in Section 7. If analyses show the potential for scour during post-

Municipality of Anchorage Drainage Design Guidelines March 2007
Page 8-7
development conditions, additional detention storage at the project site shall be designed so that the above goal is met.
Once routing analyses are complete, detailed design of detention facilities can begin based on required volumes and discharge rates calculated during Steps 7 and 9. Detention basin design values estimated in the routing analysis process are not allowed as final detention design parameters for Large or Complex Small Projects, but may be adequate for final detention designs for Simple Small Projects.
8.3 10% Routing Reporting Requirements
When submitting the 10% Method routing analysis to the MOA, a minimum of the following items are to be included in the 10% Method submittal package.
• Mapping of the 10% Point Basin
The map shall be to scale and include at a minimum:
o Scaled location and extents of the 10% conveyance route (for both pre-and post-development, if different;
o Delineated outline of each upstream and downstream contributing area and the project area;
o Locations of main channels and flow paths used in estimating runoff hydrographs for each contributing area and the project area. Flow paths shall be segmented to show approximate extent of overland flow, shallow concentrated flow, and channel flow used in runoff calculations.
o Location of any storage feature along the 10% conveyance route or within the post-development project area;
o Locations of all critical points including points used to measure representative sections and conveyance properties; and
o Location of the bypass structures and anticipated paths for the adjusted 100-year, 24-hour storm event.
• Tabulated Values
Tabulated values shall include at a minimum:
o Information collected at critical points;
o Information collected for representative sections;
o Information collected for storage features;
o Minimum pre-development overtopping flows and depths calculated or measured at each critical point and representative section;
o Allowable channel velocity (based on scour);
o Post-development flow rates at each critical point;

Municipality of Anchorage Drainage Design Guidelines March 2007
Page 8-8
o Post-development flow depths at each critical point; and
o Post-development velocities at each critical point.
• Summary of Calculation Methods and Input Parameters
The summary of calculation methods and input parameters shall include, at a minimum, a list of:
o The methods used to estimate excess precipitation; transform excess precipitation to a runoff hydrograph; and to route runoff hydrographs, where applied, to the outflow point along the 10% conveyance route for each contributing basin and the project basin. Where spatially-lumped models are used to generate basin hydrographs, tabulate and submit any calculations performed for overland, shallow concentrated, or channel flow.
o Each hydrologic element (reach segments, basins, storage features, flow paths, etc.) indicating the calculation method used to route flows;
o Input parameters used during the routing analyses for each hydrologic element (basins, channels, storage features, flow paths, etc.); and
o Each critical point checked for channel scour accompanied by the calculation method used to calculate the maximum acceptable channel velocity.
• Calculation Summaries
Calculation summaries shall include at a minimum:
o Copies of written calculation sheets when manual calculations have been performed; and
o Copies of comprehensive input and output summaries from computational software (including the software title) for both the adjusted 10-year and 100-year, 24- hour storms.

Municipality of Anchorage Drainage Design Guidelines March 2007
Page 9-1
9 SIZING AND DESIGNING STORMWATER CONTROLS
A number of devices and strategies may be employed to ensure compliance with the various PM&E design criteria requirements for runoff control. Sizing and armoring devices to adequately convey flows depends mostly upon the peak size of the discharge, ground slope, and conveyance materials and entrance and exit conditions. Design practices suitable to meet PM&E hydrologic criteria for conveyance device sizing are not addressed in these Guidelines. However, sizing controls to reduce local and downstream flood risk, erosion and icing from excessive runoff peaks and volumes typically entail more complicated analyses, and are reviewed briefly in this chapter. Two strategies are typically applied to control urban flood peaks and volumes: source control strategies and end-of-pipe strategies. Designers must demonstrate that the net effect of all controls, either source or end-of-pipe systems or combinations of both, will result in compliance with applicable criteria. The End-of-Pipe strategy typically entails use of detention basins or vaults to help reduce peak flows. The basin or vaults limit discharge by use of restricted outlets, and provide temporary storage for the excess runoff volume generated during periods when peak flows exceed that permitted to be released downstream by the outlet control. Small Projects (see Figure 2-1) may apply relatively simple planning level approaches for sizing detention controls. Large projects may use similar simple methods for preliminary sizing but are required to apply routing techniques to confirm final design parameters for detention controls. Though the end-of-pipe (detention basin) approach is conventional, it has the disadvantage of consuming large land areas and being difficult to use on steeper terrain. The Source Control strategy attempts to overcome these constraints by seeking to reduce peak flows and runoff volumes by minimizing surfaces that are rapidly responsive to precipitation and maximizing infiltration and detention in a uniformly distributed fashion across the entire runoff basin. Though this type of strategy has been recognized as an important storm water management approach for over 40 years, these types of practices have become more popular only recently and are often referred to now as ‘low-impact development’ (LID) or ‘watershed’ solutions. LID solutions are encouraged for MOA development and drainage design applications. They are particularly suited to the Anchorage area because of the relatively small storm sizes typical of the region. Because the effects of this type of control approach are ‘distributed’ across the whole basin, the hydrologic effects of these controls for the purpose of compliance with PM&E drainage criteria can be calculated:
• by analysis of basin runoff response from distributed landcover modifications, and • by analysis of smaller, localized detention and retention controls.
For example, changes in landcover type and distribution affected as part of an LID strategy will be directly reflected in changes in runoff factors, which will lead to reduced post-development basin peaks. Similarly, where small localized detention features (e.g., rain gardens, infiltration trenches, small shallow detention swales and basins, etc.) are used, separate analyses of these controls’ effectiveness can be calculated and incorporated as part of the overall basin runoff and routing response analysis. PM&E will also permit simpler analytical approaches for assessing effects of smaller, ‘distributed’ detention controls where the total contributing areas for these controls is less

Municipality of Anchorage Drainage Design Guidelines March 2007
Page 9-2
than five acres. However, note that flows from these distributed detention controls may have to be routed as part of the basin analysis in order to demonstrate adequate peak control.
9.1 Detention Facilities
9.1.1 Storm Detention Design
PM&E approved approaches for development of design parameters for detention to control flood flows is dependant upon the project category and/or size of the contributing area. For Small and Single-Lot Residential projects, simple analysis should typically be sufficient to adequately size detention basins for control of peak flows. Methods that are acceptable to PM&E applications include the Rational Formula Hydrograph Method and the SCS TR55 Method (McCuen, 2002). Note that in the Rational Formula Hydrograph Method application, both pre- and post-development estimates of peak flow are required and both are estimated using the Rational Method. The SCS TR55 method is based on an empirical function of the ratio of depth of storage to the depth of runoff, Qs/Qa, and the ratio of the peak rate of outflow to the peak rate of inflow, Rs. In both methods, the estimate for the pre-development peak is assumed to equal the required outlet flow from the control while the required detention storage is calculated. For Large projects or project areas that are developed with higher fractions of impervious or other effective runoff surfaces, design of detention basins shall involve an iterative process including initial estimates of detention storage volume followed by verification of the estimate using storage routing techniques. Design typically entails:
• Identifying design requirements • Calculating control inflow hydrographs including peaks and volumes (unless storage is
present, routing inflow hydrographs to the control should require only simple methods) • Establishing the target control discharge(s) (at minimum, the pre-development condition) • Setting riser configuration (including multistage elements) and discharge coefficients. • Estimating stage-storage information for the proposed control. • Estimating required storage volumes and outlet geometry (using simple methods identified
below). • Iteratively performing storage routing and outlet sizing to achieve the desired control
discharge and determine the design storage volume. Final storage routing may use the storage-indication method or (where no backwater is present at the control outlet) a modified Puls technique. A storage-indication model is available in the WinTR55 and SWMM5 programs. A modified Puls model is available in the HEC-HMS program. The reader is referred to other sources (McCuen, 2002) for a detailed discussion of the overall approach.
9.1.2 Extended Detention Design
With a few exceptions (Figure 2-1), PM&E’s drainage criteria require 12- to 24-hour (dependent upon sensitivity of the downstream drainage systems) extended detention of runoff generated by the adjusted 1-year 24-hour design storm. An extended detention control may be comprised of a surface basin or buried vaults. Extended detention requirements may also be met by infiltration or other on-

Municipality of Anchorage Drainage Design Guidelines March 2007
Page 9-3
site detention of all of the runoff volume from the post-development project area for the adjusted 1-year, 24-hour design storm event.
For cases where extended detention is required, the single-stage outlet (i.e. one culvert pipe) is not recommended because of its inability to release at two distinct runoff rages. A more desirable outlet has two or more stages. An orifice structure serves to detain runoff for water quality purposes and extended detention of the 1-year storm. Greater storm events are usually discharged by a separate outlet.
The hydraulic design parameters (volume, orifice areas, and maximum outflow rate) for an extended detention control facility may be calculated using the method recommended by TR-55 (SCS, 1986) and the Maryland Department of the Environment. (MDE, 2000). Note that these methods of sizing detention basins may result in storage errors of 25%, and should not be used in final design. The detention basin size in final design should be based upon actual hydrograph routing for the design storms controlled by the basin.
9.2 Infiltration Controls
Stormwater infiltration controls capture and detain storm water runoff by infiltrating storm water into shallow groundwater systems. Design variants generally include shallow infiltration (surface infiltration devices) and deep infiltration (basins, trenches and drywells): Infiltration Surface shallow infiltration across an extensive surface structure Infiltration Basin deep infiltration with substantial short-term ponding of storm water Infiltration Trench deep infiltration without substantial ponding of storm water Dry Well deep infiltration serving less than a one-acre contributing area Minimum requirements for approved application of infiltration controls for storm water detention include the following:
• The base of the infiltration control shall be separated by at least three feet vertically from the seasonal high water table, HSG D-class soil horizons, or a bedrock surface, as documented by on-site geotechnical tests.
• Infiltration controls shall not be used in areas having predominant natural slopes greater than 15%.
• Infiltration controls shall not be located in fill soils, except for shallow infiltration designs or the top quarter of an infiltration trench or dry well.
• Natural soils at the base of a control shall have an infiltration rate (Fc) of no less than 0.3 inches per hour, as determined initially by soil textural classifications and confirmed by on-site geotechnical tests.
• Natural soils at the base of a control shall have a clay content (particle diameter, D < 0.002mm) of less than 20% and a silt/clay content (D < 0.075mm) of less than 50%.
• Infiltration controls shall not be located closer than 100 feet horizontally from any stream or water supply well.
• Infiltration controls shall not be located within the 1:1 plane plus two feet from the bottom edge of the control to the property line or right-of-way at finished grade when an easement is not provided on the adjacent property or right-of-way.

Municipality of Anchorage Drainage Design Guidelines March 2007
Page 9-4
• Infiltration controls shall be setback a minimum of 100 feet upgradient and 25 feet downgradient from permanent structures and drainfield systems. In no case shall any infiltration control be placed in locations that cause water problems to structures or properties.
• Infiltration trenches and drywells receiving snow and ice meltwater runoff from streets shall include, as water quality pretreatment, detention ponds having an initial end-of-winter storage capacity equal to or greater than 10% of the seasonal meltwater runoff volume generated by snow accumulated and stored within the rights-of-way of all contributing streets.
• Infiltration controls shall not be permitted where long-term maintenance responsibility for these devices is not specified, assigned, accepted and documented.
In addition, design of storm water infiltration controls shall conform to minimum infiltration testing and design standards as specified in the following subsections and elsewhere in the DCM.
9.2.1 Testing Infiltration Capacity
On-site geotechnical testing is required for the design of all infiltration controls. Testing shall be performed during (a) initial feasibility and (b) final design. Testing shall be performed in accordance with these Guidelines and shall be performed by a qualified engineer or geologist. Testing must reflect conditions during seasonal high groundwater conditions. The minimum testing schedule shall be as shown in Table 9-1.
Table 9-1: Testing Schedule For Infiltration Controls
Facility Type
Initial Testing (Prelim. Drainage Report)
Design Testing (Pass initial Fc >0.3in/hr)
Limited Infiltration (Fail initial Fc<0.3 in/hr)
Surface 1 Mod. ASTM D3385 per 40000 square foot of proposed control size
1 Mod. ASTM D3385 per 10000 square feet of proposed surface infiltration area
Underdrains required
Basin 1 soil boring & 1 cased infiltration test per control
1 soil boring & 1 cased infiltration test per 500 square feet of proposed basin area , & 1 piezometer test per control
Underdrains required
Trench 1 soil boring & 1 cased infiltration test per control
1 soil boring & 1 cased infiltration test per 50 lineal foot of proposed trench length , and 1 piezometer test per control
Control prohibited
Drywell 1 soil boring & 1 cased infiltration test per control
1 soil boring & 1 piezometer test per proposed drywell
Control prohibited
Fc – infiltration rate Initial testing is conducted to provide design feasibility information, and is meant to screen unsuitable sites, and reduce design testing costs. Initial testing shall be performed and submitted as part of the Preliminary Drainage Report. Initial testing involves either one field test per facility, regardless of type or size, or previous testing data that meets the specified testing requirements. Initial tests passing minimum requirements can be used to fulfill part of the required design testing schedule. Initial feasibility testing shall be conducted no further than 200 feet from a proposed structure location and at a location anticipated to have similar geology and shallow ground water characteristics.

Municipality of Anchorage Drainage Design Guidelines March 2007
Page 9-5
Design testing includes sufficient information to support final design of the proposed facility. Design testing shall be performed and submitted as part of the final Drainage Report. Design testing shall in all cases be performed at the location of the proposed control. For both initial feasibility and design testing, soil test borings shall be advanced a minimum of 4 feet below the design base of the control and logs of soil strata recorded from the ground surface to the bottom of boring. Test pits may be used instead of borings to collect soil samples but conditions described in following text must still be met for installing piezometers or performing percolation tests. Soil samples shall be collected and laboratory tests for grain size analysis performed of soil samples collected at the base and four feet below the base of the proposed control. Soil sampling and laboratory testing shall be sufficient to determine particle size characteristics (Unified Soil Classification System—ASTM D2487) of representative natural sediments at the base and four feet beneath the base of the proposed control. A capped piezometer, perforated from the base to 4 feet below the base of the proposed control and sealed at the ground surface to prevent surface water from entering along the outer casing wall, shall be placed in at least one boring location per control so as to allow measurement of seasonal variation in the shallow ground water surface at the site. At least three measurements of the shallow ground water surface shall be obtained from each piezometer between August 1 and October 31 and results reported in terms of depth from ground surface to surface of water in the piezometer. Infiltration tests and piezometers shall be conducted in a portion of the pit where natural soils are left undisturbed below the proposed base of the structure for a distance of at least 10 feet in diameter from any infiltration and piezometer testing locations. Where piezometers are to be installed in test pits, borings shall be advanced in the undisturbed portion of the pit for use in installing the piezometer. Cased borings may also be used to test infiltration or tests may be done using standard or modified standard ASTM double-ring infiltration tests performed on the undisturbed pit bottom. Infiltration tests shall be performed at the location and at the base of the proposed infiltration control. All infiltration testing shall be performed in accordance with the method schedule shown in Table 9-2. The standard method for infiltration testing for surface and basin controls shall be ASTM D3385, ‘Standard Test Method for Infiltration Rate of Soils in Field Using Double-Ring Infiltrometer’. The method may be modified to use reduced ring diameters (2.5 and 4.25 inch inner and outer ring dimensions respectively) through application of the IN2-W Turf-Tec Infiltrometer or equal (USEPA,1999). Trenches or other deep-excavation infiltration controls, where safe entry may be an issue, may be tested for infiltration using falling head percolation methods modified from EPA (USEPA, 1980). Methods as described in the EPA guidance shall be applied except that in all cases test borings shall be extended a minimum of 1 foot and a maximum of 2 feet below the base of the control; non-perforated casing shall be placed so that the bottom of the casing is at the boring bottom; and the annular space between the casing and hole walls completely backfilled and compacted with hole cuttings. The boring shall not be greater than approximately twice the diameter of the casing used in the test. Use of perforated casing shall not be allowed in performing falling head percolation tests. Sorted, washed gravel may be placed at the base of the boring below the bottom of the test casing to

Municipality of Anchorage Drainage Design Guidelines March 2007
Page 9-6
minimize hole erosion as water is introduced into the casing, but the total thickness of the placed gravel shall not exceed four inches. All testing shall be documented in a summary report including: complete description of work history and methods; maps of boring and test locations in relation to proposed controls and project boundaries; tabulation of collected data; calculations and results including laboratory reports and field test results; and graphic logs of all soil borings and test holes showing boring and test installation dimensions, significant strata changes (including any fill) with associated engineering soils descriptions and depths, sample locations and identities related to laboratory tests, and water table (with time and date) and bedrock depths. All vertical measurements shall be reported relative to the undisturbed ground surface.
Table 9-2: Soils Testing For Infiltration Controls
Facility Type Initial Testing Design Testing (Pass initial Fc >0.3in/hr)
Surface Mod. ASTM D3385-03 Mod. ASTM D3385-03 Basin Mod. ASTM D3385-03
US Standard sieve analysis Mod. ASTM D3385-03 US Standard sieve analysis
Trench falling head percolation or Mod. ASTM D3385-03; US Standard sieve analysis
falling head percolation or Mod. ASTM D3385-03; US Standard sieve analysis
Drywell falling head percolation or Mod. ASTM D3385-03; US Standard sieve analysis
falling head percolation or Mod. ASTM D3385-03; US Standard sieve analysis
Fc – infiltration rate
9.2.2 Infiltration Control Design
In addition to design limitations stated elsewhere in these Guidelines or in the DCM, the following are required elements in design of infiltration controls.
• Infiltration controls shall not be allowed where final infiltration testing fails permissible minimum infiltration rates.
• The maximum contributing area to a single infiltration basin or trench shall be less than five acres. Larger systems may be allowed where the soil is highly permeable (greater than 5.0 inches per hour) and designers demonstrate infiltrated flows will not surface or impact downstream structures or drainage systems.
• The total contributing drainage area to dry wells shall be less than one acre. • Design of all infiltration controls shall be based only on infiltration capacity through the base
of the control. Infiltration through the sides of a device shall not be included in sizing controls.
• Infiltration trench and drywell designs shall incorporate a fine gravel or sand layer, graded or separated with geotextile fabric to prevent piping, placed above the coarse gravel treatment reservoir to serve as a filter layer.
• The base of the reservoir in trenches and drywells shall be flat to maximize infiltration through the device bottom.
Municipality of Anchorage Drainage Design Guidelines March 2007
Page 9-7
• An observation well shall be installed in every infiltration trench and dry well and shall consist of an anchored six- inch diameter perforated pipe extending from the surface to the base of the control and including a lockable cap installed flush with the control surface.
• All deep infiltration controls shall include dewatering elements for use in the case of plugging or other device failure. Controlled dewatering using underdrain pipe systems shall be acceptable.
• All deep infiltration controls shall include bypass structures to divert flows larger than the design event.
• All deep infiltration controls shall include a separate associated system for pretreatment of 25% of the water quality treatment volume and shall provide filtration (e.g., sand filters, constructed or natural wetlands, settling basins or swirl separators) to treat and remove 90% of sediments 60μ and larger.
• Upstream construction shall be completed and stabilized before connection to a downstream infiltration facility will be permitted. Proposed infiltration controls shall not be used as sediment control devices during site construction phase. Erosion and Sediment Control plans for the site shall clearly specify how sediment will be prevented from entering an infiltration facility. A dense and vigorous vegetative cover shall be established over contributing pervious drainage areas before runoff will be accepted into the facility.
• Direct overland access shall be provided to infiltration devices to allow long-term maintenance and rehabilitation.
• It is stongly recommended that design infiltration rates be based on field infiltration or percolation tests with an appropriate factor of safety to account for decreased infiltration over time. Design infiltration rates based on soil classification only may be no greater than 1 inch per hour and, in such cases, the Municipality may require lower design infiltration rates based on soils type and other site specific conditions.
• The Low Impact Development Design Guidance Manual presents design methodologies that should be used for infiltration trenches and drywells.

Municipality of Anchorage Drainage Design Guidelines March 2007
Page 9-8

Municipality of Anchorage Drainage Design Guidelines March 2007
Page 10-1
10 CHANNEL EROSION AND ICING CONTROLS
10.1 Channel Erosion Control Design
Watercourse open channel erosion stability analysis and design shall be generally performed as described in the Federal Highway Administration’s (FHWA) hydraulic engineering circulars and design manuals. Guidance for general analysis and design of open channel flow resistance shall be as described in FHWA Hydraulic Engineering Circular 22, 2nd edition (Brown, Stein and Warner, 2001). Flow resistance design for open channels where slopes exceed 10% and for composite linings shall conform to guidance in FHWA Hydraulic Engineering Circular 15 (Kilgore and Cotton, 3rd edition, 2005). Erosion stability and channel design shall at minimum calculate, tabulate and report for representative sections and lining characteristics at peak flow of the design storm:
• maximum shear stress • shear stress in critical bends • side slope stability for channels with side slopes steeper than 3 horizontal to 1 vertical (3:1) • permissible or critical shear stress for proposed channel lining or armor • effective Manning’s n and transitional lining characteristics for composite channel linings,
particularly where low flow channels are required (e.g., for low base-flow streams and other perennial flows subject to icing)
For all channel erosion stability calculations, reports shall tabulate design parameters used including at minimum peak flow rate and velocity for the design storm peak, channel profile and cross section geometry, channel slope, channel roughness, and proposed or existing channel side and bottom lining material type and size, and as necessary for each composite and transitional lining material type.
10.2 Icing Control Design
Design for control of winter icing of perennial surface flows is a critical element in design of any surface water conveyance in the Anchorage region. In 2004 the Municipality estimated that it spent over $100,000 annually in emergency maintenance of drainageways and small streams blocked by icings that occurred as a result of channel modifications that inadequately considered thermal design. A major part of these design failures undoubtedly occurred because often what is considered as good flood conveyance design practice results in significant increase in potential for development of winter icing. In fact, adequate design for winter icing control for small streams and open channel storm water conveyances will often require separate consideration for flood conveyance and icing control. Considerable professional literature exists for design of stream icing controls but, unfortunately, much of this literature is focused on larger rivers where design failures carry larger, community-wide risks. Quantitative design guidance for small streams and open channels is less readily available. However, some elements are basic to design for almost all small structures and are summarized below:
• Channel Profile: small stream and drainageway channelization often negatively impacts the thermal regime of these features by increasing the grade of these features thus promoting supercooling of stream flows, increasing the surface area of flow directly exposed to the atmosphere thus increasing the rate of cooling, and removing and limiting development of

Municipality of Anchorage Drainage Design Guidelines March 2007
Page 10-2
vegetation and snow and ice insulation further increasing the rate of heat loss. Winter icings in small flows are often promoted where turbulent shallow flow enters sharp grade breaks, particularly where horizontal bends or projections create eddies or structures immediately downstream that can accumulate frazile ice. Good icing control requires design for short-period, alternating pool/riffle (low slope) or plunge pool/step structures (steep slope), large-radius horizontal and vertical bends, and profile grades that do not significantly exceed that of local natural streams. Generally the period in the profile (the length of one pool/riffle or pool/step feature) can be made to match natural conditions observed up- and downstream but, in general, the overall length of a single series should not exceed about 7- to 10-times the bankfull-width of the channel, with riffles or steps being about one-fifth to one-sixth the length of their adjoining pools. Steps and riffles should also be constricted in width relative to pool structures to help minimize turbulence and maximize depth during low-flow periods.
• Channel Section: for icing control of small flows, low-flow channel structures having small
width to depth ratios (about 2.0 or smaller) at bankfull conditions are required. For design purposes width at bankfull flow should be estimated for peak flow rates occurring during the 1.5- to 2-year return period runoff event at a riffle section. Constructing and maintaining a small width-to-depth ratio for a low-flow channel while providing for adequate bank vegetation (for thermal and erosion protection) and meeting other profile and section design requirements can be difficult. Use of silt socks to stabilize banks (in combination with gravel and rock sized for stability at larger flows for channel bedding along with limited use of large, stable rocks for steps on steeper slopes and to occasionally direct flows) can provide economical, simple and very effective solutions to these low-flow channel design requirements. The silt socks can be readily shaped to the desired channel form and planted with appropriate vegetation to provide thermal protection at low flow conditions as well as resist channel erosion from large flood flows. Where channels will carry flood flows much larger than the anticipated low-flows, a composite channel section may be required to support both flow regimes. Thermally-protective low flow channels will still be required but will be set within a larger flood flow channel constructed to safely carry the design flood flow.
• Protective Vegetation: provision of bank vegetation and near-channel structures that will
provide thermal protection and support an insulating snow and ice cover during low flows is critical to small channel icing designs. Brush planted at the immediate bankfull margin and that is large enough at maturity to arch over a substantial fraction of the low-flow channel serves to inhibit air movement across the stream surface and capture snow as an insulating layer. Once established, brush will also provide excellent erosion protection and alternate flow paths for small channel structures. Brush as a thermal design element should be placed immediately adjacent to both sides of the low-flow channel and as continuously as possible along the entire channel. Short reaches may be left open as stream access points and for aesthetic viewing purposes but these openings should be short, generally not exceed more than about 10 to 20% of the total bank length, and expose only one side of the stream. Small rocks sized to be immobile at larger flood events and embedded periodically in the bed at the margins of pool structures can also help support development of an insulating ice cover early in the winter. However these rocks should not be so abundant or placed so as to increase mid-channel turbulence or promote large eddies or lateral flow.
• Subsurface Flow and Crossings: most heat loss impacts to small stream flows can be
significantly mitigated by simply re-routing surface flows through subsurface conduits (most

Municipality of Anchorage Drainage Design Guidelines March 2007
Page 10-3
effectively done as laminar flow in pipes or as tortuous flow in thick, coarse rock aggregate). Obviously if surface flow is desirable (as is frequently the case for small stream features) this is not an acceptable alternative. On the other hand, channelization and open bridging of very small flows, say for pathways or driveway crossings, can hugely exacerbate icing development through channel (flow surface) widening, local grade and turbulence increases, adjacent insulating vegetation and snow cover removal or prevention, cold air funneling, and shadowing. In these circumstances, smooth-bore culverts graded to the bed of the up- and downstream channel, appropriately insulated across their arch by thicker fill or board insulation, and constructed to as short a length as possible are preferable to open bridges, particularly wider bridges on wider, more-exposed rights-of-way. In some cases, washed rock bedding extending up- and downstream of the culvert inlet and outlet may still be necessary to prevent icings where the other icing design elements are limited or less effective.
• Maintenance: even the most-protected or carefully-designed low-flow channel can be exposed
to an increased icing potential by poor maintenance practices. Channel maintenance done to improve flood flow performance along winter low-flow features can dramatically increase icing development where it includes periodic channel widening and vegetation removal (particularly where vegetation is removed along the immediate stream bank). Similarly side-casting snow into channels can reduce or destroy insulating cover and increase potential for development of icings. This practice can be quite common at driveway crossings and is not unusual along rural roadways where many small streams have been routed into the roadside ditches. In fact, it is not much less common for earthen fill or other obstructions to be placed across intermittent streams and drainageways as well, particularly where local residents are not well aware of the seasonal functionality of these types of features. Finally, some emergency mitigation practices of stream icings can actually increase icing severity. Excavating icings from a channel often simply re-exposes small flows to optimum channel conditions for re-development of the icings. The best short-term seasonal fixes include creating (usually with low-pressure steam hoses) very narrow, deep channels in the existing icings (occasionally protected by application of an arching cover of protective dry straw or other woody material) and along which flows may become re-integrated to better conserve heat across the exposed reach.

Municipality of Anchorage Drainage Design Guidelines March 2007
Page 10-4

Municipality of Anchorage Drainage Design Guidelines March 2007
Page 11-1
11 SELECTED REFERENCES
Alaska Department of Transportation and Public Facilities, June, 1995: Alaska Highway Drainage Manual; Bridge Design Section, Juneau, Alaska.
American Society of Civil Engineers (ASCE), 2006: Standard Guidelines for Design of Urban Stormwater Systems. ASCE/EWRI 45-05, New York, N.Y.
Arcement, Jr. G.J. and V.R. Schneider, 1984: Guide for Selecting Manning’s Roughness Coefficients for Natural Channels and Flood Plains; U.S. Geological Survey Water-Supply Paper 2339, Washington, D.C.
Bedient, Philip B. and Wayne C. Huber, 2002: Hydrology and Floodplain Analysis, Third Edition; Prentice-Hall, Inc., Upper Saddle Hill, N.J., 763p.
Barnes, Harry H., 1967: Roughness Characteristics of Natural Channels; U.S. Geological Survey Water-Supply Paper 1849, Washington, D.C.
Brown, S. A., S. M. Stein, and J. C. Warner, November 1996: Urban Drainage Design Manual, Hydraulic Engineering Circular 22; Report No. FHWA-SA-96-078, Federal Highway Administration, Washington, D.C.
Chow, Ven T, 1959: Open Channel Hydraulics, McGraw-Hill, Inc., New York.
Fasken, Guy B., December 1963: Guide For Selecting Roughness Coefficient “n” Values for Channels; U.S.D.A Soil Conservation Service, Lincoln, Nebraska.
Feldman, Arlen D., Editor, March 2000: Hydrologic Modeling System HEC-HMS Technical Reference Manual; Report No. CPD-74B, U.S. Army Corps of Engineers, Hydrologic Engineering Center, Davis, Ca.
Haestad Methods and Durrans, S. Rocky, 2003: Stormwater Conveyance Modeling and Design; Haestad Methods, Inc., Waterbury, CT.
Huber, Wayne C. and Robert E. Dickinson, October 1992: Storm Water Management Model, Version 4: User’s Manual; EPA/600/3-88/001a, Office of Research and Development, U.S. Environmental Protection Agency, Athens, Georgia.
JMM Consulting Engineers, Inc., April 2, 1991: DPW Hyetograph Update; prepared for Department of Public Works, Municipality of Anchorage, Anchorage, Alaska.
Kent, K. M., April 1973: A Method for Estimating Volume and Rate of Runoff in Small Watersheds; Soil Conservation Service, U.S. Department of Agriculture, SCS-TP-149.
Kilgore, Roger T. and George K. Colton, September 2005: Design of Roadside Channels with Flexible Linings; Hydrologic Engineering Circular Number 15, Third Edition; Report NO. FHWA-NHI-05-112, Federal Highway Administration.
Maidment, David R., ed., 1993: Handbook of Hydrology; McGraw-Hill, Inc.

Municipality of Anchorage Drainage Design Guidelines March 2007
Page 11-2
Maryland Department of the Environment (MDE), 2000: 2000 Maryland Stormwater Design Manual; Baltimore, Maryland.
McCuen, R.H., Peggy A. Johnson, Robert M. Ragan, October 2002: Highway Hydrology: Hydraulic Design Series Number 2, Second Edition; Publication No.: FHWA-NHI-02-001, (HDS-2), prepared for Federal Highway Administration, Arlington, Virginia.
National Resources Conservation Service (NRCS), April 19, 2002: Win TR55 User Manual; Washington, D.C.
NRCS, September, 1997: Part 630 Hydrology, National Engineering Handbook; NEH, Washington, D.C.
NRCS, October 1993: Soil Survey Manual; at http://soils.usda.gov/technical/manual/
NRCS, June 1986, 2nd edition: Urban Hydrology for Small Watersheds; Technical Release (TR) no. 55, Washington, D.C.
Norman, Jerome M. and Robert J. Houghtalen, September 2001: Hydraulic Design of Highway Culverts, Second Edition; Report No. FHWA-NHI-01-020, Hydraulic Design Series (HDS) No. 5, Office of Bridge Technology, Federal Highway Administration, Washington, D.C.
Ocean County Soil Conservation District (OCSCD), March 2001: An Investigation of the Effect of Soil Disturbance on Bulk Density and Infiltration in Ocean County, New Jersey; prepared for U.S. National Resources Conservation Service, Ocean County, New Jersey.
Pitt, Robert, P.E., Shen-En Chen, P.E. and Shirley Clark, P.E., September 2002: Compacted Urban Soils Effects on Infiltration and Bioretention Stormwater Control Designs; for 9th International Conference on Urban Drainage, IAHR, IWA, EWRI, and ASCE, Portland, Oregon.
Ponce, V. M. and V. Yevjevich, 1978: Muskingum-Cunge Method With Variable Parameters; Journal of the Hydraulics Division, ASCE, 104 (HY 12), p1663-1667.
Rawls, W.J., S.L. Long, and R.H. McCuen, 1981: Comparison of Urban Flood Frequency Procedures; Preliminary Draft Report prepared for Soil Conservation Service, Beltsville, Maryland.
Rossman, Lewis A., November 2004: Storm Water Management Model User’s Manual, Version 5.0; U.S. Environmental Protection Agency, Water Supply and Water Resources Division, Cincinnati, Ohio.
Strahler, A.N. 1957, ‘Quantitative Analysis of Watershed Geomorphology’; Trans. Am. Geophys. Union, Vol. 38, pg. 913-920
Suphunvorranop, Thirasak, 1985: A Guide to SCS Runoff Procedures; Technical Publication No. 85-5, Department of Water Resources, St. Johns River Water Management District, Palatka, Florida.
Terstriep, Michael L. and John B. Stall, 1974: The Illinois Urban Drainage Area Simulator, ILLUDAS; Bulletin 58, Illinois State Water Survey, Urbana, Illinois.

Municipality of Anchorage Drainage Design Guidelines March 2007
Page 11-3
United States Department of Commerce, 1963: Probable Maximum Precipitation and Rainfall-Frequency Data for Alaska; Technical Paper No. 47, National Weather Service, Washington, D.C.
United States Environmental Protection Agency (USEPA), December 1999: Infiltration through Disturbed Urban Soils and Compost-Amended Soil Effects on Runoff Quality and Quantity, EPA/600/R-00/016, Cincinnati, Ohio
USEPA, October 1980: Design Manual - Onsite Wastewater Treatment and Disposal Systems, EPA 6251/1-80-012, Cincinnati, Ohio
USKH, Inc., 2006: Anchorage Intensity-Duration-Frequency curves Update. Prepared for Watershed Management Services, MOA, Anchorage, Alaska.
Washington State Department of Transportation (WaDOT), March 2005: Hydraulics Manual; Olympia, Washington.
Watershed Management Services Division (WMS), November 2002: Anchorage OGS and Street Sweeping as Storm Water Controls: Performance Analysis; WMS Document No. WMP APr02002, Project Management & Engineering (PM&E), Municipality of Anchorage (MOA), Anchorage, Alaska.
WMS, November 2002b: Anchorage Storm Water Treatment in Wetlands: 2002 Guidance; WMS Document No. WMP CPg02003, PM&E, MOA, Anchorage, Alaska.
WMS, December 1999: Anchorage Climate Characteristics for Use in Storm Water Management; WMS Document No. WMP APr99004, PM&E, MOA, Anchorage, Alaska.
WMS, December 1999: Anchorage Bowl OGS Performance Modeling; WMS Document No. WMP APr98002, PM&E, MOA, Anchorage, Alaska.
WMS, January 2004: Municipal Stream Classification: Anchorage, Alaska; WMS Document No. WMP Apg040001, PM&E, MOA, Anchorage, Alaska.
WMS, November 2004: Municipality of Anchorage Stream Mapping Standards, Ver 1.03; WMS Document No. WMP APg01001, PM&E, MOA, Anchorage, Alaska.
Woodward, Donald E., Richard H. Hawkins, Allen T. Hjelmfelt Jr., J. A. Van Mullem, and Quan D. Quan, c2000: Curve Number Method: Origins, Applications and Limitations; USDA NRCS.

Municipality of Anchorage Drainage Design Guidelines March 2007
Page 11-4

Municipality of Anchorage Drainage Design Guidelines March 2007
APPENDIX A DRAINAGE REPORT OUTLINE

Municipality of Anchorage Drainage Design Guidelines March 2007

Municipality of Anchorage Drainage Design Guidelines March 2007
Page A-1
Drainage Report Outlines The purpose of the Drainage Report is to identify and propose specific solutions to stormwater runoff and water quality problems resulting from existing and proposed development. The report must include adequate topographic information (pre- and post-development) to verify all conclusions regarding offsite drainage. Unless known, the capacity of downstream drainage structures must be thoroughly analyzed to determine their ability to convey the developed discharge. The drainage report and plan will be reviewed and approved by the Engineer prior to preparation of final construction drawings. Approval of these preliminary submittals constitutes only a conceptual approval and should not be construed as approval of specific design details.
Instructions for preparing report 1. Include a cover sheet with project name and location, name of firm or agency preparing the report,
Professional Engineer’s signature and seal (if a final report), signed statement of compliance, and table of contents. Number each page of the report.
2. Perform all analyses according to the intent of professionally-recognized methods. Support any modifications to these methods with well-documented and industry-accepted research.
3. It is the designer’s responsibility to provide all data requested. If the method of analysis (for example, a computer program) does not provide the required information, then the designer must select alternative or supplemental methods to ensure the drainage report is complete and accurate.
4. Acceptance of a drainage report implies that PM&E concurs with the project’s overall stormwater management concept. This does not constitute full acceptance of the improvement plans, alignments, and grades, since constructability issues may arise in plan review.
5. Use all headings listed in the Contents. A complete report will include all the information requested in this format. If a heading listed does not apply, include the heading and briefly explain why it does not apply. Include additional information and headings as required to develop the report.
The Drainage Report outline for a Crossing Project is presented on page A-2.
The Drainage Report outline for all other projects starts on page A-3.

Municipality of Anchorage Drainage Design Guidelines March 2007
Page A-2
Drainage Report Outlines for Crossing Project Applicants may either • prepare a drainage report as described below or • submit a certification that the crossing requires only an equivalent 18-inch diameter circular
pipe or smaller to convey the peak 10-year, 24-hour duration storm event, and that the proposed structure will otherwise meet all MOA design criteria for crossings.
Crossing Project Drainage Report Outline 1. Statement of Compliance 2. Project Description
2.1. Location 2.1.1. MOA and state streets within and adjacent to the site or area to be served by the
drainage improvements 2.1.2. Township, range, section, ¼ section, subdivision, lot, and block 2.1.3. Names of surrounding developments
2.2. Description of the Project Property 2.2.1. General project description, including proposed land use 2.2.2. Area in acres 2.2.3. Flooding history 2.2.4. Easements within and adjacent to the site
3. Basin(s) Characterization 4. Peak flow calculations 5. Maps
5.1.1. Scale sketch showing the crossing location and its contributing area 5.1.2. Plan and profile sheet for all conveyances where the section is larger than an
equivalent 18-inch diameter circular pipe 6. Appendices
• Submitted Drainage Certification • Submitted Drainage Project Notification • Copies of the Coastal Project Questionnaire (CPQ) and permit applications required by
state and federal agencies where conveyance is across a stream or other water of the U.S.

Municipality of Anchorage Drainage Design Guidelines March 2007
Page A-3
Drainage Report Outlines for all Projects other than Crossing Projects The following information contains summaries for hydrology and detention (see Tables A-1, A-2, and A-3), as well as design considerations for the preparation of project drainage reports. They are provided as a minimum guide and are not to be construed as the specific information to be supplied on every project drainage report, and other information may be required. Existing and proposed conditions for each development will require analysis unique to that area.
1. Statement of Compliance See Appendix C.
2. Project Description
a. Location. Identify MOA and state streets within and adjacent to the site or area to be served by the drainage improvements. Provide the township, range, section, ¼ section, subdivision, lot, and block, zoning district, and names of surrounding developments
b. Project Description. Provide a general project description, including proposed land use and area in acres. Summarize flooding and icing history. Identify easements within and adjacent to the site.
c. Category Determination. Identify what category the project fits. Provide threshold runoff calculations for Single Lot Residential and Small projects. Provide infiltration calculation for the 1-year 24-hour event, if used for categorization determination.
3. Basin Characterization.
a. Pre-development conditions. Describe pre-developed land use, topography, drainage patterns (including overland conveyance of the 100-year storm event), and natural and manmade features. Describe ground coverage, soil type, and physical properties, such as hydrologic soil group and infiltration. For the pre-development analysis where the area is rural and undeveloped, a land use description of “meadow/good condition” is recommended. If a geotechnical study of the site is available, provide boring logs and locations in the appendix of the report. If a soil survey was used, cite it in the references. Describe drainage, stream and other surface water easements within and adjacent to the site and along the 10% route.
b. Post-development conditions. Describe post-developed land use and proposed grading, change in percent of impervious area, and change in drainage patterns. If an existing drainageway is filled, the runoff otherwise stored by the drainageway will be mitigated with stormwater detention, in addition to the post-development runoff.
c. Contributing off-site drainage. Describe contributing off-site drainage patterns, land use, and stormwater conveyance. Identify undeveloped contributing areas with development potential and list assumptions about future development runoff contributed to the site.
d. Floodways, floodplains, and wetlands. Identify areas of the site located within the floodway or floodplain boundaries as delineated on flood insurance rate maps, or as determined by other engineering analysis. Identify wetland areas on the site, as delineated by the Anchorage Wetlands Management Plan, or as determined by a specific wetland study.
e. Problem areas. Describe flooding and icing history of project site, upstream tributary areas, and downstream impact areas.
4. Pre-development runoff analysis.
a. Watershed area. Describe overall watershed area and relationship between other watersheds or sub-areas. Include a pre-development watershed map in the report appendix.

Municipality of Anchorage Drainage Design Guidelines March 2007
Page A-4
b. Time of concentration. Describe method used to calculate the time of concentration. Describe runoff paths and travel times through sub-areas. Show and label the runoff paths on the pre-development watershed map.
c. Precipitation model. Describe the precipitation model and rainfall duration used for the design storm as prescribed in the Drainage Design Guidelines. Total rainfall amounts for given frequencies and durations are included in Table 6-2 of the Guidelines.
d. Rainfall loss method. List runoff coefficients or curve numbers applied to the drainage area. The Green-Ampt infiltration model may also be used to estimate rainfall loss by soil infiltration.
e. Runoff model. Describe method used to project runoff and peak discharge. Specific models are shown in Table 7-10 and 8-1 of the Guidelines.
f. Summary of pre-development runoff. Provide table(s) including drainage area, time of concentration, frequency, duration, peak discharge, routing, and accumulative flows at critical points where appropriate.
5. Post-development runoff analysis.
a. Watershed area. Describe overall watershed area and sub-areas. Discuss if the post-development drainage area differs from the pre-development drainage area. Include a post-development watershed map in the report appendix. Include an analysis of the proposed increase in impervious area. Provide a summary of the total impervious area and the % impervious area for each sub-watershed/catchment.
b. Time of concentration. The method used will be the same as used in the pre-development analysis. Describe change in times of concentration due to development (i.e. change in drainage patterns). Show and label the runoff paths on the post-development watershed map.
c. Precipitation model. Storm event, total rainfall, and total storm duration will be the same as used for the pre-development model. If IDF curves are used, describe the change in design rainfall intensity.
d. Rainfall loss method. Method will be the same as pre-development analysis. Describe the change in rainfall loss due to development.
e. Runoff model. The runoff method will be the same as used in the pre-development analysis, except for variables changed to account for the developed conditions.
f. Summary of post-development runoff.
1) Provide table(s) including drainage area, time of concentration, frequency, duration, and peak discharge that includes any upstream offsite detention basins and undeveloped offsite areas assumed to be developed in the future. Summarize in narrative form the change in hydrologic conditions due to the development. Provide a runoff summary using Tables A-1 and A-2.
2) Provide a summary of the respective volumes and discharge rates corresponding to the design criteria applicable to the project, as specified in the DCM.
3) Calculate the allowable release rate from the site.
6. Stormwater conveyance design.
a. Storm sewer.

Municipality of Anchorage Drainage Design Guidelines March 2007
Page A-5
1) List design criteria, including storm event and runoff model. Describe the hydraulic grade line and whether pressure flow or surcharging is possible. Provide a graphic of the hydraulic grade line.
2) List design criteria for intake size and spacing. Describe the anticipated gutter flow and spread at intakes.
3) List any special considerations for sub-drainage design, such as high water tables.
4) Provide tables of storm sewer (inlet and pipe) and intake design data.
5) Water spread on the street for intake design year and 100-year elevation in all streets in which the curb is overtopped.
b. Culverts.
1) Describe culvert capacity, inlet or outlet control conditions, estimated tailwater and headwater. Determine if 100-year or lesser storm event will flood roadway over culvert.
2) Sketch a contour of the 100-year headwater elevation on a topographic map and/or grading plan. This delineated 100-year flood elevation is used to determine drainage easement and site grading requirements.
c. Open channel flow – swales and ditches.
1) Describe swale and ditch design. State the assumed Manning’s roughness coefficients. State the anticipated flow velocity, and whether it exceeds the permissible velocity based on soil types and/or ground coverage. If the permissible velocity is exceeded, describe channel lining or energy dissipation.
2) Discuss design calculations. Depending on the complexity of the design, these may range from a single steady-state equation (i.e. Manning’s) to a step calculation including several channel cross-sections, culverts and bridges.
3) Discuss the overall grading plan in terms of controlling runoff along lot lines and preventing runoff from adversely flowing onto adjacent lots.
4) The limits of swale and ditch easements will be established based upon the required design frequency. This includes 100-year overflow easements from stormwater controlled structures.
d. Storm drainage outlets and downstream analysis.
1) Discuss soil types, permissible and calculated velocity at outlets, energy dissipater design, and drainage impacts on downstream lands. Provide calculations for the energy dissipater dimensions, size, and thickness of riprap revetment (or other material) and filter layer.
2) Include a plan and cross-sections of the drainage way downstream of the outlet, indicating the flow line slope and bank side slopes. Identify soil types on the plan.
3) Perform downstream analysis. The downstream analysis will show what impacts, if any, a project will have on the drainage systems downstream of the project site. The analysis consists of three elements: review of resources, inspection of the affected area, and analysis of downstream effects.
e. Hydraulic model. If the design warrants hydraulic modeling, state the method used.
7. Stormwater management design.

Municipality of Anchorage Drainage Design Guidelines March 2007
Page A-6
a. Required Design Elements. Discuss how the following applicable design criteria will be met; provide summary tables of flows and volumes, and cross-reference to calculations in appendices. Include a description of maintenance requirements, where applicable.
1) Water quality protection
2) Retention for compliance with a U.S. Army Corps of Engineers Section 404 permit, either under the Anchorage Wetlands General Permit, an individual permit, or other U.S. Army Corps of Engineers authorization
3) Extended Detention
4) Flood Hazard Protection
5) Project Flood Bypass
6) Downstream Impact Control
b. Describe Infiltration/Detention/Retention facilities
1) Describe site and performance. Discuss existing topography and relationship to basin grading. Determine if construction will be affected by rock deposits. Also determine if a high water table precludes basin storage. Floodplain locations should be avoided. Describe the expected recovery period of the facility (l time to drain). Describe particular maintenance requirements.
2) Detention basins
i Provide a table summarizing these release rates. Also provide a stage-storage-discharge table. These tables are shown in Table A-3. State the minimum freeboard provided, and at what recurrence interval the basin overtops.
ii Discuss the effects on the overall stormwater system by detention basins in contributing offsite areas. If contributing offsite areas are presently undeveloped, discuss assumptions about future development and stormwater detention.
iii Calculate the basin overflow release rate. This equals the onsite 100-year post-developed peak discharge plus the contributing offsite 100-year post developed peak discharge. Include this calculation with Table A-3.
iv Discuss the basin outlet design in terms of performance during low and high flows, and downstream impact (see 10% analysis and extended detention).
v State whether the detention basin volume is controlled by the required flood control volume, extended detention release rate, or the water quality volume.
3) Infiltration / Retention Facilities
a) Describe the infiltration capacity of the site and document field tests conducted to support the design.
b) Describe methods to protect the facility when flows exceed design flows and under breakup or winter thaw conditions.
8. References. Provide a list of all references cited, in bibliographical format.

Municipality of Anchorage Drainage Design Guidelines March 2007
Page A-7
9. Drawings Appendix. Drawings should be no larger than 24 inches by 36 inches. Drawing larger than 11 inches by 17 inches should be inserted in 8-1/2 inch by 11-inch sleeves in the back of the bound report.
a. Base Mapping Clearly identify and label, as a scale of 1 inche equals 50 feet or more detailed:
1) Project area and its location within the MOA
2) Boundaries of all parcels proposed for the completed project, including all project road alignments and ROWs.
3) All receiving waters, including streams, wetlands, lakes, and tidewater entering, crossing, or exiting the project area.
4) All drainageways (natural and constructed) for the completed project area, showing their spatial relationship to receiving waters. Ultimate receiving waters may be outside the project area.
5) Any significant hydraulic storage, including adjoining wetlands, along all watercourses (drainageways and streams).
6) All project discharge points and their associated project drainage areas.
7) Drainage boundaries of any upstream contributing areas (inflow areas) to each project drainage area.
8) Downstream conveyance route(s) from each project discharge point to its ultimate (first) receiving water.
9) Flow paths within the project areas to the point of discharge and used in determining the time of concentration for a basin, illustrating segmentation for overland flow, shallow concentrated flow, and channel flow.
10) Project conveyances. Indicate hydraulic characteristics for typical conveyance sections at design points for project area drainageways. Segment and label these as needed based on hydraulic section type.
11) Drainage basin boundaries, subdivided appropriately homogeneous storm water runoff subbasins.
12) Landcover types for each project drainage basin (or drainage area subbasin) for both pre-development and post-development conditions.
13) Where zoning adjustment will be applied, map and tabulate applicable zoning by project drainage area or subbasin.
b. Downstream Mapping
1) Identify the 10% conveyance route and the 10% point (see Appendix G) along the downstream conveyance route.
2) Identify and map boundaries of all downstream contributing areas, and the location of their approximate geographic centroid (for use in identifying an appropriate orographic multiplier) and their inflow point along the 10% conveyance route (for use in establishing the associated critical point).

Municipality of Anchorage Drainage Design Guidelines March 2007
Page A-8
3) Identify and map the longest flow path (if used in time of concentration calculations - see Section 7.2.2) for each downstream contributing area.
4) For existing conditions, estimate and tabulate landcover types, areas, and percent coverage for each downstream contributing area (see Section 5.5).
5) Map Hydrologic Soil Group (HSG) soil types for Naturally Vegetated Pervious landcover types.
6) Estimate and tabulate average land slopes within each contributing basin or subbasin.
7) Identify critical points; tabulate hydraulic characteristics for each typical critical point.
8) Segment the 10% conveyance route as necessary to reflect significant changes in typical conveyance section, slope, or storage. Map segment locations, tabulate lengths, and identify hydraulic section types, and annotate segments along the 10% conveyance route that will provide significant hydraulic storage.
c. A preliminary plat (pre-and post-topography) may be used to show the proposed development. Minimum scale of 1 inch = 500 feet or larger to ensure legibility should be used for all drainage areas. The plat is to show street layout and/or building location on a contour interval not to exceed 2 feet. The map must show on- and off-site conditions. The map must extend a minimum of 250 feet from the edge of the proposed preliminary plat boundary, or a distance specified by PM&E. The limits of swale and ditch easements should be established based upon the required design frequency. This includes 100-year overflow easements from stormwater controlled structures.
d. Proposed Drainage Map
1) Location and elevations of all referenced benchmarks. All elevations should be on MOA datum.
2) Proposed property lines (if known).
3) If the preliminary plat does not include proposed grades, submit a grading and erosion control plan showing existing and proposed streets, names, and approximate grades.
4) Existing drainage facilities and structures, including existing roadside ditches, drainageways, gutter flow directions, culverts, etc. Include al pertinent information such as size, shape, slope location, 100-year flood elevation, and floodway fringe line (where applicable).
5) Proposed storm sewers and open drainageways, right-of-way and easement width requirements, 100-year overland flow easement, proposed inlets, manholes, culverts, erosion and sediment control, water quality (pollution) control and energy dissipation devices, and other appurtenances.
6) Proposed outfall point for runoff from the study area.
7) The 100-year flood elevation and major storm floodway fringe (where applicable) are to be shown on the plans, report drawings, and plats (preliminary and final). In addition, the report should demonstrate that the stormwater system has adequate capacity to handle a 100-year storm event, or provisions are made for overland flow.
8) Show the critical minimum lowest opening elevation of a building for protection from major and minor storm runoff. This elevation is to be reviewed with PM&E to confirm if previous changes were made to the minimum lowest opening elevation for major storm event.

Municipality of Anchorage Drainage Design Guidelines March 2007
Page A-9
10. Calculations Appendix. Provide calculations for:
a. Runoff coefficients and/or curve numbers
b. Total impervious area (square feet and % of total drainage area)
c. Times of concentration and lag times
d. Peak flow rates and infiltration and detention volumes
e. Intake capacity, sewer design, and culvert design
f. Detention basin design – Show tabular stage-storage-discharge results and inflow/outflow hydrographs
g. Detention basin outlet design
h. Open channel flow calculations
i. Erosion protection design
11. Other Information Appendix
a. Soil map or geotechnical information.
b. Drainage Project Notification
c. Drainage Certification (if used to reduce reporting requirements for Crossing or Single Family Residential projects)
d. Copies of the Coastal Project Questionnaire (CPQ) and permit applications required by state and federal agencies where the project involves a stream or other water of the United States.
e. Approved variances.
12. Computer input and output. Attach
a. Hard copies of computer-generated reports and output if software was used. Underline and label results, such as the peak discharge.
b. Electronic copies of all computer model input and output on appropriate medium (CD, etc.) and descriptively labeled and dated. If proprietary software that emulates EPA SWMM is used, the electronic input files should be exported from the proprietary software to a form that can be used as input to EPA SWMM version 5.

Municipality of Anchorage Drainage Design Guidelines March 2007
Page A-10
Table A-1: Subbasin summary
SUBBASIN CHARACTERIZATION AND DISCHARGE SUMMARY Drainage Area Name: Total Drainage Area: Pre / Post Development Orographic Rainfall factor
Cover description Soil Name and Hydrologic Soil
Group A,B,C,D Slope, ft/ft or Cover
Condition SCS CN from Table 7-4
or C from Table 7-5 Area, acres Area in percent Weighted CN or C
Total Area: Total Weighted CN or C:
Time of Concentration (within Subbasin Routing)
General Parameters: Surface Cover n or k, Roughness
Factor (1) L, Flow Length, ft S, Longitudinal Slope, ft/ft Average Velocity ft/s Travel time,
Tt, hrs Channel Parameters: Cross Section Area, sq ft Wetted Perimeter, ft Channel Shape (2) Channel Side Slope (3) R, Hydraulic Radius, ft
Sheet Flow Tt=0.007(nL)0.8/(P2
0.5S)0.4)
n from Guidelines Table 7-7 Subtotal, Sheet Flow Tt:
Shallow Flow
Tt=V/L/3600; V=33k(S)0.5
k from Guidelines Table 7-8 Subtotal, Shallow Flow Tt: Channel Flow Tt=V/L/3600; V=(1.49/n)R0.67(S)0.5 n from Guidelines Table 7-9 Subtotal, Channel Flow
Tt
Total Tt, hours Runoff Summary Precipitation Runoff Peak discharge Total Storm volume
Storm inches inches cubic feet per second cubic feet or acre feet 1 Year
2 Year (P2) 10 Year
100 Year (1) Table 7-7, 7-8, or 7-9 (2) indicate cross-section shape, e.g., triangular, trapezoidal, rectangular (3) indicate horizontal: vertical ratio of side slopes

Municipality of Anchorage Drainage Design Guidelines March 2007
Page A-11
Table A-2: Hydrology summary (critical points) Design Flows Critical Point 1 Critical Point 2 Critical Point 3 Critical Point 4 Description 1 yr 10 yr 100 yr
Table A 3: Detention summary Detention Basin
A. Inlet design storm frequency: ________ B. Outlet design storm frequency: _______
Standard Release Rate
Extended detention release rate _____ cfs (if applicable) Flood Hazard release rate _____ cfs
Overflow Release Rate
B. Offsite developed (100-yr) Routed through basin ______ cfs Structures
A. Inflow structure: ____________ B. Outflow structure: ____________
Stage** Storage Outflow Comments (feet) (ac-ft) (cfs) 1 2 3 4 5 6 7 8 9 10
** Max. 1-foot interval

APPENDIX B RUNOFF THRESHOLD CALCUATIONS


Municipality of Anchorage Drainage Design Guidelines March 2007
Page B-1
RUNOFF THRESHOLD CALCULATION
Single-lot Residential Projects (types 1A, 1B, 1C, and 1D) and Small Projects (types Simple and Complex) are distinguished primarily by comparing post-development peak runoff rates for the 1-year, 24-hour and 10-year, 24-hour storm events to the threshold values. Projects above threshold values must implement additional drainage controls and satisfy additional design criteria. The following simplified approach may only be used for to determine threshold runoff rates. The use of this method is not required. Applicants should know that these calculations make simplifying assumptions that may not apply to their lot. Should a project exceed threshold values, recalculation using project specific parameters (time of concentration, rainfall intensities, etc.) will be required. Directions 1. Report the areas of post-development landcover for the project in acres for the following landcover types in
Table B-1. • Impervious surfaces: all paved driveways, roofs, decks, and other surfaces that will effectively block
the passage or penetration of water. • Barren surfaces: all surfaces except roads that lack vegetative cover but exhibit short-term depression
storage and infiltration capacity. • Lawn surfaces: all surfaces constructed and maintained as a mowed grass surface. • Naturally vegetated surfaces: all surfaces that predominantly retain or have been restored to an
undisturbed condition with respect to soils and vegetation (both canopy and understory).
Table B-1: Post-Development Landcover Area Fractions
Post-Development Landcover Description Area (acres) Area (decimal fraction) Barren surfaces Lawn surfaces Naturally vegetated surfaces Impervious surfaces (total)
TOTAL 1 2. Calculate decimal fractions of post-development landcover types tabulated in Table 1 by dividing the area of
each landcover type by the total lot area. Decimal fractions of all landcover types must add up to 1.0. 3. Calculate Weighed Rational Method Runoff coefficients. Single-family Residential may use Option 1 or
Option 2. Small projects must use Option 1.
Option 1 - Single Family Residential – Required if Option 2 is not used 1. Copy the values for landcover type as decimal fractions from Table B-1 to Table B-2. 2. In each row of Table B-2, multiply the area fraction by the default C value. 3. Add the results and enter the total in the lower right box in Table B-2.

Municipality of Anchorage Drainage Design Guidelines March 2007
Page B-2
Table B-2: Weighted C Calculation –Single Family Residential Option 1
Post-Development Landcover Description
Area (decimal fraction)
Default C Value
Calculation Result = Area x C
Barren surfaces x 0.55 Lawn surfaces x 0.22 Naturally vegetated surfaces x 0.16 Impervious surfaces x 0.86
TOTAL 1 ----
Option 2 Required for Small Projects and optional for Single Family Residential 1. Copy the values for landcover type as decimal fractions from Table B-1 to Table B-3. 2. Enter HSG and slope information into Table 3 for each land cover type. 3. Use Guidelines Table 7-5 to determine appropriate C values based on HSG and slope. 4. Multiply the area fraction by the C value in each row and enter as the calculation result. 5. Add the calculation results and enter the total in the lower right box in Table B-3.
Table B-3: Weighted C Calculation – Small Project or Option 2 Single Family Residential
Post-Development Landcover Description
Area (decimal fraction)
HSG Average
Slope (%)
C Value From Table
7-5
Calculation Result
= Area x C Barren surfaces Lawn surfaces Naturally vegetated surfaces Impervious surfaces
TOTAL 1 ---- ---- ----
4. For Small Projects, enter weighted C value from Table B-3 into the first column of Table B-4. For Single Lot Residential Projects, take the lowest weighted C value calculated in Tables B-2 and B-3 (if both options calculated) and enter into first column of Table B-4.
5. For each line in Table B-4, multiply C times applicable storm intensity and enter the result in the shaded
boxes. This is the runoff rate estimate to compare to threshold values. 6. If the threshold runoff rates are exceeded, additional design requirements apply. Recalculation of flows using
project specific values will be required for a final threshold determination and design calculations.
Table B-4: Runoff Calculations
Weighted C Default storm intensity 1 (i, inches/hour)
Runoff Rate = C x i (cfs/acre)
Threshold Runoff Rates (cfs/acre) 2
Single-Lot Small
1-year, 24-hour storm 0.547 0.73 0.22
10-year, 24-hour storm
1.018 1.379 0.41 1 Default storm intensities based on 9-minute duration for single-lot residential and 5-minute duration for small projects from Anchorage IDF curves. Slightly longer duration for single family residential based on greater portion of site with pervious cover. 1. 2 Threshold runoff rates are based on the given intensity and a weighted C of 0.3 for Small and 0.4 for Single-lot Residential projects.

Municipality of Anchorage Drainage Design Guidelines March 2007
Page B-3
Single-Lot Residential Project Runoff Threshold Calculation Report
Applicant Name Contact Information
(Phone and/or email)
Mailing Address
Property Description (subdivision, lot(s), and block)
Plat Number MOA Assessor's Office Property Identification Number
MOA Tracking Number(s) (Indicate which provided)
Lot Description Default Weighted C Table 7-5 Weighted C (not required)
Post-Development Landcover Type
Area (acres)
Area (decimal fraction)
Default C Value
Calculation Result
= Area x C HSG
Average Slope (%)
C Value From
Table 7-5
Calculation Result
= Area x C
Barren surfaces 0.55
Lawn surfaces 0.22
Naturally vegetated surfaces 0.16
Impervious surfaces
0.86
TOTAL 1 ----
---- ---- ----
Weighted C Default
storm intensity (i, inches/hour)
Runoff Rate = C x i
(cfs/acre)
Threshold Runoff Rates
(cfs/acre)
1-year, 24-hour storm 0.547 0.22
10-year, 24-hour storm 1.018 0.41
Note: Default storm intensities represent the 9-minute intensity from Anchorage IDF curves. Threshold runoff rates are based on the given intensity and a weighted C value of 0.4.
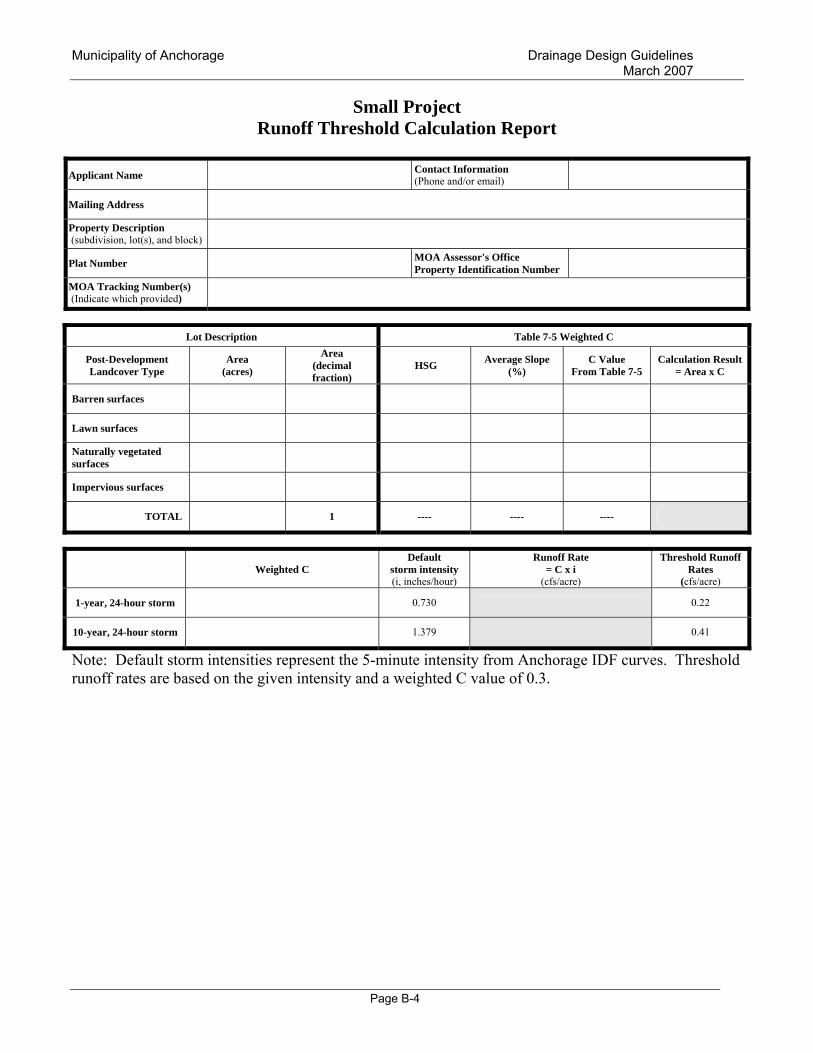
Municipality of Anchorage Drainage Design Guidelines March 2007
Page B-4
Small Project Runoff Threshold Calculation Report
Applicant Name Contact Information
(Phone and/or email)
Mailing Address
Property Description (subdivision, lot(s), and block)
Plat Number MOA Assessor's Office Property Identification Number
MOA Tracking Number(s) (Indicate which provided)
Lot Description Table 7-5 Weighted C
Post-Development Landcover Type
Area (acres)
Area (decimal fraction)
HSG Average Slope (%)
C Value From Table 7-5
Calculation Result= Area x C
Barren surfaces
Lawn surfaces
Naturally vegetated surfaces
Impervious surfaces
TOTAL 1 ---- ---- ----
Weighted C Default
storm intensity (i, inches/hour)
Runoff Rate = C x i
(cfs/acre)
Threshold Runoff Rates
(cfs/acre)
1-year, 24-hour storm 0.730 0.22
10-year, 24-hour storm 1.379 0.41
Note: Default storm intensities represent the 5-minute intensity from Anchorage IDF curves. Threshold runoff rates are based on the given intensity and a weighted C value of 0.3.

APPENDIX C GENERAL FRMS AND INFORMATION
Drainage Project Notification Drainage Certification
Drainage Statement of Compliance


Page C-1
DRAINAGE PROJECT NOTIFICATION AND WMS MAPPING REQUEST
Applicant Name * Contact Information * (Phone and/or email)
Mailing Address *
Property Description * (subdivision, lot(s), and block)
Plat Number MOA Assessor's Office Property Identification Number
MOA Tracking Number(s) (Indicate which provided)
Project Category * (Check one)
Crossing Single-Lot Residential Class 1A Class 1B Class 1C Class 1D Small Simple Complex Large Simple Complex
Parcel Physical Location * (Address and/or driving directions)
Requested Services*
Review of complete watercourse mapping (must submit mapping to be reviewed)
Watercourse site review services Feature flagging Notification prior to site visit requested. Notifications will be made using the contact information provided; however, contact cannot be guaranteed.
Scheduling for applicant presence on site also cannot be guaranteed. Requested completion date: . (Preferred completion date) No later than completion date: __ (Later completion may incur significant project delay).
Dates and service availability cannot be guaranteed. Scheduling is based on Planning Department priorities, request receipt order, and seasonal constraints (at minimum, mapping review requires cannels to be free of snow and ice.)
* Required Information
Attachments:
Watercourse mapping (to scale) clearly showing all known streams and major drainageways (reconnaissance level or final depending on service) and the name and location(s) of receiving waters
Certification:
By signature below, I certify that I am legally entitled to authorize the requested services and that the attachments provided are complete and accurate representations of known site conditions and project plans. I further authorize Municipality of Anchorage (MOA) personnel to access the referenced site on foot for the purposes of identifying and / or mapping drainage features. This form and its attachments constitute my notice to the MOA that I am developing plans for a drainage project or platting action and will be submitting a report of existing or proposed drainage conditions. I understand that all drainage projects are governed by the MOA Project Management and Engineering Design Criteria Manual, the MOA Drainage Design Guidelines, the Anchorage Municipal Code, and other state and federal regulations and permits. Signed Date

Page C-2
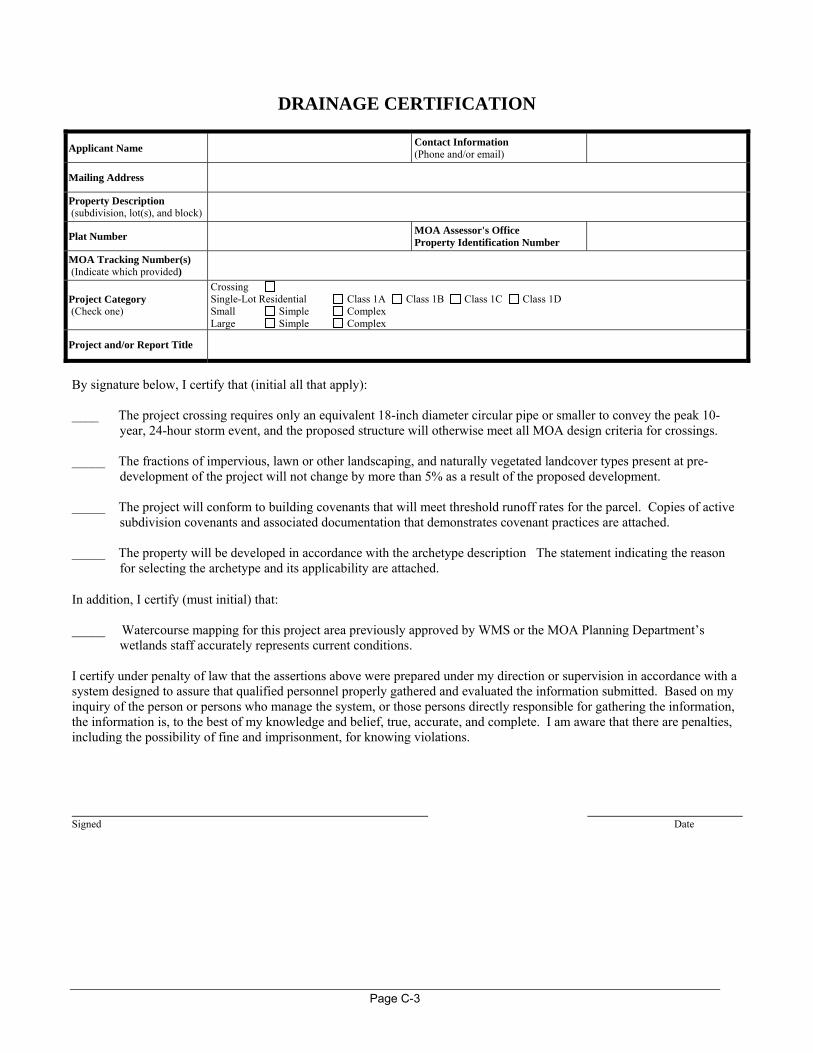
Page C-3
DRAINAGE CERTIFICATION
Applicant Name Contact Information (Phone and/or email)
Mailing Address
Property Description (subdivision, lot(s), and block)
Plat Number MOA Assessor's Office Property Identification Number
MOA Tracking Number(s) (Indicate which provided)
Project Category (Check one)
Crossing Single-Lot Residential Class 1A Class 1B Class 1C Class 1D Small Simple Complex Large Simple Complex
Project and/or Report Title
By signature below, I certify that (initial all that apply): ____ The project crossing requires only an equivalent 18-inch diameter circular pipe or smaller to convey the peak 10-
year, 24-hour storm event, and the proposed structure will otherwise meet all MOA design criteria for crossings. _____ The fractions of impervious, lawn or other landscaping, and naturally vegetated landcover types present at pre-
development of the project will not change by more than 5% as a result of the proposed development. _____ The project will conform to building covenants that will meet threshold runoff rates for the parcel. Copies of active
subdivision covenants and associated documentation that demonstrates covenant practices are attached. _____ The property will be developed in accordance with the archetype description The statement indicating the reason
for selecting the archetype and its applicability are attached.
In addition, I certify (must initial) that: _____ Watercourse mapping for this project area previously approved by WMS or the MOA Planning Department’s
wetlands staff accurately represents current conditions. I certify under penalty of law that the assertions above were prepared under my direction or supervision in accordance with a system designed to assure that qualified personnel properly gathered and evaluated the information submitted. Based on my inquiry of the person or persons who manage the system, or those persons directly responsible for gathering the information, the information is, to the best of my knowledge and belief, true, accurate, and complete. I am aware that there are penalties, including the possibility of fine and imprisonment, for knowing violations. Signed Date

Page C-4

Page C-5
DRAINAGE STATEMENT OF COMPLIANCE
Applicant Name Contact Information (Phone and/or email)
Mailing Address
Property Description (subdivision, lot(s), and block)
Plat Number MOA Assessor's Office Property Identification Number
MOA Tracking Number(s) (Indicate which provided)
Project Category (Check one)
Crossing Single-Lot Residential Class 1A Class 1B Class 1C Class 1D Small Simple Complex Large Simple Complex
Project and/or Report Title
By signature below, I certify that I am legally responsibly for the drainage project described above and in the attached drainage report, and that it has been prepared in compliance with the MOA Project Management and Engineering Design Criteria Manual, the MOA Drainage Design Guidelines, the Anchorage Municipal Code, and other state and federal regulations and permits. I certify that the drainage report and all attachments were prepared under my direction or supervision in accordance with a system designed to assure that qualified personnel properly gathered and evaluated the information submitted. Based on my inquiry of the person or persons directly responsible for gathering the information, the information is, to the best of my knowledge and belief, true, accurate, and complete. Signed Date

Page C-6

Page C-7
DRAINAGE PROJECT SAMPLE CHARACTERIZATION
The following tables are examples of report formats for characterization of features and landcover. The designer is always responsible for tabulating all characteristics used for design. Features must be clearly identified on mapping and follow terminology, system relationships, and using naming conventions from the Guidelines. Be sure to include report or applicant information with all submittals.
Applicant Name Contact Information (Phone and/or email)
Mailing Address
Property Description (subdivision, lot(s), and block)
Plat Number MOA Assessor's Office Property Identification Number
MOA Tracking Number(s) (Indicate which provided) Zoning
Project Category (Check one)
Crossing Single-Lot Residential Class 1A Class 1B Class 1C Class 1D Small Simple Complex Large Simple Complex
The following are minimum landcover characteristics to be tabulated for the project area.
Total Project Area
Pre-development (Existing) Post-Development
Landcover Type Area (acres)
Area (% of total)
Area (acres)
Area (%)
Total Impervious
Roads Impervious (Total)
Roads Impervious (Width - feet)
Roads Impervious (Width - feet)
Roads Impervious (Width - feet)
Lots Impervious
Other Impervious
Total Pervious
Barren Pervious
Landscaped Pervious
Lawns
Naturally Vegetated Pervious
Total

Page C-8
Landcover information must also be tabulated for each identified drainage basin. Where used, an average per lot type should also be included.
Area (acres)
Area (% of basin)
Slope (%)
HSG Soil Class.
Area (acres)
Area (% of basin)
Slope (%)
HSG Soil Class.
Landcover Type
Total Impervious
Roads Impervious (Total)
Road Segment(Width - feet)
Lots Impervious
Other Impervious
Total Pervious
Barren Pervious
Landscaped Pervious
Lawns
Naturally Vegetated Pervious
Name/Id Number Material Slope (%)
Manning’s Roughness (“n”) Shape Length
Roads
Road Segment 3 - cross-slope - grade
Culverts
Culvert 1 – under Driveway 1
Culvert 2 – under Road Segment 3
Total

APPENDIX D SCS TYPE 1 24-HOUR RAINFALL DISTRIBUTION


Page D-1
SCS Type I Cumulative Dimensionless 24-hour Rainfall Distribution
From: USDA SCS 1973 SCS-TP-149 “A Method for Estimating Volume and Rate of Runoff in Small Watersheds”
Time
(hour) Cumulative
Fraction Time (hour)
Cumulative Fraction
0 0 10 0.515 2 0.035 10.5 0.583 4 0.076 11 0.624 6 0.125 11.5 0.654 7 0.156 12 0.682 8 0.194 13 0.727
8.5 0.219 14 0.767 9 0.254 16 0.83
9.5 0.303 20 0.926 9.75 0.362 24 1
SCS Type I Cumulative Dimensionless 24-hour Rainfall Distribution in 30-minute (0.5 hour) increments (McCuen, et al., 2002)
Time
(hour) Cumulative
Fraction Time (hour)
Cumulative Fraction
Time (hour)
Cumulative Fraction
Time (hour)
Cumulative Fraction
0.5 0.008 6.5 0.14 12.5 0.706 18.5 0.893 1 0.017 7 0.156 13 0.728 19 0.905
1.5 0.026 7.5 0.174 13.5 0.748 19.5 0.916 2 0.035 8 0.194 14 0.766 20 0.926
2.5 0.045 8.5 0.219 14.5 0.783 20.5 0.936 3 0.055 9 0.254 15 0.799 21 0.946
3.5 0.065 9.5 0.303 15.5 0.815 21.5 0.956 4 0.076 10 0.515 16 0.83 22 0.965
4.5 0.087 10.5 0.583 16.5 0.844 22.5 0.974 5 0.099 11 0.624 17 0.857 23 0.983
5.5 0.112 11.5 0.655 17.5 0.87 23.5 0.992 6 0.126 12 0.682 18 0.882 24 1

Page D-2
SCS Type I Cumulative 24-hour Rainfall Distribution in 6-minute (0.1 hour) increments Time
(hour) Cumulative
Fraction Time (hour)
Cumulative Fraction
Time (hour)
Cumulative Fraction
Time (hour)
Cumulative Fraction
0.1 0.0017 6.1 0.1276 12.1 0.6892 18.1 0.8885 0.2 0.0035 6.2 0.1303 12.2 0.6944 18.2 0.8910 0.3 0.0052 6.3 0.1332 12.3 0.6995 18.3 0.8934 0.4 0.0070 6.4 0.1361 12.4 0.7044 18.4 0.8958 0.5 0.0087 6.5 0.1391 12.5 0.7092 18.5 0.8982 0.6 0.0105 6.6 0.1423 12.6 0.7140 18.6 0.9006 0.7 0.0122 6.7 0.1456 12.7 0.7186 18.7 0.9030 0.8 0.0139 6.8 0.1489 12.8 0.7232 18.8 0.9054 0.9 0.0157 6.9 0.1524 12.9 0.7276 18.9 0.9077 1.0 0.0174 7 0.1560 13 0.7320 19 0.9100 1.1 0.0192 7.1 0.1597 13.1 0.7362 19.1 0.9123 1.2 0.0210 7.2 0.1633 13.2 0.7404 19.2 0.9146 1.3 0.0227 7.3 0.1671 13.3 0.7444 19.3 0.9168 1.4 0.0245 7.4 0.1708 13.4 0.7484 19.4 0.9190 1.5 0.0262 7.5 0.1746 13.5 0.7523 19.5 0.9212 1.6 0.0280 7.6 0.1784 13.6 0.7560 19.6 0.9234 1.7 0.0297 7.7 0.1823 13.7 0.7596 19.7 0.9256 1.8 0.0315 7.8 0.1861 13.8 0.7632 19.8 0.9278 1.9 0.0332 7.9 0.1901 13.9 0.7667 19.9 0.9299 2.0 0.0350 8 0.1940 14 0.7700 20 0.9320 2.1 0.0368 8.1 0.1982 14.1 0.7733 20.1 0.9341 2.2 0.0386 8.2 0.2027 14.2 0.7766 20.2 0.9362 2.3 0.0404 8.3 0.2077 14.3 0.7798 20.3 0.9382 2.4 0.0423 8.4 0.2132 14.4 0.7830 20.4 0.9402 2.5 0.0442 8.5 0.2190 14.5 0.7862 20.5 0.9423 2.6 0.0461 8.6 0.2252 14.6 0.7894 20.6 0.9442 2.7 0.0480 8.7 0.2318 14.7 0.7926 20.7 0.9462 2.8 0.0500 8.8 0.2388 14.8 0.7958 20.8 0.9482 2.9 0.0520 8.9 0.2462 14.9 0.7989 20.9 0.9501 3.0 0.0540 9 0.2540 15 0.8020 21 0.9520 3.1 0.0561 9.1 0.2623 15.1 0.8051 21.1 0.9539 3.2 0.0582 9.2 0.2714 15.2 0.8082 21.2 0.9558 3.3 0.0603 9.3 0.2812 15.3 0.8112 21.3 0.9576 3.4 0.0625 9.4 0.2917 15.4 0.8142 21.4 0.9594 3.5 0.0647 9.5 0.3030 15.5 0.8172 21.5 0.9613 3.6 0.0669 9.6 0.3194 15.6 0.8202 21.6 0.9630 3.7 0.0691 9.7 0.3454 15.7 0.8232 21.7 0.9648 3.8 0.0714 9.8 0.3878 15.8 0.8262 21.8 0.9666 3.9 0.0737 9.9 0.4632 15.9 0.8291 21.9 0.9683 4.0 0.0760 10 0.5150 16 0.8320 22 0.9700 4.1 0.0784 10.1 0.5322 16.1 0.8349 22.1 0.9717 4.2 0.0807 10.2 0.5476 16.2 0.8378 22.2 0.9734 4.3 0.0831 10.3 0.5612 16.3 0.8406 22.3 0.9750 4.4 0.0855 10.4 0.5730 16.4 0.8434 22.4 0.9766 4.5 0.0878 10.5 0.5830 16.5 0.8462 22.5 0.9783 4.6 0.0902 10.6 0.5919 16.6 0.8490 22.6 0.9798 4.7 0.0926 10.7 0.6003 16.7 0.8518 22.7 0.9814 4.8 0.0951 10.8 0.6083 16.8 0.8546 22.8 0.9830 4.9 0.0975 10.9 0.6159 16.9 0.8573 22.9 0.9845 5.0 0.1000 11 0.6230 17 0.8600 23 0.9860 5.1 0.1024 11.1 0.6298 17.1 0.8627 23.1 0.9875 5.2 0.1049 11.2 0.6365 17.2 0.8654 23.2 0.9890 5.3 0.1073 11.3 0.6430 17.3 0.8680 23.3 0.9904 5.4 0.1098 11.4 0.6493 17.4 0.8706 23.4 0.9918 5.5 0.1123 11.5 0.6550 17.5 0.8733 23.5 0.9933 5.6 0.1148 11.6 0.6615 17.6 0.8758 23.6 0.9946 5.7 0.1174 11.7 0.6674 17.7 0.8784 23.7 0.9960 5.8 0.1199 11.8 0.6731 17.8 0.8810 23.8 0.9974 5.9 0.1225 11.9 0.6786 17.9 0.8835 23.9 0.9987 6 0.1250 12 0.6840 18 0.8860 24 1

APPENDIX E EXAMPLE CALCULATIONS


Municipality of Anchorage Drainage Design Guidelines March 2007
Page E-1
Adjustment for directly and indirectly connected impervious areas (McCuen, 2002)
CNc=CNp+(Pi/100)(98-CNp)(1-0.5R) Where:
CNc = composited CN adjusted for indirectly connected impervious surfaces CNp= composited CN for the pervious fraction of the basin Pi= percent imperviousness (for Pi<30%) R= IDCI/Pi = ratio of unconnected (indirectly connected) impervious area to the total impervious
area. Use values from Table 7-6 to for IDCI. 1. Given a basin with 28% impervious, residential, with curb and gutter and piped system, as follows:
Assigned Faction Indirectly Connected
Impervious Area (IDCI)
Directly connected Impervious Area
(DCI) Pervious
Area Fraction of Total Area
Type of Impervious Surface CN
weighted CN
0.50 0.50 0.09 roofs 98 8.82 1.00 0.06 driveways 98 5.88 1.00 0.13 streets 98 12.74
1.00 0.22 lawn 79 17.38 1.00 0.50 natural vegetation 73 36.5 weighted CN, no adjustment 81.32 CNp 0.22 * 79 + 0.5 * 73 / (0.22+.5) = 74.83 weighted CN for pervious areas Pi: 0.09 + 0.06 + 0.13 = 28% percent impervious IDCI 0.5*0.09 = 0.45 unconnected impervious (0.5 from Table 7-6) R: IDCI / Pi = 0.045 / 0.28 = 0.16 ratio indirectly connected impervious : total impervious Composite weighted CNc: CNc = CNp+(Pi/100)(98-CNp)(1-0.5R) = 74.83 + (28/100)(98-74.83)*(1-0.5*0.16) = 80.8 Example 2. Given a basin with 28% impervious, with roadside ditches and slope > 6%, as follows:
Assigned Faction
Indirectly Connected Impervious Area (IDCI)
Directly connected Impervious Area
(DCI) Pervious
Area Fraction of Total Area
Type of Impervious Area CN
weighted CN
0.75 0.25 0.09 Roofs 98 8.82 0.50 0.50 0.06 driveways 98 5.88 0.75 0.25 0.13 streets 98 12.74
1.00 0.22 lawn 79 17.38 1.00 0.5 natural vegetation 73 36.5 weighted CN, no adjustment 81.32 CNp: 74.83=0.22*79+0.5*73/(0.22+0.5) weighted CN for pervious areas Pi: 0.28 = 0.09 + .06 + 0.13 percent impervious IDCI: 0.20= 0.75*0.09 + 0.05*0.06 + .075*0.13 unconnected impervious (0.5 from Table 7-6) R: 0.70 = 0.195 / 0.28 ratio indirectly connected impervious : total impervious Composite weighted CNc CNc = CNp+(Pi/100)(98-CNp)(1-0.5R) = 74.83 + (28/100)(98-74.83)*(1-0.5*0.7) = 79.06

Municipality of Anchorage Drainage Design Guidelines March 2007
Page E-2
Pre and Post Development Land Cover Adjustment This table is not meant to provide a complete report format but to provide additional clarification of the calculation and use of the landcover adjustment values in Table 5-1.
Community Management Landcover Adjustment Examples
New or Redeveloped Project Type Proposed
Land Use
Proposed Post-Development
Landcover Type
Proposed Post-Development
Landcover Area (%)
Adjusted Pre-Development Landcover Area
(%)
Total Impervious 40 35 (from Table 5-1) Re-Development
Single-Lot Residential
Lower Density Total Pervious 60 100 – 35 = 65
Total Impervious 30 0 (from Table 5-1) New Development
Single-Lot Residential
Lower Density Total Pervious 70 100 - 0 = 100
Total Impervious 40 0 New Development
Small or Large Project
Lower Density Total Pervious 60 100 – 0 = 100
Total Impervious 100 17.5+31.5+12 = 61
Parking 50 50*0.35 (from Table 5-1) =17.5
Buildings 35 35*0.9 (from Table 5-1) = 31.5
Street Access 15 15*0.8 (from Table 5-1) =12
New Development Small Project Higher
Density
Total Pervious 0 100 - (17.5+31.5+12) = 39 Note that for new development, pre-development landcover is frequently 100% naturally vegetated.

APPENDIX F INFORMATION SOURCES


Municipality of Anchorage Drainage Design Guidelines March 2007
Page F-1
A substantial amount of data and supporting information and tools are required to perform even a relatively basic hydrologic analyses for a project. Fortunately an abundant literature and a wealth of computer automation, both public and private, exists providing technical support for this type of work. In addition growing sources of local data, particularly those developed and compiled by PM&E staff and contractors, can ease substantially the burden of identifying and mapping area drainage systems and receiving waters. Of course, a large part of the base data collection effort will always remain project-specific and the ultimate responsibility of designers to obtain. Nevertheless, knowing where and how to obtain existing data and tap technical resources will greatly ease and speed the designer’s (and PM&E’s review) efforts. This section provides an introduction to a few of these opportunities, focusing primarily on references and tools cited in this document and on availability of local mapping resources.
Basin Information and Mapping
Although it is the responsibility of the designer to provide all necessary data to assess and design project drainage and drainage controls, substantial areawide drainage and receiving waters mapping is maintained and regularly updated by the MOA. The MOA maintains and updates a range of geographical information system (GIS) feature classes useful to drainage analysis. Basic geographic feature sets maintained by the MOA include:
o Elevation o Roads o ROWs o Zoning o Parcels
Hydrography mapping data maintained by the MOA as corporate (‘enterprise’) GIS feature classes includes:
o Marine features o Wetland features o Stream features o Lake features
In addition PM&E’s Watershed Management Services (WMS) Division supports and updates additional hydrography feature classes as ‘beta’ files (internally reviewed but non-corporate files), including:
o Watersheds o Subdrainage basins o Drainageways o Isopluvial contours
All data, both ‘enterprise’ and ‘beta’ is maintained in ESRI geodatabase containers and is available as shapefiles. Corporate-level data can be purchased through the Municipal IT Department (http://munimaps.muni.org/common/GIS_portal_entry_gold/gis_portal_entry.htm). Corporate and ‘beta’ hydrography data and detailed metadata files can be downloaded from the WMS website (http://wms.geonorth.com/).

Municipality of Anchorage Drainage Design Guidelines March 2007
Page F-2
WMS also maintains a physical library at their offices, including hardcopies of drainage studies and preliminary drainage design documents. Document availability in the WMS library can be searched using keywords and document metadata by downloading the library hardcopy database, also available off the WMS website. Documents archived in the library can be reviewed at WMS offices and, where duplicate copies are available, checked out for 24 hours for copying.
Models and Analytical Tools
A wide variety of models and analytical tools are available for use in drainage analysis applications, both public and private. Some of the more common analytical methods and more widely applied public-domain hydrology models have been identified and briefly addressed in these Guidelines. These Guidelines, however, are not intended to supplant the abundance of guidance, information and tools available in the literature and on-line. The selected references listed at the end of this document provide much more detailed discussions of the methods and parameters discussed in these Guidelines, and in many cases include step-wise approaches and examples in performing many basic hydrologic analyses and calculations. Some of the references and tools listed in this document are available for download from the WMS website. However, many of these documents and all the public domain software identified in these Guidelines are also commonly available on-line from a variety of publicly and privately sponsored websites. The following agencies and internet sites are particularly useful as sources of basic hydrologic technical information and guidance.
National Weather Service (NWS)
The National Weather Service (NWS) collects and distributes climatic information for the United States and has compiled storm statistics in its document TP47, “Probable Maximum Precipitation and Rainfall Frequency Data for Alaska.” Precipitation data -- http://hdsc.nws.noaa.gov/hdsc/pfds/other/ak_pfds.html TP47, including isopluvial maps for different duration and return period storm events, is available for download from this site.
Natural Resources Conservation Service (NRCS)
The Natural Resources Conservation Service (NRCS—previously the Soil Conservation Service or SCS) provides a wide range of technical information and tools on its websites, including information on hydrology and drainage analysis, soils, and channel and basin design. Engineering tools -- http://www.info.usda.gov/CED/ A wide range of technical documents and computer programs can be downloaded from this webpage using a nest of radio buttons to navigate. This particular page is an excellent site for finding and downloading almost any NRCS document or program if you already know what you want. Soils manual -- http://soils.usda.gov/technical/manual/ The 1993 Soil Survey Manual is available for purchase as a hardcopy but can also be downloaded from this site as a *.pdf file. Chapter 3 of this manual (referenced in these Guidelines) includes detailed discussion of classification and characterization of soil infiltration qualities.

Municipality of Anchorage Drainage Design Guidelines March 2007
Page F-3
NEH handbook -- http://www.wcc.nrcs.usda.gov/hydro/hydro-techref.html The National Engineering Handbook, including detailed discussions of SCS’ unit hydrograph technology, can be downloaded from this site. Technical Paper (TP) 149 summarizing the basic theory behind the SCS Methodology, and technical discussions of roughness values and sheet flow processes, can also be downloaded here. Hydrology home -- http://www.wcc.nrcs.usda.gov/hydro/ This is the homepage for a nest of webpages containing information, software tools, technical references and contacts supporting hydrology and hydraulics analysis. TR-series software -- http://www.wcc.nrcs.usda.gov/hydro/hydro-tools-models.html The hydrology programs WinTR-20, WinTR-55, and the older version TR-55 (see the ‘Other Models’ hotlink) along with associated users’ guides and manuals (which include some of parameter lists identified in these Guidelines) can be downloaded from this site. Web Soil Survey - http://websoilsurvey.nrcs.usda.gov/app/ This is the homepage for access to the NRCS database of site-specific soils information.
The Federal Highway Administration (FHWA)
The Federal Highway Administration (FHWA), an agency of the U.S. Department of Transportation, in part provides national oversight of design and safety of roads and highways. This agency provides a broad range of support services for drainage analysis, including development of design and analytical standards and technical information and software. Highway hydrology -- http://www.fhwa.dot.gov/engineering/hydraulics/hydrology/index.cfm This webpage provides download of McCuen’s design and analysis document HDS2, ‘Highway Hydrology’ Culvert hydrology -- http://www.fhwa.dot.gov/engineering/hydraulics/culverthyd/index.cfm HDS5, ‘Hydraulic Design of Highway Culverts’ and HDS22, ‘Urban Drainage Design Manual’ can be downloaded from this site. HDS5 provides culvert design graphs that could be very useful in rapidly assessing impacts of routed project flows through downstream conveyances. HY8, a culvert hydraulics analytical software package, is also available for download from this page.
Hydrologic Engineering Center (HEC)
The Hydrologic Engineering Center (HEC) is an agency within The USACE that provides expertise in surface and ground water hydrology, including development of hydrologic analysis computer programs. HEC software -- http://www.hec.usace.army.mil/ The program HEC-HMS 3.0.1 and a variety of users’ guides and technical documents can be downloaded from this site.
Storm Water Management Model (SWMM)
The Center for Exposure Assessment Modeling (CEAM), an agency of the EPA, supports development and distribution of a range of hydrology and water quality models including SWMM.

Municipality of Anchorage Drainage Design Guidelines March 2007
Page F-4
SWMM model -- http://www.epa.gov/ceampubl/swater/index.htm Download the latest ‘gui’ Windows version, SWMM 5.0.007, from this site. Current users’ documentation and guidance is also available off this site. SWMM development -- http://ccee.oregonstate.edu/swmm/ Oregon State University has long been a core supporter of the SWMM hydrology and hydraulics software development program and operates a website that is essential to any serious SWMM modeler. The university SWMM site usually has the most current technological information regarding this program though current model information is obtained from the EPA site. Though the EPA site provides the latest manuals, some of the older manuals, particularly the manual published in the late ‘80’s for SWMM version 4, have much more detailed descriptions of the physical processes represented by model algorithms, and can be downloaded from a hotlink on this site, courtesy of Boss International. State of Alaska The Coastal Project Questionnaire (CPQ) available from the State of Alaska Department of Natural Resources, Alaska Coastal Zone Management Program at http://www.alaskacoast.state.ak.us/

APPENDIX G 10% METHOD DOWNSTREAM ANALYSIS


Municipality of Anchorage Drainage Design Guidelines March 2007
Page G-1
Communities, including the Municipality of Anchorage (MOA), generally regulate design of local drainage systems to minimize flooding risk based on an estimated performance of the proposed system including existing and future upstream and downstream drainage systems. Local drainage systems must be designed to convey upstream flows that may result from expected future upstream development. Similarly, flows discharged from the area served by the proposed drainage must be controlled so as not to exceed some threshold impact on downstream receiving watercourses. Thus, a complete analysis of the impact of proposed drainage systems on area drainage requires assessment of three basic elements:
1. Upstream drainage systems that collect and direct flows into the project area and proposed drainage system;
2. The area that contributes runoff directly to the proposed drainage system and the controls proposed to manage those flows; and
3. The downstream watercourses receiving flows discharged from the proposed drainage system.
To assess the impact of new drainage systems, identification of upstream contributing areas and the area contributing runoff directly to the new system is required. This is generally a simple task. Downstream watercourses receiving the new drainage must also be identified, also generally involving a relatively simple effort. Difficulty arises in deciding at what point along the downstream watercourses the flows from the new upstream drainage will no longer have the potential to impact the downstream conveyances.
The MOA, like a number of other communities across the United States, establishes this downstream zone of influence through application of a process called the 10% Method (see Figure A-1). The 10% Method assumes that the zone of influence extends from the discharge point of a new drainage system to the point (10% point) along the downstream conveyance at which the total contributing area below the new drainage is nine times the contributing area of the new drainage system alone. That is, the project drainage area makes up 10% of the contributing area, at and below the proposed discharge point. Note that the total area used in defining the location of the 10% point includes only the project drainage area itself and all areas downstream of the proposed drainage that contribute surface water flows to the 10% point. This entire area is called the 10% area. Any drainage areas upstream of proposed drainage systems (upstream contributing areas) are not included in calculating the position of the 10% point and are not part of the 10% area. However, these upstream areas are still considered in designing conveyance capacities for any proposed drainage structures for the project.
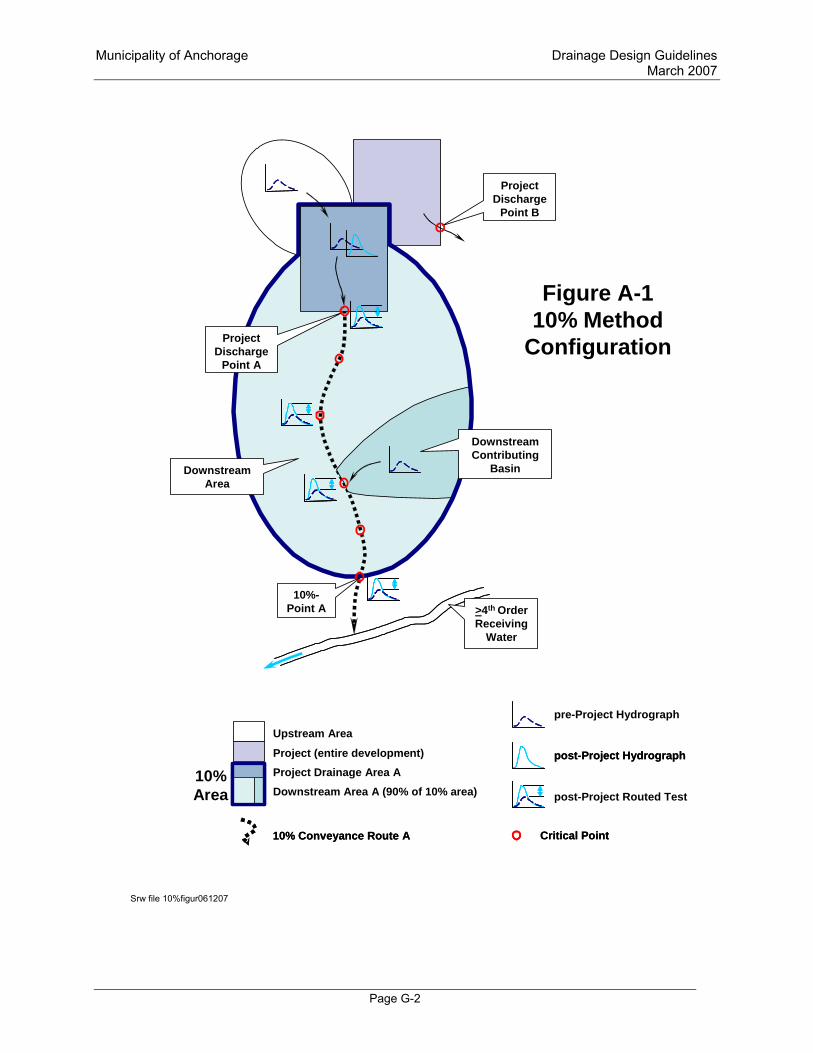
Municipality of Anchorage Drainage Design Guidelines March 2007
Page G-2
Figure A-110% Method
Configuration
10%-Point A
Downstream Contributing
Basin
>4th Order Receiving
Water
Project Drainage Area ADownstream Area A (90% of 10% area)
Upstream Area
10%Area
10% Conveyance Route A10% Conveyance Route A Critical PointCritical Point
pre-Project Hydrograph
post-Project Routed Test
post-Project Hydrographpost-Project HydrographProject (entire development)
Project Discharge
Point A
Project Discharge
Point B
Srw file 10%figur061207
Downstream Area

Municipality of Anchorage Drainage Design Guidelines March 2007
Page G-3
For the MOA, some exceptions exist to the concept described above for locating the 10% point. Specifically, where tidewaters or a large stream lie closer to the project discharge point than would an area-calculated 10% point, the 10% point is located at the boundaries of these larger receiving waters. This effectively moves the 10% point to the mean high water line where downstream conveyances reach tidewaters, and the ordinary high water line where downstream conveyances reach a 4th order or larger stream. Stream order shall be as designated by WMS, generally based on current MOA mapping, and application of Strahler’s method (Strahler, 1957).
For MOA drainage analyses, the point of discharge from a proposed drainage system is generally called a project discharge point. A project discharge point is any point at which integrated storm water runoff or stream flows (smaller than 4th order) exit a project area. Note that a single project may include more than one project discharge point and each project discharge point has an associated 10% point.
Flows discharge from a project discharge point and flow along a downstream conveyance route that extends from a project discharge point to the 10% point. The downstream conveyance route is the actual flow route taken by some or all post-development surface runoff waters from a project discharge point to its associated 10% point. Therefore, a downstream conveyance route may be made up of natural or constructed drainageways, small streams, or a combination of these. If construction of a downstream conveyance path is proposed as part of a project, this path may be identified as the downstream conveyance route, but such use shall be dependent upon demonstrated compliance with all state, federal, and local permitting requirements as well as other downstream impact analyses requirements.
As described above, the 10% area includes either part or all of the area served by the proposed drainage system (a project drainage area) as well as a downstream area that lies outside and generally downslope of the project discharge point. The downstream area typically will be made up of a number of small basins (downstream contributing basins), each of which discharge runoff to a specific confluence point along the downstream conveyance route.
The MOA’s 10% method also identifies critical points along the 10% conveyance route. In general, critical points include any location along a 10% conveyance route at which changes in post-development flows from the new drainage increase the probability of damaging or causing failure of the downstream conveyance system. Critical points are identified as downstream locations at which analyses shall be performed to estimate pre- versus post-development peak flow and stage, hydrographs, and other key characteristics of routed storm water flows. Analyses required at critical points may include:
• Pre- and post-development hydrographs;
• Pre- and post-development peak flow and stage;
• Peak velocities;
• Channel stability;
• Maximum overtopping depth and duration;
• Storage and storage characteristics;
• Surcharge and other pressure flow conditions;
• Icing potential; and

Municipality of Anchorage Drainage Design Guidelines March 2007
Page G-4
• Other critical conveyance performance measures.
At a minimum, the following points along the 10% conveyance route shall be identified and assessed as critical points:
• Project discharge point;
• 10% point;
• Downstream contributing basin confluences; and
• Any point along the 10% conveyance route at which flow constriction, overflow, backwater, pronounced changes in flow momentum, channel or bank erosion, or icing are more likely to occur than at other locations along the route.
At a minimum, calculations are required for the project discharge point and the 10% point. Designers need not provide calculations at all identified critical points, but should prepare and submit analyses for representative critical points. Therefore, demonstration of adequate performance of a representative critical point under post-development flows will be considered an acceptable demonstration of adequate performance of other similar but less-sensitive critical points along a conveyance route. The number of critical points requiring assessment will thus be dependent ultimately upon the number of primary features listed above and the range of critical factors or conditions present along a given 10% conveyance route. Examples of this might include calculations for:
• A typical or worst-case (most constrictive) driveway culvert along a long, straight drainageway; or
• The point where overtopping is first expected to occur along a constricted stretch of a drainageway.
Where critical points are grouped or discounted, justification must be provided.
References: Strahler. 1957, ‘Quantitative Analysis of Watershed Geomorphology’; Trans. Am. Geophys. Union, Vol. 38, pg. 913-920.