murex: a land-surface field experiment to study the annual ... · pdf filemurex: a...
TRANSCRIPT

MUREX: a land-surface ®eld experiment to studythe annual cycle of the energy and water budgets
J.-C. Calvet1, P. Bessemoulin1, J. Noilhan1, C. Berne1, I. Braud2, D. Courault3, N. Fritz1, E. Gonzalez-Sosa2,J.-P. Goutorbe1, R. Haverkamp2, G. Jaubert1, L. Kergoat4, G. Lachaud1, J.-P. Laurent2, P. Mordelet5,A. Olioso3, P. Pe ris1, J.-L. Roujean1, J.-L. Thony2, C. Tosca5, M. Vauclin2, D. Vignes5
1 Me te o-France, CNRM/GAME, URA CNRS 1357, 31057 Toulouse Cedex 1, France2 LTHE, UMR CNRS 5564, INPG, ORSTOM, UJF, BP53 38041 Grenoble Cedex 9, France3 INRA Bioclimatologie, 84914 Avignon Cedex 9, France4 Laboratoire d'Ecologie Terrestre, UMR CNRS 5552, 31405 Toulouse Cedex 4, France5 CESBIO, UMR CNRS 141, 31401 Toulouse Cedex 4, France
Received: 9 September 1998 / Revised: 25 February 1999 /Accepted: 26 February 1999
Abstract. The MUREX (monitoring the usable soilreservoir experimentally) experiment was designed toprovide continuous time series of ®eld data over a longperiod, in order to improve and validate the Soil-vegetation-Atmosphere Transfer (SVAT) parameterisat-ions employed in meteorological models. Intensivemeasurements were performed for more than threeyears over fallow farmland in southwestern France. Tocapture the main processes controlling land-atmosphereexchanges, the local climate was fully characterised, andsurface water and energy ¯uxes, vegetation biomass, soilmoisture pro®les, surface soil moisture and surface andsoil temperature were monitored. Additional physiolog-ical measurements were carried out during selectedperiods to describe the biological control of the ¯uxes.The MUREX data of 1995, 1996, and 1997 arepresented. Four SVAT models are applied to the annualcycle of 1995. In general, they succeed in simulating themain features of the fallow functioning, although someshortcomings are revealed.
Key words. Hydrology (evapotranspiration; soilmoisture; water-energy interactions).
1 Introduction
The MUREX (monitoring the usable soil reservoirexperimentally) experiment (Bessemoulin et al., 1996;Calvet et al., 1998a) was initiated in 1994. At that time,a number of large-scale ®eld experiments focused onland surface-atmosphere interactions had already been
carried out, e.g. HAPEX-MOBILHY (Andre et al.,1986), FIFE (Sellers et al., 1992), EFEDA (Bolle et al.,1993), and HAPEX-Sahel (Goutorbe et al., 1997). Thesecampaigns allowed successful calibration and validationof several soil-vegetation-atmosphere transfer models(hereafter denoted as SVATs), e.g. the ISBA (interactionbetween soil, biosphere, and atmosphere) scheme devel-oped by Noilhan and Planton (1989) suitable forcoupling with meteorological or climate models, or thedetailed SiSPAT scheme (simple soil-plant-atmospheretransfer model) designed by Braud et al. (1995). Thedevelopment and implementation of SVATs in generalcirculation models (GCM) or climate models clearlydemonstrated the positive impact of good representa-tions of vegetation in atmospheric models, particularlyits ability to modify turbulent and radiative exchanges,and to modulate the extraction of soil water.
However, the limited duration of such campaigns (nomore than two months for most intensive ®eld cam-paigns) prevented testing the model's ability to reproducethe annual or inter-annual water cycle, for which longervalidation datasets are required. The motivation for along-term ®eld documentation of relevant processes wascon®rmed by the Project for Intercomparison of LandSurface Parametrisation Schemes (PILPS). In PILPSphase II (Chen et al., 1997), 23 schemes were run tocompare the various predicted components of the energybalance with experimental data collected over a meadowat Cabauw, the Netherlands. It was found that even forthis relatively simple type of surface, signi®cant di�eren-ces occurred between models and observations, andmodels themselves. For example, the modelled annualmean evaporation ranged between 32 W m)2 (about400 mm y)1) and 56 Wm)2 (about 710 mm y)1), whilethe measured value was 42 Wm)2 (530 mm y)1). Suchlarge errors of energy ¯ux estimates in atmosphericmodels may have a powerful impact on predicted soilmoisture and surface runo�, with a possible feedback oncloud amount and precipitations. Koster and Milly(1997) showed that the large scatter in PILPS ¯uxcalculations was related to the modelling of the interplay
Correspondence to: J.-C. CalvetMe te o-France/CNRM, 42 Av. Coriolis, 31057Toulouse Cedex 1, FranceE-mail: [email protected]
Ann. Geophysicae 17, 838±854 (1999) Ó EGS ± Springer-Verlag 1999

between transpiration and runo�. However, it was notpossible to propose better parametrisations based on thePILPS datasets because all the key SVAT variables (i.e.soil moisture, surface ¯uxes, and leaf area index, LAI)were not measured at the same time during long enoughperiods.
Based on this result, it was concluded that there wasreal need for testing land-surface schemes againstmeasurements of all the components of the energy andhydrological budgets, the seasonal variation of vegeta-tion properties and soil moisture, and the variation ofthe atmospheric forcing, during at least three annualcycles. An additional motivation for undertaking such aprogram was that some components of the hydrologicalbudget, such as runo� or gravitational drainage, essen-tial for understanding hydrologic systems, are onlyaccessible from long-term measurements (annual orseasonal cycles).
The resulting MUREX ®eld experiment presented isa joint e�ort of Me te o-France/CNRM (Centre Nationalde Recherches Me te orologiques, Toulouse, France),CESBIO (Centre d'Etudes Spatiales de la BiospheÁ re,Toulouse, France) and LTHE (Laboratoire d'Etude desTransferts en Hydrologie et Environnement, Grenoble,France). The site is described and a summary of thedatabase is presented over three annual cycles (1995 to1997). Finally, di�erent modelling approaches areapplied to the data of 1995.
2 Main characteristics of the site
The di�culties in maintaining numerous automaticmeasurements for a long period and in conductingfrequent investigations of the soil and vegetation at anisolated site lead to the choice of a site close to CNRM,30 km away from the city of Toulouse (France). Sincethe aim of MUREX is to characterise the naturalinteractions between surface ¯uxes, soil water content,and vegetation functionning, it was intended to:
(1) avoid any in¯uence of river water tables on thewater budget and (2) search for a natural canopy whosecharacteristics do not change fundamentally from oneyear to another. Since river water tables are oftenclose to the surface in valleys, the Toulouse regiono�ers a limited choice of sites satisfying this require-ment. It was thus decided to select a fallow site overone of the plateaux dominating the main watersheds ofthe region.
The MUREX fallow site (43°24¢N; 1°10¢E; altitude:240 m) was an agricultural area abandoned in 1992. Themicrometeorological station (Fig. 1) was set up in June1994. The ®eld was large enough (about 700 by 250 m)to provide a good fetch. It was a rather ¯at parcel,gently sloping down to the edge of a plateau dominatingthe valley of the Touch river, 30 m below. The vegeta-tion canopy of the MUREX site consisted of a denseherbaceous agricultural fallow. The main plant specieswere: Brachypodium sp and Potentilla reptans, especially,and also Geranium rotundifolium, Erigeron canadensis,and Rumex acetosa, as observed on day of year (DoY)293 in 1995. The canopy height ranged from 1 m whenvegetation was fully developed, to 0.1 m in winter. Thesoil was a typical hydromorphic deep `boulbeÁne': themean texture of the 1 m surface soil layer was that of asilt-loam (the sand and clay fractions were 14 and 28%,respectively). However, strong vertical texture gradientswere observed: the proportion of clay increased from17% at the surface to 40% at 1 m depth. On this type ofsoil, at about 1 m, a local subsurface soil waterconvergence might sometimes occur, caused by a tem-porary perched water table over the clay bedrock.
The meteorological variables (precipitation, air tem-perature and humidity, wind speed and direction) at thesite were monitored on a 30-min basis together withsurface temperature, solar radiation, and the surface¯uxes: net radiation (Rn), sensible heat ¯ux (H), groundheat ¯ux (G), and by di�erence the latent heat ¯uxLE = Rn)H)G. The other routine surface measure-ments consisted of weekly pro®les of the deep soil
Fig. 1. Photograph of the central part of theMUREX fallow site (at the end of 1996) withsome of the instrumentation. From left to right:the two-level SAMER system, the 10-m mast forwind, screen-level temperature and humidity, andIR-temperature, and the sca�olding bearing theradiation sensors
J.-C. Calvet et al.: MUREX: a land-surface ®eld experiment 839

moisture content, a characterisation of the vegetation,and 30-min recording of temperature pro®les in the soil.Along with routine observations, more speci®c mea-surements were made during selected periods: (1) directmeasurements of the soil moisture pro®le at the surface(the top 5 cm) were performed during two 30-dayintensive observing periods in spring and autumn 1995(Calvet et al., 1998a); (2) the integrated surface soilmoisture was routinely measured in 1997 by usingautomatic capacitive probes; (3) the surface temperaturewas derived from infrared radiometry from April toNovember of each annual cycle; (4) the CO2 ¯uxes werecharacterised from the summer 1997 to the spring of1998; (5) the leaf stomatal conductance to water vapourwas measured on selected days throughout the studiedperiod, together with the leaf water potential; and (6) thesoil hydraulic properties (hydraulic and thermal con-ductivities) were characterised. The latter measurementswere particularly useful to run the SiSPAT model (seeSect. 6.3).
3 Routine soil and atmospheric measurements
The soil and atmospheric measurements of MUREXwere obtained using methods very similar to those ofHAPEX-MOBILHY (Andre et al., 1986): classical me-teorological observations were combined with surfaceenergy and water budget measurements.
3.1 Atmospheric measurements
The equipment employed was similar to the SAMERstation described in Goutorbe (1991). Air temperatureand humidity were measured at screen-level (2 m). Thewind speed (U) and direction were measured by apropeller anemometer at 10 m above the soil surface.The atmospheric pressure was measured and recordedautomatically. The station was also able to documentthe surface energy balance: the net radiation wasmeasured together with the ground heat ¯ux, and thesensible heat was calculated from two-level measure-ments (1.5 m apart) of air temperature and wind speed.The accuracy of the two-level measurements (air tem-perature and wind speed vertical gradients) was oneorder of magnitude better than the original design: thesensors were changed and thoroughly intercompared atthe same level, under very distinct atmospheric condi-tions (i.e. di�erent diurnal cycles, strong and low winds,rain/no rain, etc.). However, other uncertainties (e.g.concerning the canopy height estimation) may a�ect theobtained ¯uxes at short time scales, and the expectedaccuracy was about 20% (Goutorbe, 1991).
Rainfall (P) was recorded automatically using atipping bucket rain gauge. Also, shortwave and total(0.3±60 lm), upward and downward radiations weremeasured. The MUREX station was very reliable for theentire period studied. During 1995 for example less than6% of surface ¯ux data are missing, 1 to 3% of theradiation (the solar incident radiation Rg and the
downwelling atmospheric thermal emission Ra), pres-sure, and air temperature and humidity are missing, andless than 1% of wind speed and precipitation data aremissing. In order to obtain a continuous atmosphericforcing series, data from neighbouring automatic weath-er stations (Poucharramet: 43°25¢N, 1°11¢E, altitude204 m, and Ondes: 43°47¢N, 1°19¢E, altitude 108 m) andof the Francazal airport station (43°32¢N, 1°22¢E,altitude 164 m) were added to the database. Since thedownwelling atmospheric thermal emission (Ra) was notmeasured in the supplementary weather stations, the 3%missing data in the original dataset were completed bythe following formulation, adapted from Staley andJurica (1972):
Ra � b� b0 � frc � �1ÿ rc� � 0:67
� �1670� qa�0:08g � rT 4a �1�
where r is the Stefan-Boltzmann constant, Ta and qa theair temperature and speci®c humidity (respectively), atscreen-level, and rc is the cloud coverage �rc 2 �0; 1��.The rc parameter was measured at Francazal. Theregression coe�cients b and b0 were determined from theavailable values of Ra at the MUREX site and from thecloud coverage rc at Francazal. The regression param-eters obtained (for 1995) are b � 11:3 Wm)2 andb0 � 0:9685, with a square correlation coe�cient �r2�of 73% and a standard error of 25 Wm)2. When cloudcoverage observations were not available, Eq. (1) wasapplied with rc � 0, and b � 43:9 Wm)2 andb0 � 1:0056. In this case, the value of r2 is 70% andthe standard error is 25 Wm)2. The same method wasapplied to the 1996 and 1997 datasets, with similarresults. The 3-y measurements of the atmosphericforcing data �P ;Rg;Ra; Ta; qa;U�, surface ¯uxes(Rn;H ; LE;G), and soil moisture, are summarised inFigs. 2, 3, and 4.
The main di�erences between the three years arerelated to changes in the rainfall regime: 1995 wascharacterised by evenly distributed precipitation(770 mm); 1996 was the wettest year (860 mm), and1997 was a dry year (540 mm) marked by a spring andan autumn drought (Fig. 2). The droughts of 1997 had asigni®cant impact on the measured surface ¯uxes(Fig. 4): the sensible heat ¯ux exceeded evapotranspira-tion during the autumn 1997 (i.e. from Septemberonward), and the monthly evapotranspiration neverexceeded 300 MJ m)2, contrary to that which occurredin 1995 and 1996. Note that the reduced maximummonthly evapotranspiration in 1997 was also related tolower values of incoming solar radiation (Fig. 2).
3.2 Deep soil moisture measurements
Deep soil moisture pro®les were obtained on a weeklybasis from neutron probe measurements. the measuredsoil moisture pro®les corresponded to 0.10±0.15 mintervals, from the surface to 1.35 m. The soil waterpotential was estimated from tensiometric measure-ments at 0.1 m intervals within the 0.3 m surface layer
840 J.-C. Calvet et al.: MUREX: a land-surface ®eld experiment

and at 0.2 m intervals below, down to 1.3 m. Themeasurements were performed at three positions withinthe fallow site. They were selected after a preliminarygravimetric water contents survey according to themethod proposed by Vachaud et al. (1985). In thisstudy, the average value is considered. Once properlycalibrated, the neutron probe technique allows accuratemeasurements of the soil water content. The averagevolumetric soil moisture measurements of the three
years are displayed in Fig. 4. Again, the three annualcycles contrast sharply: soil water extraction neverreached the 1 m depth in 1996, whereas water wasextracted over the whole pro®le (i.e. as deep as 1.35 m)in 1995 from July to September. In 1997, water wasextracted below 1.35 m, from August onwards. It isinteresting to note that the precipitation occurringduring the autumn 1997 was not large enough to re®llthe soil reservoir by the end of the year.
Fig. 3. As in Fig. 2, except forair temperature and humidity,Ta and qa and wind speed. Airtemperature, humidity, andwind speed are displayed asmonthly means with maximumand minimum values indicatedwith bars. Air temperature andhumidity are represented bydiamonds with solid lines, andby boxes with solid thick lines,respectively
Fig. 2. The measured precip-itation and incoming radia-tion, Rg and Ra, over theMUREX fallow in 1995,1996, and 1997. The plottedprecipitation and incomingradiation are monthly sums ofthe 30-min measured values
J.-C. Calvet et al.: MUREX: a land-surface ®eld experiment 841

Using the estimated soil moisture content changetogether with the measured precipitation and cumulatedevaporation and cumulated evaporation, it is possible toassess the water balance on a weekly basis.
3.3 Water balance
According to the available measurements, the waterbalance of the MUREX fallow is rather unrepresenta-tive of the climatic or large-scale evaporation oversouthwestern France. For example, the cumulatedestimated evapotranspiration is about 800 mm for1995, whereas the value of the cumulated precipitationfor the same period is 770 mm. The evaporation excesscan be explained by a local subsurface soil waterconvergence which is likely to occur in this kind ofterrain. The in situ measurements of bulk soil moisture,precipitation and evapotranspiration can be employedto estimate the weekly water excess Xs (Calvet et al.,1998a):
Xs � DS � RLE ÿ RP �2�where DS is the change in the soil water storage (S)between two consecutive measurements, from the sur-face to a depth of 1.35 m, and RLE and RP are thecumulated values of evapotranspiration and precipita-tion over the period considered, respectively. Thecumulated positive values of Xs are presented inFig. 5, together with the cumulated precipitation. Ingeneral, winter is a period of runo� displaying negativevalues of Xs. Conversely, the in¯ow episodes (positivepeak values of Xs) are observed from the beginning ofspring to the middle of the autumn. Their sum over any
of the studied annual cycles represents a deep water gainof about 200 mm. The in¯ow can be due to lateralmovements of water and (to a lesser extent) to capillarityrises from soil layers deeper than 1.35 m. It produces asigni®cant contribution to the local water balance,especially during the drying periods.
Simple calculations based on tensiometric measure-ments at the bottom of the pro®le indicate thatcapillarity rises from below 1.35 m do not exceed4 mm in 1995 (Calvet et al., 1998a). Therefore, mostof the water excess seems to be due to lateral movementsof water. In the case of the MUREX fallow, part of thein¯ow may be supplied by upstream rain and irrigationdrained water (a large proportion of the uphill ®eldsconsists of irrigated maize).
4 Vegetation dynamics and the waterand carbon dioxide ¯uxes
Fallow vegetation resulting from set-aside cultivated®elds is currently widespread in western Europe. Thevegetation of the MUREX fallow consists of many C3
herbaceous plant species whose growing cycles overlap,contributing to maintain a rather dense, evergreencanopy. In order to characterise the fallow, the speci®ccontribution of each species was determined using asimpli®ed point quadrats method (Daget and Poissonet,1971), and the spatial heterogeneity of the vegetationwas investigated. Over a total number of 81 speciesidenti®ed on the site, the plants making up the canopy ata given time represented 38 to 55 di�erent species.However, the fallow was dominated by a few speciesonly: Brachypodium sp (45% of the plants), and
Fig. 4. Monthly sums of themeasured ¯uxes (net radiation,Rn; sensible heat ¯ux; H; latentheat ¯ux LE; and ground heat¯ux, G over the MUREX fal-low in 1995, 1996, and 1997(note that LE is estimated bydi�erence), and a temporal dia-gram of the soil volumetricmoisture within the 1.35 m soillayer as measured with a neu-tron probe over the MUREXfallow
842 J.-C. Calvet et al.: MUREX: a land-surface ®eld experiment

Potentilla reptans (22%) were the main dominantspecies, together with Erigeron canadensis, Epilobiumtetragonum, and Rumex acetosa. This kind of herba-ceous canopy represents the ®rst stage of a plantsuccession (once cultivation has stopped) leading to aQuercus pubescens forest climax. Despite the wide areacovered by this type of fallow, they have not beenintensively investigated until now, especially concerningtheir primary production, seasonal dynamics, and therole they play in land-atmosphere exchanges.
In this section, speci®c biomass and ecophysiologicalmeasurements performed with in the framework ofMUREX are presented. Green leaf area index (LAI) andbiomass measurements were performed by destructiveplanimetric measurements by CESBIO and CNRM.Figure 6 shows the measured values of LAI togetherwith the dead and living above-ground biomass over thethree annual cycles. The dead vegetation residues tend toform a rather dense vegetal mulch at the soil surface. In1995, the fallow was mown on DoY 152, thus increasingthe mulch dead biomass. The rather large scatter of LAIis due to the heterogeneous vegetation species distribu-tion. However, clear interannual di�erences emergefrom the series of observations displayed in Fig. 6. Inparticular, the maximum LAI was lower in 1997 than in1996 (about 2 and 3.5 m2 m)2, respectively), consistentwith the precipitation de®cit of 1997, compared with1996.
As far as root biomass is concerned, an average valueof 160 g m)2 was obtained by CESBIO from measure-ments performed on ®ve di�erent dates in 1995. It mustbe noted that most of the roots were found in the 0.25 msurface soil layer. A few roots, representing a very smallpart of the total root biomass, were observed in deeper
layers (down to 0.70 m). This implies that a large part ofthe soil water extraction occurring below 0.25 m (Fig. 4)is due to capillarity rises from deeper soil layers, butdirect root extraction from below 0.25 m may occur.The deep root extraction could not be quanti®ed.
Using the shortwave radiation measurements men-tioned before, it was possible to determine the albedo(a) of the canopy: a � 0:20� 0:04 in 1995 and 1996.In 1997, a slightly higher value was obtained:a � 0:21� 0:04. Again, this higher value may be relatedto a quicker wilting and yellowing of the leaves due tothe considerable water stress of 1997.
Water and carbon dioxide ¯uxes in the soil-plant-atmosphere continuum widely depend on the vegetation.A speci®c study was conducted during the 1997 and1998 growing seasons to determine the seasonal anddiurnal dynamics of the vegetation features as in¯uencedby environmental conditions.
Stomatal conductance and water potential weremeasured on leaves of major species from the earlyspring to the autumn of 1997, along with the biomassand LAI dynamics of the ®eld vegetation. The mainconclusions of this series of biophysical measurementsfor the MUREX fallow are: (1) the plant speciesexhibited low stomatal resistances, indicating theirpotential ability to maintain high CO2 and water vapour¯uxes; (2) some di�erences between coexisting speciesoccurred, concerning diurnal variations of stomatalconductance and water potential; (3) the diurnal vari-ations of leaf stomatal resistance and water potentialdi�ered greatly according to air saturation de®cits andsoil moisture conditions.
Carbon dioxide ¯uxes were measured during the 1997summer period, and in 1998. Two methods were
Fig. 5. Cumulative precipita-tion and positive values of thewater excess derived from thetotal soil moisture content,precipitation and evapotran-spiration measurements overthe MUREX fallow in 1995,1996, and 1997
J.-C. Calvet et al.: MUREX: a land-surface ®eld experiment 843

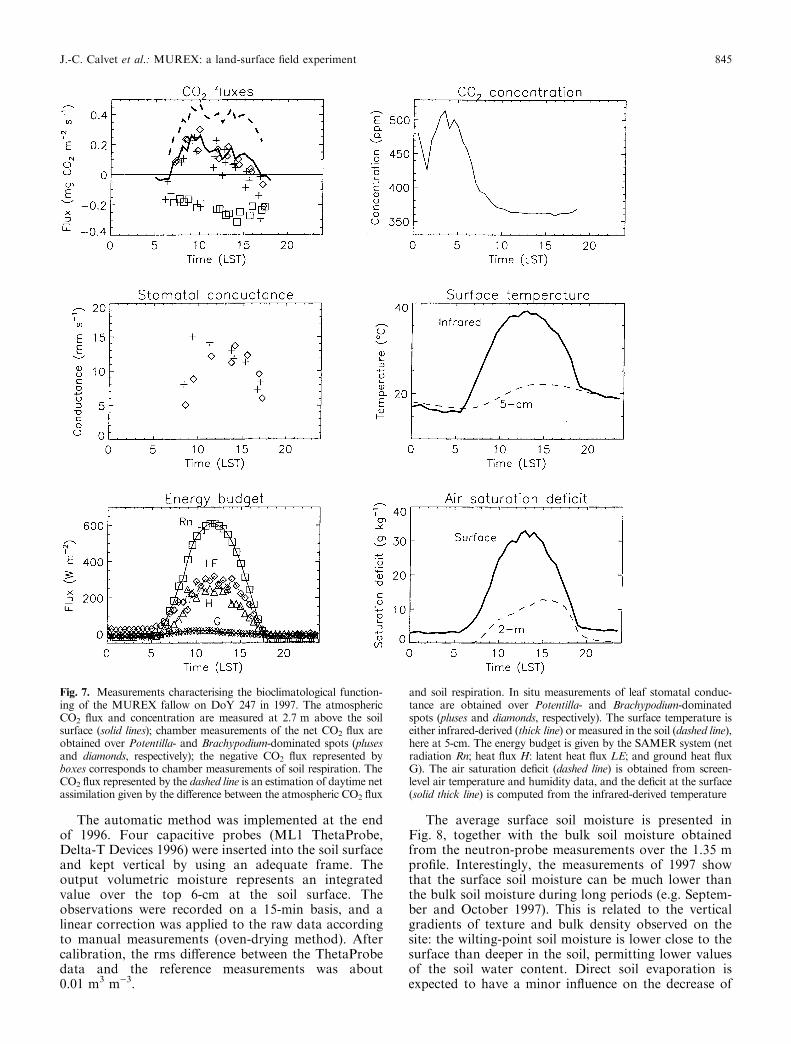
employed: chamber measurements were performed byCESBIO (using a Ciras-1 PPSystems infrared gasanalyser), and CNRM used the eddy-correlation meth-od (using a SOLENT ultrasonic anemometer, and aLICOR LI-6262 infrared gas analyser). The chambermeasurements enable estimation of the di�erent com-ponents of the net CO2 ¯ux: (1) the unscreened chamberover the undisturbed canopy provides the net CO2-¯ux;(2) by screening the chamber over the undisturbedcanopy, one obtain the total soil and leaf respiration(photosynthesis is suppressed); and (3) by cutting thevegetation before the observation, an estimate of soilrespiration is obtained (photosynthesis and leaf respira-tion are suppressed). The ®rst term should correspond tothe atmospheric ¯ux measured by the eddy-correlationmethod. Figure 7 presents a series of bioclimaticvariables observed on DoY 247 in 1997. The atmo-spheric net CO2-¯ux obtained by the two methods(either chamber or eddy-correlation measurements) arein good agreement. The canopy net assimilation An (i.e.the quantity of CO2 integrated into the vegetationbiomass through the photosynthesis process) may bemuch higher than the measured atmospheric CO2-¯uxpresented in Fig. 7 because the plant may absorb theCO2 emitted by the soil, also. An estimation of An is thedi�erence between the atmospheric CO2-¯ux and soilrespiration: on DoY 247 in 1997 (Fig. 7), the obtainednet assimilation reaches 0.5 mg m)2 s)1 at about0900 LST and 1500 LST, whereas the atmosphericCO2-¯ux does not exceed 0.3 mg m)2 s)1. The An andevapotranspiration `plateau' observed between 0900 and1500 LST (Fig. 7) may be related to stomatal closuredue to high temperatures or to a large saturation de®citof the air within the canopy. It is interesting to note thatthe average behaviour of the canopy in terms of
stomatal conductance may result from distinct diurnalvariations of this parameter from one plant species toanother (Fig. 7).
5 Surface soil moisture and temperature
5.1 Surface soil moisture measurements
Surface soil moisture was estimated either manually (byweighing samples collected in the ®eld) or automatically(in situ capacitive measurements).
In 1995, soil moisture pro®les within the top 5-cm soillayer were measured manually, twice a day, during two30-day intensive observing periods (IOPs) in spring andautumn: 1-from DoY 114 to 143 for the spring-IOP, 2-from DoY 269 to 298 for the autumn-IOP. Eachmeasurement consisted of the gravimetric moisture of36 (6 layers ´ 6 sites) soil samples, determined by adirect oven-drying method. The soil moisture contentwas measured: (1) from the surface to the 5-cm depthwith a resolution of 1 cm, and (2) for the 0.5-cm surfacelayer. The volumetric moisture w (m3 m)3) is derivedfrom the gravimetric measurements h (kg of water perkg of dry soil) by:
w � qb
qw� h �3�
where qb is the soil dry bulk density and qw the densityof liquid water (kg m)3). The value of qb did not changesigni®cantly from one IOP to the other: the measuredvalues over the surface 5-cm layer are 1452 � 87 and1450 � 114 kg m)3 on DoY 123 and 286 of 1995,respectively.
Fig. 6. The green leaf areaindex and above-ground greenbiomass (boxes) and necromass(thick dashed line and triangles)measured over the MUREXfallow in 1995, 1996, and 1997.The discontinuity on day 152 isdue to the cutting of the vege-tation
844 J.-C. Calvet et al.: MUREX: a land-surface ®eld experiment
The automatic method was implemented at the endof 1996. Four capacitive probes (ML1 ThetaProbe,Delta-T Devices 1996) were inserted into the soil surfaceand kept vertical by using an adequate frame. Theoutput volumetric moisture represents an integratedvalue over the top 6-cm at the soil surface. Theobservations were recorded on a 15-min basis, and alinear correction was applied to the raw data accordingto manual measurements (oven-drying method). Aftercalibration, the rms di�erence between the ThetaProbedata and the reference measurements was about0.01 m3 m)3.
The average surface soil moisture is presented inFig. 8, together with the bulk soil moisture obtainedfrom the neutron-probe measurements over the 1.35 mpro®le. Interestingly, the measurements of 1997 showthat the surface soil moisture can be much lower thanthe bulk soil moisture during long periods (e.g. Septem-ber and October 1997). This is related to the verticalgradients of texture and bulk density observed on thesite: the wilting-point soil moisture is lower close to thesurface than deeper in the soil, permitting lower valuesof the soil water content. Direct soil evaporation isexpected to have a minor in¯uence on the decrease of
Fig. 7. Measurements characterising the bioclimatological function-ing of the MUREX fallow on DoY 247 in 1997. The atmosphericCO2 ¯ux and concentration are measured at 2.7 m above the soilsurface (solid lines); chamber measurements of the net CO2 ¯ux areobtained over Potentilla- and Brachypodium-dominated spots (plusesand diamonds, respectively); the negative CO2 ¯ux represented byboxes corresponds to chamber measurements of soil respiration. TheCO2 ¯ux represented by the dashed line is an estimation of daytime netassimilation given by the di�erence between the atmospheric CO2 ¯ux
and soil respiration. In situ measurements of leaf stomatal conduc-tance are obtained over Potentilla- and Brachypodium-dominatedspots (pluses and diamonds, respectively). The surface temperature iseither infrared-derived (thick line) or measured in the soil (dashed line),here at 5-cm. The energy budget is given by the SAMER system (netradiation Rn; heat ¯ux H: latent heat ¯ux LE; and ground heat ¯uxG). The air saturation de®cit (dashed line) is obtained from screen-level air temperature and humidity data, and the de®cit at the surface(solid thick line) is computed from the infrared-derived temperature
J.-C. Calvet et al.: MUREX: a land-surface ®eld experiment 845

surface soil moisture because of the mulch screeninge�ect.
5.2 Surface temperature and emissivity
In this study, six temperatures characterising the surfacewere measured: the infrared temperature (TIR) is ob-tained from an infrared radiometer, and the soiltemperature at 1, 5, 20, 50, and 120 cm below the soilsurface (Tÿ1; Tÿ5 and Tÿ20; Tÿ50, and Tÿ120, respective-ly) were measured with platinum-resistance thermome-ters. The surface temperature Ts was derived from TIRand an e�ective emissivity (eeff ):
Ts � T 4IR=eeff
8: 9;1=4�4�
The value eeff � 0:977 could be estimated from Eq. (4)by assuming that Ts � Tÿ1 when no vertical gradients oftemperature were observed at the soil surface (i.e.Tÿ1 � Tÿ5) after sunset, between 2000 and 2100 LocalStandard Time (LST).
The thermal emissivity of the surface (es) is aparameter of the SVATs. The value of es can beretrieved from Ts and the radiation measurements.Indeed, the measured upwelling thermal emission ofthe surface (Rs) can be written as:
Rs � es rT 4s � �1ÿ es�Ra �5�
The value es � 0:97 minimises the rms di�erence be-tween the measured value of Rs, and the value given byEq. (5): the rms di�erence is 10.6 Wm)2 and over 1995,the mean bias is less than 2 Wm)2.
6 Modelling approaches
The main purpose of the MUREX experiment is toimprove the representation of the land-surface processesin atmospheric models. Improved numerical experi-ments and new analysis algorithms and parametrisationsbased on these data are presented in other studies. Inparticular, the ISBA scheme was employed in severalcon®gurations to analyse the MUREX data: (1) the dataof 1995 were used to test an assimilation technique toanalyse the total soil water content from surface soilmoisture or surface temperature (Calvet et al., 1998a);and (2) a new version of ISBA including CO2 assimi-lation and plant growth (ISBA-Ags) was applied to thedata of 1995 and 1996 (Calvet et al., 1998b).
In this study, simulations performed by four modelsover the 1995 annual cycle (ISBA, MAGRET, SiSPAT,and ALiBi) are compared. All the models are driven bymeasurements of incoming radiation, precipitation,atmospheric pressure, air temperature and humidity,and wind speed at a reference level. Also, vegetationcharacteristics such as leaf area index and canopy heightmust be prescribed. These parameters may change withtime. The ISBA (Noilhan and Planton, 1989) andMAGRET (Lagouarde, 1991; Courault et al., 1996)models have similar functions and input and outputvariables: they both describe the water division betweenthe vegetation transpiration, the drainage, the surfaceruno� and the soil moisture increase or decrease, andthey both solve a single energy budget and compute thesurface temperature. This kind of models represents aparticularly robust approach to describe how landsurface functions over long periods, at low computing
Fig. 8. Monthly averages of themeasured infrared-derived sur-face temperature (thick solidline), and of the soil temperatureat 1-cm (dashed line) and 50-cm(solid line) below the soil surface,and the measured soil watercontent of the 1.35 m column(diamonds) and surface soil wa-ter content over the top 5±6 cm(solid line), in 1995, 1996, and1997
846 J.-C. Calvet et al.: MUREX: a land-surface ®eld experiment

costs. The SiSPAT model (Braud et al., 1995) belongs toa more complex class of SVATs: the vegetation structureis more detailed, and a multilayer description of the soilis employed. Conversely, the ALiBi model (Olioso,1992) was designed to analyse remote sensing data suchas infrared brightness temperature in order to diagnoseevapotranspiration and photosynthesis without moni-toring the root-zone soil moisture. In ALiBi, thecharacterisation of the physiological plant functioningis improved. In this study, the four models are run over1995 with the interpolated LAI curve obtained by Calvetet al. (1998a) from the observed values. Also, thephotosynthesis modelled by ISBA-Ags and ALiBi arecompared.
6.1 ISBA
In this study, the most recent standard version of ISBA(Noilhan and Mahfouf, 1996), implemented within theMe te o-France global climate model ARPEGE by Ma-hfouf et al. (1995) is employed. The ISBA schemesimulates the surface ¯uxes (LE, H, G) and predicts theevolution of the surface state variables using theequations of the force-restore method of Deardor�(1977, 1978). Five variables (surface temperature Ts,mean surface temperature T2, surface soil volumetricmoisture wg, total soil volumetric moisture w2, and thecanopy interception reservoir Wr) are obtained throughprognostic equations. It must be noted that ISBA doesnot need a root distribution: w2 is the volumetric soilmoisture associated to a bulk layer of thickness d2including the root zone. The surface soil moisture wg iscomputed to estimate the evaporation from the soilsurface, whereas the transpired water is extracted fromw2. The surface water quantity from wg is included in w2.Initial values of soil variables are required. In this study,the contribution of the water excess caused by a perchedaquifer or by deep capillarity rises (measured positivevalues of Xs) is accounted for in the water budget as in
Calvet et al. (1998a): the Xs term is very signi®cant in thecase of the MUREX fallow, and the time series of Xsmust be prescribed in the evolution equation of w2 inorder to obtain a good agreement between simulated andobserved values of both surface evapotranspiration androot-zone soil moisture. Furthermore, estimates of thedeep temperature are required to avoid severe drifts ofthe cumulated model heat ¯ux in the soil. In this study,the prescribed deep temperature is taken as the measuredtemperature at 50 cm below the soil surface (Tÿ50).
The description of the surface ¯uxes Rn, H, and LE isdetailed in Noilhan and Planton (1989). The mainprescribed parameters of the surface involved in the ¯uxcalculation are: the surface albedo and emissivity (a andes, respectively), the momentum and thermal roughness-es (z0 and z0h, respectively) and the vegetation LAI andminimal stomatal resistance (rsmin, expressed in units ofsm)1). This latter term depends on the plant speciesmaking up the canopy, and in general must be calibrat-ed. The surface albedo and emissivity are prescribedfrom measurements and z0 is derived from the vegeta-tion height estimates (h) through: z0 = 0.13 ´ h. Ta-ble 1 displays the ISBA structure parameters eitherobtained from the in situ measurements, derived fromthe soil texture (wwilt, wsat), or calibrated (wfc, c, es, Cv,rsmin, z0/z0h). The procedure to obtain calibrated valuesis detailed in Calvet et al. (1998a). Note that in thisstudy, all the parameters were calibrated according toRn, H, and LE, whereas the cumulative G was also usedin Calvet et al. (1998a). Therefore, the Table 1 param-eter values (especially Cv and z0/z0h) di�er from thosegiven by Calvet et al. (1998a). The calibrated ratio z0/z0h(Table 1) employed for ISBA (and MAGRET) reaches ahigh value of 450, whereas a value of 10 is usuallyemployed for small vegetation canopies. However, manyauthors have reported high values of z0/z0h (even higherthan 450) for a wide range of surfaces (see Verhoef et al.,1997 for a review, and Trou¯eau et al., 1997). Verhoefet al. (1997) suggest that z0/z0h = 10 is probably toolow for most natural surfaces.
Table 1. The soil and vegetation structure parameters over the MUREX fallow for ISBA and MAGRET
Symbol De®nition Value
ISBA and MAGRET:d2 Soil root depth 1.35 mCLAY Clay fraction 28%SAND Sand fraction 14%wwilt Wilting point 0.20 m3 m)3
wfc Field capacity 0.34 m3 m)3
a Albedo 0.20es Emissivity 0.97rsmin Minimum stomatal resistance 50 sm)1
z0/z0h Roughness length ratio 450ISBA:c Deep heat transfer contribution 1veg Vegetation coverage 95%Cv Thermal coe�cient 2.0 ´ 10)5 Km2 J)1
MAGRET:d Extinction coe�cient for ground heat ¯ux 0.6 m2 m)2
J.-C. Calvet et al.: MUREX: a land-surface ®eld experiment 847

6.2 MAGRET
The working of MAGRET is detailed in Courault et al.(1996). It is very similar to ISBA. In particular, the inputatmospheric, radiation, and vegetation variables are thesame. Di�erences arise from the way evapotranspira-tion, and soil moisture are computed. Contrary to ISBA,bare soil evaporation and vegetation transpiration arenot distinguished. Whereas they are calculated separate-ly is ISBA, the total canopy evapotranspiration isobtained using a bulk canopy resistance includingvegetation structure resistances, a resistance to soilevaporation related to the surface dry soil layer, and theplant stomatal resistance. This latter resistance iscalculated in the same way as in ISBA. Concerning soilmoisture, the two reservoir systems proposed by Jac-quart and Choisnel (1995) is employed. Each reservoircorresponds to a layer of wetted soil, the thickness ofwhich vary according to the computed loss (evapotran-spiration) or gain (rainfall) of water. Since the MUREXwater excess cannot be included in a bulk soil reservoiras in ISBA, the water excess was added to theprecipitation prescribed for MAGRET (Table 2).
Another di�erence concerns the calculation of theground heat ¯ux G and the e�ect of vegetation. In ISBA,G is the residual of the energy budget. The obtainedvalue of G is employed in the pronostic equation for thesurface temperature, weighted by a thermal coe�cientincluding a vegetation term Cv. In MAGRET, G iscomputed from the temperature gradient at the surfaceand an exponential attenuation term depending on LAItimes the extinction coe�cient d (Table 1). The MAG-RET model computes the diurnal evolution of thecanopy albedo. In this study, the albedo module wasinactivated and the average value of 0.2 was imposed asin ISBA.
6.3 SiSPAT
In the SiSPAT model (Braud et al., 1995) the transfersin the soil are described in more detail: the verticalheterogeneity of the soil structure and texture isaccounted for, and a root distribution must be pre-scribed. The heat and water exchanges are speci®edthrough Fourier and Richards' equations, and the soilprognostic variables are vertical pro®les of temperatureand soil matric potential. Consistent with the accuratedescription of the soil processes, the vegetation layer isdepicted more precisely than in ISBA and MAGRET:the radiative transfer within the canopy is accounted for,
together with separate energy budgets of vegetation andbare soil (Deardor�, 1978). As a lower boundarycondition for the soil pro®le, the measured timeevolution of matric potential at 1.3 m was imposed.Since no deep measurement of soil temperature wasavailable in 1995, the average values of the 1996 and1997 series (at 1.2 m) were used.
In order to better described the particular behaviourof the MUREX fallow, the SiSPAT model was modi®edto account for the mulch e�ect (Gonzalez-Sosa et al.,Submitted 1999). Indeed, Gonzalez-Sosa et al. (1999)showed that, using SiSPAT, water and energy transferwithin the mulch layer must be explicitely described,especially after the vegetation cutting in 1995, on DoY152. Accounting for the mulch greatly improves theSiSPAT simulations over MUREX. To summarise, themulched simulations present higher values of bulk soilmoisture and lower values of evapotranspiration. The¯ux simulation after the vegetation cutting of DoY 152is erroneous in non-mulched simulations. In particularsoil evaporation is greatly overestimated, which bringsabout a rapid soil moisture depletion a�ecting thequality of the ¯ux simulation afterwards. In the simu-lations presented, SiSPAT was run with the same rsmin
than ISBA and MAGRET (Table 1). Displacementheight and roughness length for momentum werecalculated as a function of leaf area index and vegetationheight (Shuttleworth and Wallace, 1985). The z0/z0hvalues are given by the formula of Brutsaert (1982, citedby Verhoef et al., 1997). The rooting depth varies withtime from 0.5 to 0.7 m according to the observed soilmoisture pro®les. The maximum root density was set at2 ´ 104 m m)3. A vegetation albedo of 0.15 wasemployed, and the bare soil or mulch albedo wascalculated so that the total albedo equal 0.20. The othervegetation parameters employed in SiSPAT are: thecritical leaf potential ()140 m), and the total plantresistance (3.2 1012 s m)1).
As with ISBA and MAGRET, it was found that thewater excess Xs must be added to the water input inorder to simulate the water budget. In order to avoid thewater loss due to interception by the mulch and thevegetation, the water excess was applied to the surfacesoil layer (instead of directly increasing the precipita-tion). The soil parameters employed in SiSPAT aredisplayed in Table 3. Five horizons are distinguished,from the surface to the total soil column depth (1.35 m).The employed suction curve, relating the volumetricwater content w to the matric potential h (expressed inunits of m) consists of the Van Genuchten (1980)formula:
Table 2. The MUREX 1995 water budget as calculated by ISBA, MAGRET, and SiSPAT
Model Precipitation(mm)
Waterexcess (mm)
Evaporation(mm)
Drainage(mm)
Surfaceruno� (mm)
Soil moisurechange (mm)
Error (mm)
ISBA 773 184 856 95 0 6 0MAGRET 957 ± 884 125 0 )52 0SiSPAT 773 184 858 1 101 )18 15
848 J.-C. Calvet et al.: MUREX: a land-surface ®eld experiment

wwsat� 1� h
hg
8>>: 9>>;n� �2nÿ1
�6�
where wsat is the saturated water content (m3 m)3) andhg (m) a scale factor. The hydraulic conductivity curve isgiven by Brooks and Corey (1964):
K�w� � Ksat�w=wsat�c �7�where Ksat is the saturated hydraulic conductivity(m s)1) and c a scale factor. Field estimates of Ksat wereobtained from in®ltration tests performed using eithertension disk in®ltrometers (Vauclin and Chopart, 1992)or Guelph in®ltrometers (Elrick and Reynolds, 1992),for the 0±30 cm surface layer and the deepest layers,respectively.
The thermal conductivity k (expressed in units ofWm)1 K)1) is given by the following equation, obtainedfrom in situ measurements by the line source method(Laurent, 1989), completed with a laboratory charac-terisation of the volumetric moisture content (w)dependence:
k � 0:729� 0:135�w=wsat�� 1:26 1ÿ exp ÿ10:39�w=wsat�1:84
� �h i�8�
The di�erent terms of the MUREX water budget for1995, including soil moisture change and total runo�,are simulated by ISBA, MAGRET, and SiSPAT(Table 2). Note that in the SiSPAT simulations thewater budget is not completely balanced (error of15 mm) because of numerical cumulative inaccuraciesoccurring during soil moisture saturation. The ALiBimodel presented below does not consider soil moisturechange.
6.4 ALiBi
The ALiBi model was proposed by Olioso (1992) torelate evapotranspiration and photosynthesis to re¯ec-tance and infrared brightness temperature measure-ments. In order to derive evapotranspiration andphotosynthesis the ALiBi model has to be used in aninverse mode (Olioso et al., 1996b): the modelledthermal brightness temperature is ®tted to temperaturemeasurements by adjusting some input parameters(usually related to water transfers through the plants).
Like SiSPAT, the ALiBi model is a two-layeredenergy balance model. Energy balance ¯uxes, as well asphotosynthesis, are calculated using detailed descrip-tions of radiative transfer, turbulent transfer, watertransfer, stomatal conductance and leaf photosynthesis.
The vegetation conductance gs is given by the sum ofthe leaf stomatal conductances over the whole canopy.Leaf stomatal conductances depend on incident PAR atleaf surface, leaf water potential and air saturationde®cit at leaf surface (Winkel and Rambal, 1990).Another important equation describes water transfersfrom the soil to the leaves, where transpiration occurs.Like SiSPAT, it follows Van den Honert's formulationand relates transpiration (LEt) to the variation of waterpotential between the soil and the leaves (h and hv,respectively) by means of an hydraulic conductance(Gp), assumed constant for a given day:
LEt � Gp�hÿ hm� �9�A detailed description of water transfer, stomatalconductance and photosynthesis calculation was pre-sented by Olioso et al. (1996a).
In the case of the MUREX dataset, evapotranspira-tion, canopy energy ¯uxes and photosynthesis wereestimated by inverting the ALiBi model daily, accordingto the measured thermal brightness temperature (TIR) atmidday (174 days between DoY 125 and 317 in 1995):each day, the simulated midday TIR was ®tted to themeasured value (�0.25 K) by adjusting the hydraulicconductance parameter Gp. The other necessary inputswere: (1) either directly measured (LAI, canopy height,air temperature, air humidity and wind speed at areference level above the canopy, solar and atmosphericradiations, atmospheric pressure), (2) computed frommeasured inputs (incident PAR, solar and PAR di�usefraction and atmospheric radiation in the spectral rangeof the thermal radiometer), and (3) estimated from thevalues obtained for a soyabean crop in Avignon (Oliosoet al., 1996a). The latter parameters consisted of soilthermal characteristics, leaf aerodynamic properties,parameters for stomatal conductance and leaf photo-synthesis, optical properties of leaves and soil and leafangle distribution. In particular, a maximum leafstomatal conductance of 15 mm s)1 was employed.The root zone water potential and the soil temperatureat a depth of 1 m were set to constant average values of)0.5 MPa and 17 °C, respectively. Soil moisture in the
Table 3. Soil parameters for the ®ve SiSPAT's horizons, eithermeasured or calibrated (*) using the SiSPAT model. They includethe coe�cients of the van Genuchten (VG) and Brooks and Correy(BC) models (Eqs. (6) and (7), respectively): n and hg are shape and
scale parameters of the VG model, and c is the shape parameter ofthe BC model. The thermal conductivity k is given by Eq. (8) below0.02 m. The saturated water content and hydraulic conductivity aredenoted by wsat and Ksat, respectively
Horizon(m)
Porosity wsat
(m3 m)3)n (VG model) hg (VG model)
(m)Ksat
(m s)1)c (BC model) k
(Wm)1 K)1)
0±0.005 m 0.60 0.48 2.30 )1.62 4.8 10)6 9.3 0.2 (*)0.005±0.02 m 0.55 0.46 2.30 )1.62 9.8 10)6 9.3 0.6 (*)0.02±0.1 m 0.50 0.40 2.30 )1.62 5.0 10)7 (*) 9.3 Eq. (8)0.1±0.6 m 0.45 0.35 2.27 )1.70 7.5 10)8 (*) 10.6 Eq. (8)0.6±1.35 m 0.39 0.30 2.13 )2.00 1.0 10)10 (*) 33.3 Eq. (8)
J.-C. Calvet et al.: MUREX: a land-surface ®eld experiment 849

®rst 5 cm wg, which determines the soil evaporation inALiBi was either measured (DoY 125 to 143 and 270 to298), or set to arbitrary values of 0.2 m3 m)3 in thedriest period (DoY 228 to 255) and 0.3 m3 m)3 else-where. It was found that the value of wg has littlein¯uence on the ALiBi outputs in the case of MUREX.
7 Model validation and comparison
The model performances can be assessed by comparingthe model outputs with the measured values of surface¯uxes, and for ISBA, MAGRET, and SiSPAT, thesurface temperature and the total soil moisture.
7.1 Surface ¯uxes
The values of the simulated instantaneous and cumu-lated ¯uxes obtained with the structure parameters listedin Tables 1 and 3 are compared with the observed valuesin Table 4 and in Fig. 9, respectively. Figure 10 presentsthe smoothed daily evapotranspiration over the 1995annual cycle, either measured by the SAMER system ormodelled by ISBA, MAGRET, ALiBi, and SiSPAT. theALiBi simulations do not cover the entire annual cycle,since they rely on TIR measurements, available insummer and autumn 1995, only. The errors a�ectingthe simulated ¯uxes are listed in Table 4 in terms of rmserror, mean bias (simulated minus observed), and skillscore. The model skill score E is de®ned as:
E � 1ÿP
ixiOBS ÿ xiMOD� �2P
ixiOBS ÿ xOBS� �2 �10�
where x are half-hourly values of the ¯ux, eithermeasured or simulated (OBS and MOD subscripts,respectively). A value of E of 100% corresponds to
perfect simulations and values of E close to 0 corres-pond to a basic representation of x by its constantaverage value. Negative values of E show that themodel is not adequate. In general, the four modelsperform realistic simulations of the surface ¯uxes.However, SiSPAT tends to underestimate evapotran-spiration after the vegetation cutting (Fig. 10). The rmserror a�ecting the simulated G is rather large and theskill score (not shown) displays negative values for allthe models, denoting an inconsistency of either themeasurements or the models. Such errors may beexplained by the in¯uence of the mulch: the explicitsimulations of the mulch e�ect by SiSPAT, in partic-ular, shows that the presence of a mulch signi®cantlymodi®es the surface energy balance by decreasing soilevaporation and soil temperature, and increasing soilsurface water content. Another problem caused by themulch is that in reality, the heat storage in the soil isconditioned by the mulch whereas the measured G wasobtained from heat ¯ux plates buried at a 3-cm depth inthe soil. Although a correction was made to account forthe e�ect of the 3-cm soil top layer on G, the mulche�ect could not be properly characterised, and the soilheat ¯ux at the surface of the mulch could not beproperly evaluated. It appears that the simulated G (atthe mulch surface) displays a much larger diurnal cyclethan the measured one. This a�ects the estimation ofthe latent heat ¯ux, which was derived from the surfaceenergy budget. On the other hand, the mean bias over Gis very small with SiSPAT (Table 4) and the cumulated¯ux is simulated well (Fig. 9). The overestimation of Rnwith ISBA and MAGRET (Table 4) is consistent withthe overestimation of H and suggests that the modelledsurface temperature is underestimated (because moreenergy is removed from the surface through the heat¯ux in the model). The reverse conclusion can be drawnfrom the results of ALiBi, which uses the observed bulktemperature TIR to estimate the ¯uxes (both Rn and Hare underestimated), suggesting that the three models
Table 4. Errors a�ecting the simulated half-hourly outputs ofISBA, MAGRET, ALiBi, and SiSPAT in terms of rms error, meanbias (simulated minus observed), and model skill score on:evapotranspiration (LE), heat ¯ux (H), net radiation (Rn), soil
heat ¯ux (G), surface temperature (Ts), and soil water storage(w2 ´ d2). Note that ALiBi's simulation only covers some periodsand that ISBA's scores for the ALiBi's periods are shown inparenthesis
Model LE H Rn G Ts w2 ´ d2
ISBA rms error 35 Wm)2 24 Wm)2 19 Wm)2 30 Wm)2 2.8 °C 17 mmmean bias 4 Wm)2 11 Wm)2 13 Wm)2 )3 Wm)2 )2.2 °C 10 mmskill score 91% 79% 99% ± 87% 90%
MAGRET rms error 43 Wm)2 31 Wm)2 32 Wm)2 24 Wm)2 2.9 °C 21 mmmean bias 6 Wm)2 8 Wm)2 10 Wm)2 )4 Wm)2 )1.6 °C )1 mmskill score 87% 66% 97% ± 87% 85%
ALiBi rms error 33 Wm)2 31 Wm)2 23 Wm)2 31 Wm)2 ± ±(ISBA) (38 Wm)2) (24 Wm)2) (20 Wm)2) (33 Wm)2)
mean bias 9 Wm)2 )6 Wm)2 )6 Wm)2 )9 Wm)2 ± ±(6 Wm)2) (10 Wm)2) (14 Wm)2) ()2 Wm)2)
skill score 94% 73% 99% ± ± ±(93%) (84%) (99%)
SiSPAT rms error 41 Wm)2 23 Wm)2 25 Wm)2 33 Wm)2 3.9 °C 24 mmmean bias 3 Wm)2 1 Wm)2 4 Wm)2 0 Wm)2 )0.4 °C )15 mmskill score 89% 79% 98% ± 75% 79%
850 J.-C. Calvet et al.: MUREX: a land-surface ®eld experiment
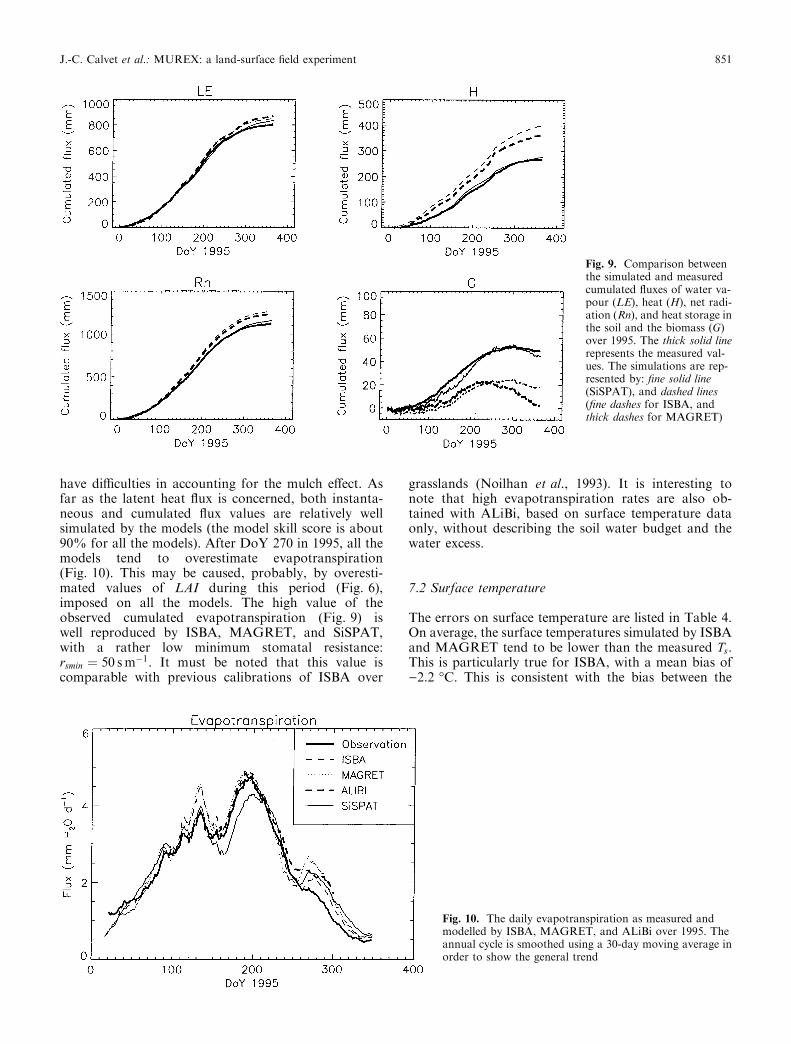
have di�culties in accounting for the mulch e�ect. Asfar as the latent heat ¯ux is concerned, both instanta-neous and cumulated ¯ux values are relatively wellsimulated by the models (the model skill score is about90% for all the models). After DoY 270 in 1995, all themodels tend to overestimate evapotranspiration(Fig. 10). This may be caused, probably, by overesti-mated values of LAI during this period (Fig. 6),imposed on all the models. The high value of theobserved cumulated evapotranspiration (Fig. 9) iswell reproduced by ISBA, MAGRET, and SiSPAT,with a rather low minimum stomatal resistance:rsmin � 50 smÿ1. It must be noted that this value iscomparable with previous calibrations of ISBA over
grasslands (Noilhan et al., 1993). It is interesting tonote that high evapotranspiration rates are also ob-tained with ALiBi, based on surface temperature dataonly, without describing the soil water budget and thewater excess.
7.2 Surface temperature
The errors on surface temperature are listed in Table 4.On average, the surface temperatures simulated by ISBAand MAGRET tend to be lower than the measured Ts.This is particularly true for ISBA, with a mean bias of)2.2 °C. This is consistent with the bias between the
Fig. 9. Comparison betweenthe simulated and measuredcumulated ¯uxes of water va-pour (LE), heat (H), net radi-ation (Rn), and heat storage inthe soil and the biomass (G)over 1995. The thick solid linerepresents the measured val-ues. The simulations are rep-resented by: ®ne solid line(SiSPAT), and dashed lines(®ne dashes for ISBA, andthick dashes for MAGRET)
Fig. 10. The daily evapotranspiration as measured andmodelled by ISBA, MAGRET, and ALiBi over 1995. Theannual cycle is smoothed using a 30-day moving average inorder to show the general trend
J.-C. Calvet et al.: MUREX: a land-surface ®eld experiment 851

modelled and the observed Rn (Table 4). An explana-tion is that ISBA and MAGRET, being single energy-budget models, tend to simulate a surface temperaturewhich is representative of both vegetation and soilsurface. On the other hand, the mean bias on Ts given bySiSPAT is low, consistent, again, with the goodrepresentation of the cumulated ¯uxes by this model(Fig. 9). However, the SiSPAT skill score concerning Tsis lower than the other models (75%, against 87% forISBA and MAGRET). This is due to a systematicoverestimation of daytime Ts and underestimation ofnighttime Ts by SiSPAT.
7.3 Soil moisture
Figure 11 presents the values of the total soil watercontent simulated by ISBA, MAGRET, and SiSPAT.The agreement is relatively good, with a rms error of 17and 21 mm for ISBA and MAGRET, respectively, and24 mm for SiSPAT (Table 4). As shown in Fig. 11, thesoil moisture simulated by ISBA may be higher than®eld capacity in wintertime. Although this is physicallypossible (soil moisture at saturation is higher than the®eld capacity equilibrium value), it condradicts theobservations and may denote a problem in the para-metrisation of in®ltration and drainage. MAGRET andSiSPAT present lower soil moisture values duringautumn. This latter feature corresponds to the negativesoil water change obtained with these models in Table 2.The problem with the simulation of the root soilmoisture in ISBA (or MAGRET) is related to thedi�culty of de®ning the root zone and the absence of adescription of the amount of water either directlyextracted by the roots or provided by the capillarityrises (Boone et al., 1999). The soil water stress functionemployed in the expression of stomatal resistance mayalso di�er from reality in some cases. Finally, it is
impossible to account for texture gradients in simplemodels like ISBA and MAGRET. In spite of thesedi�culties, ISBA seems to be the best model of soilmoisture for this dataset, with a skill score of 90%. Onefactor that may explain the poor performance ofSiSPAT (skill score of 79%) is the large amountof surface runo� generated by the model, at the expenseof drainage (Table 2).
As far as surface soil moisture is concerned, acomparison of the surface soil moisture wg simulatedby ISBA with the measured values was carried out byCalvet et al. (1998a). It was shown that the ISBA wg
outputs compare well with the measurements corre-sponding to a value integrated over the soil top 5-cmlayer. Using SiSPAT, the observed high values of wg arebetter reproduced by explicitly modelling the transferswithin the mulch (Gonzalez-Sosa et al., 1999).
7.4 Net assimilation of carbon dioxide
As CO2 net assimilation by the canopy (An) was notmeasured in 1995, only modelled annual cycles arepresented in Fig. 12. Values of An are provided byALiBi, and also by the new version of ISBA computingphotosynthesis (Calvet et al., 1998b): ISBA-Ags. Thecurve displayed in Fig. 12 concerning ISBA-Ags wasobtained by imposing the same LAI values as for theother models. Namely, ISBA-Ags was run in thecon®guration where photosynthesis and stomatal con-ductance are calculated as in Jacobs et al. (1996),without inferring plant growth. Both models give arealistic magnitude of net assimilation (based on theCO2-¯ux measurements of 1997 and 1998 presented inSect. 4) and the general trend is the same. However, theAn values given by ALiBi are 15% larger than the ISBA-Ags ones, on average.
Fig. 11. The measured (pluses) and simulated (solid and dashed lines)soil water content of the 1.35 m soil column in 1995. Themeasurements di�er slightly from those presented in Calvet et al.(1998a) because the neutron probe output calibration was re®ned, andall the measured sites are presented
Fig. 12. The daily net CO2 assimilation as modelled by ISBA-Ags(Calvet et al., 1998b) and ALiBi in 1995. The annual cycle issmoothed using a 30-day moving average in order to show the generaltrend
852 J.-C. Calvet et al.: MUREX: a land-surface ®eld experiment

8 Summary and conclusions
The MUREX continuous micrometeorological and soilmoisture observations of 1995, 1996, and 1997 arepresented. The MUREX experiment provided a uniquedataset comprising continuous atmospheric, vegetationand soil measurements over more than three years, overa fallow site. The observations showed that a di�erentamount of water was extracted from the soil reservoirfrom one year to another, depending on the rainfallregime. Most often than not, the soil water supply (fromeither soil water storage or uphill water input) was largeenough to permit values of evapotranspiration higherthan the sensible heat ¯ux. In spite of the bu�er e�ect ofthe soil, the growing cycle of the fallow studied showed aclear dependence on the rainfall regime: the maximumLAI varied between 2 and 3.5 according to the yearconsidered. Data analysis and model results show thattransfers of heat and water were in¯uenced by thepresence of a mulch in the vegetation layer. This led todi�culties especially in the estimation of the groundheat ¯ux and consequently on the latent heat ¯ux,derived as the residual of the energy budget. Theexistence of lateral transfers associated with a perchedwater table was also shown. However, the measurementuncertainties make their exact quanti®cation di�cult.
The data of 1995 were employed to assess the abilityof the surface schemes ISBA, MAGRET, SiSPAT, andALiBi to simulate properly the energy and waterbudgets of a vegetated surface over a complete annualcycle. The surface schemes describing soil moisture andthe water balance (ISBA, MAGRET, and SiSPAT) weremodi®ed to include the contribution of lateral transfersto the water input. SiSPAT was also modi®ed toexplicitely model heat and water transfers within themulch. Although this allowed a signi®cant improvementof the model results, further studies are needed to betterassess the in¯uence of mulch parameters on the results.Data from 1996 and 1997 will be used to re®ne themulch parameters and the occurrence of capillarity risesand lateral in¯ows.
All the models are able to reproduce the general trendof the measured variables. However, the surface tem-perature is signi®cantly underestimated by ISBA andMAGRET. The CO2 net assimilation simulated byALiBi is also signi®cantly di�erent from the ISBA-Agsresults. It must be noted that any SVAT o�-linesimulation requires prescribed boundary conditions.Together with the observed atmospheric forcing andvegetation characteristics, such as LAI, the studiedmodels (apart from ALiBi) use estimates of water excessX s (Sect. 3.3) and deep soil temperature, obtained fromthe ®eld measurements. Soil water excess, which resultsfrom lateral transfers, cannot be simulated by 1DSVATs and must be prescribed from observations.These ground boundary conditions are far from beingmajor components controlling the seasonal evolutionbut need to be accounted for in order to simulate theobserved energy and water budgets. Of course, a part ofthe model interseasonal to inter-annual variability is
constrained by observations (LAI, and the radiative andatmospheric forcing being the main factors). However,estimating the surface temperature and the waterpartitioning between vegetation transpiration, drainage,surface runo�, and soil moisture change is not easy, asshown in Sect. 7. It is expected that the MUREX datawill be useful to test interactive vegetation SVATmodels, in which photosynthesis is computed and maybe employed to estimate the biomass production andLAI (Calvet et al., 1998b).
Primarily, the aim of MUREX is to provide contin-uous micrometeorological and soil moisture observa-tions during several years, in order to assess the abilityof simple surface schemes employed in meteorology tosimulate properly the energy and water budgets of thesurface. Such a dataset could be useful to complete theon-going intercomparison PILPS program (Chen et al.,1997). In particular, the PILPS program has shown thatdi�erent parametrisations of soil water and runo� cancause a very large variability in the simulated root-zonesoil moisture. Also, the functional relationship betweenthe parametrisation of the root-zone soil moisture andthe evapotranspiration vary from one model to another(Mahfouf et al., 1996).
It is likely that such a dataset will also be employed toanalyse the model shortcomings and to propose newparametrisations. Moreover, the MUREX dataset maybe useful to test assimilation techniques. For example,Calvet et al. (1998a), using the measurements of surfacesoil moisture and surface temperature, have proposedassimilation rules of these variables to retrieve the root-zone soil water content.
Acknowledgements. This work was funded by the Conseil Re gio-nal de Midi-Pyre ne es, the Programme National de Recherche enHydrologie, and by participants to the ®eld programme (Me te o-France/CNRM, CESBIO, LTHE).
Topical Editor J.-P. Duvel thanks Yongkang Xue and anotherreferee for their help in evaluating this paper.
References
Andre , J.-C., J.-P. Goutorbe, and A. Perrier, HAPEX-MOBILHY:a hydrologic atmospheric experiment for the study of waterbudget and evaporation ¯ux at the climate scale, Bull. Am.Meteorol. Soc., 67(2), 138±144, 1986.
Bessemoulin, P., J.-C. Calvet, G. Jaubert, J. Noilhan, D. Vignes, C.Tosca, I. Braud, R. Haverkamp, J.-L. Thony, and M. Vauclin,MUREX : Un programme de suivi du cycle annuel des e changesde masse et d'e nergie entre sol, ve ge tation, et atmospheÁ re.Premiers enseignements, in Atelier ExpeÂrimentation et Instru-mentation, Me te o-France/CNRM, October 1996, Toulouse, pp.289±294, 1996.
Bolle, H. J., J.-C. Andre , J.-L. Arrue, H. K. Barth, P. Bessemoulin,et al., EFEDA: European ®eld experiment in a deserti®cation-threatened area, Ann. Geophysicae, 11, 173±189, 1993.
Boone, A., J.-C. Calvet, and J. Noilhan, Inclusion of a third soillayer in a land-surface scheme using the force-restore method,J. Appl. Meteorol., in press, 1999.
Braud, I., A. C. Dantas-Antonio, M. Vauclin, J.-L. Thony, and P.Ruelle, A simple soil-plant-atmosphere transfer model (Si-SPAT): development and ®eld veri®cation, J. Hydrol., 166,213±250, 1995.
J.-C. Calvet et al.: MUREX: a land-surface ®eld experiment 853

Brooks, R. H., and A. T. Corey, Hydraulic properties of porousmedia, Colo. State Univ. Fort Collins Hydrol. Pap., 3, 1964.
Brutsaert, W., Evaporation into the atmosphere, D. Reidel,Dordrecht, 299 pp, 1982.
Calvet, J.-C., J. Noilhan, and P. Bessemoulin, Retrieving the root-zone soil moisture from surface soil moisture or temperatureestimates: A feasibility study based on ®eld measurements.J. Appl. Meteorol., 37(4), 371±386, 1998a.
Calvet, J.-C., J. Noilhan, J.-L. Roujean, P. Bessemoulin, M.Cabelguenne, et al., An interactive vegetation SVAT modeltested against data from six contrasting sites, Agric. For.Meteorol., 92, 73±95, 1998b.
Chen, T. H., A. Henderson-Sellers, P. C. D. Milly, A. J. Pitman, A.C. M. Beljaars, et al., Cabauw experimental results from theproject for intercomparison of landsurface parametrisationschemes (PILPS), J. Clim. 10, 1194±1215, 1997.
Courault, D., J.-P. Lagouarde, and B. Aloui, Evaporation formaritime catchment combining a meteorological model withvegetation information and airborne surface temperatures,Agric. For. Meteorol., 82, 93±117, 1996.
Daget, P., and J. Poissonet, Une me thode d'analyse phytologiquedes prairies. CriteÁ res d'application. Ann. Agronom., 22, 5±41,1971.
Deardor�, J. W., A parametrisation of the ground surface moisturecontent for use in atmosphere predictions models, J. Appl.Meteorol., 16, 1182±1185, 1977.
Deardor�, J. W., E�cient prediction of ground temperature andmoisture with inclusion of a layer of vegetation, J. Geophys.Res., 83, 1889±1903, 1978.
Elrick, D. E., and W. D. Reynolds,Methods for analysing constant-head well permeameter data, Soil Sci. Soc. Am. J., 56(1), 320±323, 1992.
Goutorbe, J.-P., A critical assessment of the Samer networkaccuracy, In Eds T. J. Schmugge, and J. -C. Andre Land surfaceevaporation. Measurement and parametrisation, Springer-Verlag,Berlin Heidelberg, New York, pp. 171±182, 1991.
Goutorbe, J.-P., T. Lebel, A. J. Dolman, J. H. C. Gash, P. Kabat,et al., An overview of HAPEX-Sahel: a study in climate anddeserti®cation, J. Hydrol., 188±189, 4±17, 1997.
Jacobs, C. M. J., B. J. J. M. van den Hurk, and H. A. R. de Bruin,Stomatal behaviour and photosynthetic rate of unstressedgrapevines in semi-arid conditions, Agric. For. Meteorol., 80,111±134, 1996.
Jacquart, C., and E. Choisnel, Un modeÁ le de bilan hydriquesimpli®e aÁ deux re servoirs utilisable en agrome te orologie, LaMeÂteÂorol., 8(9), 29±43, 1995.
Koster, R. D., and P. C. D. Milly, The interplay betweentranspiration and runo� formulations in land surface schemesused with atmospheric models, J. Clim., 10(7), 1578±1591,1997.
Lagouarde, J.-P., Use of NOAA-AVHRR data combined with anagrometeorological model for evaporation mapping, Int. J.Remote Sens., 12(9), 1853±1864, 1991.
Laurent, J.-P., Evaluation des parameÁ tres thermiques d'un milieuporeux: optimisation d'outils de mesure `in situ', Int. J. HeatMass Trans., 32(7), 1247±1259, 1989.
Mahfouf, J.-F., A. O. Manzi, J. Noilhan, H. Giordani, and M.De que , The land surface scheme ISBA within the Me te o-Franceclimate model ARPEGE. Part I: implementation and prelimi-nary results, J. Clim., 8(8), 2039±2057, 1995.
Mahfouf, J.-F., C. Ciret, A. Ducharne, P. Irannejad, J. Noilhan,et al., Analysis of transpiration results from the RICE andPILPS workshop. Global Planet. Change, 13, 73±88, 1996.
Noilhan, J., and S. Planton, A simple parametrisation of landsurface processes for meteorological models, Mon. WeatherRev., 117, 536±549, 1989.
Noilhan, J., and J.-F., Mahfouf, The ISBA land surface parametri-sation scheme. Global Planet. Change, 13, 145±159, 1996.
Noilhan, J., J.-F. Mahfouf, A. Manzi, and S. Planton, Validation ofland-surface parametrisations: developments and experimentsat the French weather service, in Validation of models overEurope (2), ECMWF seminar proceedings, Reading [7±11September 1992] pp. 125±158, 1993.
Olioso, A., Simulation des e changes d'e nergie et de masse d'uncouvert ve ge tal, dans le but de relier la transpiration et laphotosyntheÁ se aux mesures de re ¯ectance et de tempe rature desurface. PhD Thesis, University of Montpellier, France, 1992.
Olioso, A., T. Carlson, and N. Brisson, Simulation of diurnaltranspiration and photosynthesis of a water stressed soybeancrop, Agric. For. Meteorol., 81, 41±59, 1996a.
Olioso, A., O. Taconet, and M. Ben Mehrez, Estimation of heat andmass ¯uxes from IR brightness temperature, IEEE Trans.Geosci. Remote Sensing, 34, 1184±1190, 1996b.
Sellers, P., F. G. Hall, G. Asrar, D. E. Strebel, and R. E. Murphy,An overview of the First International Satellite Land SurfaceClimatology Project (ISLSCP) Field Experiment (FIFE), J.Geophys. Res., 97(D17), 18 345±18 371, 1992.
Shuttleworth, W. J., and J. S. Wallace, Evaporation from spacecrops ± an energy combination theory, Q. J. R. Meteorol. Soc.,111, 839±855, 1985.
Staley, D. O., and G. M. Jurica, E�ective atmospheric emissivityunder clear skies, J. Appl. Meteorol., 11, 349±356, 1972.
Trou¯eau, D., J. P. Lhomme, B. Monteny, and A. Vidal, Sensibleheat ¯ux and radiometric surface temperature over sparseSahelian vegetation. I. An experimental analysis of the kB)1
parameter, J. Hydrol., 188±189, 815±838, 1997.Vachaud, G., A. Passerat de Silans, P. Balabanis, and M. Vauclin,
Temporal stability of spatially measured soil water probabilitydensity function, Soil Sci. Soc. Am. J., 49(4), 822±828, 1985.
Van Genuchten, M. T., A closed-form equation for predicting thehydraulic conductivity of unsaturated soils, Soil Sci. Soc. Am.J., 44, 892±899, 1980.
Vauclin, M., and J.-L. Chopart, L'in®ltration multi-disques pour lade termination in situ des caracte ristiques hydrodynamics de lasurface d'un sol gravillonaire de la Coà te d'Ivoire, Agron. Trop.,46, 259±271, 1992.
Verhoef, A., H. A. R. de Bruin, and B. J. J. M. Van den Hurk, Somepractical notes on the parameter kB)1 for sparse vegetation,J. Appl. Meteorol., 36(5), 560±572, 1997.
Winkel, T., and S. Rambal, Stomatal conductance of somegrapevines growing in the ®eld under a mediterranean environ-ment, Agric. For. Meteorol., 51, 107±122, 1990.
854 J.-C. Calvet et al.: MUREX: a land-surface ®eld experiment