muse unravels the ionisation and origin of metal enriched
TRANSCRIPT

Astronomy & Astrophysics manuscript no. 0943_absorption c©ESO 2019April 11, 2019
MUSE unravels the ionisation and origin of metal enrichedabsorbers in the gas halo of a z = 2.92 radio galaxy
S. Kolwa1, J. Vernet1, C. De Breuck1, M. Villar-Martin2, 3, A. Humphrey4, F. Arrigoni-Battaia5, B. Gullberg6, T.Falkendal1, 7, G. Drouart8, M. Lehnert7, D. Wylezalek1, and A. Man9
1 European Southern Observatory, Karl-Schwarzschild-Str. 2 85748 Garching bei München, Germany2 Centro de Astrobiologia (CSIC-INTA), Carretera de Ajalvir, km 4, E-28850 Torrejon de Ardoz, Madrid, Spain3 Astro-UAM, UAM, Unidad Asociada CSIC, Facultad de Ciencias, Campus de Cantoblanco, E-28049, Madrid, Spain4 Instituto de AstrofÍsica e Ciências do Espaço, Universidade do Porto, CAUP, Rua das Estrelas, Porto, 4150-762, Portugal5 Max-Planck-Institut für Astrophysik, Karl-Schwarzschild-Str. 1, 85741 Garching bei München, Germany6 Centre for Extragalactic Astronomy, Department of Physics, Durham University, South Road, Durham, DH1 3LE, UK7 Institut d’Astrophysique de Paris, UMR 7095, CNRS, Université Pierre et Marie Curie, 98bis boulevard Arago, 75014 Paris, France8 International Centre for Radio Astronomy Research, Curtin University, 1 Turner Avenue, Bentley, Western Australia 6102, Australia9 Dunlap Institute for Astronomy & Astrophysics, 50 St. George Street, Toronto, ON M5S 3H4, Canada
ABSTRACT
We have used the Multi-Unit Spectroscopic Explorer (MUSE) to study the circumgalactic medium (CGM) of a z = 2.92 radio galaxy,MRC 0943-242 by parametrising its emitting and absorbing gas. In both Lyα λ1216 and He ii λ1640 lines, we observe emission withvelocity shifts of ∆3 ' −1000 km s−1 from the systemic redshift of the galaxy. These blueshifted components represent kinematicallyperturbed gas that is aligned with the radio axis, which we interpret as jet-driven outflows. Three of the four known Lyα absorbersare detected at the same velocity as C iv λλ1548, 1551 and N v λλ1239, 1243 absorbers, proving that the gas is metal enriched moreso than previously thought. At the velocity of a strong Lyα absorber with an H i column of NH i/cm−2 = 1019.2 and velocity shift of∆3 ' −400 km s−1, we also detect Si ii λ1260 and Si ii λ1527 absorption, which suggests that the absorbing gas is ionisation bounded.With the added sensitivity of this MUSE observation, we are more capable of adding constraints to absorber column densities andconsequently determining what powers their ionisation. To do this, we obtain photoionisation grid models in cloudy which show thatAGN radiation is capable of ionising the gas and producing the observed column densities in a gas of metallicity of Z/Z ' 0.01 witha nitrogen abundance a factor of 10 greater than that of hydrogen. This metal-enriched absorbing gas, which is also spatially extendedover a projected distance of r & 60 kpc, is likely to have undergone chemical enrichment through stellar winds that have swept upmetals from the interstellar-medium and deposited them in the outer regions of the galaxy’s halo.
Key words. galaxies: active – galaxies: individual: MRC 0943-242 – galaxies: halos – ISM: jets and outflows
1. Introduction
High redshift radio galaxies (HzRGs) host very powerful activegalactic nuclei (AGN) and occupy the upper echelons of stellar-mass distributions for galaxies across cosmic time (Jarvis et al.2001; De Breuck et al. 2002; Rocca-Volmerange et al. 2004;Seymour et al. 2007). They are often enshrouded by giant Lyαemitting haloes that cover regions extending out to ≥ 100 kpcin projection (e.g., Baum et al. 1988; Heckman et al. 1991; vanBreugel et al. 2006; McCarthy et al. 1990b; van Ojik et al. 1996).These massive haloes also tend to have filamentary and clumpysub-structures within them (Reuland et al. 2003).
In the case of some HzRGs, extended low surface brightnesshaloes are found to have quiescent kinematics with line widthsand velocity shifts in the order of a few 100 km s−1 (Villar-Martín et al. 2003). Whilst in the high surface brightness regionsof these nebulae, perturbed gas kinematics with line widths andvelocity shifts that are > 1000 km s−1 are frequently seen inthe extended emission line region (EELR) (e.g., McCarthy et al.1996; Roettgering et al. 1997; Villar-Martín et al. 1999). Giventhe alignment of the radio axis with the turbulent kinematics,this has often been interpreted as evidence for jet-gas interac-tions (e.g., Humphrey et al. 2006; Morais et al. 2017; Nesvadba
et al. 2017a,b). Generally, for these reasons, HzRGs are consid-ered some of the best laboratories for studying ionisation andkinematics of gas as well as the mechanisms that power theseprocesses.
Among these processes are accretion, ionised gas outflows,chemical enrichment and recycling of metal-enriched materialwhich have either been observed or predicted to occur within thecircumgalactic medium (see Tumlinson et al. (2017) for a for-mal review). We can find evidence for this within the halo gassurrounding HzRGs that comprises both the interstellar-(ISM)and the circumgalactic mediums (CGM). The latter is our mainfocus due to it being the gas interface that bridges the gap be-tween the local ISM of a galaxy and the intergalactic medium(IGM) surrounding it.
CGM gas processes have been observed in the form of accre-tion of IGM gas along the large-scale filaments, into the halo gasof quasars and HzRGs (e.g., Vernet et al. 2017; Arrigoni Battaiaet al. 2018). They have also been seen as what may possibly begas being expelled from the ISM in the form of AGN-driven out-flows or negative feedback (e.g., Holt et al. 2008; Reuland et al.2007; Nesvadba et al. 2008; Bischetti et al. 2017). Moreover, nu-merous detections of diffuse, ionised gas around powerful radiogalaxies have also been made in observations of ISM and CGM
Article number, page 1 of 21
arX
iv:1
904.
0511
4v1
[as
tro-
ph.G
A]
10
Apr
201
9

A&A proofs: manuscript no. 0943_absorption
gas (e.g., Tadhunter et al. 1989; McCarthy et al. 1990a; Penter-icci et al. 1999, Gullberg et al. 2016 is G16 from hereon). Whilethe infall of recycled gas back into the ISM has been predictedby simulations (e.g., Oppenheimer & Davé 2008; Oppenheimeret al. 2010, 2018) and observed within the haloes of powerfulHzRGs (e.g., Humphrey et al. 2007; Emonts et al. 2018).
The CGMs of HzRGs are multi-phase, consisting of ionised,neutral and molecular gas. The ionised gas is often locatedwithin the EELR, where it has been heated and ionised by star-formation, jet-driven shocks and the AGN, emitting rest-frameultraviolet (UV)/optical photons (e.g., Villar-Martin et al. 1997;De Breuck et al. 1999, 2000; Best et al. 2000; Vernet et al. 2001;Binette et al. 2003; Villar-Martín et al. 2007; Humphrey et al.2008b). Whereas, molecular gas, which is often considered atracer for star-formation, is detected at mm/sub-mm wavelengths(Emonts et al. 2015). The neutral hydrogen component of theCGM can be parametrised by tracing Lyα emission and absorp-tion when H i cannot be directly detected via the 21 cm line (e.g.,Barnes et al. 2014).
In the Lyα lines detected within HzRGs haloes, the ab-sorption line spectrums are superimposed onto the often brightLyα emission line profiles (e.g., Rottgering et al. 1995). Toquantify the absorption in the gas, standard line fitting routinesare invoked. With these, the H i gas causing resonant scatter-ing/absorption of Lyα emission can be parametrised in terms ofits kinematics and column densities. Studies using this methodhave found an anti-correlation between the radio sizes of HzRGsand the measured H i column densities of the absorbers whichtend to be primarily blueshifted relative to the systemic veloc-ity of a source (van Ojik et al. 1997), which is also observedin Lyα blobs surrounding star-forming galaxies (Wilman et al.2005). Furthermore, Wilman et al. (2004) have shown that Lyαabsorbers in HzRGs generally exist in either one of two forms.They are either weak absorbers with column densities rangingfrom NH i/cm−2 ' 1013 − 1015 and possibly form part of the LyαForest or they are strong absorbers with NH i/cm−2 & 1018 thatform behind the bow shocks of radio jets, undergoing continualfragmentation as the jet propagates (Krause 2002, 2005).
Evidence of Lyα absorption is seen both in alignment withthe radio jets and at larger angles from it, proving that H i ab-sorbing gas can be very extended, covering almost the entire ex-tended emission line region of an HzRG (Humphrey et al. 2008a;Swinbank et al. 2015; Silva et al. 2018a, Silva et al. 2018b isS18 from hereon). Such absorbers are thought to be shells of ex-tended gas intercepting radiation from the EELR (Binette et al.2000). In these gas shells, C iv absorption has also been detected,indicating that they have been metal enriched. Often, C iv col-umn densities are found to be similar in magnitude to those ofweak Lyα absorbers (Villar-Martín et al. 1999; Jarvis et al. 2003;Wilman et al. 2004). In addition to being enriched with met-als, results from spectro-polarimetry have suggested that at leastsome of these type of absorbers also contain dust (Humphreyet al. 2013).
The subject of this work, MRC 0943-242, is an HzRG atz = 2.92 which has a distinct Lyα profile featuring four dis-crete absorption troughs, first revealed by long-slit, high reso-lution spectroscopy (Rottgering et al. 1995). At even higher res-olutions, the four discrete Lyα absorbers initially detected havebeen confirmed with evidence for an asymmetric underlying Lyαemission profile also being seen (e.g., Jarvis et al. 2003; Wilmanet al. 2004; S18). Three of the Lyα absorbers fall into the classof weak absorption-line gas as defined by Wilman et al. (2004)while one of the Lyα absorbers has an unusually high H i columndensity of ' 1019 cm−2.
MUSE (Multi-unit Spectroscopic Explorer) observations ofthe source have provided a spatially resolved view of the varia-tion in the Lyα line and shown that the strong Lyα absorber inthis source is extended to radial distances of r & 65 kpc from thenucleus (e.g., G16). Furthermore, S18 showed that degeneracybetween H i column density and Doppler parameter suggests analternative H i column density solution of the strongest absorberi.e. NH i/cm−2 = 1015.2. In the same study, the velocity gradientof the said absorber shows evidence for it being in outflow giv-ing credence to the idea that it formed from an early feedbackmechanism (Binette et al. 2000; Jarvis et al. 2003).
These studies show that the high H i column density ab-sorber, in particular, is a low metallicity (i.e., Z/Z ' 0.01−0.02)gas shell that may have been ejected by previous AGN activ-ity. With respect to the ionisation of the absorber, stellar pho-toionisation has been said to power the strong Lyα absorber (Bi-nette et al. 2006). However, much of the progress that has madein determining the ionising mechanism for the absorbers hasbeen hampered by the fact that only column densities of H i andC iv were available, at the time. As discussed by Binette et al.(2006), constraints from other lines such as N v are needed todraw stronger conclusions about the source of ionisation and thechemical enrichment history of the gas.
In this work, we place additional constraints on absorptionin C iv, N v and Si iv. This is possible with MUSE which hasthe sensitivity and spatial resolution needed to measure the size,mass and kinematics of both the emitting and absorbing gasaround HzRGs (e.g., Swinbank et al. 2015; G16; S18). Both G16and S18 used the MUSE commissioning data which had an on-target time of 1-h. The observations used in this work were ob-tained over a 4-h on-source integration time and thus have highersignal-to-noise detections of the rest-frame UV lines. Hence, wehave been able to detect absorption in resonance lines of lowersurface brightness than Lyα and C iv which both G16 and S18have already studied using MUSE data.
The paper is structured in the following way. We providean outline of the data acquisition and reduction steps in Sec-tion 2. Section 3 is dedicated to explaining the details behindthe line-fitting routine. In Section 4, we present the line modelsfor the emitting and absorbing gas components. In Section 5, wedescribe the size, shape, mass and give the ionised fraction ofthe strongest Lyα absorber. The column densities of absorbers inMRC 0943-242 are compared to quasars absorbers in Section 7.We use photoionisation models to assess whether the AGN canionise the absorbers to match the observed chemical abundancelevels in Section 8. We provide an interpretation of our results inSection 9 and summarise the main findings in Section 10.
Throughout the paper, we use ΛCDM results from the Planck2015 mission i.e. H0 = 67.8 km s−1 Mpc−1, ΩM = 0.308 (PlanckCollaboration et al. 2016). At the redshift of the galaxy, z = 2.92,a projected distance of 1′′subtends a distance of 7.95 kpc.
2. Observations and Data Reduction
2.1. MUSE
MUSE observations were carried out on the Very Large Tele-scope (VLT) during 2015-12-14 to 2015-12-15 and 2016-01-14 to 2016-01-18 UT. For the radio galaxy studied in this pa-per, MRC 0943-242, the observations were obtained under theprogram run 096.B-0752(A) (PI: Vernet). In the extended wide-field mode, MUSE observes over a wavelength range of λ =
4650−9300 Å without the use of adaptive optics (WFM-NOAO-E). The instrument resolving power is λ/∆λ = 1700 − 3400
Article number, page 2 of 21

S. Kolwa et al.: MUSE unravels the ionisation and origin of metal enriched absorbers in the gas halo of a z = 2.92 radio galaxy
which corresponds to a spectral resolution of ∆λ = 2.82 − 2.74Å or ∆3 ∼ 180 − 90 km s−1 (ranging from blue to red). MUSEhas a spectral binning of 1.25 Å pix−1 and field-of-view (FOV)that is 1 × 1 arcmin2 in size with a spatial sampling of 0.2 × 0.2arcsec2 (Bacon et al. 2014).
Observations of the target, MRC 0943-242, were obtainedover 8 × 30-min observing blocks (OBs) amounting to 4-hr ofon-source time. The average seeing disc diameter for the run, un-der clear conditions, is estimated to be FWHM = (0.74 ± 0.04)′′.We reduced the raw data in esorex using the MUSE Data Re-duction Software (MUSE DRS) pipeline, version 1.6.2 (Weil-bacher et al. 2014). The data were subsequently processed withthe standard MUSE reduction recipe with individual OB expo-sures being combined at the end of the procedure to create thefinal datacube.
Sky subtraction of the data was performed using the principalcomponent analysis (PCA) algorithm, Zurich Atmosphere Purge(zap), which was developed for use on MUSE data (Soto et al.2016). After a coarse sky subtraction is carried out, the PCAremoves sky residuals that result from spaxel to spaxel (spatialpixel) variations in the line spread function.
The MUSE astrometry loses precision due to instrument ef-fects hence we add a slight correction to the astrometry of thefinal datacube. This was done by identifying field stars in theMUSE FOV from the GAIA DR2 (Data Release 2) catalogue(Gaia Collaboration et al. 2016, 2018) and computing their as-trometry offsets from the GAIA DR2 frame. We calculated theseoffsets for 8 field stars and used the average right-ascension anddeclination shifts to reset the central pixel co-ordinates in theMUSE cube header which made the MUSE co-ordinate framemore accurate.
2.2. UVES
To supplement this study, we have obtained ancillary datafrom the VLT instrument, the Ultraviolet Echelle Spectrograph(UVES) (D’Odorico et al. 2000; Dekker et al. 2000). These ob-servations show the Lyα line in the spectrum of MRC 0943-242(Jarvis et al. 2003; Wilman et al. 2004; S18). During this 3.4-hobservation, the red arm of the instrument was used and the con-figuration was set to a central wavelength of 5800 Å. The widthsof the spatial and spectral binning were 0.5′′and 0.05 − 0.06Å. The observing conditions resulted in an average seeing discof 0.8′′. The data was reduced using iraf invoking the stan-dard recipe for echelle spectroscopic data outlined in Churchill(1995).
To obtain the archival 1D spectrum used in this work, theslit was positioned at an angle of 74 east of north with a widthof 1.2′′, length of 5′′that covered all of the emission from thebrightest regions of the gas halo. The spectral resolution rangedbetween 25, 000− 40, 000 or 12− 8 km s−1 ranging from blue tored.
UVES is better able to resolve the most narrow absorptionlines because of its very high spectral resolution. Narrow linesare broadened by instruments, such as MUSE, that have moder-ate spectral resolution. Hence, the UVES data serves the purposeof allowing us to check the validity of the spectral line-fitting thatwe perform.
14623’15" 12" 09" 06"
-2428’46"
48"
50"
52"
54"
RA (J2000)
DEC
(J2000)
0.00
0.02
0.04
0.06
0.08
SB
(10−
17erg
s−
1cm−
2A−
1arcsec−
2)
Fig. 1. MUSE line plus continuum (white light) image of MRC 0943-242. At the centre of the image is the high surface brightness (SB) re-gion of the galaxy halo. The circle represents the aperture from whichthe spectrum in Fig. 2 is obtained. The UVES slit (dotted outline) has a1.2′′width and extends over 5′′.
3. Spectrum Extraction and Line Fitting Method
3.1. 1D Spectrum Extraction
With the goal of studying the absorbing gas surrounding the hostgalaxy of MRC 0943-242 (which we refer to as Yggdrasil, fol-lowing the naming convention provided in G16), we extract a 1Dspectrum from a sight-line in the MUSE datacube where the sur-face brightness of rest-frame UV emission is highest. We refer toit as the high surface brightness region (HSBR), within the gashalo of Yggdrasil, which we are interested in studying (shown inFig. 1). Although, it sits within the brightest parts of the gas halo,it is not the location of the AGN because this cannot be easilyinferred. From this HSBR, we extract the 1D spectrum over anaperture of radius is R=3 spaxels or R=0.6′′centred at the bright-est spatial pixel or spaxel located at the co-ordinates, (α, δ) =(14523′11.70′′,−2428′49.58′′). Collapsing the sub-cube spa-tially by summing the flux over all spaxels, we obtain the rest-frame UV spectrum shown in Fig. 2.
3.2. Line-fitting Procedure
The goal of this work is to parametrize the physical conditionsof gas in the halo of the radio galaxy, Yggdrasil. To do this, weuse the line profiles of ions that undergo resonance transitionsi.e. Lyα λ1216, C iv λλ1548, 1551, N v λλ1238, 1243 and Si ivλλ1393, 1402 (see Fig. 2). We apply line-fitting procedures thatcombine Gaussian and Voigt models in order to characterise theemission and absorption simultaneously. The emergent emissionis Fλ = Fλ,0e−(τλ,1+...+τλ,n) for n absorbers, where the unabsorbedemission, Fλ,0, is denoted by the Gaussian function,
Fλ,0 =F
σλ√
2πexp
−12
(λ − λ0
σλ
)2 (1)
where F is the integrated flux of the underlying emission, λ0 theGaussian line centre, σλ the line width, and λ the wavelength.The absorption is quantified by the optical depth, τλ, which isdenoted by the Voigt-Hjerting function,
τλ =N√πe2 fλ2
0
∆λDmec2 H(a, u), (2)
Article number, page 3 of 21

A&A proofs: manuscript no. 0943_absorption
λ (Angstrom)0.0
2.0
4.0
6.0
8.0
10.0L
yα
SiI
I1
26
0
CII
NIV
]
SiI
I1
52
6
HeI
I
CII
]
NV
do
ub
let
SiI
Vd
ou
ble
t
CIV
do
ub
let
OII
I]d
ou
ble
t
NII
I]d
ou
ble
t
CII
I]d
ou
ble
t
4800 5200 5600 6000 6400 6800 7200 7600 8000 8400 8800 9200
λobs (A)
0.0
0.1
0.2
1200 1400 1600 1800 2000 2200
λrest (A)
Fλ
(10−
17
erg
s−1
cm−
2A−
1)
Fig. 2. A MUSE spectrum of the high surface brightness region in the halo of MRC 0943-243. The spectrum contains several rest-frame UV lineswhich are labelled and indicated by the dashed vertical lines. The upper panel shows the entire flux density range for the spectrum, while the lowerpanel covers only the low flux density range which shows the lower S/N lines more clearly.
where N is the column density, e (electron charge), me (electronmass) and c (light speed) are fundamental constants, and f isthe oscillator strength. H(a, u) is the Hjerting function in whicha ≡ Γλ2
04πc∆λD
and u ≡ (λ−λ0)∆λD
such that Γ is the Lorentzian width,∆λD is the Doppler parameter (also b parameter), and λ − λ0,is the frequency shift from the line centre (λ0). H(a, u) is ob-tained from the Tepper-García (2006) approximation which iswell suited for absorption systems that have column densitiesN/cm−2 ≤ 1022. When fitting the absorption, we also make thesimplifying assumption that each cloud of absorbing gas coversthe emission line region with a unity covering factor (C ' 1.0).
We use the python package, lmfit, to carry out the non-linearleast squares fitting (Newville et al. 2016). Our fitting method ofchoice is the Levenberg-Marquardt algorithm which performsthe χ2-minimization that yields our best fit results. In the figures,we report reduced chi-squared value, χ2
ν = χ2/(N − Ni), whereN is the number of data points and Ni is the number of free pa-rameters. For each line, we calculate the local continuum levelby masking the line emission and fitting a first-order polynomialto the surrounding continuum. The first order polynomial is sub-tracted from both the line and continuum of He ii and Lyα whichare bright enough that not fitting the continuum ends up havinglittle effect on the overall fit. For C iv, N v and Si iv, which arelower in surface brightness (than Lyα and He ii) the continuumis more important.
Fitting Gaussian and Voigt functions simultaneously resultsin the composite model having a high number of fit parameters.To prevent over-fitting and also obtain a physical result, we useLyα and He ii as initial guesses when fitting underlying emissionand absorption profiles to the C iv, N v and Si iv+O iv] lines.
From the He ii fit (described later in section 4.1), we obtainthe best fit results for Gaussian fluxes (Fλ), line widths (σλ) and
line centres (λ0). ∆λ0,He ii is the error on the fitted He ii line cen-tre such that λ0,He ii = 6436.09 ± 0.30 Å. Note that the line cen-tres are in agreement with the He ii systemic velocity (or zerovelocity which is fixed to the systemic redshift of the galaxy)within its uncertainties i.e. ∆λ0,He ii = 0.30 Å = 10.3 km s−1,under the assumption that all the emission originates from thecentre of the halo. The He ii fit results for line width and the red-shift of the line centre are set as initial guesses in Gaussian fitsfor emission in the resonant lines, C iv, N v, Si iv as well as thenon-resonant O iv] which emits as part of the Si iv+O iv] inter-combination line. Furthermore, we ensure that Fλ and σλ remainpositive.
To fit the Lyα absorption in the MUSE spectrum, we haveused the best fit parameters from literature (i.e., Jarvis et al.2003; Wilman et al. 2004) as initial guesses in the fitting proce-dure. The best fit Lyα absorber redshifts have been passed on asinitial guesses for absorber redshifts in the C iv, N v and Si iv lineprofiles. The initial guesses for column densities and Dopplerparameters are based on rough estimates from the literature (i.e.,Jarvis et al. 2003; Wilman et al. 2004, G16; S18). All three Voigtparameters have a limited parameter space over which a solutioncan be obtained. These parameter constraints are summarised inTable 1.
In the fitting routine, some absorber redshifts are given morefreedom to vary over a given parameter space than others be-cause the ionisation energies of the different gas tracers, H i, C iv,N v and Si iv, differ greatly such that EH i = 13.6 eV, EC iv = 64.5eV, EN v = 97.9 eV and ESi iv = 45.1 eV. It would be unrealisticto expect them to be exist at exactly the same redshifts.
The minimum Doppler parameter permissible in the line-fitting is set by the lower limit of the MUSE spectral resolutionwhich suggests that an approximate lower limit of bmin ∼ σλ =
Article number, page 4 of 21

S. Kolwa et al.: MUSE unravels the ionisation and origin of metal enriched absorbers in the gas halo of a z = 2.92 radio galaxy
90 km s−1 / 2.3548 ' 40 km s−1. We set a conservative upperlimit of bmax = 400 km s−1 for C iv, N v and Si iv with the under-standing that the absorbing gas is kinematically quiet in relationto perturbed gas regions that have FWHM ≥ 1000 km s−1.
In general, Lyα absorbers in HzRG gas nebulae are found tohave low column densities of NH i/cm−2 = 1013−1015 or be opti-cally thick with column densities of NH i/cm−2 > 1018 (Wilmanet al. 2004). Since H i is frequently more abundant than metals inhalo gas environments, we can expect the column densities of themetal ions to be lower. Hence, we set the lower and upper limitsfor permissible fitted column densities as, N/cm−2 = 1012−1020
cm−2. A full summary of the initial boundary conditions in thefitting procedure is given in Table 1.
4. Best fit Line Models
4.1. He ii
He ii λ1640 is the brightest non-resonant emission line and formsthe basis our estimation of the underlying emission profiles ofthe lines we study here i.e. Lyα, C iv, N v and Si iv. In the ex-tracted spectrum, we have obtained a detection of He ii emis-sion which forms through cascade recombination of He++,whichemits a non-resonant photon. The He ii lines is often used to de-termine the systemic redshift of a galaxy (e.g., Reuland et al.2007; Swinbank et al. 2015; S18). Although Lyα is brighter thanHe ii, we refrain from using Lyα for this purpose because of itssusceptibility to radiative transfer effects that clearly affect theemergent line emission.
The He ii line, shown in Fig. 3, has an excess of emissionat ∆3 ∼ −1000 km s−1 which is not present at ∆3 ∼ 1000 kms−1 indicating asymmetry which has been identified before inJarvis et al. (2003) where the excess was found to have littleeffect on the final fit. Our 1D spectrum has brighter line detec-tions and thus, to account for the excess emission in the wing,we fit the He ii line with two Gaussian profiles: one for emis-sion blueshifted relative to and another for emission originat-ing from the systemic velocity. This method has been employedfrequently for fitting asymmetric line profiles from various gasphases (e.g., Mullaney et al. 2013; Cicone et al. 2014; Rakshit &Woo 2018; Hernández-García et al. 2018; Perna et al. 2019).
We have estimated the central velocity of the excess emis-sion in He ii by spatially identifying where its emission peaksin surface brightness (explained further in section 6). The bestfit Gaussian parameters obtained from the spatially offset regionare used to fit the blueshifted emission as a second componentto the emission from the high surface brightness region (HSBR)at the systemic velocity. The result of this fitting procedure isshown in Fig. 3 where the additional component is broadened toa line width of FWHM ' 1000 km s−1 and also blueshifted fromthe systemic velocity. From the He ii best fit result, we obtain afiducial systemic redshift of zsys = 2.9235 ± 0.0001 that denotesthe zero velocity for all the lines identified in Fig. 2.
4.2. H i Lyα
H i Lyα λ1216, is the brightest line in the rest-frame UV spec-trum. We fit the Lyα emission envelope with a double Gaussian:one to the non-absorbed singlet emission at the line centre andanother to the strong blue wing emission at ∆3 ' −1000 kms−1 (see Fig. 4). The motivation for including a second emissioncomponent to the Lyα fit is two-fold: a) it is well detected in theemission line, He ii and therefore likely to also emit in Lyα andb) there is an asymmetry between emission at the blue and red
-3000 -2000 -1000 0 1000 2000 3000∆v (km s−1), λ0:1640A
0
5
10
Fν(µJy)
χ2ν = 0.0484 Blueshifted emission
Systemic HeII λ1640
Best fit
Fig. 3. The He ii λ1640 line in the MUSE spectrum (shown in Fig. 2).The line profile has been continuum subtracted. The best fit model (red)consists of two Gaussian profiles. The first Gaussian component (blue)models the excess blue wing emission at the negative velocities, whilethe second component (orange) models the emission at the systemicvelocity of the galaxy.
wings of Lyα. Once fit, we see that the inclusion of a secondGaussian, improves the Lyα emission fit.
The updated Gaussian fit describes the Lyα profile well inboth MUSE and UVES spectrums and the best fit parameters arein good agreement with the literature (see Tables 3 and 4). Thisis expected since Lyα is affected by radiative transfer effects andtherefore less likely to have a symmetric emission profile. Thereis also an additional underlying kinematic component causingthe blue wing excess, based on the He ii line fit (see Fig. 3).
To account for the absorbers, we fit four Voigt profiles, ashas been done in previous works on this topic (i.e., van Ojiket al. 1997; Jarvis et al. 2003; Wilman et al. 2004; G16; B18).We also convolve the Voigt profiles with the line-spread functionof MUSE, using a Fast-Fourier-Transform similar to that used toconvolve Voigt and LSF (Line Spread Function) profiles in thepackage, vpfit (Krogager 2018). The LSF or instrumental profile(IP) of MUSE, when convolved with the Voigt profile, has anaverage Gaussian width of < σλ > = 2.65 Å.
We show the line-fitting result for Lyα in Fig. 4(a). Belowthis in Fig. 4(b), we show a similar fit to the Lyα profile as it wasdetected with UVES which has an LSF with an average Gaussianwidth of < σλ > = 0.3 Å.
The Lyα absorber redshifts are used to predict the most prob-able redshifts for the absorbers, in general. In particular, theredshifts of the absorbers associated with resonance metal ions,C iv, N v and Si iv, are constrained to stay within 4∆zsys (where∆zsys = 1.35 × 10⁻⁴) agreement of the measured Lyα absorber
Article number, page 5 of 21

A&A proofs: manuscript no. 0943_absorption
∆v (km s−1), λ0:1215A
0
10
20
30
40
50
60
Fν(µJy)
1 2 3 4
(a)χ2ν = 0.2594 Blueshifted emission
Systemic Lyα λ1216
Best fit
-3000 -2000 -1000 -0 1000 2000 3000∆v (km s−1)
0.000
0.025
0.050
0.075
0.100
0.125
0.150
0.175
Flux
(arbitrary
units)
1 2 3 4
(b)χ2ν = 4.7e-05 Blueshifted emission
Systemic Lyα λ1216
Best fit
Fig. 4. MUSE-detected, continuum-subtracted Lyα (upper) and ancil-lary UVES-detected Lyα (lower) are shown. The best fit line model(red) combines Lyα emission and consists of blueshifted and systemiccomponents, as well as the four known absorption troughs.
redshifts. This is done following the hypothesis that Lyα absorp-tion occurs within roughly the same volume of gas as absorptionof photons associated with the resonant transitions.
For this to occur, there would need to be a very strong ionis-ing continuum to produce all of the observed ions which is possi-ble with ionisation by the AGN. The different ionisation energiesalso imply that fixing the absorbers to exactly the same redshiftis unrealistic. This is why we allow the fitted absorber redshiftsto vary over a parameter space that depends on how tightly aparameter needs to be constrained.
4.3. C iv and N v
We have obtained detections of C iv λλ1548, 1551 and N vλλ1238, 1243. Given that Lyα absorber 4 is narrow, it is likely tosuffer the highest degree of instrumental broadening in MUSE,as seen in Fig. 4(a). Hence for C iv and N v, we do not includea fourth absorber in the model. Indeed, at the MUSE spectralresolution we expect to lose any absorption signal from such anarrow absorber. The Voigt profiles have, as with Lyα, been con-volved with the LSF of MUSE.
The observed emission in the doublet lines, C iv and N v, isfit with two Gaussian functions that are constrained according toatomic physics (all constraints are summarised in Table 2). Thelocal continuum has been estimated using a separate linear poly-nomial fit (to the continuum only, with line emission masked).The continuum is thus fixed during fitting. Additionally, in C iv,we fit a second component to each of the doublet lines to accountfor the blueshifted emission seen in He iiwhich has a similar S/Nlevel as C iv. N v has a lower S/N than both of these lines hencethe blueshifted emission is likely to be negligible in this fit.
We obtain atomic constants such as rest wavelengths and os-cillator strengths from the database provided by Cashman et al.(2017). For doublet lines, the ratios of line centres (λ1/λ2) andrest-frame wavelengths are fixed to one another. The doubletemission originates from the same gas hence doublet line widthsare equal i.e. σλ,1 = σλ,2. The doublet ratios (DR = F1/F2) arefixed to the those of the oscillator strengths such that are DR =2. Doublet ratios of 2 observed frequently in quasar absorptionlines where. This is particularly true for C iv lines whose doubletratios vary from 2 to 1 as ones goes from the linear to the satu-rated absorption regimes (Péroux et al. 2004). Hence, assumingthat C iv and N v absorbers 1 and 3 are not saturated and havea unity covering factor, C ' 1.0 since their emission does notreach zero flux level at the absorber velocities, we set DR = 2when fitting.
The best fit models for C iv and N v are shown in Figs 5 and6. The emission and absorption fit results are shown in Tables 5and 6, respectively. We note that both C iv and N v fits featurea slight kink at ∆3 ∼ −2000 km s−1. This may be result of thecolumn density of absorber 1 being over-estimated at this veloc-ity which could imply that the blueshifted C iv emission is notimpeded by absorber 1, as we have assumed. Rather, absorber 1covers the emission line region behind it the blueshifted emis-sion. Determining which absorbers cover the systemic and/orthe blueshifted emission is a task that will require higher spa-tial and/or spectral resolution. For simplicity, we assume that allthree absorbers impede the systemic, blueshifted and continuumemission components.
4.4. Si iv+O iv]
The detected Si iv λλ1393, 1402 line doublet overlaps with emis-sion from the O iv] quintuplet. Si iv is a resonance line and wemodel it with an absorption line at the same velocity as Lyα ab-sorber 2. We do not include absorbers 1 and 3 because the fitdoes not change significantly when they are added.
As before, the Voigt profile is convolved with the LSF ofMUSE and the Si iv doublet emission is modelled by two Gaus-sians. Again, we have fixed the continuum to the result of thelinear polynomial fit of the local continuum (while the line emis-sion was masked). The O iv] quintuplet comprises five emissioncomponents at the rest-frame wavelengths for O iv] which are1397.2 Å, 1399.8 Å, 1401.2 Å, 1404.8 Å, 1407.4 Å. To fit these,we use five Gaussian profiles with equal line widths. The quin-
Article number, page 6 of 21

S. Kolwa et al.: MUSE unravels the ionisation and origin of metal enriched absorbers in the gas halo of a z = 2.92 radio galaxy
-3000 -2000 -1000 0 1000 2000 3000∆v (km s−1), λ0:1550A
0
5
10
15
Fν(µJy)
1
1
2
2
3
3
χ2ν = 0.0830 Blueshifted CIV λ1548
Systemic CIV λ1548
Blueshifted CIV λ1551
Systemic CIV λ1551
Best fit
-3000 -2000 -1000 0 1000 2000 3000 4000∆v (km s−1), λ0:1548A
Fig. 5. Best fit line model to C iv λλ1548, 1551 detected with MUSE.The green and orange dashed lines represent the underlying doubletemission at wavelengths of 1548 Å and 1551 Å, which are the rest-frame velocities, in the upper and low axes, respectively. Three Voigtprofiles model the absorbers for each emission line in the doublet.
tuplet ratios are set by the oscillator strengths of each transi-tion. We show the fit for the intercombination Si iv+O iv] lines inFig. 7, with the absorption fit results shown in Table 5 and thosefor emission shown in Table 6.
In an attempt to confirm the consistency of this result, wecompare the fluxes of the same Si iv and O iv] lines detected athigh spectral resolution for the binary symbiotic star, RR Tele-scopii in shown in Fig. 5 of Keenan et al. (2002). The best fitflux ratios for O iv] are consistent with those of the high resolu-tion stellar spectrum, which is the perhaps the best observationalcomparison available for Si iv and O iv] intercombination linefluxes.
4.5. Si ii
We have detected Si ii λ1260 and Si ii λ1527 absorption in therest-frame UV spectrum which are fit with Gaussians to accountfor the absorbed components (see Figs 8 and 9). Using this fit,we estimate their velocity shifts and column densities using theapproximation from Humphrey et al. (2008a),
N ≥Wλmec2
πe2 fλ20
, (3)
where N is the column density, Wλ is the observed equivalentwidth, me is the electron mass, c is the light-speed, e is the elec-tron mass, f the oscillator strength and λ0 the rest wavelengthof the line. The column densities are lower limits because it is
-3000 -2000 -1000 -0 1000 2000 3000∆v (km s−1), λ0:1242A
0
1
2
3
Fν(µJy)
1
1
2
2
3
3
χ2ν = 0.0349 Systemic NV λ1239
Systemic NV λ1243
Best fit
-2000 -1000 0 1000 2000 3000 4000∆v (km s−1), λ0:1238A
Fig. 6. Best fit line model to N v λλ1238, 1242 detected with MUSE.The green and orange dashed lines represent the underlying doubletemission at the rest-frame wavelengths, 1238 and 1242 Å which arefixed to the systemic velocity in the upper and low axes. Three Voigtprofiles model the absorbers for each emission line in the doublet.
not possible to determine whether the lines are in the linear orlogarithmic (flat) part of the curve of growth.
The column densities of the Si ii lines place them in the cat-egory of weak absorbers. Their velocity shifts are in agreementwith that of Lyα absorber 2 meaning that these absorptions alsooccur within roughly the same gas volume as those of H i, C iv,N v, Si iv absorbers (as Fig. 10 shows). One implication of thisfinding is that it is unlikely for the strong absorber to be matterbounded1. For absorber 2 to be matter-bounded, low ionisationspecies such as Si ii would exist in only trace amounts comparedto higher ionisation lines. A clear detection of both these ionsat the same velocity as the strong absorber proves that the ab-sorber is more probably ionisation bounded and therefore unitycovering factor. This also implies that ionising photons will notbe able to escape from the CGM of this source and that ionisingradiation emerging emerging from the halo will not contributesignificantly to the metagalactic background or ionisation of gasin intergalactic medium (IGM).
4.6. C iii] and C ii]
The gas tracers C iii] λλ1906, 1908 and C ii] λ2326 are non-resonant lines but useful tracers when searching for evidenceof shock ionisation which we discuss in more detail in sec-tion 8. Hence, we have included them in the line-fitting routine.
1 A matter bounded cloud is insufficiently optically thick to absorb allof the incident UV photons.
Article number, page 7 of 21

A&A proofs: manuscript no. 0943_absorption
Table 1. Lower and upper bounds placed on initial conditions in the line-fitting routine.Note:∆ is the largest permissible deviation (from the initial guess) imposed on a fit parameter.
Fit parameters Boundary conditions
Gaussian (for emission):
Line centre, λ0 (Å) ∆λ0 = 0.3Line flux, F (erg s−1 cm−2) F ≥ 0Line width, σλ (Å) σλ > 0
Voigt (for absorption):
Redshift, z:Lyα ∆z1 ≤ 5.0 × 10⁻³
∆z2 ≤ 1.0 × 10⁻³
∆z3 ≤ 4.0 × 10⁻³
∆z4 ≤ 3.0 × 10⁻³
C iv ∆zn ≤ 6.0 × 10⁻⁴
Si iv and N v ∆zn ≤ 6.0 × 10⁻³
Doppler parameter, b (km s−1):Lyα, C iv, N v and Si iv 40 ≤ b ≤ 400
Column density, N (cm−2):Lyα 1012 ≤ N ≤ 1020
C iv, N v and Si iv 1013 ≤ N ≤ 1016
Table 2. The doublet constraints, set by atomic physics, are embedded in the fitting to obtain best fit results for C iv, N v and Si iv+O iv]. Theflux ratios (F1/F2) are equal the oscillator strengths ratios ( f1/ f2). The line centre ratios (λ0,1/λ0,2) are equal to the rest-frame wavelengths ratios(λ1/λ2). The redshift, z, Doppler parameter and column density, N are equal between doublet wavelengths. The O iv] quintuplet constraints aresimilar to those of the doublets. The fourth quintuplet line, 1404.8 Å, is the brightest of the O iv] quintuplets, hence the other four O iv] lines arefixed to it.
Fit Parameters Rules
Gaussian parameters for doublet lines:
Line centre, λ0 (Å) λ0,1
λ0,2= λ1
λ2
Line flux, F (erg s−1 cm−2) F1F2
=f1f2
Line width, σλ (Å) σλ,1 = σλ,2
Gaussian parameters for O iv] quintuplet line (n = 1, 2, 3, 5):
Line centre, λ0 (Å) λ0,n
λ0,4= λn
λ1
Line flux, F (erg s−1 cm−2) FnF4
=fnf4
Line width, σλ (Å) σλ,4 = σλ,n
Voigt parameters for multiplet lines with n transitions:
Redshift, z z1 = znDoppler parameter, b (km s−1) b1 = bnColumn density, N (cm−2) N1 = Nn
Article number, page 8 of 21

S. Kolwa et al.: MUSE unravels the ionisation and origin of metal enriched absorbers in the gas halo of a z = 2.92 radio galaxy
Table 3. Best fit results to the absorbers in the UVES Lyα spectrum from this work and the literature of Jarvis et al. (2003) and Wilman et al.(2004).
Absorber Absorber redshift Column density Doppler parameter# z NH i (cm−2) b (km s−1)
UVES(this work)
1 2.9063 ± 0.0001 (1.363 ± 0.217) × 1014 107 ± 152 2.9185 ± 0.0001 (1.262 ± 0.148) × 1019 58 ± 13 2.9262 ± 0.0001 (5.166 ± 0.824) × 1013 133 ± 154 2.9324 ± 0.0001 (2.232 ± 0.310) × 1013 25 ± 4
UVES(literaturea)
1 2.9066 ± 0.0062 (1.047 ± 0.314) × 1014 88 ± 452 2.9185 ± 0.0001 (1.202 ± 0.072) × 1019 58 ± 33 2.9261 ± 0.0005 (3.548 ± 0.568) × 1013 109 ± 354 2.9324 ± 0.0001 (2.239 ± 0.672) × 1013 23 ± 17
Table 4. Best fit results to the non-absorbed emission in the UVES spectrum. The flux units are arbitrary (arb.). Blueshifted lines are labelled bythe abbreviation “bl.”.
UVESLine Line centre (rest) Line centre (obs.) Line flux Line width
λ0 (Å) λ (Å) F (arb. units) FWHM (km s−1)
Lyα 1215.67 4769.07 ± 2.76 0.56 ± 0.14 1427.67 ± 82.47Lyα (bl.) " 4751.99 ± 16.73 0.01 ± 0.01 1525.40 ± 779.05
To the C iii] doublet, we fit four Gaussian components in totalto account for emission from the doublet at both systemic andblueshifted velocities as we have done for Lyα, He ii and C iv.C iii] has a sufficiently high surface brightness for us to fit it inthe same way. Its best fit result is shown in Fig. 11. C ii] is a sin-glet which showed evidence of very blueshifted emission relativeto systemic and thus we have also added an additional Gaussiancomponent when fitting it (see Fig. 12). The best fit emissionparameters for both of these lines are shown in Table 6.
5. Morphology of the absorbers
The morphology of the absorbers within the circumgalacticmedium of Yggdrasil are a focus of interest because much un-certainty about their origin and probable fate still remains. Al-though the absorbers have been studied extensively using datafrom long-slit (i.e. Rottgering et al. 1995; van Ojik et al. 1997)and echelle spectroscopy (i.e. Jarvis et al. 2003; Wilman et al.2004) which were limited in their ability to provide a spatiallyresolved view of the gas in emission and absorption around Yg-gdrasil. For instance, they were not capable of showing the spa-tial variation in the Lyα profile which indicates variation in thekinematics of the most extended absorber (absorber 2).
The MUSE data we have used to perform resonance line-fitting, above, provides us with the capability of estimating thefull extent and shape of Lyα absorber 2 which has a covering fac-tor of C ' 1.0 as G16 and S18 have both shown. Furthermore, we
can deduce its neutral and also ionised gas mass thus estimatingits total hydrogen gas mass.
5.1. Size, shape, mass and ionisation of the strongest Lyαabsorber
In agreement with previous work on the Lyα line in Yggdrasil,absorber 2, located at a velocity shift of ∆3 ∼ −400 km s−1,reaches zero flux at its line centre. This implies that it is satu-rated with a unity covering factor i.e. C ' 1.0 and Lyα columndensity of ' 1019 cm−2 (see Table 5). In the UVES spectrum,the Lyα absorbers occupy disparate velocities. This implies thatthe structure of the H i gas is likely to be shell-like as Binetteet al. (2000) and Jarvis et al. (2003) have suggested. Guidedby these previous findings and using more recent IFU data, wecan estimate the size, shape and mass of absorber 2 which is thestrongest Lyα absorber.
In terms of location, we rely on the result given in Binetteet al. (2000) which showed that the absorbing and emitting gasare not co-spatial. Rather absorber 2 is further out from the haloand screens the radiation from the extended emission line re-gion. We base the rest of our description of the halo gas on thispredication. The spatial extent of the absorbing H i gas mediumin Rottgering et al. (1995) is found to be r & 13 kpc based onthe extent of Lyα emission measured and the assumption of aunity covering factor for the associated absorption. In G16, vi-sual inspection of the IFU data leads to a value of r & 60 kpc inradial extent. In S18, a velocity gradient across the halo is mea-
Article number, page 9 of 21

A&A proofs: manuscript no. 0943_absorption
Table 5. Best fit results to the absorbers in the MUSE spectrum. The uncertainties reported are 1σ errorbars. The parameters that are prefixed by∼ are those fit parameters that were fit with very large uncertainties in the least-squares fitting routine. Column (1) indicates the absorber (abs.)number. The column density fit parameters with large uncertainties have been quoted as upper limits. Column (4) is the central wavelength (wav.)of the absorber. Column (8) is the rest-frame equivalent width (E.W.) (for Si ii lines only).Note: a Si ii λ1260 and b Si ii λ1526
MUSEAbs. Ion Redshift Absorber wav. Velocity Column density Doppler E.W.# z λ (Å) ∆3 (km s−1) N (cm−2) b (km s−1) Wλ,0
1 Lyα 2.9063 ± 0.0003 4748.74 ± 0.51 −1315 ± 672 (1.64 ± 0.52) × 1014 149 ± 44N v 2.9076 ± 0.0008 4840.85 ± 1.39 −1212 ± 1686 ≤ 1.04 × 10¹⁴ ∼ 101C iv 2.9068 ± 0.0007 6048.40 −1278 ± 1915 ≤ 3.78 × 10¹⁴ 197 ± 93
2 Lyα 2.9184 ± 0.0002 4763.54 ± 0.28 −385 ± 109 (1.63 ± 0.46) × 1019 45 ± 31N v 2.9158 ± 0.0008 4851.01 ± 1.26 −585 ± 740 (9.40 ± 4.10) × 1014 365 ± 78Si iv ∼ 2.9157 5457.49 ∼ −598 ≤ 2.40 × 10¹⁵ ∼ 400C iv 2.9188 ± 0.0001 6067.05 −357 ± 52 (4.52 ± 1.29) × 1014 162 ± 22Si iia 2.9212 ± 0.0001 4942.28 ± 1.67 −175 ± 293 ≥ 1.83 × 10¹⁴ ≥ 0.79Si iib 2.9183 ± 0.0006 5982.04 ± 1.16 −397 ± 461 ≥ 5.35 × 10¹⁴ ≥ 0.41
3 Lyα 2.9273 ± 0.0009 4774.32 ± 1.41 293 ± 412 (2.06 ± 1.54) × 1013 ∼ 104N v 2.9283 ± 0.0006 4866.50 370 ± 363 ≤ 1.61 × 10¹⁴ 157 ± 71C iv 2.9267 ± 0.0006 6079.31 248 ± 297 ≤ 6.03 × 10¹³ 212 ± 81
4 Lyα 2.9321 ± 0.0004 4780.14 ± 0.67 658 ± 442 (2.07 ± 1.28) × 1013 ∼ 50
Table 6. Best fit results to non-absorbed emission in the MUSE spectrum. The uncertainties shown are 1σ errorbars. Values prefixed by ∼ areresults that were fit with very large systemic uncertainties (as in Table 5). Blueshifted lines are labelled by the abbreviation “bl.”.
MUSEIon Line centre (rest) Line centre (obs.) Line flux Line width
λ0 (Å) λ (Å) F (10−17 erg s−1 cm−2) FWHM (km s−1)
Lyα 1215.67 4769.50 ± 2.65 158.5 ± 63.8 1511 ± 108Lyα (bl.) " 4752.23 ± 57.14 ∼ 11.9 ∼ 1302N v 1238.82 4860.80 ± 1.37 6.8 ± 0.9 1180 ± 87
1242.80 4876.49 ± 1.37 3.4 ± 0.5 1175 ± 87Si iv 1393.76 ∼ 5468.70 ∼ 1.4 ∼ 1118
1402.77 ∼ 5504.05 ∼ 0.7 ∼ 1111O iv] 1397.20 ∼ 5481.60 ∼ 0.2 ∼ 920
1399.80 ∼ 5491.80 ∼ 0.5 ∼ 9181401.20 ∼ 5497.29 ∼ 1.1 ∼ 9171404.80 ∼ 5511.42 ∼ 1.2 ∼ 9151407.40 ∼ 5521.62 ∼ 0.5 ∼ 913
C iv 1548.20 6074.59 ± 1.78 20.4 ± 3.1 1090 ± 99C iv (bl.) " 6053.16 ± 20.43 ≤ 1.2 ∼ 877C iv 1550.77 6084.68 ± 1.78 10.2 ± 1.5 1088 ± 99C iv (bl.) " 6063.21 ± 20.39 ≤ 0.6 ∼ 756He ii 1640.40 6436.09 ± 0.30 16.4 ± 0.5 978 ± 24He ii (bl.) " 6413.49 ± 3.05 1.4 ± 0.5 970 ± 225C iii] 1906.7 ∼ 7481.21 ∼ 7.4 ∼ 977C iii] (bl.) " ∼ 7454.92 ≤ 0.5 ∼ 947C iii] 1908.7 ∼ 7489.06 ∼ 3.7 ∼ 976C iii] (bl.) " ∼ 7462.74 ≤ 0.2 ∼ 946C ii] 2326.9 ∼ 9129.26 4.0 ∼ 1300C ii] (bl.) " ∼ 9096.15 1.2 ∼ 1152
Article number, page 10 of 21

S. Kolwa et al.: MUSE unravels the ionisation and origin of metal enriched absorbers in the gas halo of a z = 2.92 radio galaxy
-3000 -2000 -1000 0 1000 2000 3000∆v (km s−1), λ0:1402A
0
1
2
Fν(µJy)
2
2
χ2ν = 0.0522 SiIV λ1393
SiIV λ1402
OIV] quintuplet
Best fit
-1000 0 1000 2000 3000 4000 5000∆v (km s−1), λ0:1393A
Fig. 7. Best fit line model to the intercombination Si iv λλ1393, 1402 +O iv] line in MUSE. The green and orange dashed lines represent theunderlying doublet emission at the rest-frame wavelengths, 1393 and1402 Å which are fixed to the systemic velocity in the upper and lowaxes. The O iv] quintuplet line emission is shown in purple.
-2000 -1000 -0 1000 2000
∆v (km s−1)
20
40
60
80
100
120
140
Fλ(10−
20erg
s−
1cm−
2A−
1)
Fig. 8. Si ii λ1260 absorption line fit with a single Gaussian componentwith the best fit line shown in red.
sured and used to estimate the absorber size which they find tobe r & 38 kpc in radius. In this work, we use the radial size ofH i gas shell from G16 who determined the size by pinpointingthe furthest spaxels from the nucleus of the gas halo, at severalposition angles, where the Lyα absorber 2 is still observed.
-2000 -1000 -0 1000 2000
∆v (km s−1)
50
60
70
80
90
100
110
120
Fλ(10−
20erg
s−
1cm−
2A−
1)
Fig. 9. Si ii λ1527 absorption line fit with a single Gaussian componentwith the best fit line shown in red.
In our data, we find that the absorber extends to projecteddistances of between r = 50 kpc and r = 60 kpc from the highsurface brightness region (HSBR) and is non-isotropic, coveringthe extended emission line region (EELR) over an area of 50 ×60 kpc2.A low surface brightness halo with quiescent kinematics(FWHM = 400 - 600 km s−1) extending out to r = 67 kpc hasbeen detected in this source (e.g., Villar-Martín et al. 2003). Lyα,He ii, N v and C iv emission are detected in the giant halo. In fact,N v appears to be strengthened more so than in the quiescenthaloes of other HzRGs in the Villar-Martín et al. (2003). Giventhe size of the absorber, it is likely that it covers the emissionfrom the giant halo.
Assuming spherical symmetry and density homogeneity ofthe absorbing gas shell, the H i mass is estimated by MH i =4πr2mH iNH i (De Breuck et al. 2003; Humphrey et al. 2008a).Taking into account the estimated size of r & 60 kpc and an H icolumn density of 1019.2 cm−2 (from Table 5), the H i mass ofabsorber 2 is MH i/M = 5.7 × 10⁹(r/60kpc)2 (NH i/1019.2cm−2).Our results are within, at most, two orders of magnitude agree-ment with those in the literature. In Rottgering et al. (1995),the mass of absorber 2 is estimated as, MH i/M & 2.0 ×10⁷(NH i/1019cm−2)(r/13kpc). In G16, this value is MH i/M &3.8 × 10⁹(r/60kpc)2 (NH i/1019cm−2) and the estimate given inS18 of MH i/M & 108.3.
An approximation of the hydrogen ionisation fraction XH ii =H ii/(H i+ H ii) is clearly required to estimate the gas mass of theabsorbing structure from our observational measurement of NH i.In principle, the value of XH ii can vary from zero in the case ofpurely neutral gas, to ∼1.0 in the case of matter-bounded, pho-toionised gas (e.g., Binette et al. 1996; Wilson et al. 1997). In theabsence of a method to directly estimate NH ii, we instead turn tothe carbon ionisation fraction, XC, which we define here as theratio of all ionised species of carbon to all species of atomic car-bon (i.e., ionised or neutral). In the case of Yggdrasil, we com-bine the measurement of NC iv with the upper limit NC i ≤ 1.5×1014 cm−2 from S18, to obtain XC ≥ NC iv/(NC i + NC iv) = 0.8.
Note that this is a lower limit because we have no usefulconstraints on any of the other ionised species of carbon. Thefact that the ionisation energy of C i (11.3 eV) is similar to that ofH i (13.6 eV) means that under photoionisation we can assumethat the ionisation fraction of hydrogen and carbon are similari.e. XH ii ∼ XC, and thus we obtain XH ii >∼ 0.8. This falls within
Article number, page 11 of 21

A&A proofs: manuscript no. 0943_absorption
-4000 -3000 -2000 -1000 0 1000 2000 3000 4000∆v (km s−1)
absorber 1
absorber 2
absorber 3
absorber 4SiII λ1527
SiII λ1260
CIV, S18
CIV, G16
CIV
NV
Lyα, S18
Lyα, G16
Lyα
Fig. 10. Relative velocities of Lyα, N v and C iv and Si ii absorbers from this work as well as those from G16 and S18. The vertical dashed-dotted (black) line indicates the systemic velocity and its error (shaded grey). The horizontal dotted lines (grey) distinguish between the differentabsorbers.
-3000 -2000 -1000 0 1000 2000 3000Velocity (km/s)
0
5
1010
Flux
Density
(µJy)
χ2ν = 7.47 Blueshifted CIII] λ1906
Blueshifted CIII] λ1908
Systemic CIII] λ1906
Systemic CIII] λ1908
Best fit
-2000 -1000 0 1000 2000 3000
Fig. 11. Best fit line model to C iii] λλ1906, 1908 doublet that includesa blueshifted emission component.
the framework of the absorber being ionisation rather than matterbounded suggested by the Si ii detections in section 4.5.
The neutral fraction is what is remaining i.e. XH i . 0.2. As-suming that the absorber is a two-phase medium as in Binetteet al. (2000), the ionised fraction implies that MH ii/MH i >∼ 4.Using this, we can estimate the total hydrogen mass (excludingthe molecular gas contribution) of the absorber such that it is,
-3000 -2000 -1000 0 1000 2000 3000Velocity (km/s)
0
5
Flux
Density
(µJy)
χ2ν = 3.26 Blueshifted CII] λ2326
Systemic CII] λ2326
Best fit
Fig. 12. Best fit line model to C ii] λ2326 singlet that includes ablueshifted emission component.
MT/M & MH i + MH ii = 5MH i hence MT/M & 2.9 × 10¹⁰.Absorber 2 is approximately an order of magnitude lower thanthe stellar-mass of the host galaxy which is M∗/M = 1.2× 10¹¹
(Seymour et al. 2007).
Article number, page 12 of 21

S. Kolwa et al.: MUSE unravels the ionisation and origin of metal enriched absorbers in the gas halo of a z = 2.92 radio galaxy
5.2. Arrangement of the absorbers along the line-of-sight
Fig. 10 shows that Lyα absorption occurs in the same gas vol-ume as absorbers 1, 2 and 3 in C iv, N v and Si iv. We can deter-mine, from the velocities of these absorbers, a) their geometricarrangement in the halo and b) their kinematics. Are these out-flowing (e.g., Zirm et al. 2005; Nesvadba et al. 2006) or infallinggas (e.g., Barkana & Loeb 2003; Humphrey et al. 2008a)?
In agreement with general observations of HzRGs, Lyα ab-sorbers 1 and 2 are blueshifted relative to the systemic velocity(Wilman et al. 2004). According to velocity gradient measuresacross the diameter of the Lyα halo in S18, Lyα absorber 2 isoutflowing. Assuming that absorbers 1, 2 and 3 are outflowing,we can estimate roughly where they are located in relation to oneanother along the line-of-sight. At ∆3 ∼ −1000 km s−1, absorber1 has the highest blueshift and is thus more likely to be found at acloser proximity to the nucleus than absorber 2 which is locatedat ∆3 ∼ −400 km s−1. In other words, absorber 1 has the fastestoutflow velocity and is therefore closer the centre of the halo.Absorber 3 is redshifted relative to the systemic velocity and itmay be infalling. To measure the distances, we require simulatedabundances produced by photoionisation models (shown in sec-tion 8).
6. Blueshifted He ii, Lyα and C iv emission
The blueshifted components in the bright lines He ii, Lyα andC iv are a clear indication of perturbed gas either in the fore-ground of systemic emission in the halo or outflowing along theline-of-sight.
To disentangle to the blueshifted and systemic emission inHe ii, we use narrow-band imaging. A MUSE narrow band imagesummed over a wavelength range of 6400 − 6425 Å is shownas contours in Fig. 13. Note that the contours are continuum-free. Within this chosen wavelength range, we obtain detectionsfrom both the blueshifted and systemic He ii emitters. The imageclearly shows two spatially unresolved components: one at thehigh surface brightness peak and the other spatially offset.
In addition to this spatial separation, the He ii spectrums ex-tracted from each of these two regions shows that emission at thehigh-surface brightness region (HSBR, shown in Fig. 1) is domi-nated by emission from the systemic velocity with trace amountsbeing blueshifted. The blueshifted component, however, under-goes a flux enhancement by an approximate factor of 2 (see Table7) at a projected distance of r = 1.00 ± 0.04′′ = 8.0 ± 0.3 kpcsouth-west (PA ' 225) from the high surface brightness region(HSBR).
For further understanding, we show the MUSE He ii con-tours over a UV/optical Hubble Space Telescope (HST) WideField Planetary Camera 2 (WFPC2) 702W broad-band image.The UV emission detected over 5800−8600 Å appears to have abent morphology that extends in the same direction as the regionwhere He ii is enhanced. Also, both the UV broad-band detectionand the blueshifted He ii are in alignment with the radio axis de-tected by 4.7 GHz Very Large Array (VLA) observations (Carilliet al. 1997; Pentericci et al. 1999).
Obtaining a narrow-band image over a smaller wavelengthrange of 6400 − 6412 Å (blue interval in Fig 14(d)) allows usto disentangle the blueshifted He ii emission from the He ii emis-sion at the systemic velocity. He ii emission from the blueshiftedcomponent only is shown in Fig 14(a) which proves that emis-sion from the blue wing of the He ii line is indeed spatially offsetfrom the high surface brightness region.
He ii emission at the systemic velocity is less concentrated.In fact over the green interval in Fig. 14(d), He ii is diffuse andelongated well beyond the radio lobes indicating possible jet-gas interactions. At the red wing of the line, He ii emission isconcentrated at the eastern lobe and HSBR as Fig. 14(c) shows.
Both Lyα and C iv have evidence for turbulent blueshiftedmotions from the line-fitting presented (see sections 4.2 and 4.3).If the blueshifted component is indeed an outflow, this impliesthat the outflowing gas contains more than one ionised gas tracerwhich we can expect for a bulk outflow of gas from the enrichedISM.
7. Quasar and HzRG absorbers, in comparison
The absorption lines in a quasar continuum emerge from ab-sorption by intervening gas in the inter-galactic medium and thecircumgalactic mediums of foreground galaxies (e.g., Bechtold2001). In this work, we use quasar absorption lines to determinewhether the absorbers in Yggdrasil are associated with the haloof the galaxy or the IGM, assuming that HzRG and quasar ab-sorbers are drawn from the same parent population.
To do this, we compare our results to quasar absorption pa-rameters of H i, N v and C iv for associated quasar absorbersfrom Fechner & Richter (2009). In this work, the absorbing gasidentified as intervening is located at velocity shifts of |∆3| >5000 km s−1 from the quasars in their sample. The associated ab-sorbers are those at velocity shifts, |∆3| > 5000 km s−1 from thequasars. We show this comparison in Fig 15. Our results (whichgenerally have velocity shifts, |∆3| < 1500 km s−1 for all ab-sorbers) are in better agreement with absorption by associatedgas rather than intervening. This implies that the absorbers inYggdrasil are more likely to be associated with the galaxy i.e.the absorbers are bound to the ISM and/or CGM, if they are sim-ilar or from the same parent distribution.
We have an additional set of quasar absorbers with which tocompare the C iv and Si iv column densities measured. Quasarabsorption for the ionised gas, in particular, have been mea-sured by Songaila (1998) and D’Odorico et al. (2013). In theformer, absorption is from the IGM while the latter results showquasar associated absorption at much higher redshifts i.e. z >6. This comparison is shown for Fig. 16. As seen from Fig. 16,Yggdrasil absorbers are in better agreement with associated ab-sorbers of D’Odorico et al. (2013) than the intervening absorbersof Songaila (1998). These order of magnitude comparisons showthat the absorbers in the Yggdrasil spectrum are much morelikely to be associated with the galaxy halo.
8. Photoionisation Modelling
Using photoionisation modelling code to determine the mainionising mechanisms producing the observed ionised gas and itscolumn densities in the absorbing gas shells surrounding Yg-gdrasil. A very detailed study of this has been carried out inBinette et al. (2000) who obtain a metallicity of Z/Z ' 0.02(Z being the Solar metallicity) for the strongest of the Lyα ab-sorbers. Their findings also indicated that emitting and absorbinggas are not co-spatial and that the gas is best described by an H ivolume density of nH i = 100 cm−3. In addition to this, Binetteet al. (2006) sought to determine the ionising mechanism behindthe absorbers in this source, and thus showed that stellar pho-toionisation results in the H i and C iv absorber column densities
It is worth noting that their conclusions were obtained usingonly column densities for H i and C iv. With our recent detection
Article number, page 13 of 21

A&A proofs: manuscript no. 0943_absorption
Fig. 13. A broad-band image of the rest-frame UV continuum of MRC 0942-242 from the HST WFPC2 702W (5800 − 8600 Å) filter is shown.MUSE contours (blue) are overlaid and represent narrow-band emission summed over 6400 − 6425 Å. The contours are shown at the surfacebrightness (SB) levels: (1.0, 1.6, 2.2, 2.8, 3.4, 4.0) ×10−17 erg s−1 cm−2 arcsec−2. VLA 4.7 GHz radio surface brightness is shown by the redcontour levels. The inset 1D spectrums show the high surface brightness region (HSBR) (le f t) and offset (right) He ii emission. The line profilesare extracted from apertures of radius, R = 0.6′′, shown in green for the HSBR and cyan for the offset region with the aperture centroids for eachshown in the matching colours. The blueshifted and systemic He ii emission are shown in blue and orange, respectively, with the sum of bothcomponents shown in red.
Table 7. Best fit results to He ii high surface brightness region (HSBR) and offset lines in Fig. 13. The emission is also classified as blueshiftedrelative to the systemic or emitted from the systemic velocity.
MUSEHe ii line region Component Line centre (rest) Line centre (obs.) Line flux Line width Velocity
λ0 (Å) λ (Å) F (10−17 erg s−1 cm−2) FWHM (km s−1) ∆3
HSBR blueshifted 1640.40 6413.49 ± 3.04 1.43 ± 0.47 970 ± 225 −1053 ± 3206systemic ” 6436.09 ± 0.30 16.42 ± 4.86 978 ± 24 0.02 ± 0.01
Offset blueshifted ” 6414.18 ± 3.21 2.69 ± 0.81 1134 ± 195 −1025 ± 3251systemic ” 6434.76 ± 0.83 7.64 ± 0.80 993 ± 48 −46 ± 27
of N v absorption at the same velocity as the the strong Lyα ab-sorber, we can provide more insight to these findings. Given thedetection of N v, flux from the metagalactic background may betoo weak to ionise the absorbers. At z ≥ 2.7, He ii reionisationwas more active than it is at lower redshifts meaning that ionis-ing photons with energies of Eγ > 54.4 eV had Mpc-scale meanfree paths (Shull et al. 2010; McQuinn 2016). The metagalacticbackground is therefore less likely to be a major ionising mech-anism powering the absorbers in the halo of Yggdrasil.
We also consider the possibility that shocks by the power-ful radio jets may ionise the gas. This was proposed by Dopita& Sutherland (1995), and observational evidence for shock ion-isation in HzRGs has been shown by several authors, particu-larly in sources with relatively small radio sources still containedwithin the host galaxy (e.g. Allen et al. 1998; Best et al. 2000;De Breuck et al. 2000). A powerful diagnostic of shock ionisedemission are the line ratios of carbon: in shock ionised regions,we expect the C ii] λ2326 line to be as strong as its higher ioni-
sation counterparts. Our MUSE spectrum (Fig. 2) contains threecarbon lines, and allows us to make this test. Interestingly, theC ii] λ1906, 1908 line contains a much stronger blueshifted com-ponent than the C iii] and C iv λλ1548, 1550 lines. This highC ii]/C iii] and C ii]/C iv ratios are consistent with shock ionisa-tion (see e.g. Fig. 1 of Best et al. 2000). This lends evidence toour claim that this blueshifted gas near the western radio lobe isan outflow driven by the radio jet. On the other hand, the radio ofthe main component near the AGN has a C iii]/C ii] ratio of ∼2.4,which places it squarely in the AGN photo-ionisation region. Asthis main velocity component dominates the flux of all the otheremission lines, we therefore do not consider shock ionisation asa relevant contributor in those lines.
Stellar photoionisation is a possibility as well. The star-formation rate (SFR) in Yggdrasil, however, is SFR=41 M yr−1
(Falkendal et al. 2019) and may be insufficient in producing thestar-burst activity that would ionise the absorbers. Another pos-
Article number, page 14 of 21
S. Kolwa et al.: MUSE unravels the ionisation and origin of metal enriched absorbers in the gas halo of a z = 2.92 radio galaxy
-4 -2 0 2 4 6RA (arcsec)
-6
-4
-2
0
2
DEC
(arcsec)
N
E −0.10
−0.05
0.00
0.05
0.10
0.15
SB
(10−
17erg
s−
1cm−
2arcsec−
2 )
(a) He ii blueshifted: 6400 − 6412 Å; blue interval in Fig. 14(d)
-4 -2 0 2 4 6RA (arcsec)
-6
-4
-2
0
2
DEC
(arcsec)
N
E −0.2
−0.1
0.0
0.1
0.2
SB
(10−
17erg
s−
1cm−
2arcsec−
2 )
(b) He ii diffuse: 6425 − 6430 Å; green interval in Fig. 14(d)
-4 -2 0 2 4 6RA (arcsec)
-6
-4
-2
0
2
DEC
(arcsec)
N
E
−0.10
−0.05
0.00
0.05
0.10
0.15
SB
(10−
17erg
s−
1cm−
2arcsec−
2 )
(c) He ii redshifted: 6445 − 6450 Å; red interval in Fig. 14(d)
−2000 −1000 0 1000 2000∆v (km s−1)
0.0
0.2
0.4
0.6
0.8Fλ(10−
17erg
s−
1cm−
2A−
1)
6400 6420 6440 6460 6480λobs (A)
(d) He ii line emission
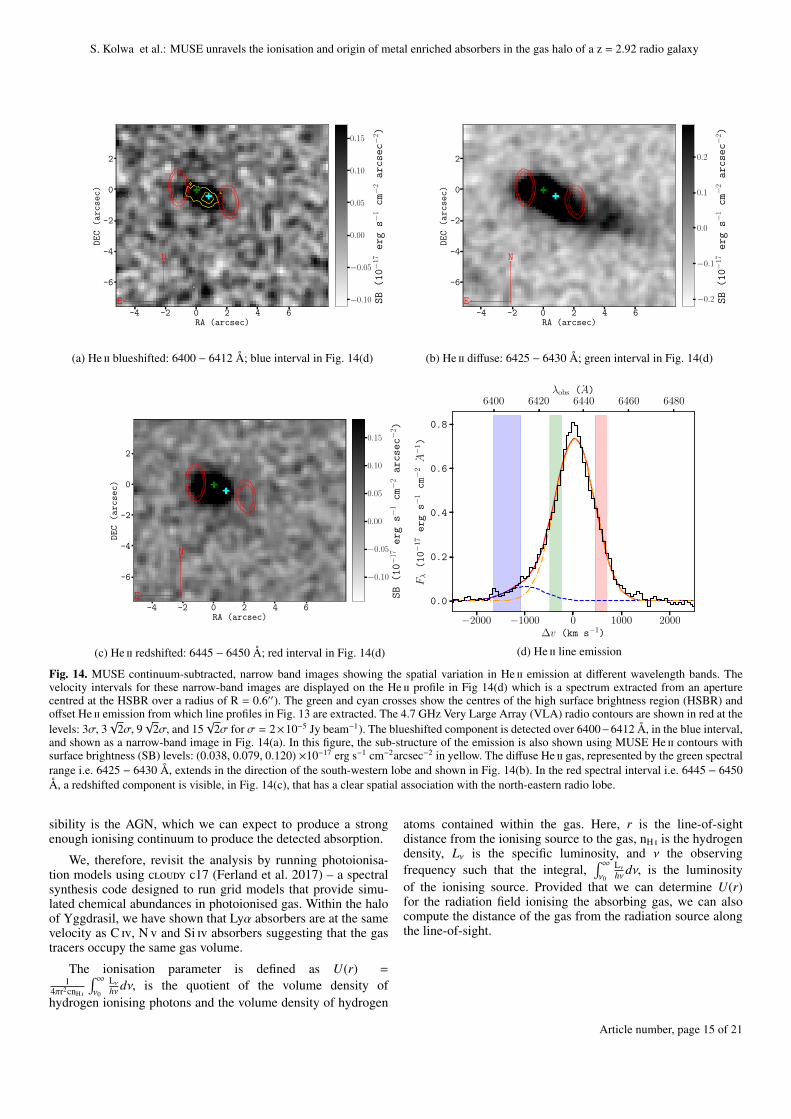
Fig. 14. MUSE continuum-subtracted, narrow band images showing the spatial variation in He ii emission at different wavelength bands. Thevelocity intervals for these narrow-band images are displayed on the He ii profile in Fig 14(d) which is a spectrum extracted from an aperturecentred at the HSBR over a radius of R = 0.6′′). The green and cyan crosses show the centres of the high surface brightness region (HSBR) andoffset He ii emission from which line profiles in Fig. 13 are extracted. The 4.7 GHz Very Large Array (VLA) radio contours are shown in red at thelevels: 3σ, 3
√2σ, 9
√2σ, and 15
√2σ for σ = 2×10⁻⁵ Jy beam−1). The blueshifted component is detected over 6400−6412 Å, in the blue interval,
and shown as a narrow-band image in Fig. 14(a). In this figure, the sub-structure of the emission is also shown using MUSE He ii contours withsurface brightness (SB) levels: (0.038, 0.079, 0.120) ×10−17 erg s−1 cm−2arcsec−2 in yellow. The diffuse He ii gas, represented by the green spectralrange i.e. 6425 − 6430 Å, extends in the direction of the south-western lobe and shown in Fig. 14(b). In the red spectral interval i.e. 6445 − 6450Å, a redshifted component is visible, in Fig. 14(c), that has a clear spatial association with the north-eastern radio lobe.
sibility is the AGN, which we can expect to produce a strongenough ionising continuum to produce the detected absorption.
We, therefore, revisit the analysis by running photoionisa-tion models using cloudy c17 (Ferland et al. 2017) – a spectralsynthesis code designed to run grid models that provide simu-lated chemical abundances in photoionised gas. Within the haloof Yggdrasil, we have shown that Lyα absorbers are at the samevelocity as C iv, N v and Si iv absorbers suggesting that the gastracers occupy the same gas volume.
The ionisation parameter is defined as U(r) =1
4πr2cnH i
∫ ∞ν0
Lνhνdν, is the quotient of the volume density of
hydrogen ionising photons and the volume density of hydrogen
atoms contained within the gas. Here, r is the line-of-sightdistance from the ionising source to the gas, nH i is the hydrogendensity, Lν is the specific luminosity, and ν the observingfrequency such that the integral,
∫ ∞ν0
Lνhνdν, is the luminosity
of the ionising source. Provided that we can determine U(r)for the radiation field ionising the absorbing gas, we can alsocompute the distance of the gas from the radiation source alongthe line-of-sight.
Article number, page 15 of 21

A&A proofs: manuscript no. 0943_absorption
12 13 14 15log NCIV
11
12
13
14
15
log
NN
V
1
2
3
(a) Associated absorbers
MRC 0943-242
Fechner et al (2009)
12 13 14 15log NCIV
11
12
13
14
15
log
NN
V
1
2
3
(b) Intervening absorbers
MRC 0943-242
Fechner et al (2009)
Fig. 15. N v and C iv column densities of associated (le f t) and intervening (right) absorbers from Fechner & Richter (2009) (in grey and blue:secondary detections for the quasar) and Yggdrasil detections (red).
10 11 12 13 14 15log NSiIV
13.0
13.5
14.0
14.5
15.0
log
NC
IV
2
MRC 0943-242
Songaila et al (1998)
D′Odorico et al (2013)
Fig. 16. NC iv relative to NSi iv for absorbers in the IGM in Songaila(1998) and quasar associated absorbers in D’Odorico et al. (2013).
8.1. AGN Photoionisation of the Absorbers
We have shown, using a comparison to quasar absorbers in Fech-ner & Richter (2009), that those in Yggdrasil are located withinthe CGM rather than IGM. In the cloudymodel, we use a power-law (PL) spectral-energy distribution SED (where the ionisingflux is given by Sν ∝ να) to simulate the incident radiationproduced by the AGN. In this, we tested both α = −1.5 andα = −1.0 to model photoionisation of the gas by an AGN (e.g.,Villar-Martin et al. 1997; Feltre et al. 2016; Humphrey et al.2018).
The model grid consists of a set of input parameters. The hy-drogen density is fixed to nH i = 100cm−3 which is commonlyadopted to describe low density, diffuse gas which we expect inthe extended absorbers (e.g., Binette et al. 2000; Humphrey et al.2008b). The metallicity (Z) is varied over a range of values be-
tween Z/Z = 0.01 and 10. The H i column density NH i, is takenfrom the line-fitting results (shown in Table 5). The ionisationparameter varies over the range, 10−2.5 < U < 10−1 in 0.5 dexincrements.
We do not include the effects of dust extinction because thesurface brightness of emission re-radiated by dust, detected byALMA (the Atacama Large Millimetre/sub-mm Array) at an ob-serving frequency of νobs = 235 GHz, is comparatively low inYggdrasil compared to the offset region at projected distancesof r = 65 to 80 kpc from the host galaxy where three resolveddusty companions are observed (G16). This observation impliesthat dust has a negligible contribution to the SED at the hostgalaxy. Moreover, Falkendal et al. (2019) have shown that thestar-formation rate (SFR) in Yggdrasil, is low in comparison tothat which is detected in the companion sources, collectively.
In the cloudy models, we have assumed an open or plane-parallel geometry for the absorbing gas medium which impliesthat the cloud depth is significantly smaller than its inner radiusor, more simply, the distance between the ionising continuumsource and the illuminated gas surface. Following the findingsfrom Binette et al. (2000), we assume that the absorbers are notco-spatial with the emitting gas.
The column density measures we obtain are shown againstthe simulated column densities in Figs 17 and 18 and the resultsindicate that absorbers 1 and 3 may have supersolar metallicitiesof Z/Z ' 10 and 5, respectively. However, due to uncertain-ties in line-fitting, the column densities obtained are upper limitsand no proper conclusion can be drawn about the metallicitiesof the absorbers. If these models do suggest super-solar metal-licity in absorbers. this would not be a unusual given that super-solar metallicites in HzRG absorption line gas have been mea-sured before Jarvis et al. (2003); Binette et al. (2006). In Jarviset al. (2003), absorbers in the halo of the z=2.23 radio galaxy,0200+015, are shown to have Z/Z ∼ 10 as well as covering fac-tors of C < 1.0. This implied that the absorbers are likely to beco-spatial with the extended emission line region. Based on Fig.19, the measured column densities of absorber 2 prove that itsmetallicity is closer to a value of Z/Z = 0.01. The results also
Article number, page 16 of 21

S. Kolwa et al.: MUSE unravels the ionisation and origin of metal enriched absorbers in the gas halo of a z = 2.92 radio galaxy
10−3 10−2 10−1 100
NNV/NHI
10−2
10−1
100
NC
IV/N
HI
Absorber 1
10 Z0.1 Z0.5 Z1 Z5 Z
U=10−2.5
U=10−1
MRC 0943-242
Fig. 17. N v and C iv column densities obtained from cloudy photoioni-sation models. The predicted column densities are for absorber 1 whichhas an H i column density of NH i = 1014.2 cm−2 that is kept constant asU(r) increases from U = 10−2.5 to U = 10−1. in increments of 0.5 dex.The metallicities, Z/Z = 0.1, 0.5, 1 and 5 are tested for spectral indicesα = −1.0 (solid lines) and α = −1.5 (dashed lines).
10−3 10−2 10−1 100 101
NNV/NHI
10−2
10−1
100
NC
IV/N
HI
Absorber 3
0.1 Z0.5 Z1 Z5 Z
U=10−2.5
U=10−1
MRC 0943-242
Fig. 18. N v and C iv column densities obtained from cloudy photoioni-sation models similar to those in Fig 17. The models shown here are forabsorber 3 since the H i column density is kept constant at NH i = 1013.3
cm−2. The metallicities tested are Z/Z = 0.1, 0.5, 1 and 5.
suggest that either the N v column density is under-predicted bythe Z/Z = 0.01 model. We explore the possible reasons for thisin the following section.
8.2. Nitrogen abundances under-predicted by AGNphotoionisation
The assumed power laws for the ionising continuum do not re-produce the metal ion column densities observed in the strongabsorber (absorber 2). We are certain that the C iv column den-sity is well measured given its agreement to literature values(Jarvis et al. 2003; G16). The N v cannot be compared to anyprevious results other than the quasar absorbers shown in Fig.15 but has been fit with a similar level of uncertainty as C iv.
10−6 10−5 10−4 10−3
NNV/NHI
10−5
10−4
10−3
10−2
NC
IV/N
HI
Absorber 2
0.01 Z (N/H = 10)
0.01 Z0.05 Z0.5 Z
U=10−2.5
U=10−1
MRC 0943-242
Fig. 19. N v and C iv column densities obtained from photoionisationcloudy models similar to those in Fig. 17. The models shown here arefor absorber 2, the strong absorber, since the H i column density is keptconstant at NH i = 1019.2 cm−2. The nitrogen abundance at Z/Z = 0.01has also been enhanced by a factor of 10 (orange curve) i.e. N/H = 10.
The results shown in Fig. 19 indicate that AGN photoionisationalone cannot produce the N v column densities measured. At thesame time, a softer ionising continuum is also insufficient in pro-ducing a high ionisation tracer such as N v. In other words, apower law under-predicts the measured N v column density forthe strong Lyα absorber. We, therefore, explore secondary ni-trogen production, enhanced nitrogen abundances and lower H icolumn density as possible reasons for under-predicted nitrogenabundances.
8.2.1. Secondary nitrogen production
The under-predicted nitrogen abundance may result from scal-ing the nitrogen abundance (relative to hydrogen) according tothe solar value i.e. N/H ∝ (N/H). We propose that secondarynitrogen production by intermediate mass stars with M/M = 1- 8 (e.g., Henry et al. 2000). In this process, abundances scale asN/O ∝O/H ∝ Z (with N, O and H being the nitrogen, oxygen andhydrogen abundances and Z, the metallicity of the gas). This im-plies that N/H ∝ (O/H)2 ∝ Z2. However, secondary nitrogen pro-duction is known to occur in in gas with super-solar metallicities(i.e., Z/Z ≥ 1.0) while primary nitrogen production dominatesat sub-solar metallicities (e.g., Hamann & Ferland 1993). We canconsider secondary nitrogen the cause of nitrogen enhancementin absorber 2. Fig. 15(a) shows that the absorbers in Yggdrasilhave similar column densities as associated quasar absorbers inthe Fechner & Richter (2009) sample. In this study, secondarynitrogen production is posited as a reason for the nitrogen en-richment of the quasar absorbers.
If secondary nitrogen production from carbon and oxygenin the CNO cycle causes the enhanced nitrogen abundance inthe strong absorber, the absorber would have a higher metal-licity than originally determined (Z/Z ' 0.02; Binette et al.2000, 2006). As is the case for the extended emission line region(EELR) in S18 where is said to occur secondary nitrogen pro-duction occurs for a gas metallicity of Z/Z ' 2.0. The cloudymodel grid indicates that in order for gas to be enriched by sec-ondary nitrogen, it would also have a metallicity of Z/Z ≥ 1.0.This is improbable given that an increase in the cloud metallic-
Article number, page 17 of 21

A&A proofs: manuscript no. 0943_absorption
ity results in an increase in both C iv and N v column densities.Hence, we exclude secondary nitrogen production as a mecha-nism for the enhancement of nitrogen abundances.
8.2.2. Degeneracy of b and NH i for the strong absorber
The degeneracy between the H i column density NH i and theDoppler parameter have been described in S18 who found twoprobable best fit solutions for the b parameter and NH i in ab-sorber 2. These are NH i/cm−2 = 1019.63 with b = 52 km s−1
and NH i/cm−2 = 1015.20 with b = 153 km s−1. Taking the lowerH i column density solution as well as the NC iv and NN v mea-surements from our results, we ran the CLOUDY model grid us-ing the same AGN photoionisation scheme (described in section8.1).
This time, applying the low H i column density solution (i.e.,NH i/cm−2 = 1015.20) to the grid resulted in the observed col-umn density ratios (i.e., NC iv/NH i and NN v/NH i) suggesting thatabsorber 2 has a supersolar metallicity, Z/Z ' 5. This resultveers greatly from the expected abundances from Binette et al.(2000) i.e. Z/Z ' 0.02 which was obtained through photoioni-sation modelling in MAPPINGS IC (Binette et al. 1985; Ferruitet al. 1997). What this result may imply is that if the cloud hada lower H i column, its metallicity would need to be higher thanZ/Z ' 0.01.
8.2.3. Nitrogen abundance enhancement
For the cloudy models to reproduce the observed column den-sities, we require a nitrogen abundance that is greater than thesolar abundance by a factor of 10 as Fig. 19 suggests. We canlook at occurrences of enhanced nitrogen abundances in similarsources to attempt to find an answer for this.
The photoionisation models for shown in Fig. 10 of Binetteet al. (2006) seem to suggest that the N v column density of ab-sorber 2 suggests that it may be ionised by the same mechanismionising the Lynx arc nebulae which is a metal-poor H ii galaxyat z ' 3.32 that has undergone a recent star-burst (Villar-Martínet al. 2004). However, this scenario would require stellar pho-toionisation rather than AGN. The presence of N v in the ab-sorber presents a strong case for AGN rather than stellar pho-toionisation since it has such a high ionisation energy.
To determine whether the current episode of AGN activityhas ionised the absorber, we determine its life-span. The radiosize of Yggdrasil is r ' 29 kpc (Pentericci et al. 1999) and itsapproximate expansion speed, varv ' 0.05c. Hence, the age ofthe radio source is approximately, τjet ' 2 Myr. The strong ab-sorber, on the other hand, is roughly, r ' 60 kpc, and has anoutflow rate of 400 km s−1 relative to the galactic nucleus. Thistranslates to an approximate outflow time-scale of τabs. ' 200Myr. The radio source being a factor of 100 younger than theabsorber implies that the current radio jet duty cycle can be re-sponsible for the ionisation of the absorber however it did noteject the gas that formed absorber 2.
To explain the chemical abundances, we propose that the ab-sorber has been enriched by an early episode of star-formation.Metal-rich gas from the ISM is driven by star-bursts and throughpowerful winds, dilutes the low metallicity gas in absorber 2.Evidence of this is seen in local massive ellipticals, consideredthe progeny of HzRGs, where nitrogen abundances are enhancedwell above that of carbon i.e. [N/Fe] ∼ 0.8 − 1 and [C/Fe] ∼ 0.3(for nitrogen, N, carbon, C and iron, Fe abundances) as a resultof star-burst driven superwinds (Greene et al. 2013, 2015).
8.3. Distances of absorbers from the ionising source
The distance between the AGN and the absorbing gas can beestimated but is dependent on nH i. Given that we cannot con-strain the hydrogen density, we have only the ratio of ionisa-tion parameters to infer the distance ratios of two absorbers e.g.r2/r1 =
√U1/U2.Assuming that our measure of nH i = 100 cm−3
is correct, we can approximate the distance of absorber 2 fromthe AGN using the integrated infrared luminosity, LAGN
IR , of thehost galaxy computed by Falkendal et al. (2019). From Fig. 19,the ionisation parameter for absorber 2 is approximately U '
10−2.25. Expressing the ionisation parameter as U(r) = L/nH ir2,(e.g., Rózanska et al. 2014), we obtain a distance of d ' 68+17
−14kpc between absorber 2 and the AGN.
9. Discussion
9.1. Blueshifted emission: companion galaxy or outflow?
There is sufficient evidence to suggest that the preferred envi-ronments of radio galaxies are rich clusters and groups. Thisis at low redshifts (z . 1) where the most radio-loud sourceshave a higher likelihood of residing in kpc-scale overdense struc-tures (e.g., Best et al. 2007; Karouzos et al. 2014; Magliocchettiet al. 2018; Kolwa et al. 2019). Radio-loud sources are alsoprevalent in over-dense environments consisting of dusty star-burst galaxies and/or Lyα emitters at z > 1.2 (e.g., Hatch et al.2011; Wylezalek et al. 2013; Dannerbauer et al. 2014; Saito et al.2015). Given these findings, blueshifted emission in this sourcesystemic redshift may be from a proto-galaxy or dwarf satellite.
A well-studied example is a Minkowski’s object, associatedwith the radio galaxy PKS 0123-016, which has undergone an in-crease star-formation rate due to the passage of the radio source’sjets (van Breugel et al. 1985). The high velocity dispersionsof the blueshifted emission in Yggdrasil imply a different ori-gin of the gas. Only an AGN would produce the turbulent gasmotions that can broaden lines such as He ii to line widths ofFWHM=1500 km s−1. Furthermore, dwarf galaxies tend to haveoutflow velocities of ionised gas of 3out . 100 km s−1 (Martin2005). Such velocities are well below the outflow rates we ob-serve in the blueshifted, ionised gas which are 3out & 400 kms−1.
The gas turbulence being driven by the jets is more likelyand is a known occurrence within the gas haloes of powerfulradio galaxies (e.g., Humphrey et al. 2006; Morais et al. 2017;Nesvadba et al. 2017a). The jet-driven outflow scenario is wellsupported 4.7 GHz radio observations that indicate, from rota-tion measures, that radio emission from the western radio lobein this source propagates over a shorter path length than radioemission from the eastern lobe (e.g., Carilli et al. 1997).
This configuration implies that the radio axis is also titled anon-zero inclination angle with respect to the projected plane asshown Fig. 20. If the jets were parallel to the plane of the sky,we should observe similar rotation measures at both the east andwest radio lobes the rotation measure at the eastern lobe is higherthan the one at the west. This jet-inclination can also explain theblueshifted emission being an outflow.
The kinematics surrounding the jet-gas interactions in thegas halo of Yggdrasil have been measured in previous studies.In Villar-Martín et al. (2003), the narrow components of He iiemission are seen to be blueshifted from the systemic at velocityshifts of ∆3 ∼ 100 km s−1. This kinematically quiet componentidentified with a FWHM ∼ 500 km s−1 is shown to extend acrossthe entire halo, well beyond the radio hotspot, suggesting jet-gas
Article number, page 18 of 21

S. Kolwa et al.: MUSE unravels the ionisation and origin of metal enriched absorbers in the gas halo of a z = 2.92 radio galaxy
Fig. 20. A cross-section schematic of the circumgalactic medium of Yggdrasil based on evidence from the MUSE data and previous measuresis shown. The gas has no defined spatial boundaries since its estimates size of d & 60 kpc is merely a minimum. The strong absorber screensemission originating from the T ' 104−106 K extended emission line region (EELR) gas (in yellow) comprising an extended region of ionised gasas well as gas directly ionised by the AGN ionisation cone (in red). The absorbing gas (shown as dotted, curved lines) is also metal enriched dueto detections of C iv, N v and Si iv at the same velocities as Lyα absorption. The blueshifted component detected in Lyα and He ii is a jet inducedoutflow (blue arrows). This outflowing, ionised and turbulent gas is spatially offset from the HSBR of the halo which implies that the radio jet istilted relative to the projected plane. Note that the locations of absorber 2 is a line-of-sight projected distance which is dependent on the ionisationparameter, U(r).
interactions. In addition to this, Humphrey et al. (2006) find thatthe He ii gas that has a perturbed component with FWHM = 1760km s−1 and the quiescent component with FWHM = 750 km s−1,respectively, at a velocity shift of ∆3 ∼ -250 km s−1 is low ioni-sation gas. In this work, we find that the blueshifted emission hasFWHM = 970 km s−1 at ∆3 ∼ -1000 km s−1. Although our mea-sured velocity shifts differ slightly from those of previous works,the common thread is that the He ii emission is blueshifted rela-tive to systemic and aligned with the radio axis indicating jet-gasinteractions.
This view is in good agreement with observations from G16who see direct evidence of the ionisation cone projected alongthe radio jet axis in the form of extended He ii, C iv and C iii]emission to the south-west of the source. An in-depth discussionof the ionised gas kinematics is presented in S18. Their inter-pretation differs from ours only slightly in that our radio axis istilted relative to the projected plane.
In addition to He ii enhancement, a dust continuum and en-hanced star-formation rates have been observed to the south-west of the inferred centre of the galaxy halo. In G16, the strongdust continuum may be a result of star-bursts. This is supportedby measured star-formation rates SFR = 41 M yr−1 in Yggdrasilcompared to SFR = 747 M yr−1 in the dusty regions at thesouth-west or companion sources (Falkendal et al. 2019). Anti-correlations between radio size and 1.1-mm luminosities (thattrace SF) measured from a sample of 16 HzRGs in Humphreyet al. (2011) have explained why more evolved sources, such asYggdrasil, have experienced a decline in their star-formation.
Furthermore, at z > 3.0, metal enrichment and disturbedkinematics of extended gas haloes have been linked to jet-induced star-formation in HzRGs (e.g., Reuland et al. 2007). Onecannot say that there is jet-induced star-formation in this galaxy,
however, because the projected radio size of r ' 29 kpc showsthat the radio emission has not propagated far enough to inducestar-formation at r = 65 and 80 kpc from the host galaxy wherethe companion sources are located (G16).
9.2. Possible origins and the nature of the absorbing gas
We have shown that resonance line scattering or absorption ofC iv, N v and Si iv photons occurs at the same velocities as thatof the strong Lyα absorber (absorber 2). Due to the uncertaintiesin measuring Si iv absorption, we will frame our discussion ofthe main absorber around Lyα, N v and C iv detections only. Weobtain redshifts, column densities and Doppler parameters forabsorbers in the Lyα profile and find that the H i column densitiesmeasured are consistent with previous results (van Ojik et al.1997; Jarvis et al. 2003; Wilman et al. 2004; G16; S18).
The formation of absorber 2 is well supported by simulationsin which the neutral gas column is formed at the bow shock ofradio jets and cools to T ' 104−106 K before fragmenting due toRayleigh-Taylor (RT) instabilities brought about by the radio co-coon (Krause 2002, 2005). S18 also showed that absorber 2 maybe outflowing which is in agreement with this framework. In ad-dition to the high column density absorber, we also observe threeH i absorbers with column densities of NH i/cm−2 = 1013 − 1014.The weak absorbers (absorbers 1, 3 and 4) could be fragmentedshells of gas that have been disrupted by RT instabilities, hencetheir low column densities. In this scenario, the absorbers areformed through the ageing of the radio source (Wilman et al.2004; Binette et al. 2006).
Absorber 2 has a much higher H i column density ofNH i/cm−2 = 1019.2. It may be a metal-poor gas shell that was ex-pelled from the galaxy by an early AGN-related feedback event
Article number, page 19 of 21

A&A proofs: manuscript no. 0943_absorption
(Jarvis et al. 2003; Binette et al. 2006). We agree with this inter-pretation given both the strength of the absorber and the sum ofits ionised and neutral mass, MT/M ≥ 5.7 × 10⁹, which is anorder of magnitude lower than the galaxy’s stellar mass compo-nent of M∗/M = 1.2×10¹¹ implying that a very energetic eventwould have to be responsible for expelling such a vast amountof gas.
Absorber 2, if photoionised primarily by the AGN has anexcess nitrogen abundance a factor of 10 greater than its Solarabundance. Since absorber 2 has a low metallicity overall, it maybe nitrogen enhanced as a result of stellar winds. Chemicallyenriched gas from the ISM may have been swept up by stellarwinds and progressively diluted the outflowing gas shell.
This scenario is similar to that of the z = 3.09 star-forminggalaxy of Wilman et al. (2005) which also contains an emissionline region covered by a neutral gas shell of H i column den-sity, NH i/cm2 ' 1019. The main distinction between this sourceand ours is the SFR which are much higher in the star-forminggalaxy. If the mechanism by which the strong absorber in Yg-gdrasil has been enriched is a star-burst driven super-wind, itcould mean that this process occurred at earlier epoch and weare now observing the galaxy after a major star-burst period hasceased.
10. Summary
We have examined the absorbing gas surrounding the hostgalaxy of MRC 0943-242, Yggdrasil, using MUSE data. Ourresults prove that the H i absorbers measured from the Lyα lineare at the same velocities as C iv and N v absorbers. The newintegral field unit (IFU) dataset shows that the high H i columndensity absorbing gas (Lyα absorber 2) with NH i/cm−2 = 1019.2
is a non-isotropic gas medium extending outwards from r & 60kpc. It hydrogen fraction of XH i & 0.8 which makes it a predom-inantly ionised cloud with a total estimated mass of the neutraland ionised gas being, M/M ≥ 5.7 × 10⁹. Detections of Si iiabsorption at the same velocity of this absorber suggest that it isionisation bounded.
Similar to previous studies, we observe a diffuse extensionof He ii gas which in alignment with the VLA detected radioaxis and the HST detected optical/UV broad-band emission. Theionised gas is interpreted as a jet-induced outflow. The combi-nation of radio axis and the observed He ii emission in this IFUdata indicates that radio jet is tilted at an non-zero inclinationangle. This finding is well supported by rotation measures in theeast and west radio lobes of the galaxy which indicate that theemission from the eastern radio lobe has travelled further alongthe line-of-sight than that emitted from the western lobe.
We also estimate approximately the locations of the ab-sorbers within the halo, assuming that they are outflowing. Itis likely that absorber 2 is located at a greater distance from theAGN than absorber 1. Furthermore, the measured absorber col-umn densities in Yggdrasil are similar in magnitude to those ofabsorbers at velocity shifts of |∆3| < 5000 km s−1 from quasars.
Photoionisation models of the absorbing gas in cloudy hasshown that ionising radiation from the AGN (for which we as-sume a spectral energy distribution with a power-law shape ofα = −1) is capable of producing the C iv and N v column den-sities observed in absorber 2 when the gas has a metallicity ofZ/Z = 0.01 with nitrogen abundance enhanced by a factor of 10relative to the Solar abundance (i.e., N/H = 10). This high col-umn density absorber is interpreted as primordial gas that waspropelled outward by an earlier feedback event (possibly AGN).
The gas has subsequently been ionised by the AGN and chemi-cally enriched by star-burst activity.
In conclusion, this work shows the potential use of wide fieldintegral field unit instruments in understanding the configurationof complex systems such as the haloes of HzRGs. Similar fu-ture analysis will be fundamental in unveiling the different gasstructures surrounding HzRGs, ultimately adding important con-straints on the physics of these objects.
Acknowledgements
SK acknowledges the International Max Planck ResearchSchools (IMPRS) and the European Southern Observatory(ESO). All authors acknowledge the ESO Paranal Observatoryas the source for VLT/MUSE data that formed the basis of thiswork. SK, CDB and JV thank Richard Wilman and Matt J. Jarvisfor the ancillary UVES spectrum. Many thanks to Paola Caselliand Ian Smail for providing helpful guidance and suggestions.
This study has made use of data from the European SpaceAgency (ESA) mission Gaia (https://www.cosmos.esa.int/gaia), processed by the Gaia Data Processing and Anal-ysis Consortium (DPAC, https://www.cosmos.esa.int/web/gaia/dpac/consortium). Funding for the DPAC hasbeen provided by national institutions, in particular the institu-tions participating in the Gaia Multilateral Agreement.
This work is on observations collected at the EuropeanSouthern Observatory under ESO programmes 096.B-0752(A)and 068.B-0086(A). It is also based on observations made withthe NASA/ESA Hubble Space Telescope, and obtained fromthe Hubble Legacy Archive, which is a collaboration betweenthe Space Telescope Science Institute (STScI/NASA), the SpaceTelescope European Coordinating Facility (ST-ECF/ESA) andthe Canadian Astronomy Data Centre (CADC/NRC/CSA).
MVM acknowledges support from the Spanish Min-isterio de Ciencia, Innovación y Universidades (formerMinisterio de Economía y Competitividad) through the grantAYA2015-64346-C2-2-P. AH acknowledges FCT FellowshipSFRH/BPD/107919/2015; Support from European Commu-nity Programme (FP7/2007-2013) under grant agreementNo. PIRSES-GA-2013-612701 (SELGIFS); Support fromFCT through national funds (PTDC/FIS-AST/3214/2012 andUID/FIS/04434/2013), and by FEDER through COMPETE(FCOMP-01-0124-FEDER-029170) and COMPETE2020(POCI-01-0145-FEDER-007672).
AH acknowledges support from the FCT-CAPES Transna-tional Cooperation Project "Parceria Estratégica em AstrofÍsicaPortugal-Brasil".
ReferencesAllen, M. G., Dopita, M. A., & Tsvetanov, Z. I. 1998, ApJ, 493, 571Arrigoni Battaia, F., Prochaska, J. X., Hennawi, J. F., et al. 2018, MNRAS, 473,
3907Bacon, R., Vernet, J., Borisova, E., et al. 2014, The Messenger, 157, 13Barkana, R. & Loeb, A. 2003, Nature, 421, 341Barnes, L. A., Garel, T., & Kacprzak, G. G. 2014, Publications of the Astronom-
ical Society of the Pacific, 126, 969Baum, S. A., Heckman, T. M., Bridle, A., van Breugel, W. J. M., & Miley, G. K.
1988, The Astrophysical Journal Supplement Series, 68, 643Bechtold, J. 2001, ArXiv e-prints, astroBest, P. N., Röttgering, H. J. A., & Longair, M. S. 2000, MNRAS, 311, 23Best, P. N., von der Linden, A., Kauffmann, G., Heckman, T. M., & Kaiser, C. R.
2007, MNRAS, 379, 894Binette, L., Dopita, M. A., & Tuohy, I. R. 1985, ApJ, 297, 476Binette, L., Groves, B., Villar-Martín, M., Fosbury, R. A. E., & Axon, D. J. 2003,
A&A, 405, 975
Article number, page 20 of 21

S. Kolwa et al.: MUSE unravels the ionisation and origin of metal enriched absorbers in the gas halo of a z = 2.92 radio galaxy
Binette, L., Kurk, J. D., Villar-Martín, M., & Röttgering, H. J. A. 2000, A&A,356, 23
Binette, L., Wilman, R. J., Villar-Martín, M., et al. 2006, A&A, 459, 31Binette, L., Wilson, A. S., & Storchi-Bergmann, T. 1996, A&A, 312, 365Bischetti, M., Piconcelli, E., Vietri, G., et al. 2017, A&A, 598, A122Carilli, C. L., Röttgering, H. J. A., van Ojik, R., Miley, G. K., & van Breugel,
W. J. M. 1997, ApJS, 109, 1Cashman, F. H., Kulkarni, V. P., Kisielius, R., Ferland, G. J., & Bogdanovich, P.
2017, ApJS, 230, 8Churchill, C. 1995, Introduction to Echelle Data Reduction using IRAF, Lick
Observatory Technical Report No. 74. (Astrophysics and Space Science Li-brary)
Cicone, C., Maiolino, R., Sturm, E., et al. 2014, A&A, 562, A21Dannerbauer, H., Kurk, J. D., De Breuck, C., et al. 2014, A&A, 570, A55De Breuck, C., Neri, R., Morganti, R., et al. 2003, A&A, 401, 911De Breuck, C., Röttgering, H., Miley, G., van Breugel, W., & Best, P. 2000,
A&A, 362, 519De Breuck, C., van Breugel, W., Minniti, D., et al. 1999, A&A, 352, L51De Breuck, C., van Breugel, W., Stanford, S. A., et al. 2002, AJ, 123, 637Dekker, H., D’Odorico, S., Kaufer, A., Delabre, B., & Kotzlowski, H. 2000, in
Society of Photo-Optical Instrumentation Engineers (SPIE) Conference Se-ries, Vol. 4008, Optical and IR Telescope Instrumentation and Detectors, ed.M. Iye & A. F. Moorwood, 534–545
D’Odorico, S., Cristiani, S., Dekker, H., et al. 2000, in Society of Photo-OpticalInstrumentation Engineers (SPIE) Conference Series, Vol. 4005, Discoveriesand Research Prospects from 8- to 10-Meter-Class Telescopes, ed. J. Berg-eron, 121–130
D’Odorico, V., Cupani, G., Cristiani, S., et al. 2013, MNRAS, 435, 1198Dopita, M. A. & Sutherland, R. S. 1995, ApJ, 455, 468Emonts, B. H. C., De Breuck, C., Lehnert, M. D., et al. 2015, A&A, 584, A99Emonts, B. H. C., Lehnert, M. D., Dannerbauer, H., et al. 2018, MNRAS, 477,
L60Falkendal, T., De Breuck, C., Lehnert, M. D., et al. 2019, A&A, 621, A27Fechner, C. & Richter, P. 2009, A&A, 496, 31Feltre, A., Charlot, S., & Gutkin, J. 2016, MNRAS, 456, 3354Ferland, G. J., Chatzikos, M., Guzmán, F., et al. 2017, Rev. Mexicana Astron.
Astrofis., 53, 385Ferruit, P., Binette, L., Sutherland, R. S., & Pecontal, E. 1997, A&A, 322, 73Gaia Collaboration, Brown, A. G. A., Vallenari, A., et al. 2018, A&A, 616, A1Gaia Collaboration, Prusti, T., de Bruijne, J. H. J., et al. 2016, A&A, 595, A1Greene, J. E., Janish, R., Ma, C.-P., et al. 2015, ApJ, 807, 11Greene, J. E., Murphy, J. D., Graves, G. J., et al. 2013, ApJ, 776, 64Gullberg, B., De Breuck, C., Lehnert, M. D., et al. 2016, A&A, 586, A124Hamann, F. & Ferland, G. 1993, ApJ, 418, 11Hatch, N. A., De Breuck, C., Galametz, A., et al. 2011, MNRAS, 410, 1537Heckman, T. M., Lehnert, M. D., van Breugel, W., & Miley, G. K. 1991, ApJ,
370, 78Henry, R. B. C., Edmunds, M. G., & Köppen, J. 2000, ApJ, 541, 660Hernández-García, L., Vietri, G., Panessa, F., et al. 2018, MNRAS, 478, 4634Holt, J., Tadhunter, C. N., & Morganti, R. 2008, MNRAS, 387, 639Humphrey, A., Vernet, J., Villar-Martín, M., et al. 2013, ApJ, 768, L3Humphrey, A., Villar-Martín, M., Binette, L., & Raj, R. 2018, ArXiv e-prints,
arXiv:1810.04463Humphrey, A., Villar-Martín, M., Fosbury, R., et al. 2007, MNRAS, 375, 705Humphrey, A., Villar-Martín, M., Fosbury, R., Vernet, J., & di Serego Alighieri,
S. 2006, MNRAS, 369, 1103Humphrey, A., Villar-Martín, M., Sánchez, S. F., et al. 2008a, MNRAS, 390,
1505Humphrey, A., Villar-Martín, M., Vernet, J., et al. 2008b, MNRAS, 383, 11Humphrey, A., Zeballos, M., Aretxaga, I., et al. 2011, MNRAS, 418, 74Jarvis, M. J., Rawlings, S., Eales, S., et al. 2001, MNRAS, 326, 1585Jarvis, M. J., Wilman, R. J., Röttgering, H. J. A., & Binette, L. 2003, MNRAS,
338, 263Karouzos, M., Jarvis, M. J., & Bonfield, D. 2014, MNRAS, 439, 861Keenan, F. P., Ahmed, S., Brage, T., et al. 2002, MNRAS, 337, 901Kolwa, S., Jarvis, M. J., McAlpine, K., & Heywood, I. 2019, MNRAS, 482, 5156Krause, M. 2002, A&A, 386, L1Krause, M. 2005, A&A, 436, 845Krogager, J.-K. 2018, ArXiv e-printsMagliocchetti, M., Popesso, P., Brusa, M., & Salvato, M. 2018, MNRAS, 478,
3848Martin, C. L. 2005, ApJ, 621, 227McCarthy, P. J., Baum, S. A., & Spinrad, H. 1996, The Astrophysical Journal
Supplement Series, 106, 281McCarthy, P. J., Kapahi, V. K., van Breugel, W., & Subrahmanya, C. R. 1990a,
AJ, 100, 1014McCarthy, P. J., Spinrad, H., van Breugel, W., et al. 1990b, ApJ, 365, 487McQuinn, M. 2016, Annual Review of Astronomy and Astrophysics, 54, 313Morais, S. G., Humphrey, A., Villar-Martín, M., et al. 2017, MNRAS, 465, 2698Mullaney, J. R., Alexander, D. M., Fine, S., et al. 2013, MNRAS, 433, 622
Nesvadba, N. P. H., De Breuck, C., Lehnert, M. D., Best, P. N., & Collet, C.2017a, A&A, 599, A123
Nesvadba, N. P. H., Drouart, G., De Breuck, C., et al. 2017b, A&A, 600, A121Nesvadba, N. P. H., Lehnert, M. D., De Breuck, C., Gilbert, A. M., & van
Breugel, W. 2008, A&A, 491, 407Nesvadba, N. P. H., Lehnert, M. D., Eisenhauer, F., et al. 2006, ApJ, 650, 693Newville, M., Stensitzki, T., Allen, D. B., et al. 2016, Lmfit: Non-Linear Least-
Square Minimization and Curve-Fitting for Python, Astrophysics SourceCode Library
Oppenheimer, B. D. & Davé, R. 2008, MNRAS, 387, 577Oppenheimer, B. D., Davé, R., Kereš, D., et al. 2010, MNRAS, 406, 2325Oppenheimer, B. D., Schaye, J., Crain, R. A., Werk, J. K., & Richings, A. J.
2018, MNRAS, 481, 835Pentericci, L., Röttgering, H. J. A., Miley, G. K., et al. 1999, A&A, 341, 329Perna, M., Cresci, G., Brusa, M., et al. 2019, A&A, 623, A171Péroux, C., Petitjean, P., Aracil, B., Irwin, M., & McMahon, R. G. 2004, A&A,
417, 443Planck Collaboration, Ade, P. A. R., Aghanim, N., et al. 2016, A&A, 594, A13Rakshit, S. & Woo, J.-H. 2018, ApJ, 865, 5Reuland, M., van Breugel, W., de Vries, W., et al. 2007, AJ, 133, 2607Reuland, M., van Breugel, W., Röttgering, H., et al. 2003, ApJ, 592, 755Rocca-Volmerange, B., Le Borgne, D., De Breuck, C., Fioc, M., & Moy, E. 2004,
A&A, 415, 931Roettgering, H. J. A., van Ojik, R., Miley, G. K., et al. 1997, A&A, 326, 505Rottgering, H. J. A., Hunstead, R. W., Miley, G. K., van Ojik, R., & Wieringa,
M. H. 1995, MNRAS, 277, 389Rózanska, A., Nikołajuk, M., Czerny, B., et al. 2014, New A, 28, 70Saito, T., Matsuda, Y., Lacey, C. G., et al. 2015, MNRAS, 447, 3069Seymour, N., Stern, D., De Breuck, C., et al. 2007, ApJS, 171, 353Shull, J. M., France, K., Danforth, C. W., Smith, B., & Tumlinson, J. 2010, ApJ,
722, 1312Silva, M., Humphrey, A., Lagos, P., et al. 2018a, MNRAS, 481, 1401Silva, M., Humphrey, A., Lagos, P., et al. 2018b, MNRAS, 474, 3649Songaila, A. 1998, AJ, 115, 2184Soto, K. T., Lilly, S. J., Bacon, R., Richard, J., & Conseil, S. 2016, MNRAS,
458, 3210Swinbank, A. M., Vernet, J. D. R., Smail, I., et al. 2015, MNRAS, 449, 1298Tadhunter, C. N., Fosbury, R. A. E., & Quinn, P. J. 1989, MNRAS, 240, 225Tepper-García, T. 2006, MNRAS, 369, 2025Tumlinson, J., Peeples, M. S., & Werk, J. K. 2017, Annual Review of Astronomy
and Astrophysics, 55, 389van Breugel, W., de Vries, W., Croft, S., et al. 2006, Astronomische Nachrichten,
327, 175van Breugel, W., Filippenko, A. V., Heckman, T., & Miley, G. 1985, ApJ, 293,
83van Ojik, R., Roettgering, H. J. A., Carilli, C. L., et al. 1996, A&A, 313, 25van Ojik, R., Roettgering, H. J. A., Miley, G. K., & Hunstead, R. W. 1997, A&A,
317, 358Vernet, J., Fosbury, R. A. E., Villar-Martín, M., et al. 2001, A&A, 366, 7Vernet, J., Lehnert, M. D., De Breuck, C., et al. 2017, A&A, 602, L6Villar-Martín, M., Binette, L., & Fosbury, R. A. E. 1999, A&A, 346, 7Villar-Martín, M., Cerviño, M., & González Delgado, R. M. 2004, MNRAS, 355,
1132Villar-Martín, M., Fosbury, R. A. E., Binette, L., Tadhunter, C. N., & Rocca-
Volmerange, B. 1999, A&A, 351, 47Villar-Martín, M., Humphrey, A., De Breuck, C., et al. 2007, MNRAS, 375, 1299Villar-Martin, M., Tadhunter, C., & Clark, N. 1997, A&A, 323, 21Villar-Martín, M., Vernet, J., di Serego Alighieri, S., et al. 2003, MNRAS, 346,
273Weilbacher, P. M., Streicher, O., Urrutia, T., et al. 2014, in Astronomical Data
Analysis Software and Systems XXIII, Vol. 485, 451Wilman, R. J., Gerssen, J., Bower, R. G., et al. 2005, Nature, 436, 227Wilman, R. J., Jarvis, M. J., Röttgering, H. J. A., & Binette, L. 2004, MNRAS,
351, 1109Wilson, A. S., Binette, L., & Storchi-Bergmann, T. 1997, ApJ, 482, L131Wylezalek, D., Galametz, A., Stern, D., et al. 2013, ApJ, 769, 79Zirm, A. W., Overzier, R. A., Miley, G. K., et al. 2005, ApJ, 630, 68
Article number, page 21 of 21