museums on the market - erasmus university rotterdam j.v..doc · web viewaccording to joseph...
TRANSCRIPT

MASTER THESIS CULTURAL ECONOMICS & CULTURAL ENTREPRENEURSHIP
MUSEUMSon the
{MARKET}So
urce
: http
://w
ww
.mar
ybla
ckfo
unda
tion.
org/
unca
tego
rized
/our
-col
lecti
ve-w
isdom
/att
achm
ent/
crow
d-in
-the
-rai
n

What visitors of Museum Boijmans Van Beuningen are willing to pay for its exhibitions
Jessica Verboom
2011SUPERVISOR: Dr. F.R.R. Vermeylen
SECOND READER: Prof. Dr. A. Klamer
ERASMUS SCHOOL OF HISTORY, CULTURE AND COMMUNICATIONERASMUS UNIVERSITY ROTTERDAM
MUSEUMS ON THE MARKET
What visitors of Museum Boijmans Van Beuningen are willing to pay for its exhibitions
Erasmus University RotterdamErasmus School of History, Communication and Culture
Master thesis Cultural Economics & Cultural Entrepreneurship
Author: Jessica VerboomStudent number: 311327
E-mail address: [email protected]

Mobile: 06 41635237
Supervisor: Dr. F.R.R. VermeylenSecond reader: Prof. Dr. A. Klamer
Spijkenisse, July 2011
Acknowledgements
This master thesis is the result of an accumulation of challenges in this last wonderful year
and could not have been realized without the help and support of many during the writing
process. I first like to thank Dr. Filip Vermeylen for his guidance and enthusiastic support
whenever my sense of direction let me down or my confidence waned. His kind words and
academic knowledge brought me further than he thinks and it is he who taught me to go for
the extra mile. Furthermore, I would like to thank Prof. Dr. Arjo Klamer, my second reader,
whose symposium on creative financing of the arts brought me to this topic. My fellow-
students and friends formed a stimulating and enjoyable environment and gave
encouragements when needed. I am obliged to give special thanks here to Lies De Strooper,
for her helpful comments and for being my writing buddy, as well as to Kim van Overdam-De
Vries, who always believed in me and in my progress and provided me with her eternal
support.
I am also thankful to my mom, for the coffee, her kind-hearted pressure and well-
meant advices, my dad, for always having his opinion ready and facilitating me in every way,
and my little brother, for giving me the peace and quiet I needed. Last but not least, I would
like to give special thanks here to Museum Boijmans Van Beuningen, to my former
colleagues on the Marketing and Communication Department, namely Sandra van Dongen,

Sharon Cohen and Carola de Groen for giving me their consent, but also to the courteous
guards, the generous catering personnel and the sympathetic ladies at the info desk, for
making my week of surveying just a little less long and boring.
Summary
Within the context of serious cutbacks in cultural funding by the Dutch government, this
thesis poses the question whether there is a support base among the public of arts and heritage
to finance (part of) its activities. The functions of art museums are manifold and create
complex issues in financing the museum. To narrow down the question, Museum Boijmans
Van Beuningen has been chosen as a case-study. To measure the willingness among visitors
to financially support the exhibition program of the museum with yearly contributions, a
contingent valuation study was used. Visitors nearing the exit were asked to fill in a survey.
Questions were added concerning their cultural preferences, visiting patterns and socio-
demographic profile. From a dataset of 105 respondents, a visitors’ profile could be
constructed. Following that, the analysis of the willingness-to-pay question showed that only
a minor proportion (38,5%) wanted to contribute to the museum’s exhibition program.
Excluding for protest bids, this resulted in an average WTP of € 8,74. To explain the high
amount of zero-bids respondents were asked directly for the main reason behind their
unwillingness. This pointed out that visitors are certainly aware of other financing methods as
sponsors and admission pricing, but also of the responsibility of the government in financing
the activities of Museum Boijmans Van Beuningen. The respondents who were willing to
financially commit themselves to the museum expected opportunities in return which would

widen and deepen the experience of their visit. The distinguishing characteristics that mainly
explain the decision to support were age, income and frequency of visits. In general, this
thesis tries to show that the support base of an organization depends on the efforts made to
communicate and interact with the public, emphasizing the role of new media and reputation.
Table of Contents
I. Introduction 1
II. The special economics of art museums 3Introduction 3
1. A definition of the art museum 3 1.1 Collection and preservation issues 51.2 Museum research 81.3 The communication function 91.4 Digitalization of museum functions 111.5 The case of Museum Boijmans Van Beuningen 13
2. Financing the art museum 16 2.1 An intervention: the logic of spheres 162.2 Public support 192.3 Corporate support and own income 222.4 Private support 292.5 Financing Museum Boijmans Van Beuningen 352.6 The problem statement 38
III. Methodology and valuation methods 40Introduction 40
3. Defining the valuation method 40
3.1 Problems with CV 433.2 Survey design 463.3 Data collection 48
IV. Results 49Introduction 49
4. Visitors’ profile 49
5. The support base among visitors 59
V. Conclusion 68
VI. References 73
VII. Appendix 78Survey Museum Boijmans Van Beuningen

INTRODUCTION
I. Introduction
After years of stimulation and facilitation, the Dutch government has recently decided to
severely cut funding for the arts and heritage. This was met immediately with anxious protests
from the cultural sector, which were loud but relatively docile and hardly effective. Under the
political pressure, the cultural field is forced to rethink its finances and to apply more
creativity. The museum sector, for example, which is a typical sector that is heavily
subsidized by governments, is now experimenting with new financing methods to generate
more own income by e.g. selling off stocks, renting out spaces, providing ancillary services or
extending Friends organizations and looking for sponsors. These creative solutions are either
received with criticism – often from within the cultural field, where these ‘commercial
measures’ are seen as a bad – or with a lot of enthusiasm and media attention, like the buzz
surrounding the new financing method of crowdfunding, where a critical mass of ‘fans’ can
generate enough funds to realize a common goal. One recent success story of crowdfunding in
the arts is the unique fundraising campaign started by the Louvre Museum in Paris. For the
purchase of “The Three Graces” by Lucas Cranach the Elder for 4 million euro, the Louvre
already had collected 3 million euros from funds and sponsors and decided to turn to the
public for the remaining million. On the website www.troisgraces.fr art-lovers were asked to
make a donation for the purchase of this ‘Trésor national’. Within a month time 5.000 people
had left enough donations to purchase the painting, with the donors ranging in age from 8 to
96 (Volkskrant, December 17th 2010). It was heralded as a pure expression of a nation’s love
for art, a clear signal to the French government of the huge importance of national heritage,
and the first successful application of crowdfunding in the museum sector.
The renewed interest by museums in the opportunities of the market due to a need of creative
financing methods, offers new and interesting avenues for research. From an economic
perspective, of particular interest is the democratic voice the public expresses on the market,
as economists lay emphasis on the notion of consumer sovereignty. In new and drastic times
of government cutbacks, questions also rise from a cultural perspective on whether there is a
sufficient support base within society for artistic and cultural heritage. In other words, is the
public willing to provide financial back-up when their taxes aren’t invested in cultural assets
1
INTRODUCTION
anymore? This makes my research question, which is twofold, very relevant today, but not
less challenging.
Is there a willingness to pay among the visitors to Museum Boijmans Van Beuningen in
Rotterdam to contribute yearly to a special fund to finance the museum’s exhibitions, and
which factors influence their decision?
Because the financing decision is important from both a scientific and managerial perspective,
the second question concerning the factors which can clarify the base of support has been
added. I opted to research one particular aspect of the museum experience, the exhibition
function, which is enjoyed and valued by the public at large. In addition, Museum Boijmans
Van Beuningen has been selected for particular reasons, but foremost for its local, national
and even international presence and well-known exhibitions.
This thesis begins with an overview of the literature on museum economics, complemented
with research from museum studies. Before giving support, one needs to know what will be
achieved with this support. Therefore, the first chapter starts with the activities of the
museum, also called the museum output or services, which are outlined in the mission
statement. Art museums have faced an accumulation in functions throughout the ages, which
has led to a parallel shift in costs and consequently, to additional funding to cover them. How
museums manage to sustain themselves financially will be clarified in the second chapter. In
the third part the method and methodology is laid out. How can contingent valuation methods
help to answer the problem statement and also, how can it not? The study is conducted within
a cross-sectional research design, i.e. surveys were handed out to visitors of the museum on
their way out. The fourth and fifth chapter presents the results from these efforts and the
conclusion argues whether there is indeed a sincere willingness-to-pay among a crowd of
visitors to museums or art in general.
2

THE SPECIAL ECONOMICS OF ART MUSEUMS
II. The special economics of art museums
IntroductionThe literature on the museums economics has grown extensively during the late 1980’s and
1990’s and is still cumulating to this day. Scholars as Frey and Pommerehne (1989), Feldstein
(1991), Frey (1994), Peacock (1995), Johnson and Thomas (1998), Heilbrun and Gray (2001)
and Towse (2010) provide a good overview on the topic. Wherever this greater interest for
museums came from, on this background new studies outside the field of economics began to
emerge, like museum marketing and management. Most knowledge on the subject is drawn
from museology or museum studies, which is the study to the objectives of museums and the
development of their role in society. This literature review will mostly use the economic
perspective and aims to be a comprehensive analysis of the state-of-the-art of the museum
sector and the issues at hand, most notably those in art museums as Museum Boijmans Van
Beuningen in Rotterdam.
1. A definition of the art museum The museum sector is a fluid area with a large variety in size, content, structure and authority,
making it hard to form one consistent definition. This is apparent when making comparisons
between museums on both an international and national level. In the Netherlands alone,
around four different definitions exist, leaving big differences in the number of museums.1 As
the nature of the museum has seen many developments throughout history, the debate around
the definition will probably keep turning up. For the purpose of this thesis, the official
definition by the International Council Of Museums (ICOM), a leading authority in the field
of museology and affiliated with UNESCO, will be used:
A museum is a non-profit, permanent institution in the service of society and its development,
open to the public, which acquires, conserves, researches, communicates and exhibits the
tangible and intangible heritage of humanity and its environment for the purposes of
education, study and enjoyment (ICOM, 2007).
1 For example, CBS (the Dutch statistics bureau) counts 773 ‘museum institutions’, where the Dutch Museum Association only registers 464 ‘members’. http://www.museumvereniging.nl/Devereniging/Museumdefinitieengetallen.aspx. Consulted: 26 April 2011.
3

THE SPECIAL ECONOMICS OF ART MUSEUMS
This definition makes clear that museums don’t perform just one function. According
to Joseph Veach Noble, in his important 1970 Museum Manifesto, the five basic
responsibilities of all museums is to collect, to conserve, to study, to interpret and to exhibit.
He argues that these functions can’t be seen as separate from each other. They act as an entity,
which basically means that the museum can’t cut back on one of these activities, since it will
affect its ability to reach its objectives (Weil, 1990: 57). Twenty years later, Weil (1990)
identifies a new paradigm in which he compiles the five functions into three: to preserve, to
study and to communicate. The collection and acquisition, the core focus of every museum,
and the conservation of these objects, keeping them intact for present and future generations,
together form the preservation function. It is the social responsibility of museums to collect
and maintain national heritage and to preserve its value to society. Part of this objective is the
study of this heritage, which makes sure that its value is understood in its proper context. In
turn, this is communicated to the public through exhibitions and educational activities for
interpretation of the objects (Weil, 1990). Especially in the ‘90’s the communication function
made a huge shift outwards to their audiences as public support was trimmed. Other
stakeholders and audience development became more important, urging changes in the
organizational structure to make room for public relations and marketing departments
(Hooper-Greenhill, 1994). These departments now perform a complementary task to the other
prime responsibilities.
The sum of these different functions or services of museums makes an interesting topic for
cultural economists. They view museums as “major repositories of a country’s stock of
objects and specimens of educational and cultural value” (Johnson & Thomas, 1998: 75).
Heilbrun and Gray (2001) define museums as “collections of objects that reflect and convey a
cultural heritage over time”. In this line, art museums, which are the focus of this thesis,
“preserve and present the artistic elements of that cultural heritage” (Heilbrun & Gray, 2001:
187). A more functional definition is given by Johnson (2003): “Museums are important
mechanisms for conserving, interpreting, researching and displaying heritage” (Johnson,
2003: 315). These functions all represent costs to the museum. In order to fulfill these
multiple outputs, museums use labor and capital that could have been used in other parts of
the economy. Museums can therefore be compared with vertically integrated firms with inputs
and output, which make them suitable for economic analysis (Johnson & Thomas, 1991;
1998).
4
THE SPECIAL ECONOMICS OF ART MUSEUMS
That museums are big visitor attractions also didn’t escape the attention of economists
(Johnson & Thomas, 1998). Museums are a major factor in the tourism industry, leading to
spillovers or externalities to society (Towse, 2002). Furthermore, they communicate social
and cultural values to the community (Weil, 1990). These values, like empowerment,
aesthetics and prestige, give the museum public good characteristics. This means that people
cannot exclude others by consuming the good, which makes it difficult to apply admission
charges and thus for making profits. Both the externalities and public good characteristics of
heritage are difficult to measure, leading to an invisible demand. In combination with
information problems, the non-profit nature of most museums and even its merit good
characteristics, Feldstein (1991) argues that museums cannot produce a socially optimum
level of services. Museums should therefore strike a balance between their multiple missions
and the costs of producing the desired output. A discussion of the uses and sources of funds is
then inevitable. In this chapter, the economic issues surrounding the different functions of
museums will be examined in more depth. The second chapter discusses the financing of art
museums and the case they can make for support from different interest groups.
1.1 Collection and preservation issues
The core of every art museum is its collection; the nature and range of the collection gives the
museum a face, an identity to communicate to its public. At the same time, it draws attention
and thus determines the composition of visitors. The museum usually has a lot of pieces to
choose from when organizing its galleries. But because works of art are non-reproducible
goods, at least the historical pieces, supply is fixed or even decreasing due to decay (Towse,
2010). Museums therefore hire a professional staff like restorers and registrars to delay this
process. However, by storing and preserving a large part of their collection, museums also
withhold a considerable amount of art from the market, while market prices are booming.
Feldstein (1991) therefore argues that art museums are considerably rich in terms of the
increasing asset value of their stocks, but at the same time they are considerably poor as
acquisition budgets decrease in relative terms and other parts of the operating budget have to
suffer. These tradeoffs pose interesting questions to economists, as holding on to reserves in
the depository is inefficient.
First, the importance of acquisitions needs to be weighed against the importance of other
operational activities. With full museum depositories, the economist would choose to expand
the museum building in order to exhibit all holdings. Economically speaking, the marginal
5
THE SPECIAL ECONOMICS OF ART MUSEUMS
benefit of extra space would then be set off against the marginal benefit of acquiring
additional art works (Heilbrun & Gray, 2001). Lack of space is a common constraint to
museums, as extensions are only possible against high costs, if at all. Sponsors or donors are
more than happy to support museums in building a new wing, especially when they can attach
their name to it. However, here is where the museum should consider whether this sort of
commercialization is warranted.
A second and more controversial issue in museum economics is the management of
their assets. Peacock has shown that only a small fraction of a museum collection is on
display, famously called the Prado-effect after his study in the Prado museum in Madrid,
where he estimated that only 10 percent of the collection is exhibited (Towse, 2002; Johnson,
2003; Frey, 2003a). A cultural economist will ask him-/herself why such a large part of the
collection is doomed forever to waste in the dark, cold vaults of the basement, while it can be
traded on the market for a huge amount of money. Indeed, the revenue generated by selling of
an art piece could be put to good use in other activities or projects of the museum. Not selling
would mean a large flow of income forgone, which equals the opportunity costs of the
collection. And because the market value of art is rising, these costs are rising as well (Frey,
2003a).
While a large collection can signal institutional legitimacy and is a source of prestige,
Weil (1990) and Johnson and Thomas (1991) argue that it also can be a mixed blessing, since
preserving a collection is demanding and a lot of the art objects will be of little to no interest
in the long run. Preservation is a very expensive activity which can only be done in-house by
large art museums; smaller museums need to source it out (or ignore it altogether) to avoid the
large fixed costs (Heilbrun & Gray, 2001). The same goes for the digitalization of the
collection, which also yields large overhead costs (Towse, 2010; see 1.4).
However, in the world of arts, deaccessioning, the gentle term for letting art objects
flow out of stock by sales or loans, is a rather uncomfortable word to say the least! How high
sentiments can run in this matter may be exemplified with the following case. In 1999 Chris
Dercon, director of Museum Boijmans Van Beuningen in Rotterdam, faced a troubling
financial situation. The acquisition budget was frozen and the budget for the innovation and
expansion of the museum could not be covered. In order to find extra funds, he looked for
paintings in his collection that didn’t fit the overall collection – called “boulders” – which he
could sell off. He encountered the painting ‘Grey, orange on maroon 60/8’ by Mark Rothko
6

THE SPECIAL ECONOMICS OF ART MUSEUMS
and offered it to Christie’s New York, who soon found two serious buyers.2 When Dercon’s
plan leaked to the press, the curators of the museum – who said not to be informed previously
on this matter – were furious, claiming that Dercon only wanted to cover the deficits in the
construction budget. They argued that this money should instead go to the acquisition budget,
to compensate for the loss. The feud escalated so far that the sale was cancelled, heavily
affecting the reputation of the director (Timmer, 2007).
The persuasive reluctance of museum professionals to deaccession part of their stocks
may in part be explained with the above example. Art experts are afraid that the loss of a
renowned painting, like the Rothko, would leave a big hole in their collection. The art
historical value is weight more heavily in the selling decision than the market value of the
discussed work. Frey (2003a) rejects this argument. Art historians also take part in the market
valuation of assets on the current market and indifferent of how knowledgeable they are, even
they can’t follow the turbulence of tastes on this market. Determining that the future value of
keeping the work for the public exceeds the market value is therefore improbable to be
certain. Instead, Frey (2003a) finds a more convincing argument in the restrictions museums
encounter concerning their stocks. Especially in Europe, museum collections are part of the
city and the state. To deaccession an important work that does not fit the current collection
would nevertheless be considered a community loss and would thus affect the public trust. On
the other hand, the public authorities may find an incentive to cut subsidies when museums do
sell their private stocks, which is a crowding-out effect (Towse, 2010). Furthermore, the trust
of the donor, who considers offering part of his/her collection to a museum, will be affected.
A common requirement of a donor is that the contributed work or works are kept in the
collection for the public to see. Museum directorates thus need to weigh up the benefits of
receiving those gifts, on which they heavily depend on for the development of their collection,
and the costs of the concomitant restrictions (O’Hagan, 1998).
The advantages of deaccessioning have found more proponents in recent years, as it
provide the museum managers and policy makers with the opportunity to specialize or
diversify their collection. This development is reflected in the construction of special
guidelines for museum collections.3 The guidelines are constructed in order to correct for the
misallocation of objects in collections by distributing them over interested parties. One way to
2 Though the municipality of Rotterdam owned the work they agreed with the sale, which was estimated to be around 8 million guilders, now approximately 3.6 million euro.3 For example, in 2000 the Netherlands released official guidelines for deaccessioning museum collections, named Leidraad voor het afstoten van museale objecten, or Lamo for short (see Bergevoet, Kok & De Wit, 2006 for more details).
7

THE SPECIAL ECONOMICS OF ART MUSEUMS
distribute these art works is to rent them for a fee to other museums. Weil (1990) even argues
for a division of labor among museums, where large museums focus on acquisition and
preservation, while small museums can stage exhibitions with loans from the larger-scale
depositories, specifically aimed at their own community. He bases his arguments on the
competitive strengths of the two museum types, the larger ones being more resourceful and
the smaller ones more flexible. Economists, however, will find these transactions less efficient
than sales (Frey, 2003a). Other solutions can be joint acquisition or sharing of a collection,
like in museum clusters or franchises, or loaning works for special exhibitions.
1.2 Museum research
The collection is a prerequisite for the other activities a museum aims to achieve, like the
research objective. Research in museums can be defined as “determining as precisely as
possible the origin, authorship and character of each object in the collection” (Heilbrun &
Gray, 2001: 190). Output is expressed in the maintenance of a library, the publications as sold
in the book- or museum shop and the organization of lectures and symposiums. At the same
time, research is also part of the work of a curator when developing exhibitions. In these
terms, Johnson and Thomas (1991) make a distinction between intermediate and final outputs
of a museum. Intermediate outputs are the collection, the storage and documentation of art
objects. In other words, these museum services only prove to be useful when applied at some
moment in time in the production of the final outputs. The latter kind of output is associated
with research and exhibition development which directly provides utility to the end-consumer,
i.e. the visitor. Museums differ in the degree of importance they attach to the two types of
final output: some put a premium on research, while others focus on the visitor experience. In
recent decades, the study function seems to gain more legitimacy in art museums as a
valuable complementary output of (special) exhibitions. For example, catalogues are seen
nowadays as important contributions to knowledge in the arts field. However, Anderson
(2005) states that research in the traditional sense, “the production of new knowledge based
on the use of artifacts or natural objects as evidence” (p. 298), by curators has been crowded
out by the growing primacy of administrative tasks. Though this study largely draws on an
UK perspective, the overall trend – the strong pressure on museums to look outwards for their
funding besides public subsidies – can be perceived everywhere.
Demand for museum research, e.g. in the form of publications and lectures, is
primarily accruing from scholars. Johnson and Thomas (1991) argue that this demand is
expressed in both direct transactions and indirect by donations, for example from special
8

THE SPECIAL ECONOMICS OF ART MUSEUMS
funds. Research can also be a derived demand from the exhibition function, where visitors
attracted by the experience buy more information on particular paintings or painters which
occur in the collection in the museum bookshop.
Art historians or associated professionals, either hired-in or independent, take care of
the supply of museum studies. Depending on the value put on research in the mission
statement, the production can be expanded by hiring more staff until diseconomies of scale set
in. According to Johnson and Thomas (1991), economies of scale can even lie within the
synergies between the staff, i.e. the tacit knowledge that can spread among the research team.
Innovative technologies also provide new opportunities for preservation, discovery or
rediscovery of artistic objects and art-historical research. When applied, they can delay the
decay of assets or speed up the process and improve the quality of restoration. Other
technologies can discover new paintings under old ones without even touching the paint. The
effects of these new technologies should not be overlooked, as they increase productivity,
develop a specialization in human capital and create new jobs (Musumeci, 2002). Also, access
to research has widened due to the dissemination over the Internet, able to reach a far larger
group beyond museum professionals.
1.3 The communication function
The responsibility of an art museum to society is to exhibit the nation’s cultural heritage and
educate its value to the public. Especially the educational mission is emphasized.
Traditionally, these activities were mainly performed in a one-way, unresponsive an unequal
manner – features of mass communication – where little space was left for other
interpretations and visitor’s needs were neglected (Hooper-Greenhill, 1994). Museum
directorates indeed paid very little attention to the visitor, as they were no significant source
of income (Frey & Pommerehne, 1989). However, with the rise of the knowledge society the
transmission of ideas and values to the general public became more important.
This stimulated a change in output away from collection, preservation and research
towards temporary exhibitions aimed at large audiences. Hutter (1998) analyzed this
development by looking for its causes in the input structure (technological innovations), on
the museum marketplace (competition), in the expense structure (capital investments) or in
the income structure of art museums and eventually found an explanation for this “growing
consumer-orientation” in the latter. As public spending decreased, income from corporate and
individual sources increased, which indicates that firms and private individuals started to
attach more value on the display services of museums. Especially the social and artistic value
9

THE SPECIAL ECONOMICS OF ART MUSEUMS
of art collections, warranted by the judgments of experts, is something they want to be
associated with. For both producers and consumers, consumption of exhibitions thus
generates network externalities, i.e. the interaction with the art objects connects the users of it
with each other. These connections in turn increase utility to art consumers.
Following this, the final output of the exhibition service can now be defined as the
experience of the museum by the visitor. Because this also depends upon the information
provided to the consumer, e.g. in the form of booklets, catalogues or guided tours, research
may also be seen as an intermediate output for the exhibition function. Also part of the visitor
experience is the availability of add-on services, such as restaurants, bookshops and parking
facilities (Johnson & Thomas, 1991).
For the museum management, it is important to know the determinants and the nature
of this experience. Visitor surveys are a helpful tool here and therefore are a much conducted
method within the museum field. Ashworth and Johnson (1996) for example, asked museum
visitors whether they received value for money, which assesses the quality as perceived by the
consumer against the costs of the service.4 Results showed that determinants as the spend time
in the museum, time passed since the decision of the visit, facilities in the museum, earlier
visits and the type of visitor (one-day tripper or tourist) have positive effects on the
consumer’s evaluation. Furthermore, there are indications that the number of visitors present
at one time also has an impact on the visitor experience. Maddison and Foster (2003) have
convincingly demonstrated this for visitors of the British Museum, who wanted to pay an
average of 8,05 pounds in order to avoid congestion, which may be equal to the magnitude of
the negative externalities that may arise with the museum activities. In the same vein, Salazar
Borda (2007) found a willingness-to-pay extra on the ticket of 1,33 euros for the Rubenshuis
Museum in Antwerp.
Two recent phenomena in the museum world are the rise of superstar museums and special
exhibitions and tours. Both trends have the capability to reach a large global audience, as they
facilitate instant access to a high concentration of prime quality art and therefore have an
economic interest. The concept of superstar museums has been formally introduced by Frey
(1998), who characterizes these museums as depositories for world-famous master paintings
or painters and consequently big tourist attractions. They often own a building of great
architectural design and are commercialized in the sense that they own high-quality ancillary
4 Luksetich and Partridge (1997) and Kirchberg (1998) also emphasized the impact of quality of exhibitions on demand, though they used other approaches to prove this.
10

THE SPECIAL ECONOMICS OF ART MUSEUMS
services and have a huge impact on the local economy. An explanation for their huge success
can be referred to as the superstar effect, which means that visitors only remember a restricted
number of great institutions remunerated for their quality. Because they can reach such a large
audience, superstar museums can exploit economies of scale as their competition focus shifts
from local to global superstar museums. In order to compete on that level, they put extensive
effort in staging special exhibitions that are visitor-oriented and provide a “total experience”
(Frey, 1998).
Nowadays, almost every art museum is planning to stage exhibitions which are based
on the top works in its collection or with loans from other museums or private collectors.
Large temporary exhibitions usually travel to other museums or exhibition halls to spread the
high costs. Heilbrun and Gray (2001) argue that special exhibitions and tours have a huge
impact on the geographic distribution of art, providing a large concentration of thematic
works to remote areas. When exhibitions attract large visitor numbers and receive
overwhelming media attention they are called blockbusters, which can generate high revenues
for the museum. Other advantages to this trend are the attraction of new visitors, the large
support that can be expected from local business, the remarkable flexibility of special
exhibitions and their relatively low production costs when compared with the resources which
are allocated to the ‘fixed’ museum services as the permanent collection. However, critics like
Frey (2003a) have their doubts about these expensive exhibitions and tours, because art
museums already face huge pressures on their budgets and as an experience good, the
reception of a new exhibition is highly uncertain and thus comprises high risks.
1.4 Digitalization of museum functions
The popular trend in the museum world to look outwards to their stakeholders has been
accompanied by new information technologies of the knowledge society. There is a growing
presence of museums on the World Wide Web, connecting local museums with global
communities. Digitalization of the collection became a top priority in large art museums, at
the same time provoking a discussion about the documentation and quality of these virtual
artifacts. In fact, the appearance of new media on the heritage scene brought many questions
to the fore. Though the area is sparsely researched, this section will try to answer what effect
these new technologies have on the traditional notion of museum output, taking an economic
point-of-view.
The spread of communication technologies world-wide and the new possibilities of
multi-media applications have first of all increased the variety in artistic supply. Virtual tours
11
THE SPECIAL ECONOMICS OF ART MUSEUMS
through the museum and access to the collection have improved the experience, meeting the
visitor’s needs with little effort and against very low costs. With sophisticated programs and
datasets museums are able to provide their online visitors with personalized access and
presentation of objects that follow their interests and preferences (Milosavljevic, Dale, Green,
Paris & Williams, 1998; Aroyo et al., 2007). Direct communication with and the possibility of
direct feedback from visitors allow museums to improve their services. These new
technologies are also beneficially applied in marketing and administration areas of the
museum (Rentschler & Potter, 1996). Because of the rapid implementation of these
information channels, museums require more specialized staff, preferably in-house. For
example, the Indianapolis Museum of Art (IMA) has 16 full-time information professionals
employed5, who are responsible for many digital innovations within the museum for which it
is famous for. These information professionals need to quickly adapt to every new piece of
technology, assess whether it is relevant in relation with the museum objectives and promote
it among the rest of the museum staff (Marty, 2007).
Museums, especially the larger, resourceful ones, are thus extending their role as a
storekeeper of the nation’s heritage outside their nation’s borders, communicating and
enhancing their identity on a global scale through the Internet (Rentschler & Potter, 1996).
However, smaller museums face larger entry barriers. Setting up a website can be fairly easy,
but it requires highly expensive labor and capital that withhold them from implementing
sophisticated programs which are used by larger museums. Furthermore, the public good
nature of any information that is put on the Net brings along other issues, for example with
copyrights of high-res images of museum artifacts (Towse, 2010). In conclusion, these
technologies may have great promises, but they are only a complement to the basic functions
of the museum: “the virtual museum represents an instrument of study, information,
promotion of distant reality and, if necessary, can compensate for direct experience, although
it cannot replace the real museum, only work alongside it” (Musumeci, 2002: 111).
On the demand-side, the consumption of museum services from home has many
advantages, like the elimination of social barriers, the reduction in costs of visiting and
transportation, and more time to enjoy the collection. The interactivity of the new media also
encourages a participatory culture, where anyone can exchange ideas and engage with
organizations in a direct manner (Jenkins, 2006). Demand is nowadays more active and this
provides museums – which are usually closed institutions – with the opportunity to discuss
5 On 7 February 2011. This information can be checked on the IMA’s Dashboard which contains all sorts of museum statistics. http://dashboard.imamuseum.org. Consulted: 3 May 2011.
12

THE SPECIAL ECONOMICS OF ART MUSEUMS
and cooperate with the wider public, giving them a feeling of ownership if the conversation is
conducted in a right way (Verver, 2011). Furthermore, this development has facilitated a re-
evaluation of what constitutes art (see Arora & Vermeylen, 2011). Throughout history,
experts assessed which objects can be termed as ‘heritage’ and thus deserve preservation. This
certification of value is followed by a demand for the product; demand is then said to be
supplier-induced (Towse, 2002; 2010). However, with the rise of amateur-experts on the web,
a larger crowd can voice their opinion, democratizing the evaluation of art (Surowiecki,
2004). How the digital revolution exactly influences the notion of quality or will influence it
along the way is still open for debate. The field is sure to deliver many interesting and
challenging topics for further research.
1.5 The case of Museum Boijmans Van Beuningen
One art museum that is representative of the definitions set at the start of this chapter is
Museum Boijmans Van Beuningen (MBVB) in Rotterdam. This museum fulfills every
function given by Noble (1970) and Weil (1990): it has a diversified collection of great
volume, a serious number of staff hired for the preservation, specialized curators who publish
works of research and plan exhibitions in corporation with a team of museum staff, has
extensive educational programs and runs ahead in the use of new media as alternative
communication channels. In combination with the large visitor streams each year and its
national image the museum certainly has a stronghold in the Dutch museum world, and
specifically for the Rotterdam community.
Collection and preservation
The collection of MBVB consists of more than 140.000 artifacts, ranging from Old Art,
Modern Art, drawings and prints, to applied art and design and a special City collection with
work from exclusively Rotterdam artists. Represented artists include Old Masters as Peter
Paul Rubens and Rembrandt van Rijn, modern artists as Claude Monet and Joseph Beuys, and
contemporary artists as Gerard Richter and Pipilotti Rist. Furthermore, there is a unique
collection of surrealist paintings from among others Renée Margritte and Salvador Dalí. This
large collection was started and extended with the help of great collectors, with two of them
honored in the name of the museum: the initiator and lawyer F.J.O. Boijmans (1767-1847)
and shipping magnate D.G. van Beuningen (1877-1955).
13
THE SPECIAL ECONOMICS OF ART MUSEUMS
The museum has a large building from the municipality at its disposal, which is used
for exhibiting only hundreds of objects from its collection. MBVB thus clearly shows a
Prado-effect, despite the recent expansions of the building in the past decade. The biggest
problem concerns the preservation of objects. The museum depository is situated beneath the
old, original museum building from 1935 and is poorly protected against moisture and other
climate conditions. For the conservation of prints and drawings a solution is already found in
a new internal depository. For the other part of the collection a new depository needs to be
build, hopefully to be realized in 2015. Creative, temporary solutions of the museum include
moving part of the depository to the exhibition hall Kunsthal across the park while repairing
the vaults. This large operation required great effort from the museum staff. For professional
and careful restorations of paintings external restorers are hired, for example for the
restoration of a Dalí painting last year.
Research
The museum considers the research into its own collection and history as one of its key tasks.
Not only is the in-house staff responsible for the publications, but also external researchers
and specialists are attracted, who sometimes help organize exhibitions. Since 2007 MBVB
produces its own series of publications on research results, named the Boijmans Studies.
Currently they are working on collection catalogues in the light of a national project of
museum exhibitions from 1933 until the present. Noteworthy here is that the museum
facilitates the sale of its research output via a special web shop, widening the access to its
publications.
Exhibitions and educational activities
MBVB attracts large crowds of visitors every year (See Figure 1.1). The museum can also
expect many visitors during special exhibitions, like the Kees van Dongen exhibition at the
end of 2010 which attracted 205.000 visitors during its five-month period alone. Earlier
blockbusters were exhibitions around Jheronimus Bosch and Salvador Dalí. These
blockbusters can be easily discerned in the graph, though some caution need to be taken in the
interpretation, as measurement methods have much improved and double-counting is
possible, especially in the earlier period. In total, MBVB shows around 25 temporary
exhibitions per year, complemented with international summer exhibitions over the next five
years in an old submarine wharf in the Rotterdam harbor.
14
THE SPECIAL ECONOMICS OF ART MUSEUMS
Accompanying these exhibitions, the museum develops educational programs aimed at
children older than 3 and adults. It receives school-children mostly from the region and it
provides courses and guided tours for visitors. The museum can depend on an own studio for
varying educational goals, from workshops to showing movies. In total, 25 different programs
exist, among them a special program for kids where they can independently buy their own art
work. For these programs, the museum can depend upon a large local network, as well as on
innovative activities on the web.
Figure 1.1 Visitors to Museum Boijmans Van Beuningen 1990-2010
1990
1991
1992
1993
1994
0
50,000
100,000
150,000
200,000
250,000
300,000
350,000
400,000
450,000
500,000
Year
Visit
ors
Source: Museum Boijmans Van Beuningen, Marketing and Communication Department
New media
The museum is not only active offline, but also online (www.boijmans.nl). MBVB uses
different kinds of media platforms which is able to reach a large audience. Examples are
Boijmans TV, a humoristic art programme broadcasted on local television; Arttube, the first
Dutch museum video channel on the Net; an interactive platform where the highlights of the
museum’s collection can be consulted; and ALMA, a website that links pictures with artifacts
from the collection. Furthermore, visitors can store and share their favorites on My Boijmans.
Also, the museum staff communicates directly through varying social media such as
Facebook and Twitter.
15
“Verboden Stad”
“Schatten van de Tsaar” “Jeroen Bosch”
“Alles Dalí”
“Kees van Dongen”

THE SPECIAL ECONOMICS OF ART MUSEUMS
2. Financing the art museum In recent years, the need for finances has formed a pressing matter to art museums as the
extension of activities has caused a clear growth in their costs. Furthermore, museums face
more competition in the field and by time they therefore need to seek alternative ways to
supplement their budget. For the management of the budget, as well as for raising funds,
appropriate policies are needed. The economist’s task is not to form the policy objectives, but
to advise the museum management and policy makers on how to achieve them and to evaluate
whether the current policy is able to reach them (Towse, 2010). In other words, economists
provide a toolbox of methods for measuring costs – especially opportunity costs – and
benefits in particular scenarios. Frey and Pommerehne (1989) think that exactly these
instruments give cultural economists the power to influence (museum) policies and their
objectives by providing new economic solutions (e.g. vouchers) or by mobilizing the
population (e.g. with referenda).
The capacity of a museum to collect funds mainly depends on its access to different
income sources, such as patrons and the public (Rentschler, Hede & White, 2004). The legal
status of museums, i.e. being non-profit, (semi-) public or profit-oriented institutions, has a
big influence on this (Weil, 1990). Throughout history, museums were generally public places
and therefore completely financed by the government. After the Second World War the
number of private museums rose, especially in the USA, which were initiated by wealthy
patrons and financed out of private sources. The growth in the number of museums continued,
until public funds for cultural activities started to decrease and public museums were
increasingly privatized. However, it is not likely that this privatization – the move to the
market – has led to pure private outcomes. On the contrary, it has only led to more ‘hybrid’
forms of museums where public and private entities are hard to distinguish from each other.
The process of hybridization has made it possible for museums to find diverse sources of
income as they are no longer limited to only private or public funds, the main sources being
the government, corporations and the audience (Schuster, 1998). Each type of support has its
advantages and disadvantages, but the diversification of revenue sources at least gives a
museum more stability and continuity.
2.1 An intervention: the logic of spheres
Before delving into the grounds of support from a variety of income sources, it is important to
note here that these transactions occur in different ‘spheres’. The most important ones are the
16

THE SPECIAL ECONOMICS OF ART MUSEUMS
government, the market and the so-called ‘third sphere’. Sometimes these spheres are
complemented with a fourth: the ‘oikos’ or the sphere of the individual and his or her direct
surroundings (Klamer, 2006; Klamer & Langeveld, 2011), but in relation with museums this
sphere is not relevant for further discussion here. In these spheres different values are
realized, such as financial and social values, but also artistic, spiritual and cultural values. The
study by Alexander (1996) to behavioral shifts in U.S. museum over time may explain the
process of value realization in more detail. Alexander proved that museums are subject to
what is called resource dependency, meaning that those who control the resources can
pressure decision makers to meet their demands, ultimately affecting exhibition and
educational programs. She discovered that each kind of funder has different attitudes towards
their transactions. For example, when philanthropists were replaced by institutional funders,
museums reoriented themselves from internal (research, preservation) to external matters
(exhibitions, audiences). Therefore, art institutions must carefully consider in which sphere
they want to operate, without harming the values as stated in their mission. In other words,
especially in the world of the arts, the method of financing matters (Klamer & Zuidhof, 1998).
In the three spheres of the government, the market and the third sphere, different
specific logics are at work. The government and the funds that independently advise on the
distribution of public money operate according to specific rules, i.e. according to the formal
logic of policy objectives that have been set in advance. This bureaucratic character devalues
the personal relationship with citizens, reducing them to just a ‘number in the line’. However
quite stiff, the ideal type of a government intervenes on the basis of equity, as will be shown
in the next section, and serves the value of solidarity. Unlike the government, the market
distributes money on the basis of efficiency, where the ‘quid pro quo’ principle determines
transactions, i.e. the logic of direct exchange. In this sphere, the price of the product on offer
is determined by the subjective assessments of buyers and the objective conditions of the
production process. As price is the coordinating factor in the market, suppliers and buyers
have the freedom to choose a price they see fit. This consumer sovereignty stimulates
suppliers to carefully assess their product, price and marketing strategies according to the
commands of demand. Within museums, clear examples of market transactions are admission
prices and sponsoring. Nevertheless, the market logic also renders personal and social
relations irrelevant as price is the main determinant, which especially in the cultural field may
harm artistic values (Klamer & Zuidhof, 1998; Klamer & Langeveld, 2011).
The third sphere comprises other ways of funding different from both the market and
the government sphere. Klamer and Zuidhof (1998) include in this sphere – also called the
17

THE SPECIAL ECONOMICS OF ART MUSEUMS
‘civil society’ or the ‘informal sector’ – all voluntary and informal associations like circles of
friends, associations and non-profit institutions. In this sphere, transactions are based on
reciprocity, i.e. the value of the exchanged good is difficult to express in hard figures and
depends upon the social and interpretative skills of the participants. There is a social logic at
play here, where social and cultural values such as connectedness and loyalty are important.
Funding arrangements take the form of gifts and occur in accordance with a common goal. A
recent example that may fit this sphere is crowdfunding. Here, the common goal is the
realization of a project by contributions of a rather anonymous crowd, who get rewarded by
information updates on the project and ultimately by a final product. There is no direct
exchange until sufficient funds are collected and there is an opportunity to build up social
relationships with an interested and enthusiastic mass of donors, which differs with the sphere
of the market. As exchanges are quite ambiguous and diverse, it can be argued that the third
sphere is the most important among the three, although the exact size of the sector can – due
to its nature – not be accurately measured.
In the Netherlands, a variety of income sources in the cultural sector can be
distinguished. As can be seen from table 2.1, the logic of the government sphere is dominant.
Municipalities are obviously the largest cultural partners, followed by the central government.
However, the logic of the market is not far behind, with admissions forming an important
revenue stream in the sector. As said, the private sphere may be bigger as the table now
suggests.
Table 2.1 Sources of income in the subsidized cultural sector in the Netherlands
Source € mln Percentage
SubsidiesCentral government a 951 19%Provinces b 261 5%Municipalities b 1.894 38%Municipal schemes b 75 2%
Own incomeAdmission c 880 18%Other c 587 12%Private d 352 7%
Total 5.000 100%Source: Berenschot, 2010
a. Rijksbegroting 2010b. CBS 2008c. Berenschot (over 2007)d. Geven in Nederland 2009 (data over 2007)
18
THE SPECIAL ECONOMICS OF ART MUSEUMS
Based on the information provided by these figures, it is not hard to imagine that cuts in
government grants ask for a whole different mindset. Institutions as museums which
previously depended on subsidies suddenly need to adapt to a whole different logic, whether it
be the logic of the market or of the third sphere, or a combination of both. Although the
difference between the two spheres may be quite blurred in some cases, the types of
relationships cultural organizations will need to build with their income sources are
fundamentally distinct. For example, in the market, buyers want to see a physical product in
exchange for their money, where in the third sphere, donors expect a product or service in
return which may not be immediately expressed in monetary terms. This has a profound
impact on policy for e.g. fund-raising and marketing departments.
2.2 Public support
The individual policy followed by a museum is usually closely related with and for a large
part determined by the cultural policy of the government. Cultural policy can be defined here
as the broad range of “government interventions and initiatives to achieve objectives, such as
increasing participation in the arts and culture and encouraging diversity of cultural supply,
which may or may not involve public expenditure” (Towse, 2010: 263).
Economists spend much time on the question: ‘Why should the government support
the arts?” This is usually answered from the perspective of welfare economics. When the
desires of society are not met in the market, the supply of museum services will be on an
inefficient level. Government subsidies should then make up for the deficit up to the point
where marginal social benefits are equal to marginal social costs. However, social efficiency
can also be explained in another way, namely as the point where the prices in the market are
equal to the willingness-to-pay of consumers and reflect the (opportunity) costs of production
(Towse, 2010). For example, Martin (1994) – in a study on Canadian museums – decomposes
their value to society in revenues, consumer surplus, positive externalities and willingness to
pay taxes. By making use of the travel-cost method, contingent valuation and economic
impact studies, he discovered that the measured consumption benefits exceeded subsidies, i.e.
the social benefits exceeded the social costs. In this case, subsidies could even be larger.
The justification for government intervention in the museum sector mainly lies in its failure to
meet the market. However, market failure can have different grounds. One form is the
monopoly. As the market is fully dependent on one producer for a particular good or service,
the monopoly firm has an incentive to supply less than an optimal amount and to raise its
19

THE SPECIAL ECONOMICS OF ART MUSEUMS
price. This means that part of the demand is denied access to the desired good or service. An
art museum in one town or city usually has a monopoly position as it serves a local market or
a niche of that market (like one museum for contemporary art and one for historic art).
However, most museums are non-profit organizations, which have no incentive to produce
under an optimal level (Heilbrun & Gray, 2001). This doesn’t imply that some (superstar)
museums don’t enjoy a monopoly, as they can easily ask high ticket prices and therefore
ration entry. Nonetheless, it is more likely that they operate in an oligopoly or in monopolistic
competition as they face national or even global competition with other museums. In that
case, government support is not justified by this argument.
Another justification often given for public subsidies are the externalities or the
collective benefits that arise from consuming a good or service. Externalities are the benefits
society receives through the consumption of a particular good by one person (Towse, 2010).
On the question whether art in general has external benefits (costs are less likely to emerge),
answers are highly ambiguous as the definition of their nature is still subject of debate
(Heilbrun & Gray, 2001). Nonetheless, museums have been financed on the basis of some of
the following externalities: the bequest value of the collection, its perceived contribution to
the local economy, national prestige and its stimulation of innovation in the arts. These
externalities can be identified and valued by consumers and can be estimated, as Martin
(1994) did, with the help of a contingent valuation study.
Public support for museums has also been defended on two other grounds, which
however are losing in explanatory power in the current literature on cultural economics. The
first one is the argument of the productivity lag, introduced by Baumol and Bowen in their
1966 study to the performing arts and better known in the field as Baumol’s cost disease.
Because prices in the general economy keep rising and the productivity of cultural output lags
behind, arts advocates argue that the government should step in to cover the deficits that
otherwise can only be covered by raising the ticket price. However, Peter and Schwarz (1985)
wondered whether this lag would apply to museums, which comprise less labor-intensive
activities than in the performing arts. An earnings gap is thus less likely to exist. Towse
(2010) goes further by explaining that the stagnant production of arts and culture is not an
economic argument for government grants, because the industry as a whole is not dying out. It
is rather an argument for innovation within the industry by incorporating e.g. new
technologies, like the concept of virtual museums. The second argument – the believed
economic impact of a museum on the local economy – does not justify subsidies on its own,
as other projects may yield far greater revenues to the community. The best arguments for
20

THE SPECIAL ECONOMICS OF ART MUSEUMS
government subsidies thus reside on the efficiency grounds of welfare economics (Towse,
2010).
A discussion on how to justify government support also needs to incorporate
arguments which are concerned with equity. These arguments base themselves on a belief in
an equal distribution of income and access and ask whether it is fair that the poor layers of
society don’t have access to a particular good or service as a museum. Subsidies therefore
should facilitate this access and distribute the arts and culture to remote regions. This
justification must be clearly separated from the allocation of subsidies on efficiency grounds.
Redistribution of income should also happen by direct transfers of money to the poor, in order
to give the consumer the opportunity to decide for themselves where to spend it on. Instead,
this consumer sovereignty is replaced by a provision of goods and services by a central entity,
because the government presumes that consumers are ignorant of the value of some goods due
to a general lack of information (Heilbrun & Gray, 2001). This merit-good argument has done
well in cultural policy, but it is also a rather paternalistic point of view of the government.
The Netherlands, as well as other West-European countries, have a tradition of public
spending on arts and culture. This is mainly based on a deeply rooted argument that one’s
national heritage must be preserved for future generations. In museums, this support enables
them to provide their services in a stable environment, without the distracting obligation of
raising private funds. Also, the government is in the position to protect quality in art, where
the market is assumed to endanger art with its popularization and commerce (Heilbrun &
Gray, 2001). This legitimizing function of the government started to get a grip after the
Second World War when it dominated the funding of cultural activities. However, economists
are also critical of government involvement. As the ideal government is unlikely to exist,
realizing the values of this sphere to their full potential is not always possible. For example, it
is said to restrain creativity and growth because subsidy policies are subject to changes in the
political climate. Furthermore, in times of cyclical downturns in the national economy, art
budgets are usually the first to feel the pressure. Also, policy makers don’t want to associate
themselves with risky art and therefore have an incentive to distantiate from cases which
caused a public outcry. Here is where the famous expression of Thorbecke falls into place:
“The government is no critic of art”.
Public choice theorists will say that the government as a financer of art is part of a
principal-agent relationship. Therefore, besides failure on the side of the market, government
or public policy failure also exists (Towse, 2010). In a democracy, the preferences of
21

THE SPECIAL ECONOMICS OF ART MUSEUMS
consumers may not be reflected by votes through the ballot box. The market signals are then
unclear to the elected bureaucrats. This in turn gives them much freedom in the decision-
making process. Therefore, economists advocate for a local or an arms’ length control over
museum budgets. Being closer to their population, they receive more signals of what their
voters want. In the Netherlands, these decentralized governments are the municipalities (to a
less extent the provinces) and the cultural funds, which may independently decide over the
distribution of subsidies according to the rules and with the consent of the central
government6. Moreover, not only government failure can lead to an ‘incorrect’ equilibrium in
the market, but also management failure. Museum managers (the agents) have more
information about the organization at their disposal than the government’s ministries and
agencies (the principals) can have, which give them the incentive to try to maximize their
public funds for their own private benefits (Johnson & Thomas, 1991). This opportunistic
behavior can be restricted, but will consequently give more power in the hands of the
government.
2.3 Corporate support and own income
Museums under the control of a governmental authority most of the time lack the incentives
to exploit alternative financing methods. Frey (2003a) therefore argues that museums should
attain more budget sovereignty, which will give them more flexibility in income sources. This
process gained momentum in the 1980’s when privatization became advocated as the way to
economize on state support to museums (Heilbrun & Gray, 2001). Following the example of
American museums, special development or fund-raising programs were set up in order to
generate funds from the market and the private sphere. Feldstein (1991) argues that these
fund-raising projects, though risky, can pay off handsomely, pointing to an – again American
– study of Luksetich, Lange and Jacobs (1987). These authors explain that the ability of
nonprofit museums to find funds throughout the various levels of the economy is crucial for
their continuity and viability as an institution. Of course, the willingness among the
population to pay a voluntarily sum to the operating and investment budgets of museums also
depends on the general price level in the economy and whether or not favorable tax rules
exist. In order to be more effective in fund-raising, they continue, museums should know how
their type of collection and scale of operation appeal to different interest groups. Their overall
6 For an overview of these cultural funds, see: http://www.cultuursubsidie.nl/subsidieverstrekkers. Consulted: 19 June 2011.
22

THE SPECIAL ECONOMICS OF ART MUSEUMS
conclusion is that every spend dollar on fund-raising efforts is a dollar well spent, as they are
likely to yield more returns (Luksetich, Lange & Jacobs, 1987).
Museums are now exploiting ways to raise their own income, for example by
differentiating admission prices or adding more services to their operations. Corporations also
show an increased interest in art and culture, which is reflected in huge sums of sponsorships
in the sector. This in turn leads to a reduction of government funds, as social benefits are now
being expressed in a range of money or ‘in kind’ payments on the market (Johnson &
Thomas, 1991). In this case, private funding thus crowds out public support. This can also be
applied backwards: the intervention of the government crowds out private funds because
donors are less willing to provide support that is provided for anyway. On the other hand,
public funding can also be a source of certification to donors, giving them the comfort to
contribute to the institution. This is called crowding in, which can be facilitated by the
government by e.g. providing tax breaks. Both indirect as direct funds by private sources are
recommended by economists, as they better reflect the preferences of society in the market
(Frey, 1999; Towse, 2010). Up to this point, the market and the third sphere are taken
together, but for the rest of this section, the focus is on the market and its two main financing
methods: sponsoring and pricing.
Sponsoring museum services
Sponsorships are usually linked to a certain project, such as the facilitation of an exhibition or
of an entire wing. Although publicity may explain a large part of the corporate willingness to
pay, there are multiple motives behind this sort of sponsoring. The corporate owners may, for
example, donate for their personal pleasure or for that of their employees. They receive a
range of benefits in return – mostly in-kind – like exclusive previews or other VIP treatments.
Some CEO’s buy works on the market for their private collections, lending some of their
works to exhibitions. Their desire to showcase their art to the wider public has also initiated a
remarkable rise of corporate museums in recent years, which is a rare form of corporate
patronage (Steenbergen, 2010). Examples arise everywhere in Europe, as the Kunstmuseum
Wolfsburg in Germany by the car builder Volkswagen or the Migros-museum in Zürich by a
Swiss supermarket chain. Furthermore, corporations hope to achieve spillover-effects that
impact the local economy in reference of their social responsibility towards the community.
However, in the end, the realization of these societal, cultural and social values is for the
benefit of realizing financial values.
23
THE SPECIAL ECONOMICS OF ART MUSEUMS
Corporate giving doesn’t make up the entire operating budget of one museum because
it is unlikely to yield long-lasting attention, or it has to be a private museum or exhibition hall
showing a corporate collection (see Wu, 2002). However, it does contribute to the diversity of
funds, providing more stability to the museum. In this case, public and private spending
complements each other. This also reduces the concentration of power from the government.
For museums, a secure base of corporate support gives them more liberty of action and thus
an incentive to cultivate these relationships. For example, the Tate Modern in London is
sponsored by the food manufacturer Unilever for an entire series of exhibitions, called The
Unilever Series (www.tate.org.uk). In the long run, sponsors could form a loyal base of art
support which in turn would have a positive effect on government support by signaling social
value. However, corporate support is also said to dumb-down creativity and to spur
commercialization in the ‘sacred world of art’ (Heilbrun & Gray, 2001).
Despite clear advantages, corporations are also remarkably vulnerable to their external
environment, to business cycles and to changes in the organizational structure by mergers and
acquisitions. This could threaten the stability of the gift, because in times of economic
tightness the arts don’t usually get precedence over other business matters. Within this
commercial nature, the sponsored institution also has to deal with restrictions as agreed upon
with the sponsor. In other words, there exists a principal-agent relationship with the sponsor,
though less dominant than with governmental institutions (Heilbrun & Gray, 2001). Just like
the government, sponsors have more interest in covering fixed costs, as high overheads (e.g.
digitalization of the collection) and large capital expenditures (e.g. funding a new wing). In
short, corporate support is likely to be more variable than individual support, because of their
focus on short time-spanned and remarkable projects.
Pricing museum services
The literature on cultural economics, especially in the 1990’s, has largely revolved around the
topic of museum pricing. Economists hereby oppose each other on the grounds of equity,
providing free access to all, and on the basis of efficiency, focusing on the urgency of
covering operating costs. Especially the cost conditions the museum encounters in its
activities are important in the debate. Feldstein (1991) for example, argues that charging fees
can only be appropriate when funds from public and private sources are enough to uphold a
satisfactory level of museum services. He further asserts that voluntary contributions are
unable to reach this level on their own, as people want to free-ride on others, which is the
main disadvantage of public goods.
24
THE SPECIAL ECONOMICS OF ART MUSEUMS
Bailey and Falconer (1998) place the discussion of efficiency and equity in the
principle and practice debate of charging. They argue that the decision on whether or not to
charge an entrance fee should be approached from the practice of every museum in particular,
not from one general policy on charging, because each museum is valued differently on the
public good nature of their services and each faces unique financial constraints. In a more
recent article, Frey and Steiner (2010) contrast this with their study on charging principles of
museum policy, discussing the advantages and disadvantages of free entry, exit donations,
entry charge and museum clubs (memberships). Eventually, they propose the option of exit
pricing, which is comparable to a parking lot where one pays per minute. They favor this new
method because it takes into account the ‘value for money’ principle of consumers, though
they recognize the negative incentive of rushing through the galleries. Pricing in this way is
considered more efficient and more equal, as consumer sovereignty is hold intact. However,
Frey and Steiner (2010) argue that more potential pricing schemes are imaginable, especially
when barriers of entry are taken away, aiming among others at the inflexible opening hours of
museums.
An economic analysis of charging admission fees logically starts with the cost structure of
museums. Examining the issue, Heilbrun and Gray (2001) pose the following question: “How
do the costs of the display function vary with output in the short run, output being the level of
public admissions?” thereby assuming that the gallery spaces remain fixed. Because ticket
prices for visitors mainly relate to the exhibition function of the museum, the cost function of
this output is used. Their answer is based on logic and knowledge of museum operations, as
no empirical studies on the subject exist. Their conclusion is that exhibitions run under
decreasing unit costs, meaning that museums operate in a declining cost industry, where high
fixed costs (the basic operating costs) can be spread over the number of visitors (see figure
2.2) . The second part of the costs involved is the marginal costs for each additional visitor
that enters the museum. Think about extra security or front-desk personnel, or the extra
cleaning lady that needs to take care of the mess every additional visitor leaves behind.
Welfare economics shows that the price for a ticket should be equal to marginal costs,
which are assumed to stay the same for each additional visitor, though it is possible that they
will quickly drop to zero as well. The revenues from ticket sales should cover all operating
costs, which is the point where demand equals average operating costs. At this break-even
point, however, marginal costs are far below average costs and below price, which would
amount to a welfare loss. Charging at marginal costs, which is near to or a zero price, will
25

Visitors
THE SPECIAL ECONOMICS OF ART MUSEUMS
enable more visitors to enter the museum and thus serves the access objective, but it will also
lead to daily deficits. Arts advocates have used this as a justification for government
intervention, as they argue that lump-sum subsidies should be rewarded up to the amount of
the incurred deficits (Heilbrun & Gray, 2001; Frey, 2003b).
Figure 2.2 Costs of the museum display function
Source: Heilbrun & Gray, 2001
However, there are some hooks and eyes to this application of welfare economics. First of all,
the assumption of zero marginal costs is highly contested. Bailey and Falconer (1998) even
see this as a serious neglect of allocative efficiency theory. “In particular, the claim that
marginal cost is zero only relates to the short run marginal cost (SRMC) of additional visitors
to institutions operating below full capacity. However, long run marginal cost (LRMC) is
almost certainly positive and significant given the considerable costs of allowing visitors into
a museum.” (Bailey & Falconer, 1998: 173; italics are mine). Moreover, they argue, this
would mean that the museum management should look for complementary funds, not to
charge a zero entry price. Madison and Foster (2003) further affirmed this statement by
measuring congestion costs, which are costs not incurred by the museum, but by the visitors,
as their museum experience is affected when the galleries get crowded.
Second, it is the question whether this market failure should be corrected on efficiency
grounds (Bailey & Falconer, 1998). As Heilbrun and Gray (2001) put it, covering the welfare
loss with public support can more than offset the gain from pricing against marginal costs.
However, most economists argue in favor of a system that does reflect consumer preferences.
26
D
MC
AC
Unit costs
Break-even point

THE SPECIAL ECONOMICS OF ART MUSEUMS
The two-part tariff is often named as a solution for declining cost industries as museums. This
system covers deficits by the voluntary contributions and membership fees from (potential)
visitors. Furthermore, price differentiation in admission fees can also solve this problem
(Frey, 2003b). In this way, consumers are paying the costs instead of tax-payers who do not
visit any museums. As museums are local services, paying the deficit from local taxes on the
other hand may come close to the two-part tariff system. Furthermore, declining costs are
distinct from external benefits, for which government intervention is warranted.
Museum advocates mainly justify a zero price on the argument of accessibility to all.
However, this case has become less convincing because charging museums, even in times of a
recession, have encountered huge attendance numbers in recent years. Goudriaan and Van ‘t
Eind (1985), for example, show in an exemplifying study that the effect of charging an entry
fee has a moderate impact on attendance to four Rotterdam museums. The composition of the
audience changed little, but the duration of the visit was significantly longer after the
introduction. The most surprising result, however, was that the lower income strata showed a
relative increase in attendance, due to circumstances that could not be explained by the
available data (Goudriaan & Van ‘t Eind, 1985).
Nevertheless, Darnell (1998) saw an inevitable conflict between access and revenue
targets when demand is inelastic, in other words, when visitors are insensitive to price
changes. In order to reconcile the two and thus to be self-financing, the demand curve needs
to shift outward. Investments accruing from admission revenues can be used to enhance the
quality of the visit and thus to attract more visitors. O’Hagan (1995) for example, found when
researching the introduction of admission fees to the Long Room in Trinity College Library,
which exhibits the famous Book of Kells, that improvements paid from the earned revenues
had no negative effect on attendance, quite the contrary. Besides changes in quality, income is
another factor that weakens the ceteris paribus assumption of price elasticity of demand.
A trend that is particularly successful in attracting an efficient number of visitors while
enlarging the accessibility of art museums is the organization of special exhibitions. Because
these events are commonly crowded, marginal costs will inevitably rise in order to
accommodate for these large groups of people (Heilbrun & Gray, 2001). This justifies setting
a higher price for special exhibitions, which in Dutch museums usually comprise a €5 fee on
top of the normal entrance fee. Fortunately, the usual negative impact of price is more than
offset by the (very) low price elasticity of demand for such exhibitions, with the unique
product even attracting new groups of visitors.
27
THE SPECIAL ECONOMICS OF ART MUSEUMS
Compared to the display of the permanent collection, blockbusters have the advantage
that production costs are relatively low, because no fixed costs are attributed to them, only
additional costs. However, there are also some spiteful disadvantages to the blockbuster event.
The permanent collection is likely to be neglected in a visit to the event, which has the
tendency to attract all the attention. Nevertheless, on the long run, the visitor of the
blockbuster event may come back later to see what other amazing art works the museum has
in store. This shows that the communication function is particularly strong in special
exhibitions, because it leaves an enduring impression on the first-time visitor. Furthermore,
staging such an exhibition asks a lot from the museums’ resources, which can cause problems
in staffing. Because the exhibitions are rooted in an exchange system, the risks of
transportation come on top of that. Accidents, vandalism and burglary in crowded galleries
are also very common, as security is mostly understaffed in those times (Heilbrun & Gray,
2001; Frey, 2003a).
In recent decades, museums are also trying to maximize revenues by providing
ancillary services, like a bookshop or a restaurant attached to the museum, or by renting out
their premises. Indeed, these collateral activities bring in extra revenues and attract a more
diverse crowd. Steiner (1997), in a study to the impact of an additional free day on income,
takes three museum outputs into account: attendance, shop sales and cafeteria sales. Due to a
lack and the nature of available data, calculating elasticities of demand and cross-elasticities
of demand for shop and restaurant sales was simply impossible. Therefore she made an own
calculation and incorporates herein information on the composition of low and high value
visitors during free and normal days. Although the data strongly hinges upon assumptions, she
found that the extra attendance of visitors on a free day will not make enough profits to be
feasible. The extra sales from the shop and the restaurant are not in line with the extra
attendance, because free days mainly attract low value visitors who keep their expenditures
low. She adds that there may be a crowding-in effect due to increased goodwill among
consumers and thus extra consumer surplus.
Turning away from the efficiency and equity issues in the discussion on pricing, attendance
and earned income figures are also becoming important performance indicators in analyzing
museum policy. To economists, price has a second function besides generating revenues: it
provides consumers with a mean to express their willingness to pay, which in turn indicates
quality to the museum management (Towse, 2010). Calculating this consumer surplus is also
a powerful signal to the government and may therefore crowd-in public support. An example
28

THE SPECIAL ECONOMICS OF ART MUSEUMS
of a study that incorporates the public into the evaluation of policy initiatives is the study by
Jaffry and Apostolakis (2010). By evaluating visitors’ preferences for future managerial
initiatives at the British Museum and their willingness to contribute voluntarily for their
application, the authors want to gather more information on the respondent’s decision making
process as well as explain the heterogeneity of individual’s preferences by comparing them
with attitudinal and socio-demographic characteristics. Their main finding was that visitors
could be distinguished in core cultural visitors, who frequently drop by with a pure interest in
the art, and the occasional visitors who value the complementary aspects of their visit more.
Overall, the respondents preferred initiatives where economies of time emerge, e.g. by
bundling temporary and permanent exhibitions together. With their results they could advise
the museum management to aim at a more diversified policy of widening and deepening
participation.
2.4 Private support
Just like government support and funds from the market, individual support can take many
forms. It comprises the wealthy patron who donates money or art works from his or her
private collection. Indeed, some museums are even founded upon such donations, for example
Museum Boijmans Van Beuningen. It can also be the volunteer who contributes time and
effort for free and who has a strong internal motivation. Johnson (2003) even marks
volunteers as an important economic source for museums. This in turn asks for a decent
volunteer management because they form a strong loyal base to the institution. Private
foundations and lotteries can also be argued to fall under this third sphere because
transactions are more or less based on reciprocity, although they reap their funds mainly from
the market. Furthermore, the logic of these organizations overlaps the formal logic of the
government, as specific rules for the distribution of funds are followed. However, because the
focus here is on the goal of the funds, which differ in subtle manners from the goals in the
market and of the government sphere, the decision is made to share these funds under private
support. Only note that different logics work here, as a sharper distinction is beyond the scope
of this thesis. New and creative methods of financing also pop up in the third sphere, with the
phenomenon of crowdfunding as one successful example. The question that arises with these
new forms of funding is how they can strengthen and solidify museums compared to the more
traditional funding opportunities of the government and the market.
29
THE SPECIAL ECONOMICS OF ART MUSEUMS
Maecenases and private foundations
Remarkably, the literature on the private sphere is only to be found in Dutch, which is mainly
explained by its history as the prime author on this subject Renée Steenbergen (2010) argues.
Heritage in the Netherlands would for the largest part not have existed if it wasn’t for the
support of Maecenases and collective patronage. Around 1900, many collectors and defenders
of the arts appealed to their social responsibility and founded many museums and concert
halls which still exist to this day forward. Forced by cuts in subsidies and the booming prices
on the art market in the last decades, museums start to look for them again. And indeed, the
willingness to donate to cultural funds is on the up (see table 2.2 and figure 2.1), though a
mentality change on both the side of the arts organization and the patron is still required.
Table 2.2 Sources of donations (€ x million) to culture in the Netherlands 1995-2007
1995 1997 1999 2001 2003 2005 2007
Households 13 22 23 33 22 31 24
Legacies - - 1 6 11 2 7
Equity funds 13 16 25 22 35 125 82
Corporations 57 49 116 274 516 135 201
Lotteries n.a. n.a. n.a. n.a. 26 33 38
Total 83 87 165 335 610 326 352
Source: Geven in Nederland 2009
Figure 2.1 Sources of donations (in %) to culture in the Netherlands 1995-2007
30
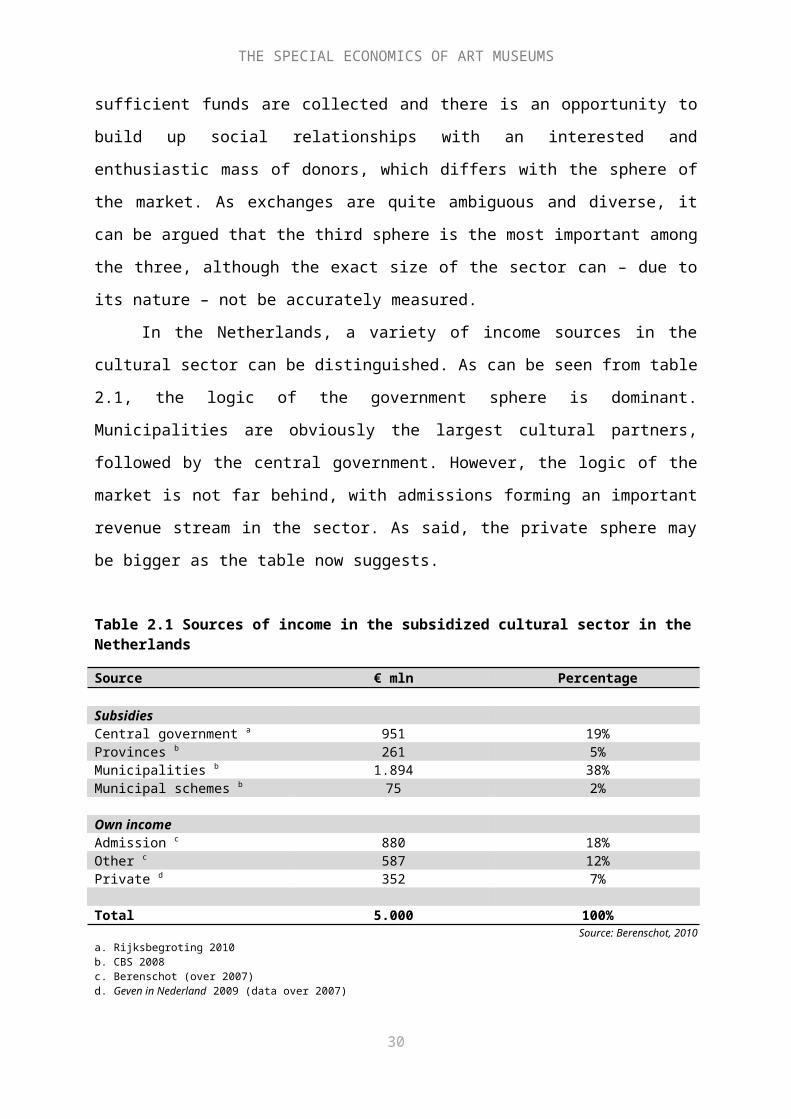
THE SPECIAL ECONOMICS OF ART MUSEUMS
1995 1997 1999 2001 2003 2005 2007
Households Legacies Funds Corporations LotteriesSource: Geven in Nederland 2009
The Netherlands and the U.S. are the only two countries in the world which collect data and
bi-annually report on the philanthropic behavior of their citizens. In the Netherlands, about
one percent of GDP is donated to good causes, which amounts to a total of 4,3 billion euros,
compared to two percent in the U.S., where a more favorable tax system exists. About one to
two percent goes to culture, which amounts to a mean donation to cultural causes and
institutions of € 31 per donor in 2007 (Schuyt, Gouwenberg & Bekkers, 2009). However, this
support can take various forms. Moreover, research on the volume, motives and capital of
potential givers is largely missing and therefore information on this topic is sketchy.
Patronage can be distinguished in both individual and collective giving and in the sort
of returned benefits. Individual support can either be in the form of gifts (the third sphere) or
in the form of loans and stocks where interest and dividends are expected over the short or
long run (the market sphere). Major individual donors are still the collectors of art
(Steenbergen, 2010). They feel committed to museums and are very willing to support them
either in-kind or with a financial contribution. Therefore, their support may be partly reflected
in legacies. Table 2.2 suggests only a slow rise in legacies, but it should be noticed here that
data is largely invisible, especially when it concerns legacies to museums. Furthermore,
equity funds are also growing in importance, though the amount is probably much bigger than
pointed out in table 2.2. This is because registration is not required and data is therefore only
sparsely available up to this point. Examples of equity funds in the Netherlands are the
31

THE SPECIAL ECONOMICS OF ART MUSEUMS
VSBfonds, Prins Bernard Cultuurfonds and the VandenEnde Foundation. The main motive
for setting up such a fund is the free decision the owner has over the allocation of equity
capital. A related form is the ‘fund on name’, which provides this same freedom but where the
large overhead costs are handed over to a separate body.
To stimulate individual giving, Steenbergen (2010) argues for a culture of asking
within museums. Professional fund-raising departments and transparency are strong
prerequisites for a trustful relationship with donors. Museum alliances can help form these
departments in a more efficient way by spreading the operation costs. Furthermore, recipients
should clearly show that they are graceful for the gift. This because patrons are personally
motivated by the thought that they give something back to society and thus perform an
exemplary function (Steenbergen, 2010).
The government can also stimulate private support to a great extent, with fiscal
incentives. In her research to the possibilities of these facilities in the arts and culture, Hemels
(2005) argues that the Netherlands already has many tax laws within the sector. These tax
reliefs are basically the same as direct subsidies to the arts, but without any transaction
between the tax-payer and the government. The government actually foregoes or postpones
tax incomes, which indirectly results in expenditures to the government. Hemels (2005) terms
them tax subsidies when they are “resulting from a facility aimed at an objective in the
cultural policy” (p. 19). She calculates that these measures are far more costly to the
government than direct subsidies, estimating them on € 809 million per year. However, these
expenditures are largely hidden because of bad coordination on and control over them by the
responsible departments. When applied right, however, the arts sector would create a larger
support base for their activities. A good and recent example of this is given by the Museum
Aan de Stroom7 in Antwerp, who finances part of its building expenditures with donations in
a favorable tax construction.
Collective giving comprises among others supporting foundations, Friends
organizations, societies and clubs. These forms enable people to donate directly to the
organization without any intermediaries and also have a greater impact on stakeholders like
the government. They can provide important social support, financial backing and feedback
on the organization in the form of expertise (Jongenelen, 2011). In return, they feel involved
and stimulated to promote the museum among their friends and relatives. Museums usually
provide potential donors with the opportunity to step in a certain circle, where they offer 7 Donors to MAS can literally help a hand. For a minimum gift of € 1.000, which is also tax-deductible through the Koning Boudewijnstichting, they can place a sculptured hand on the outside wall of the museum building.www.mas.be. Consulted 24 June 2011.
32
THE SPECIAL ECONOMICS OF ART MUSEUMS
different perks depending on the range of the donation. A recent trend in this is youth circles,
which mainly act as an incubator for new donors (Steenbergen, 2010).
More valuable to a cultural organization than money might be time. The economic
impact of volunteers on museums is likely to be large, but very invisible too. The opportunity
costs of their time are considerable, especially when taking into account the fact that they are
mostly highly-educated (Schuyt, Gouwenberg & Bekkers, 2009). Moreover, volunteers do not
only contribute their time to the organization, but also their expertise and feedback. They are
important peers for and recruiters of new members. Therefore, museum should make an
intense effort in investing money and time for securing this group for the organization.
One special form of a philanthropic foundation is the lottery, which main mission is to
collect money for good causes as arts and culture and to allocate it either directly to cultural
institutions or through intermediary funds. They are not new; DiMaggio (1982) for example
recollects that in the 1840’s the American Art Union hold a national lottery to sell off works
of art. A recent example is The National Lottery in the UK, which raises money for good
causes as the Heritage Lottery Fund, a non-departmental public body attached to the
Department of Culture, Media and Sport (www.national-lottery.co.uk). The main lottery in
the Netherlands for arts and culture is the BankGiro Lotterij, which comprises almost 10
percent of all funds to the sector (Steenbergen, 2010). These lotteries are likely to have an
important impact on arts funding in the future, because they are a popular market alternative
to subsidies. This is also a reason for skepticism, however, as the government can see a reason
here to freeze or reduce public funds to recipients. However, the literature on the effects of
cultural lotteries is very sparse.
A new phenomenon: crowdfunding
Now that the government is stimulating museums to be more self-sustainable, museums need
to look for support from different spheres. The traditional paths, finding Maecenases or
private funds and charging for their services, may not provide sufficient financial support for
the museum to reach its objectives. A new path is looked for. The internet has helped
museums to be more transparent for their visitors and to increase interaction with them.
Furthermore, the recent rise in popularity of social media opens up a great deal of
opportunities. One new and promising example of a financial instrument which fits this
current trend is crowdfunding (Bras, 2010).
Crowdfunding can be defined as “the act of informally generating and distributing
funds, usually online, by groups of people for specific social, personal, entertainment or other
33

THE SPECIAL ECONOMICS OF ART MUSEUMS
purposes”, or in other terms “people’s willingness to give financial support to someone [or
something] they believe in” (Spellman, 2008). Kappel (2009) distinguishes two forms of
crowdfunding: “ex post facto” crowdfunding, where the financial support is exchanged for a
completed product (similar to a market transaction), and “ex ante” crowdfunding, where funds
are given at the beginning of the process for a mutually desired result (more similar to the
third sphere). The defining characteristic of the latter form of funding is that it is a bottom-up
strategy, where demand determines supply instead of the other way round. Demand can also
be stimulated by attracting public or private parties who are willing to match the contributions
of the public (Mulder, 2011). As a business model, it made its first appearance in the
recording industry where it was received with enthusiasm by the media. Soon it found its way
to other branches in the cultural sector, including museums. Examples of crowdfunding in the
heritage field remain sparse, but it is applied successfully already in finding the remaining
funds for acquisitions, like the Louvre did for “The Three Graces” and the Rijksmuseum
Twente8 for a Gainsborough.
In a certain way, crowdfunding resembles the collecting of funds from taxes because
in both cases public goods are financed by contributions from the masses. The difference
however, is that crowdfunding is a non-required, rather altruistic form of funding.
Furthermore, it offers the possibility to build a loyal base of ‘fans’ who are feeling connected
to the project and invest time and money in it along the way. This resembles the Friends
organizations in a certain way, but without the prerequisite of being a (long-time) member and
thus more independent. Crowdfunding also differs in some important aspects from individual
donations. First of all, crowdfunding is usually concerned with one project or activity and
information on the progress is immediately exchanged with the donor. Crowdfunding is also
more accessible because even very small amounts are accepted. Furthermore, the Internet is a
strong and transparent platform for community-building and consequently provides many
opportunities for crowdfunding. One of them is that donors can remain anonymous while still
being given the opportunity to receive rewards in return.
Besides financial support, the crowd can also contribute by providing their expertise or
by acting as ambassadors, telling their friends and relatives about the project and why they are
so enthusiastic about it, adding a crucial social layer to the project. This can stimulate network
effects, accumulating in more publicity, more visitors and more financial support (Loos &
8 Rijksmuseum Twente in Enschede is the first Dutch museum to accomplish a fund-raising campaign with the help of crowdfunding. In 4 weeks, in total €59.980 was donated for the acquisition of “Boomachtig landschap met een rustende herder bij een zonnig pad en schapen” (ca. 1746) by Thomas Gainsborough (1727-1788). www.rijksmuseum.nl. Consulted 24 June 2011.
34

THE SPECIAL ECONOMICS OF ART MUSEUMS
Koren, 2011). The success of a project is mainly determined by whether a critical mass can be
reached, which makes crowdfunding into a “win or lose” game. In this aspect, crowdfunding
closely resembles ‘crowdsourcing’, where a job is outsourced “to an undefined, generally
large group of people in the form of an open call” (Spellman, 2008). Just like with
crowdsourcing, crowdfunding depends on a diverse mass of people with their own
preferences and attitudes, who jointly come up with the ‘best’ option; this concept is called
the ‘wisdom of crowds’ theory by Surowiecki (2004).
Crowdfunding is mainly praised for being a highly flexible model – due to direct
communication with patrons – while at the same time being an independent form of financing,
because donors put their faith in the organization and give them full responsibility over the
creation process. However, this does not mean that cultural organizations can lean backwards
and wait until the money comes in. It demands a lot of time and effort from the institution to
‘listen, learn and share’ (Loos & Koren, 2011). A fully incorporated social-media strategy is a
strong prerequisite for this (Bras, 2010). It is also important to know what the public expects
in return; money may not be the only motivation. Especially in the cultural sector, the desired
perks may not be tangible and difficult to measure. Investors are driven by the excitement of
being involved, the social esteem and relationships that come with it, and the knowledge they
can derive (Loos & Koren, 2011). A cultural organization should thus put considerable effort
and time in understanding and communicating these perks in order to reach a critical mass of
donors.
Crowdfunding thus has many advantages over more traditional methods of private
support. It is flexible, transparent and highly democratic. Over the years, many forms have
emerged, brought together on online platforms as Crowdfunder (www.crowdfunder.co.uk) or
Voordekunst (www.voordekunst.nl). Individual entrepreneurs, as well as large organizations
such as museums, have the opportunity to build a long-term relationship with a loyal base of
consumers. However, although there are enough ‘best practices’ out there for enthusiasm,
some caution is in place. Crowdfunding may not be a good alternative for structural support,
as it highly depends upon the question whether a critical mass of people can be reached. A
strong funding base can only be build if the organization lays more emphasis upon their
communication efforts.
2.5 Financing Museum Boijmans Van Beuningen
Museum Boijmans Van Beuningen has a diversified set of funds at its disposal. Just like other
public museums in the Netherlands, MBVB had to downsize their operations in the context of
35
THE SPECIAL ECONOMICS OF ART MUSEUMS
its privatization in 2005. Now, the museum collection and the building are still owned by the
Rotterdam municipality, but a separate foundation governs it. In this form, the foundation
may attract other funds besides the structural subsidies from the city council. Over the years
the museum was very successful in this, with almost 45% of their budget covered by funds
from third parties (in 2009). Table 2.3 and figure 2.3 shows the distribution of funds over the
period 2007-2010 (the data over 2010 is incomplete). Here, support from both the market as
from the third sphere is covered under the term of private support.
Table 2.3 Income sources Museum Boijmans Van Beuningen 2007-2009
2007 2008 2009Private supportOwn revenues € 2.352.000,00 € 2.891.000,00 € 2.590.000,00Funds € 1.449.000,00 € 966.000,00 € 3.582.000,00 Foundations € 439.000,00 € 449.000,00 € 584.000,00 Sponsors € 27.000,00 € 43.000,00 € 42.000,00 Legacies € 1.800.000,00 € 57.000,00 € 1.000,00 Lotteries € 500.000,00 € 500.000,00 € 500.000,00 Public supportStructural subsidies € 9.686.000,00 € 9.881.000,00 € 10.044.000,00 Other subsidies € 553.000,00 € 125.000,00 € 795.000,00 Total Income € 16.806.000,00 € 14.912.000,00 € 18.138.000,00
Source: Annual Report Museum Boijmans Van Beuningen 2009
Figure 2.3 Own income and public subsidies to Museum Boijmans Van Beuningen 2007-2010
36
THE SPECIAL ECONOMICS OF ART MUSEUMS
2007 2008 2009 2010* € -
€ 2,000,000.00
€ 4,000,000.00
€ 6,000,000.00
€ 8,000,000.00
€ 10,000,000.00
€ 12,000,000.00
Own income Public supportSource: Annual Report Museum Boijmans Van Beuningen 2009, 2010
*Annual Report Museum Boijmans Van Beuningen 2010; only shows revenues (€ 4.367.000) and structural subsidies (€ 10.038.000).
Public support
The museum was founded in 1849 under the name Museum Boymans, after the philanthropist
who donated his entire collection to the city of Rotterdam. From then on, the museum grew
steadily, acquiring more collections and hiring more personnel, eventually extending its name
to Museum Boijmans Van Beuningen. In the context of necessary cuts in the communal
budget, the municipality decided in 2005 to privatize several Rotterdam museums, including
MBVB. This meant that the control over the collection was laid in the hands of the museum
itself and that support now limited itself to a structural yearly subsidy based on a four-year
plan. Recently, the municipality is pressed to find a stable solution for the problems with the
museum depository, either in the form of a new collection building or a new, separate
depository. However, due to expected cuts, support for this project is highly uncertain.
Together with other subsidies received for special projects, the public support to the museum
is still high in relative terms and very stable (see figure 2.3), though signs exist for a decline
in the future.
Corporate support and own income
The exhibitions and educational programs of the museum are occasionally supported by
sponsors, like Unilever. The museum can especially count on local support, with almost fifty
37

THE SPECIAL ECONOMICS OF ART MUSEUMS
companies supporting the Foundation with a small fixed amount. Some Rotterdam
corporations even donate their services or resources, pressing some operation costs down. In
this way, a lot of money is circulating in the city and benefiting the community. MBVB
estimates that they generate 3 to 5 million euros in assignments to the city’s creative core
alone. A large proportion of the museums’ finances is generated by own revenues from the
cash register, the café, restaurant and the museum shop.
Private support
Together with sponsors, the museum manages gather a relatively high amount of private
money. However, table 2.3 and figure 2.3 also shows that this support is not quite as stable as
government support is. Funds and foundations constitute important private sources, but
fluctuate strongly because of their diversity and variability. The VSBfonds for example is
now a partner in education and supports projects as ArtTube, but only for a three-year period.
Foundations as the Rembrandt Association and partner foundations chip in occasionally with
acquisitions. The partner foundations also contribute to the museum’s vital tasks. The
museum foundation also owns donated artworks by private entities who did not wish to see
the municipality own it and has the legal right over acquisitions made through a number of
partner foundations and funds on name. Recently, the museum has added a new giving circle,
the ‘Young Successful Associates’, which aims to attract a new wealthy generation as is
consistent with the new trend in the museum sector
In line with the museum’s history, donations, bequests and grants are also welcomed
by the museum. A main example is the Maecenas Han Nefkens, which is engaged in an
exclusive partnership called the H+F Patronage. Between 2005 and 2010 this patron enclosed
€ 700.000 to the museum. Furthermore, the museum is also supported as a long-term
beneficiary by a lottery, the BankGiro Loterij, which donates € 500.000 per year for the
preservation and expansion of the permanent collection. Thanks to these private sources, the
museum can cover the costs of their activities.
2.6 The problem statement
In a day and age where government support comes to a halt, it is important to know whether
there is any social support base to cover the gap that is bound to arise. The two chapters in
this theoretical framework have explored the opportunities of three main stakeholders of
museums: governments, corporations and the audience. Though the arts sector can still largely
38
THE SPECIAL ECONOMICS OF ART MUSEUMS
rely on corporate support when the government steps back, this form can be demanding too as
well as very dependent on macro-economic cycles. Therefore, it is valid to study the support
base among the audience as an alternative for subsidies. For museums this means that they
need to exploit the opportunities of the market, taking a closer look to the product they have
on offer. This thesis will study the following problem statement, which is twofold:
Is there a willingness to pay among the visitors to Museum Boijmans Van Beuningen in
Rotterdam to contribute yearly to a special fund to finance the museum’s exhibitions, and
which factors influence their decision?
The choice of the case study has fallen on Museum Boijmans Van Beuningen in Rotterdam,
an art-historical and contemporary museum the researcher is well-known with. The museum
resembles the superstar museum as defined by Frey (1998). Over the last years the museum
has reached many visitors from around the world, which coincide with its ambition to be a
museum with international stature. The building has a unique architecture, as well in its recent
annexes. Furthermore, the museum governs a shop, a café and a restaurant and receives much
local support from businesses and the municipality, which reflects its local impact on the
economy. In relation with the research question, the museum is relevant in the sense that it is
likely that the current project subsidies to activities like exhibitions will be reduced. These
exhibitions cover a wide range of styles from historic to contemporary, which are also
frequently mentioned in the media. Therefore, its exhibitions appeal to a wide and diverse
range of visitors, who may have build up certain goodwill towards the museum due to the
quality and quantity of the exhibitions they experience there.
The problem statement is two-fold because the latter question may explain how the
support base is composed and consequently how it may be fortified. This has both scientific
as social relevance. From the museum perspective, the managers may want to know who they
have to approach and how they can have an influence on the support decision of their visitors.
Whether the findings in this research are relevant for the arts and cultural sector in general is
dubious, but at the end of this thesis, an attempt will be made.
39

METHODOLOGY AND VALUATION METHODS
III. Methodology and valuation methods
IntroductionThe purpose of this quantitative research is to conduct a cross-sectional Contingent Valuation
(CV) survey to a selected sample of visitors to Museum Boijmans Van Beuningen in
Rotterdam and elicit their willingness-to-pay (WTP) for an exhibition fund. Furthermore, the
survey will pose questions concerning the determinants of the WTP. In this methodological
framework, the concept of CV will be explained – a popular method among cultural
economists nowadays – as well as the problems that arise from its application. Then the more
practical issues will be handled, as the design of the questionnaire – a contentious task – and
the actual data collection. In these last two sections, the issues that arose during the research
will be elaborated.
3. Defining the valuation methodSome cultural goods and services can’t express their value on the market because they are
non-excludable (open access for everybody) and non-rival (the consumption of one doesn’t
reduce the consumption of others). These characteristics make it hard for the market to make
a profit on the supply. Production is then only possible with collective action, because their
values accrue to society at large. Economists call these goods ‘public goods’ or ‘common
goods’. However, some public goods can be made excludable, which means that a price can
be set for some parts. Goods that exhibit both public and private attributes are cited as ‘mixed
goods’. Museums are commonly referred to as mixed goods, because they accrue benefits to
both the community and to consumers (Noonan, 2002). This means that two different
demands can be measured: the use-value of actual visitors and the non-use value of
conservation expressed by non-visitors (Cuccia & Signorello, 2002).
The use-value of a good can be defined as the pecuniary externality that accrues from
its use, both now and in the future. Where use-value is easily found in the market, usually
reflected in price, the non-use value of a good is harder to measure. This is the value
connected with existence or intrinsic values. Appreciation of these values, like aesthetic and
artistic value, is restricted to a select group of experts, who possess specialized knowledge on
the subject. Expert decisions may therefore be more appropriate in cultural policies, but they
40
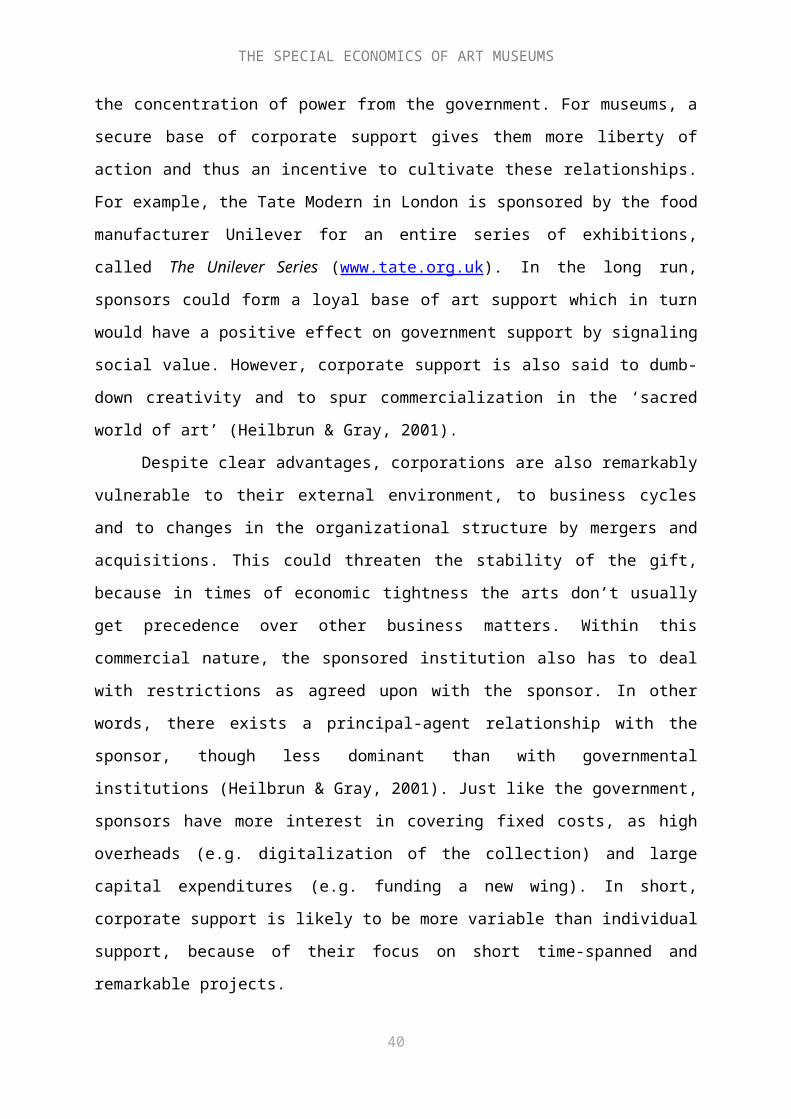
METHODOLOGY AND VALUATION METHODS
may not represent the decisions and motivations of society at large. For example, they might
want to maximize the conservation instead of the enjoyment of cultural heritage (Cuccia,
2003). If, however, individuals could have a say in the appreciation of these values, other
priorities could be taken into account in the decision process of policy makers. This asks for
appropriate methods for measuring non-use values, so that society can sufficiently express its
demand in monetary terms (see Table 1).
Table 3.1 Valuation methods for cultural goods
Direct Indirect
Revealed preference methods ReferendaSimulated marketsParallel private markets
Hedonic price analysisTravel cost methods
Stated preference methods Contingent Valuation method Conjoint analysis (contingent ranking)
Source: Cuccia & Signorello (2002)
The choice of a method depends on the value components one wants to measure. The revealed
preference methods, for example, look at the expression of values in the market (Cuccia &
Signorello, 2002). Examples of direct methods are the referendum, where citizens can exhibit
a democratic choice, or setting up an experimental market where individuals can trade a
specific good. A real-life experiment would be to apply an admission fee in a museum to
estimate the value of free access. This could also be studied by comparing the value of a free
museum with a museum who already applies an admission fee, which is the parallel private
market approach. However, these methods are not widely applied in the cultural field, because
they demand goods which are reasonably excludable. The methods which did find extensive
application in the arts world are the indirect revealed preference methods, such as the hedonic
pricing method and the travel cost method. The hedonic pricing (HP) method estimates
demand by looking at a set of characteristics and their separate prices, comparable to what
happens in the housing market. The travel cost method on the other hand, estimates the
demand curve as a function of the distance covered by visitors. In recent years, this method is
actually becoming more popular (Snowball, 2007).
The main advantage of the stated preference methods, contrary to the revealed
preference methods, is that they allow for estimating all values, including non-use values.
They comprise the indirect methods such as conjoint analysis – where one chooses between
bundles of attributes – and the more famous contingent valuation method of the direct
41

METHODOLOGY AND VALUATION METHODS
methods. Though the conjoint valuation methods are considered an evolution of contingent
valuation – as it closely resembles the real market and therefore gives more information on
WTP (Cuccia & Signorello, 2002: 130) – CV is still preferred among cultural economists.
Contingent valuation can be explained as the “method of estimating the value that individuals
attribute to non-tradable goods not revealed by the market mechanism” (Cuccia, 2003: 119).
More specific is the definition by Snowball (2007: 77): “Contingent Valuation surveys ask
people directly what their willingness to pay or accept is for the preservation or expansion of
art and cultural goods in hypothetical scenarios”. It thus asks people for their willingness-to-
pay (WTP) or willingness-to-accept (WTA) incremental changes in quality and/or quantity of
a non-marketed good. From this information, a demand-curve and consumer surplus of the
population can be estimated.
Compared with the application of CV on environmental goods, the volume of
literature on cultural goods is rather small, though steadily growing (Noonan, 2002, 2003;
Cuccia & Signorello, 2002; Cuccia, 2003; Snowball, 2007). Noonan (2002) compiled a
bibliography of studies in the field of arts and culture, which is already outdated at this point.
Table 3.2 gives his overview of CV studies in museums, updated with more recent articles.
Due to the difference in the measured benefits, as well as different locations (Switzerland,
Canada, Italy, Finland, UK, Spain and Belgium) and currencies, the studies can’t be compared
with each other. This is the problem with all CV research. Nevertheless, Cuccia (2003)
noticed some overlapping observations herein: WTP is always significantly positive; the
studies show a large volume of protest (zero) bids and the geographical location of the studies
clearly are of relevance. Some studies clarify the role of voluntary contributions in
constructing an appropriate pricing policy. In a study by Willis (1994) for example, a system
with voluntary contributions and one with compulsory payments seemed to generate equal
revenues, where a study by Santagata and Signorello (2000) attest that voluntary contributions
are greater than with admissions prices.
42

METHODOLOGY AND VALUATION METHODS
Table 3.2 Contingent valuation studies on museums with mean WTP and survey size
Year Specific good Authors WTP Survey (N)
1989 Purchase two Picasso paintings by Swiss city Frey & Pommerehne
53,9% yes -
1994 All Quebec museums Martin Can. 8 908
1998 Italian museums Bravi & Scarpa US$ 28-33 1323/ 854
1998 Central Finland Museum Tohmo FIM 103 (WTA)
800
2001 Congestion in the British Museum Maddison & Foster £ 6 400
2001 Services in Galleria Borghese in Rome Mazzanti It. Lira 6000 185
2003 National Museum of Sculpture in Valladolid, Spain
Sanz, Herrero & Bedate
€ 25 - 30*€ 27 - 36**
811 *776**
2007 Congestion in Rubenshuis Museum Salazar Borda € 1,33 200
2010 Individual preferences British Museum Jaffry & Apostolakis £ 2,60*** 500
Source: Noonan (2002), own additions
* Estimation direct use value among visitors (conservative scenario) ** Estimation indirect use value potential users*** Willingness to contribute for 5 temporary exhibitions per year
3.1 Problems with CV
Though Contingent Valuation is a popular method among cultural economists, the literature
on the subject is also heavily contested among them. Under its apparently simple premise,
there are many problems that affect the validity and reliability of results. The controversy in
the CV debate rests on both empirical or technical and theoretical issues, whose fundamentals
will be explained below.
Empirical issues
First of all, the researcher must decide whether to elicit WTP or WTA. The prospect theory by
Kahnemann and Tversky (1979, in Cuccia & Signorello, 2002) learns that losses are weighed
heavier than gains, resulting in far greater WTA (the amount of money people will accept as a
compensation for the loss of an item) than WTP. This is especially the case in relation with
unique objects, such as the Eifel tower or the Louvre museum, where WTA will be endless
and WTP will be up to the individual’s budget constraint. In other words, the less (close)
43

METHODOLOGY AND VALUATION METHODS
substitutes for a good, the greater the difference between WTA and WTP. This is determined
by the endowment effect (the aversion of loss), a behavioral anomaly which is inconsistent
with economic theory. This makes it harder to construct reliable survey designs, as
respondents apparently do not act rational. Nevertheless, many commentators argue that it is
best to elicit WTP instead of WTA, because the latter is more likely to be infinite and thus
impossible to incorporate in the data analysis.
A second point of critique concerns the description of the scenario, which has to
resemble a market that is familiar to the respondent. This also includes the type of question
posed to the respondent and the choice of the payment vehicle, i.e. the way in which a
respondent can make a hypothetical payment. Options include open-ended questions (see for
an example Bille Hansen, 1997), payment cards, multiple choice, single-bounded or double-
bounded dichotomous choice formats. The latter format is advised and applied by many
researchers, because it elicits democratic voices which best resembles the market (Cuccia &
Signorello, 2002). It basically asks respondents to answer yes or no to a certain bid, which is
followed up by a second bid that follows the former answer, which allows for three intervals
of WTP and provides more certainty on the answer. Downside of the method is that a
relatively large sample is needed. The choice of the population matters too and depends on the
nature and location of the cultural asset under research.
These three critical points (description of the market, the choice for the WTP-eliciting
technique and sample selection) highly affect the validity of the CV method, not in the least
due to the problems in constructing plausible CV markets. Because of that, Sunstein (2002)
argues that WTP responses are no valid monetary expressions of utility, because no rational
decisions are made. Epstein (2003) follows this argument by saying that value, even for
private goods, is not well defined because people tend to attach different subjective values to
a good. In combination with the possibility that some people may value the good in question
in fact negatively – an option usually not considered in CV – an aggregation of these values
will not reflect the true preferences of society. Even the most fervent proponents of the
method recognize these sincere limitations of CV, but it is nevertheless the only method that
can measure the total value of a certain cultural good (Bille Hansen, 1997).
Further research on the empirical aspects of CV should focus on improving the
validity, reliability and reproducibility of results (Cuccia and Signorello, 2002). Some points
for development are given by Cuccia (2003). She for example, propagates the use of meta-
analysis – like the study of Noonan (2003) on cultural goods – which may point out general
patterns and variations in results and the degree in which this is attributable to the chosen
44
METHODOLOGY AND VALUATION METHODS
method. She also recommends the use of indirect stated preference methods, as the relatively
new contingent choice method (see for example the study of Jaffry & Apostolakis, 2010).
Theoretical issues
Though the CV method has clear theoretical grounds – as it is able to uncover existence,
option and other non-use values in public goods and is highly flexible – it can also be turned
down on the basis of this theory. The theoretical debate revolves around two main criticisms:
the strategic behavior of respondents and the inconsistency of WTP with economic theory
(Cuccia, 2003).
Strategic behavior is reflected in the tendency among respondents to overestimate their
WTP, because they act in a hypothetical market where the stated amount doesn’t need to be
paid in reality. This is called hypothetical bias, which is nothing more than the difference
between hypothetical and real willingness-to-pay. People overstate their true value just to
ensure that the good is provided, knowing that costs will be spread among the population,
which is called ‘free riding’. Furthermore, respondents may have a positive attitude towards
the good, causing them to make an unrealistic market decision without taking their budgets
into account. This shows the large interrelatedness of theoretical and empirical issues in CV.
Critics claim that (part of) the hypothetical bias can be taken away by “cheap talk”
questionnaire designs, where respondents are made aware of its existence. Next to the
importance of the design of the questionnaire, the (prior) knowledge of the respondent on the
subject is crucial for controlling the bias (Snowball, 2007).
Besides showing strategic behavior, respondents also tend to answer in ways which are
not consistent with theory. For one, they are insensitive to the scope or amount of the good
under discussion. Usually, more is better and WTP is expected to grow equally. However,
studies have shown that the WTP for more of the good is only slightly more on the margin.
This is among others explained by the positive attitude of respondents towards the good,
called the ‘warm glow’ hypothesis. In turn, defenders of the method argue that these studies
have faulty survey and/or method designs and counteract the bias with studies that do show
scope sensitivity. According to Snowball (2007), there is a general consensus now that the
latter argument is indeed the main reason behind this bias.
Another theoretical issue is the mixed good bias, which means that in the analysis of a
mixed good (as a museum) public and private characteristics should be separated from each
other. This is because users attach more value to the private parts of the good than non-users,
misrepresenting the preferences for the good. In other words, users systematically overstate
45
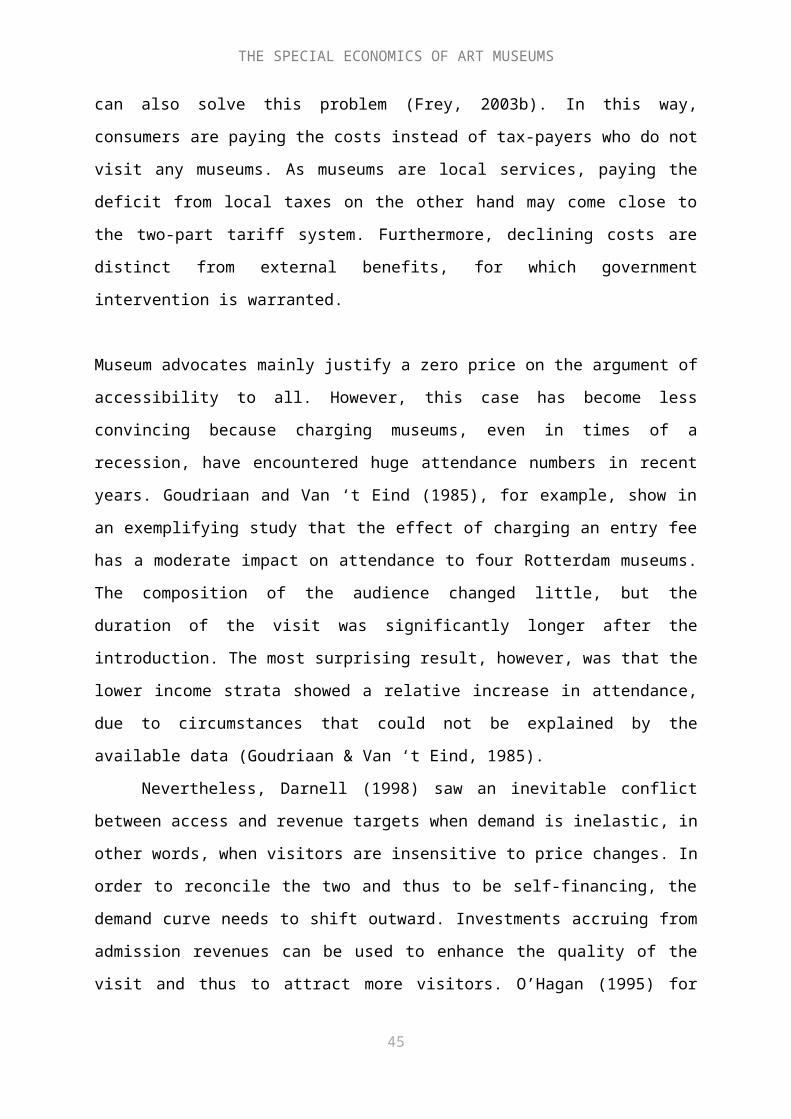
METHODOLOGY AND VALUATION METHODS
their WTP in order to ensure subsidies with the costs spread over the population, which also
include the non-users (Snowball, 2007). This argument was first put forward by Throsby, who
in a later article suggested that there might even be areas, especially cultural, where WTP
would not capture all values of the good (Throsby, 2003). He argues that individually stated
WTP might not capture the societal values of cultural goods, which can only be identified in a
group. Therefore, the CV study might capture some economic value, but as the social values
are not easily expressed in monetary terms, the study will most likely undervalue the good.
There are many other theoretical questions which are raised concerning CV. Examples
of these questions are: ‘How stable are preferences over time?’ suggesting a learning-curve
for experience goods and ‘How much does WTP vary with factors as income?’. Especially in
the area of cultural goods, critics like Sunstein (2002) doubt whether CV studies can produce
coherent valuation estimates, because a category of goods is only considered in isolation.
Though these questions and criticisms make the CV method rather doubtful, it also gives
incentives for the need for further research. For example, when individual WTP is indeed
unreliable or not exact, why not taking experts’ opinions into account too? This will only help
in a limited way, but it provides policy makers with more signals when adopting CV results
(Cuccia, 2003). Furthermore, as many behavioral anomalies seem to exist in WTP studies,
researchers can beneficially contribute to research by looking into the psychology and
motivations of respondents and their respective context.
3.2 Survey design
The design of a questionnaire is a precarious task in CV research. Due to the sensitivity of the
questions it demands careful thought. The description of the scenario, the type of WTP
questions and the payment vehicle should certainly be considered, because studies show that
they mainly determine the validity and reliability of the results. One has to consider how
much information is disseminated in the scenario, i.e. how many, if any, facts and figures?
Furthermore, how should the WTP question be posed? Respondents should be made aware of
their budget constraint. Also, earlier studies point out that the payment vehicle may elicit
protests. Cuccia and Signorello (2002) therefore suggest asking these protest (zero) bidders
for the main reason behind their behavior. One final remark is in place here. Although the
conscious decision has been made to answer the problem statement with the help of a
contingent valuation study, it is still questionable whether willingness-to-pay is the correct
measurement of contributions to an exhibition fund. Where willingness-to-pay tries to reflect
the market of supply and demand, contributions implies a third sphere logic, where not price,
46

METHODOLOGY AND VALUATION METHODS
but a feeling of social responsibility is a determining factor. Because visitors have not learned
the true price of preserving museum services as the funding structure of museums have
historically relied on subsidies, willingness-to-pay might show disappointing results in this
study (Klamer & Zuidhof, 1998).
Because nobody should reinvent the wheel, it is convenient to use previous CV studies
and base part of the questions on their questionnaires. Therefore, examples were requested
from Alexandros Apostolakis (2010), Tiziana Cuccia (2002; 2003), Giavanni Signorello
(2000; 2002) and José Ángel Sanz (2003). Eventually two of them responded and were so
kind to send a copy of their surveys. The final version is based on the studies of Thompson et
al. (1998; 2002), Sanz, Herrero and Bedate (2003), Salazar Borda (2007), Sahin (2010) and
Jaffry and Apostolakis (2010), and adjusted to the purpose of this research. Questions are
separated in three modules, the first aiming to elicit answers on visiting patterns to cultural
activities in general and the museum in particular, the second module contains the scenario
and WTP questions and the third are the standard socio-economic questions with room for
remarks on the survey and on the topic. The scenario is kept short, simple and to the point, in
order to clearly communicate the main problem and the proposed solution. The WTP question
is a double-bounded dichotomous choice question followed by an open question based on the
survey of Sanz, Herrero and Bedate (2003). Furthermore, respondents are asked whether and
what kind of compensation they desire in case of a donation and whether they already
contribute in any other way. The choice has also been made to construct a Dutch version of
the survey only, which automatically excludes the possibility of foreign tourists.
As no draft is perfect, the survey should be put to the test. For CV studies, authors
suggest to make use of peer-reviewing. Also pilot surveys can work out. Because of limited
resources and time, the survey was tested several times by family and friends. During the data
collection, problems faced by respondents could be communicated both verbally to the
researcher and written on the questionnaire. In this way, the obstacles which might affect the
reliability and validity of the research can be pointed out. Because of the construction of the
WTP scenario, where only visitors are approached, the usual incentive for users of a good in
question to overstate their willingness-to-pay is consequently very modest here. Respondents
are thus unlikely to show strategic behavior in this way, but there is a possibility that
respondents have made an overstated their amount because of a lack of information. For
example, in the survey, people were not explicitly made aware of their budget constraint.
Furthermore, because it handles on just one single issue, exhibitions in Museum Boijmans
Van Beuningen, respondents may be insensitive to scope, i.e. forget the possibility that they
47

METHODOLOGY AND VALUATION METHODS
can support more museums or other cultural attractions with their stated amount. The final
survey can be found in the appendix.
3.3 Data collection
It was feasible for this research to conduct a self-completion questionnaire on location, where
the researcher can have immediate face-to-face contact with the respondents. Respondents
were approached on their way to the exit and sampled in a haphazard manner, taking roughly
every fifth visitor out and ask them whether they want to cooperate. The aim was to pick out
visitors of 18 years and older, i.e. those who are financially independent. Because this is not a
statistically random sample and self-selection of the respondents themselves is inevitable
here, the external validity of the sample is limited to a certain extent (Bryman, 2008). The
survey was carried out over one week, from Tuesday, May 10th to Sunday, May 15th (on
Mondays the museum is closed) between 12:00 and 16:00. The date, day and time of
approach to every individual respondent were noted. Extra emphasis was laid upon the
independence of the research from the museum, in order to avoid complaints concerning the
survey. Also, it was made clear to the respondents that answers are confidential and that they
remain anonymous, as well as that the proposed scenario is hypothetical only.
Despite the intimidating nature of surveying on location and the sensitivity of some of
the questions, the willingness to participate among visitors was surprisingly large. At the end
of the week, 105 filled-in questionnaires were collected, a good result considering that two
prime exhibitions were closed that week, sealing off two important galleries, which made for
a slow week. However, a firm figure of the response rate can’t be given, as the number of ‘no’
answers weren’t written down. Reasons for refusing participation were among others time
pressures, social obligations, or unwillingness to say something about the current exhibitions.
Especially a controversial exhibition revolving around an actual Peanut Butter Platform by
Wim T. Schippers yielded some vocal refusals. Furthermore, there are some item non-
responses, which should be considered in the data analysis.
48

RESULTS
IV. Results
Introduction The CV survey yielded a satisfying result of 105 individual cases. Due to some item non-
response, the data-analysis in the following two chapters will be somewhat smaller from time
to time. Chapter 4 will look into the specific visitors’ profile of Museum Boijmans Van
Beuningen, which will make clear how the respondents of the survey can be characterized.
Following that, chapter 5 will answer the research questions posed in this thesis, clarifying
whether there is a support base among visitors of Museum Boijmans Van Beuningen and how
this will look like.
4. Visitors’ profilePersonalia
Visitors to Museum Boijmans Van Beuningen are predominantly women, which corresponds
to findings from earlier research. This overrepresentation may differ between types of
museums. Ranshuysen (1998) for example shows that women are slightly more active in
visiting art museums. The ratio between men and women (44% and 56% respectively) visiting
MBVB is modest. Furthermore, questionnaires were sometimes filled in by couples, where
mostly women took the lead in answering the questions. This may skew results. Therefore,
this result was compared with the results from MBVB itself, which shows a 40%-60% ratio
(Museum Boijmans Van Beuningen, 2010). Own results thus come reasonably close to
reality.
The median age of the visitors (out of 102 valid responses) lies around 50 years, with a
standard deviation of 17,8 years, which points to a broad distribution. Half of the respondents
is older than 53,5 years old and the largest percentage (26,5%) falls within the 55-64 age
category (See figure 4.1). It is thus safe to conclude that most of the respondents are in an
older life phase. This also corresponds with the information from the 2010 year report of
MBVB, where almost one third of the visitors are between 56 and 65 years old. It also states
that with fourteen percent of the visitors being between 18 and 30 year old, the museum
attracts a relatively young public. Own data suggests that 14,7 percent is younger than 25
years with almost a quarter being between 15 and 35 years old, which is an overlap in data
49
RESULTS
again. This is also consistent with national trends, as 10% of the Dutch museum public is
younger than 26 years of age (Ranshuysen, 2009).
Figure 4.1 Visitors according to age categories
15-24 25-34 35-44 45-54 55-64 65-74 75>0
5
10
15
20
25
30
Age categories
Perc
enta
ge
Next to age and gender, another important question is the respondent’s place of residence. As
a museum with both local as national stature, results should show wide dispersion. Out of 101
responses, almost half of the respondents come from the province of Zuid-Holland, with 22,8
percent from Rotterdam alone. Noord-Holland is second in order of interest, with 6,7 percent
coming from Amsterdam. Figure 4.2 shows that the more eastern and northern parts of the
Netherlands are (logically) underrepresented (with the province of Groningen completely
missing). The 2 percent other represents respondents from the Netherlands Antilles.
50

RESULTS
Figure 4.2 Visitors according to place of residence
22.8%
26.7%
11.9%
5.0%
7.9%
9.9%
8.9%
1.0% 1.0%2.0%1.0%2.0% Rotterdam area
Zuid-Holland (excl. Rotterdam region)
Noordholland
Zeeland
Utrecht
Noord-Brabant
Gelderland
Overijssel
Flevoland
Limburg
Friesland
other
Museum visitors are typically a highly educated public. Also in this sample, results show high
education levels: 81,3 percent of respondents have completed or are following higher
vocational or academic education (in the Netherlands: HBO and WO respectively), with
another 8,8 percent graduated or completing higher secondary education (HAVO and VWO).
The 102 respondents that answered this question are likely to resemble education levels of the
wider population of visitors to MBVB.
This highly educated sample also gives some clues to respondent’s income levels. As
it is a sensitive question, categories of income were purposely presented with a difference of
1.000 euros, which delivered a response of 90. First, the median income lies within the 2.001
and 3.000 euros category. In percentages however, the 0-1.000 euros category was ‘ticked’ by
a majority of 27,8 percent of the respondents, with only 20 percent for the median category.
Compared to the average income of Dutch residents, which is a monthly gross income of
€2.507,72 euros in 2010 (www.loonwijzer.nl), slightly more than half of the respondents has a
less than average income. This means that only 34,4 percent (including the categories 3.001-
4.000; 4.001-5.000, 5.001-6.000 and more than 6.000) earns more than average, which is
quite surprising considering the education levels previously revealed. However, looking at the
age categories, this inconsistency can largely be explained by the relatively large
51
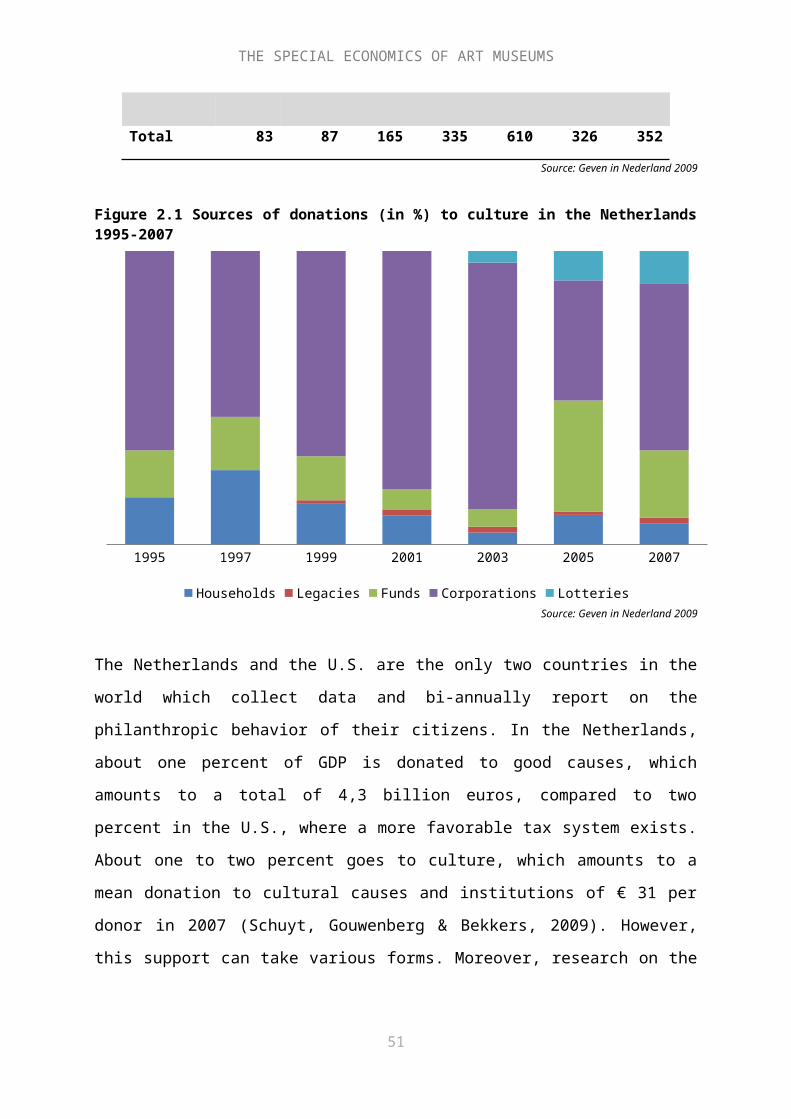
RESULTS
representation of younger generations, most likely students who are not earning any real
money on the moment. Table 4.1 gives an overview of the income categories and the
represented frequencies and percentages.
Table 4.1 Monthly gross incomes of visitorsFrequency Percent Valid Percent Cumulative
PercentValid 0-1.000 EUR 25 23,8 27,8 27,8
1.001-2.000 EUR 16 15,2 17,8 45,62.001-3.000 EUR 18 17,1 20,0 65,63.001-4.000 EUR 13 12,4 14,4 80,04.001-5.000 EUR 7 6,7 7,8 87,85.001-6.000 EUR 3 2,9 3,3 91,1more than 6.000 EUR 8 7,6 8,9 100,0Total 90 85,7 100,0
Missing System 15 14,3Total 105 100,0
Largely related to these income levels are the persons in the respondent’s household. This can
say much about the spending power of the visitor, as larger households would face more
financial constraints when visiting an art museum as MBVB. Quite a large portion of
respondents come from a two-person household (around 41,2 percent) with a third coming
from a single household (see table 4.2). They are likely to be overrepresented here, as visitors
with too many companions in their party or kids to take care off are less likely to accept a
time-consuming questionnaire. On the other hand, however, single and partner households
may also have more time and money on their hands.
Table 4.2 Number of persons in the household of visitorsFrequency Percent Valid Percent Cumulative
PercentValid 1 person 34 32,4 33,3 33,3
2 persons 42 40,0 41,2 74,53 persons 9 8,6 8,8 83,34 persons 10 9,5 9,8 93,15 or more persons 7 6,7 6,9 100,0Total 102 97,1 100,0
Missing System 3 2,9Total 105 100,0
52
RESULTS
Cultural preferences
How culturally sophisticated are the respondents? In other words, do they visit cultural
activities and how frequently? To discover more about their cultural consumption habits,
questions were posed about their frequency of visits to theater, ballet, music performances,
cabaret, cinema, festivals, heritage and museum exhibitions per year. Results can be checked
in table 4.3 (N=103).
Table 4.3 Number of visits per year to cultural activities
Frequency
Percent
Theater 0 35 34,01 29 28,22-3 26 25,24-5 5 4,9more than 5 times 8 7,8
Ballet 0 68 66,01 28 27,22-3 6 5,84-5 1 1,0more than 5 times 0 0,0
Music 0 19 18,41 24 23,32-3 27 26,24-5 12 11,7more than 5 times 21 20,4
Cabaret 0 56 54,41 24 23,32-3 17 16,54-5 3 2,9more than 5 times 3 2,9
Cinema 0 19 18,41 11 10,72-3 18 17,54-5 21 20,4more than 5 times 34 33,0
Festivals 0 47 45,61 23 22,32-3 23 22,34-5 5 4,9more than 5 times 5 4,9
Heritage 0 19 18,41 19 18,42-3 25 24,34-5 16 15,5
53
RESULTS
more than 5 times 24 23,3Exhibitions
0 2 1,9
1 4 3,92-3 24 23,34-5 20 19,4more than 5 times 53 51,5
As can be distracted from the table, visitors are predominantly visiting the cinema, heritage
and music performances, but above all else, museum exhibitions. More than half of the
respondents answered that they visited exhibitions more than 5 times a year, which shows that
respondents have a lot of experience with museums. The clear absence of interest for ballet
performances shows that respondents have a (very) small affinity with this high art form.
Furthermore, there is only a minor interest in cabaret and festivals, a predominantly younger
generation activity, which reflects the high age of the sample again.
With the respondents’ affinity with culture revealed, it is interesting to see whether
this interest motivates them to contribute to independent cultural organizations. This may
show whether there is a willing support base among the wider pubic for art. Asking
respondents whether they made a voluntary contribution to a cultural organization in the last
year, simply answered by ticking a yes or no box, resulted in a ratio of 55,6% no’s against
44,4% yes’s. Though a majority said not to have contributed, a rather large percentage
indicates they have. However, this also begs the question whether there was no
misunderstanding here. For example, people who contribute to a good cause, which among
other also contributes to the arts, may think this counts as a cultural organization too.
Last but not least, memberships may also indicate cultural preferences. In the
Netherlands, the Museumvereniging, an umbrella organization for museums, ‘sponsor’ their
members with money coming from a special museum year card (‘Museumjaarkaart’), which
gives its holder free or reduced entry to member organizations. In Rotterdam, a similar card
exists for recreation and cultural activities placed in the city, the ‘Rotterdampas’. To see
whether respondents are a member of such initiatives, a multiple-choice question was posed.
Figure 4.3 gives an overview of memberships among visitors (N=120). More than half of the
respondents indicate they own a ‘Museumjaarkaart’, 8,3 percent owns a ‘Rotterdampas’ (both
cards give them free access to MBVB) and 5 percent owns a ‘CJP-pas’, a card especially for
young adults under 30 years of age giving them reduction to all kinds of cultural activities.
These memberships may also skew the statistics concerning voluntary contributions to
54

RESULTS
cultural organizations as stated above. A relatively large percentage indicates they aren’t a
member of anything listed.
Figure 4.3 Memberships of visitors
5.0%
56.7%8.3%
4.2%
3.3%
5.0%
17,5%
CJP
Museumjaarkaart
Rotterdampas
Other organisations
Friend museum
Friend other museum
None of the above
Museum visit
Every museum has a loyal base of visitors, but also attracts one-time ‘tourists’. In order to
discover the distribution in Museum Boijmans Van Beuningen, the survey asks how many
times one has visited the museum before in the last two years. Results are shown in table 4.4.
Only 20,4 percent is a first-time visitor to MBVB, where the largest proportion has visited the
museum 1 or 2 times before. A relatively big percentage (16,5%) of visitors can be counted to
a loyal base of very frequent visitors, as they visited the museum more than 6 times in the last
two years. Almost four fifth of the sample are frequent visitors, making them familiar with
MBVB.
Table 4.4 Number of visits to museum in the last two yearsFrequency Percent Valid Percent Cumulative
PercentValid first time 21 20,0 20,4 20,4
not in last two years, but visited before
7 6,7 6,8 27,2
1-2 times 33 31,4 32,0 59,23-4 times 21 20,0 20,4 79,65-6 times 4 3,8 3,9 83,5more than 6 times 17 16,2 16,5 100,0Total 103 98,1 100,0
55
RESULTS
Missing System 2 1,9Total 105 100,0
These visitors are not always going alone. Respondents were asked to indicate the number of
their party, excluding themselves. On average, respondents went with 2,49 persons. This
average however, is somewhat dispersed as large groups also visit the museum, as the large
standard deviation (6,76) proves. A respondent coming with a group of 55 persons is very
likely to skew results. It is therefore safer to say that most of the respondents went with one
other person. Around ninety percent of the respondents went with a small group with a
maximum of 4 persons.
How much time to these visitors spend in the museum once inside? This question was
asked in the form of an open question. Figure 4.4 illustrates the distribution of time spend,
with a peak around 2 hours and a maximum of 300 minutes (N=102). On average, visitors
spend 115 minutes in MBVB.
Figure 4.4 Duration visit in minutes
15 20 30 45 50 55 60 70 90 100 105 110 120 140 150 180 190 200 230 240 3000
5
10
15
20
25
30
Minutes
Freq
uenc
y
What is their main reason to stay that long in the museum? Not all visitors are coming for a
specific exhibition, or even for the permanent collection. In recent years, a nice museum café
56

RESULTS
or shop has gained in importance in the museum experience. Therefore, respondents were
explicitly asked what the main reason was behind their visit, listing each exhibition
separately, as well as other possibilities. From table 4.5 it is quickly uncovered that one
exhibition in particular attracted the most visitors in the first place, namely the exhibition
‘Beauty in Science’. This special exhibition, curated by an external professor, focuses on the
aesthetics in science. The permanent collection, which is rearranged every two years, this time
with more than twenty (marked) loans from other Dutch museums and from the Royal
Museum of Fine Arts Antwerp under the name of ‘The Collection Enriched’, is pointed out by
34,3% of the respondents to be the main reason behind their visit. Furthermore, the exhibition
‘Peanut-Butter Platform’ by Wim T. Schippers (just as the name says) was popular under
17,1% of the respondents.
Figure 4.5 Most important reason behind visitFrequency Percent Valid Percent Cumulative
PercentValid permanent collection 16 15,2 15,2 15,2
The Collection Enriched
20 19,0 19,0 34,3
Peanut-Butter Platform
18 17,1 17,1 51,4
Beauty in Science 26 24,8 24,8 76,2
Surreal 3 2,9 2,9 79,0Dreaming of a Mega Renaissance
1 1,0 1,0 80,0
Van Gogh & Roulin 2 1,9 1,9 81,9restaurant 1 1,0 1,0 82,9special activity 3 2,9 2,9 85,7free entrance 1 1,0 1,0 86,7other 14 13,3 13,3 100,0Total 105 100,0 100,0
For curiosity reasons, and to assess whether respondents appreciated the exhibitions staged by
MBVB in the period of the data collection, respondents were asked to grade the exhibitions
they had seen on a scale of 1 to 10. Recording ‘not seen’ as missing, the number of cases
inevitably differs considerable as can be seen in table 4.6. Ignoring the statistic difficulties
this will bring in comparing results, some things can be said here. For one, the small
exhibition ‘Van Gogh & Roulin’ was highly appreciated with a 7,4 (N=56), directly followed
by ‘The Collection Enriched’ with an average of 7,3 (N=76). More controversial was the
exhibition ‘Peanut-Butter Platform’ with a mean of 5,4 (N=88), but where its standard
deviation shows relatively much disagreements on its quality. The standard deviation is also
57
RESULTS
relatively large in ‘Beauty in Science’, which though receives a higher average and a
discernable higher median. With the exception of the ‘Peanut-Butter Platform’, all exhibitions
are generally well received.
Table 4.6 Judgments of exhibitions by visitors'The
Collection Enriched'
'Peanut-Butter
Platform'
'Beauty in
Science'
'Surreal' 'Dreaming of a Mega
Renaissance'
'Van Gogh & Roulin'
N Valid 76 88 65 44 32 56 Missing 29 17 40 61 73 49Mean 7,28 5,40 6,80 6,07 6,91 7,41Median 7,00 5,00 8,00 6,00 7,00 8,00Mode 8 5 8 6 8 8Std. Deviation 1,323 2,549 2,123 1,860 1,058 1,262Minimum 2 1 2 2 5 4Maximum 9 9 9 9 8 9Percentiles 25 7,00 4,00 5,00 5,00 6,00 7,00 50 7,00 5,00 8,00 6,00 7,00 8,00 75 8,00 7,00 8,50 8,00 8,00 8,00
58

RESULTS
5. The support base among visitorsThe results of the WTP-questions will, in part, answer the main research question, which is
basically twofold:
RQ1: Is there a willingness to pay among the visitors to Museum Boijmans Van Beuningen in
Rotterdam to contribute yearly to a special fund to finance the museum’s exhibitions?
RQ2: Which factors influence the decision to support by visitors to Museum Boijmans Van
Beuningen?
Willingness-to-pay
The amounts of individually stated willingness-to-pay (on the open question) vary from 0
euros to 120 euros. The median is 0 euros, with more than 50 percent not willing to contribute
anything to the fund. Table 5.1 and Figure 5.1 draw a refined picture, clearly showing a very
large proportion of zero-bids. In total, 38,5 percent is willing to donate some amount, with a
peak at 10 euros and a smaller one at 25 euros. The amounts clearly cluster around round
figures, behavior which is not particularly surprising, as people “do not know their
preferences well enough” for WTP-responses like 7,75 euros (Bille Hansen, 1997: 10).
Table 5.1 Statistics for individual WTP to an exhibition fund of Museum Boijmans Van Beuningen
N Valid 104Missing 1
Mean 7,98Median ,00Mode 0Std. Deviation 15,634Minimum 0Maximum 120Percentiles 0 ,00
5 ,0025 ,0050 ,0075 10,0095 32,50100 120,00
59

WTP in euros
12050352520151050
60
40
20
0
Number of respondents
RESULTS
Figure 5.1 Distribution of individual WTP
Only one respondent did not answer the WTP-question, probably because respondents could
fairly easily state their bid with the double-bounded dichotomous choice format. Therefore,
the sample non-response bias of Bille Hansen (1997), which is the question whether the
average WTP is representative for the whole sample, doesn’t seem to exist.
With so many zero WTP statements, the problem of interpretation of these zero bids is
important. They can either be a true expression of individual preferences or ‘protest bids’
which need to be sifted out of the dataset because these individuals are assumed to be against
the study (Bille Hansen, 1997). Anticipating this, the survey has explicitly asked respondents
who donated nothing, why they did so. Options were given, but an open question was added
to this as to include all possibilities. Table 5.2 gives an overview of results, which indicates
that the largest proportion of the respondents think they already pay enough for admission
alone. Also remarkable is that 17,2 percent of respondents think that the government should
give the necessary funds for keeping up the level of exhibitions at MBVB. Respondents
further state that they already donate in an alternative way (be it as a Friend of the museum, a
60

RESULTS
volunteer or as an owner of the ‘Museumjaarkaart’) or they have other reasons not to
contribute. The given reasons in the latter case comprise being a poor student (or related to
that, not 18 yet); retired; not being a local; or giving alternative ways of financing exhibitions,
e.g. raising admission price and finding sponsors or more money from the BankGiro Lotterij.9
Table 5.2 Reasons behind zero bids
Frequency Percent Valid Percent Cumulative Percent
Valid Already paid for entry 20 19,0 31,3 31,3
Role of the government to provide support
11 10,5 17,2 48,4
Inappropriate to ask people to make a voluntary contribution
3 2,9 4,7 53,1
A special fund is not the right solution 6 5,7 9,4 62,5
I already donate in another way 10 9,5 15,6 78,1
other 14 13,3 21,9 100,0Total 64 61,0 100,0
Missing System 41 39,0Total 105 105
The matter of consideration now is which reasons are behind ‘protest bids’, or respondents
who argue against the study or scenario given. The top two reasons in the table are only
alternative ways of funding, no rejection of the possibility entirely. Reason three and four on
the other hand, show clear uneasiness against the structure of the fund. Thus it can be argued
that these, in total, nine respondents, show ‘protest bids’ and can be excluded from the
dataset. The other reasons also only show suggestions of alternative finance or other ways of
expressing their true preferences.
Beside ‘protest bids’ the very high bids can also give a distorted image of WTP. In
these cases, stated WTP does not reflect true preferences in the sense that the individual has
no close connection to the good in question, doesn’t have the income for it or isn’t culturally
educated. Figure 5.1 shows two bids of 35 euros, two of 50 euros and one of 120 euros.
Comparing the bids with the respondents’ socio-demographic and cultural backgrounds
indicates that there are no clear signs for rejecting and removing these bids. Bille Hansen
9 Other reasons were: “My heart goes to museums in my local region”; “I already give too much to others!” or “I only support beautiful art, not a ‘Peanut Butter Platform’!”, which are fairly explicit.
61

RESULTS
(1997) claims that it is also interesting to see what happens with the average WTP if these
very high bids are deleted. The average WTP of the whole dataset is now 7,98 euros. If the
120 bid is removed the average shrinks to 6,89 euros; if the two 50 bids below are removed
the average is reduced to 6,04 euros, and if the two 35 bids are additionally removed the
average is down to 5,45 euros.
The data will be corrected by removing respondents who seemed to have made a
‘protest bid’. With this adjustment, the new average WTP is 8,74 euros (N=95), still with a
median of 0. Among the respondents who are willing to pay, the (corrected) average amount
is 20,75 euros, with a median of 17,50 euros (N=40). Table 5.3 gives an overview of the
statistics in this case.
Table 5.3 Statistics for individual WTP (≠ 0) to an exhibition fund of Museum Boijmans Van Beuningen
N Valid 40Missing 65
Mean 20,75Median 17,50Mode 10Std. Deviation 19,333Minimum 5Maximum 120Percentiles 25 10,00
50 17,5075 25,00
These respondents may also expect something back for their donation. Therefore, the WTP
questions were followed-up with a question asking them what they wanted as compensation.
This question was also filled in by respondents who made a zero bid, but according to the
principle of ‘who is not prepared to donate, may not expect to get something in return’ these
answers are excluded from the data. Table 5.4 gives an overview of desired compensations,
which could be chosen from several options. Multiple choices were possible. The most
popular option was getting invited for special events, followed by an extension of the opening
times in the evening. Seven respondents claimed they are donating altruistically and expect
nothing in return. One respondent indicated she wanted to be compensated in a way not
optional, namely to have free admission to one exhibition of choice (excluding the free
Wednesdays).
62

RESULTS
Table 5.4 Desired returns of donating to an exhibition fund of Museum Boijmans Van Beuningen
Frequency
Percent
More exhibitions (> 25 p.y.) 3 6Improving the quality of exhibitions 5 10More applications of multimedia 3 6Yearly reduction of admission price 4 8Invitation to special events 13 26Earlier opening times (before 11.00) 4 8Later opening times (after 17.00) 10 20Nothing 7 14Other 1 2Total 50 100
Determinants of WTP
The willingness-to-pay among visitors to Museum Boijmans Van Beuningen is thus small, but
present. In total, and corrected for the protest bids, the average WTP is 8,74 euros (N=95)
when including all zero bids, and 20,75 euros when excluding zero bids (N=40). Now an
econometric analysis on the survey results can be conducted to explain this behavior on the
basis of the visitors’ characteristics. These determinants are manifold, but the literature
mainly focuses on the socio-demographic variables because it is proven that they have the
most significant effects, especially income and education (e.g. Tohmo, 1998; Santagata &
Signorello, 2000; Mazzanti, 2001). A second group of explanatory variables are one’s cultural
preferences, e.g. the number of visits to exhibitions in general. The third group refers to the
respondents’ affinity with the museum itself and reflects the goodwill the visitor has build up
during his or her visits.
The WTP among visitors to pay for the maintenance of the current level of exhibitions
in the museum can be explained in a model of utility, visualizing the relationship of the
dependent variable, WTP here, with a number of independent variables10:
WTP = b0 + b1X1 + b2X2 + b3X3 (1)
The b0 is the constant here (the intercept), where b1 to b3 are the coefficients of X and
represent their direction on WTP.
10 Model based on Thompson et al. (2002) and Salazar Borda (2007), who also based her model on the former study.
63
RESULTS
The independent variable X1 summarizes all socio-demographic variables of the
respondent, namely gender (0 for male, 1 for female), age (continuous variable), place of
residence (0 for Rotterdam, 1 for Zuid-Holland and 2 for other), education (0 for lower
education, 1 for higher education and 2 for academic education), income (0 for low income to
€ 1.000, 1 for average income from € 1.001 to € 3.000 and 2 for high income) and persons in
the household (0 for one-person, 1 for two-person and 2 for larger households).
The X2 is a factor of variables determining the respondent’s cultural preferences.
These are dummy variables of visits to cultural activities (0 is no visit, 1 is visit), donation to
cultural organization (0 is do not donate, 1 is donate) and membership (0 is no member, 1 is
member). These factors are highly related with the independent variables in X3, which
indicate whether the respondent is a frequent visitor (1) or occasional visitor (0) to the
museum, how many people there were in the party (0 is none or one, 1 is two to four and 2 is
larger groups), how long they visited the museum (continuous) and also includes dummy
variables for the appreciation of exhibitions (0 is haven’t seen, 1 is doesn’t like, 2 is like). The
last variable receives doesn’t like when the grade was between 1 and 5, and like when the
grade ranged from 6 to 10.
With these independent variables determined and the WTP as a dichotomous variable
(a zero WTP bid is 0, a positive WTP bid is 1), the relationship between the different factors
can be determined. The usual statistical method technique that is used in the literature is a
logistic regression model (e.g. Tohmo, 1998; Salazar Borda, 2007), which determines the
probability on one of the categories of WTP on the basis of the independent variables (De
Vocht, 2007). This model is also chosen because of the fact that the very large frequency of
zero bids disturbs the normal distribution of residues needed for a linear regression. Putting all
the independent variables at once into the model leads to table 5.5.
Table 5.5 Logistic regression on WTP of visitors to an exhibition fund of Museum Boijmans Van Beuningen
B S.E. Sig.Male ,382 1,538 ,804
Age -,274 ,117 ,020* Place: other ,827 Zuid-Holland -,991 1,806 ,583 Rotterdam ,515 1,627 ,752 Academic
education,700
Higher education 1,506 3,443 ,662
64

RESULTS
Lower education 1,493 1,773 ,400
High income ,098** Average income -6,104 3,541 ,085 Low income -4,524 2,097 ,031 Larger household ,204 Two-person
household2,947 2,292 ,199
One-person household
4,705 2,662 ,077
No Theater ,753 1,449 ,604 visit Ballet -,949 1,431 ,507 to Music -1,387 2,077 ,504 Cabaret 5,080 2,232 ,023* Cinema 1,527 1,719 ,375 Festival 1,613 1,895 ,395 Heritage 3,456 2,384 ,147 Exhibitions -4,806 45923,204 1,000 No support -1,427 1,407 ,311 No member -3,099 2,080 ,136 Occasional visitor -4,487 1,912 ,019* Large group ,846 With 2-4 persons -,836 1,787 ,640 Alone or with 1 ,122 2,792 ,965 Visit time -,013 ,014 ,367 Collection
Enriched: like,149
Don’t like -1,708 1,620 ,292 Haven’t seen -7,299 3,790 ,054 Peanut Butter
Platform: like,520
Don’t like -,912 1,785 ,609 Haven’t seen 1,149 1,541 ,456 Beauty in
Science: like,985
Don’t like -,204 1,624 ,900 Haven’t seen -,293 1,807 ,871 Surreal: like ,072** Don’t like -4,793 2,739 ,080 Haven’t seen -8,908 3,885 ,022 Dreaming of
Mega Renaissance: like
,860
Don’t like ,834 1,515 ,582 Haven’t seen -18,021 22214,091 ,999 Van Gogh &
Roulin: like,083**
Don’t like 4,961 2,855 ,082 Haven’t seen 7,831 3,927 ,046 Constant 15,046 6,368 ,018
* Significance ≤ .05 ** Significance ≤ .1
65
RESULTS
The logistic model doesn’t contain significant coefficients of .01, but do show some variables
at a significance of .05 or .1 as indicated in the table. It is significantly different from the
‘bold’ model which is based on expected coefficients (Sig. ≤ .05) and improves its
explanation power with 38,7%. Furthermore, the Nagelkerke R Square (.695) shows there is a
reasonably strong relation between the logistic model and the dependent variable WTP. This
boosts some interesting results.
Socio-demographic variables
Age is the only determinant among the independent variables which is significant at 0.05.
This can be interpreted in the following way: with age people are significantly less willing to
pay a positive amount, though with only a minor fraction (-.274). Income, which is a
categorical variable here, shows to be significant at the .1 level, meaning to say that at a low
income, people are significantly (≤ .05) willing to pay less; the same goes for an average
income. So compared with lower to average incomes, people with a high income (more than €
3.000 a month) are significantly willing to pay more, as is to be expected.
Other socio-demographic variables do not show any significance at all, so no useful
things can be said here. Nevertheless, the coefficients do show some indications on the
expected directions. Males for example may be more willing to pay than women. Also, people
from Rotterdam, with a lower education and in one-person households are more likely to pay,
but as said, this is not a significant relationship.
Cultural preference variables
Although the model contains many independent variables that indicate the cultural behavior
of respondents, only four variables show significance, with two under the .05 level.
Nevertheless, the model seems to produce the most interesting outcomes here. The most
significant factor is the type of visitor, i.e. how many times the respondent has visited the
museum before in the last two years. It indicates that the occasional visitor is significantly less
willing to pay in comparison with the frequent visitors (more than 1-2 times in last two years).
This is coherent with the results from Jaffry & Apostolakis (2010), who discovered significant
differences in preferences between frequent and non-frequent visitors in their survey.
Another distinctive factor in the model is the significance of non-visitors of cabaret on
the probability of a positive amount of WTP. Apparently, respondents who don’t visit cabaret
plays are significantly more likely to pay an amount for the exhibition fund. This begs the
question, however, what this means in reality. Furthermore, ones’ judgment of exhibitions,
66

RESULTS
here ‘Surreal’ and ‘Van Gogh & Roulin’, also seems to have a significant effect on WTP.
However, both exhibitions have a completely opposite effect on it: if one liked the ‘Surreal’
exhibition, they were more likely to pay than if they didn’t like it or haven’t seen it; with the
‘Van Gogh & Roulin’ exhibition on the other hand, a negative or absent judgment was more
likely to result in a positive amount. This can partly be explained with the fact that both
exhibitions were quite small, easily overlooked and thus yielded less answers on the grading
scale.
One surprising result in the model is that a strong experience with exhibitions didn’t
yield a significant relationship with WTP. A closer look at the data showed that the distinction
made (visit – no visit) was not sufficient and detailed enough, as only one no-visit was
counted. The rest of the model doesn’t show any counterfeiting results, or at least no
significant ones.
67
CONCLUSION
V. Conclusion
The purpose of this thesis was to research an alternative approach of the market. With the help
of a contingent valuation study, visitors to Museum Boijmans Van Beuningen in Rotterdam
were asked to state their willingness-to-pay to a fund with the specific goal to keep its
exhibitions at their current level. This is put in the context of recent cuts in art subsidies by the
Dutch government. The study also wanted to discern which people might be more willing to
pay and who less. Therefore, visitors were posed additional questions concerning their
cultural preferences, visiting patterns and socio-demographic profile. In this conclusion, the
results will be put into context in order to answer the research questions posed in this thesis.
Following that is an elaboration on the relevance of the study and its shortcomings, and
finally some suggestions for further research will be made.
Is there a willingness to pay among the visitors to Museum Boijmans Van Beuningen in
Rotterdam to contribute yearly to a special fund to finance the museum’s exhibitions?
The results of the survey, which contained 105 individual cases, can first be summarized here
to provide a sketch of the visitors’ profile. Respondents were predominantly women, around
50 years of age, lived in Rotterdam or in the province of Zuid-Holland, were highly-educated
but with an average or below average income and living in a single or two-person household.
The average visitor is likely to visit the cinema, heritage and music performances, but
predominantly exhibitions, and is likely to be a holder of a ‘Museumjaarkaart’. Most
respondents indicate that they have visited Museum Boijmans Van Beuningen 1 or 2 times
before in the last two years. They visited the museum with one other person, predominantly
with the reason to see the ‘Beauty in Science’ exhibition or the permanent collection and they
mainly liked the ‘Van Gogh & Roulin’ exhibition and ‘The Collection Enriched’, contrary to
the more controversial ‘Peanut-Butter Platform’. These visitors are thus reasonably
acquainted with the museum and its exhibitions and also already contribute in part by
memberships. Most of them did not make any voluntary contribution to a cultural
organization in the last year (55,6%), but this leaves a considerable amount who did. Taking
these findings at face value would suggest that there is some base of support among the
visitors of MBVB.
68

CONCLUSION
The answers on the willingness-to-pay question suggest something different, however.
A large proportion of respondents (61,5%) did not want to contribute at all, including the ones
who were against the scenario or proposed method. The result was an average of € 7,98 and €
8,74 when excluding the protest bids. This negligible amount is not surprising however. The
use of a CV study in the context of an exhibition fund makes an appeal to two different
mindsets. The logic of the market, where price (WTP) is the coordinating factor, collides here
with the logic of the third sphere, which appeals to the social responsibility of the visitors.
This is also reflected in the responses of zero-bidders, where a large proportion argues that
admissions and subsidies should cover the costs of the exhibition program.
Among the respondents who were willing to pay, an average of € 20,75 per year was
found. In return they mainly want to be invited to special events or be able to visit the
museum after 17h00. This indicates that visitors want rewards in the firm of an opportunity to
widen and deepen their experience of the visit. In conclusion, the support base for the
exhibition fund of MBVB is not particularly large, but it is present. A small part of visitors is
prepared to pay an amount to the fund, which shows that they are aware of some
responsibility on their side to support the museum.
Which factors influence the decision to support by visitors to Museum Boijmans Van
Beuningen?
To explain the WTP results a logistic regression model was applied. Three groups of
independent variables were put in the model, namely socio-demographic variables, cultural
preference variables and variables concerning visitors’ affinity with the museum in question.
Results show that mainly the latter set of variables seem to explain the support decision,
which is simplified here into no WTP and a positive WTP, with the most significant factor
being the frequency of visits to the museum. Frequent visitors were clearly more willing to
pay than first-time visitors. Other significant factors were age and income, visits to cabaret
and judgments of the exhibitions ‘Surreal’ and ‘Van Gogh & Roulin’. In short, this tells that a
young, frequent visitor with above average income, no visitor of cabaret performances, who
liked the ‘Surreal’ exhibition (with photo’s from the collection) but who didn’t like or see the
‘Van Gogh & Roulin’ exhibition, is more apt to pay a positive amount to the exhibition fund
of Museum Boijmans Van Beuningen. What is surprising in these results is that no significant
relationship could be shown between place of residence and the willingness to pay. As a local
museum, one would expect that local residents, living in Rotterdam or in the direct area, are
69
CONCLUSION
more likely to pay as externalities of the museum flow both directly and indirectly to them.
However, as the museum already receives much local support from the municipality and from
local companies, this incentive might be very weak. The explanation may reside in the
historical rootedness of the government sphere in the museum sector, which crowds out the
logic of the market.
Of course, this conclusion requires some scrutiny in the interpretation. First, only age
and visiting time were continuous variables, with the rest of the variables turned into
categories which may have been too restricted or show too little details. Furthermore, the
literature on cultural participation already has proven that income, age and frequency of visits
are significant factors, but the influence of visits to substitutes of the museum, like cabaret
performances, and the quality experience of exhibitions is less researched. It is very unlikely
that cabaret might have any impact on the support decision to a museum fund. Therefore, this
result might be better explained by assuming that there is a correlation between age and the
decision to visit cabaret, which rules out the latter as a factor in the model. It is also rather
doubtful whether a positive judgment on one and negative judgment on another exhibition can
have a real influence in the consideration, but this is more difficult to prove. So in conclusion,
the support decision seems to be mainly explained by age, income and frequency of visits.
Apparently, there is a financial potential among the young and wealthy who already have a
certain affinity with the institution in question. They have built up enough goodwill to the
museum and its exhibitions which just might pay out for the museum when approached in the
right way.
Is there a base of support among the Dutch public of arts and culture?
Can any generalizations be made with the information above? In other words, to what extent
are the results in this particular case-study representative for all Dutch museums and to arts
and culture in general? The history of MBVB, which is one of donors and control by the
Rotterdam municipality, as well as its particular finances are distinct from other museums or
organizations. MBVB did privatize like others in the field, but is now quite successful in
covering its expenses with own revenues – probably because of its history – in the sense that
it manages to generate 45% of own income, which is far higher than most Dutch art museums
manages to do. MBVB thus is an example of a ‘best practice’ in the field, one that other
cultural organizations probably need to follow. However, this does not mean to say that its
situation can’t be further improved.
70
CONCLUSION
Institutions need to engage with and attract a public to commit them and preferably
educate them from a young age forward in order to create a sustainable support base, which is
willing to stand on the barricades when financial troubles arrive. This will not come on its
own, however. A strong (online) platform can stimulate communication with and
transparency to their audience. Time- and cost-intensive efforts must be made to step into a
discussion with their potential supporters and reward them for their commitment and
engagement with the organization. This study for example shows that continuation of the
experience is appreciated among visitors, like inviting them for special events or by extending
their visiting hours. An opportunity for new and social media lies here, as they enforce the
communication function of cultural organizations.
However, these activities are also likely to take time. First of all, every organization
needs to research which consumers might be willing to pay more and find the appropriate
channels to connect with them. Then time must be spent to cultivate these relationships before
they may actually pay out. It matters here whether the reputation enjoyed by the organization
radiates further than the city borders, though this thesis did not find immediate proof for this.
And in the end, the chance might still exist that there is no critical mass for the organizations
to sustain their activities on their current level. Especially expensive and log organizations as
(superstar) museums may not generate enough revenues to completely support one function as
their display function. Therefore, a role for the government lies here to control for these risks
both on the level of the organization and on the level of the public, for example by providing
them with favorable tax breaks. Clearly, the arts and culture can’t do without the support from
all spheres in the economy, be it the government, the market and the third sphere.
By answering this research question, this thesis hopes to have countered some managerial
questions that arise when a serious cut in government support might occur, which makes it
necessary to turn to the opportunities of the market. Notwithstanding the loud protests,
museums should step off from their old mindset of filling in forms according to the formal
logic of the government sphere, and step towards their audience. However, time has to pass
for not only museums to change, but also to change the mindset of visitors.
Despite the research efforts made to produce valid and reliable results, this study
inevitably has drawbacks. First of all, due to limited resources and time, the data collection
only encompassed a week. In this week, the museum didn’t run on full capacity of
exhibitions, which may explain the small visitor numbers and consequently, a small number
of respondents. Also, the exhibitions that were on view yielded some very mixed opinions,
71
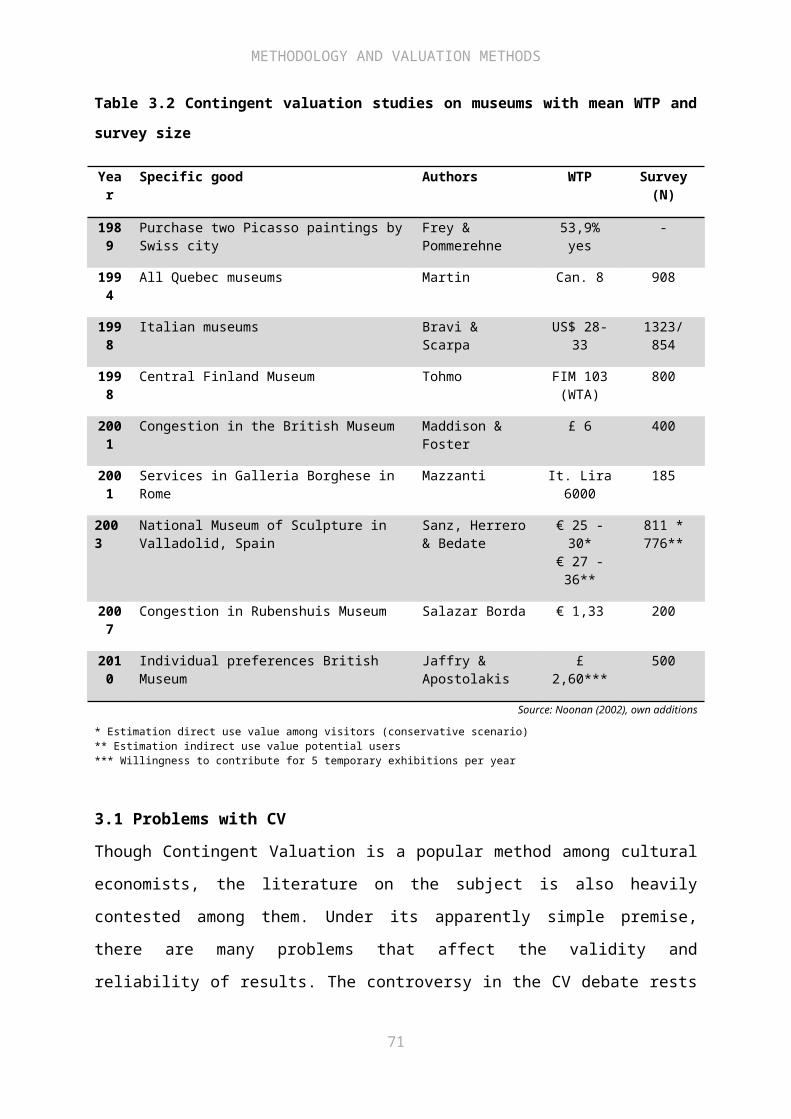
CONCLUSION
which might have affected some of the results. Second of all, the used method, a CV survey,
is quite controversial due to reason already elaborated upon in the methodology. Therefore,
some decisions had to be made both in the construction of the survey and in the data-analysis
that may be doubtful to others. Finally, the chosen scenario and case-study might not be that
representative for the overall research question. Results might have been totally different, for
example, when the willingness-to-pay for a more defined subject was asked, like for a new
depository of the museum.
During the research and while completing this thesis, some new ideas and possible
adjustments were run into which can be applied in further research. So did the processing of
the data learn that some of the respondents thought that the funding of exhibitions should
happen through sponsoring, not by collecting funds from visitors. Therefore, later studies
need to put other scenarios to the test and see to what extent the support decision of visitors
change.
Further research should also focus on the existing system of giving circles, supporting
foundations and funds. Analyzing the behavior of members, their motives and the amount of
donations in these organizations might put more light on the potential of the market. Here,
revealed preferences can be analyzed as opposite to stated preferences in a hypothetical
market, where the amounts given might not reflect the true value in the market. These studies
might put the recent cuts in the Netherlands into another perspective.
72
REFERENCES
VI. References
Alexander, V.D. 1996. From philanthropy to funding: The effects of corporate and public support on American art museums. Poetics 24, pp. 87-129.
Anderson, R.G.W. 2005. To thrive or survive? The state and status of research in museums. Museum Management and Curatorship 20 (4), pp. 297-311.
Arora, P., & Vermeylen, F. 2011. The rise of the new experts: Consumers and the art world in the digital age. (Forthcoming)
Aroyo, L., Brussee, R., Rutledge, L., Gorgels, P., Stash, N., & Wang, Y. 2007. Personalized museum experience: The Rijksmuseum use case. Archives & Museum Informatics. http://www.archimuse.com/mw2007/papers/aroyo/aroyo.html. Consulted 11 April 2011.
Ashworth, J., & Johnson, P. (1996) Sources of “Value for Money” for Museum Visitors: Some Survey Evidence. Journal of Cultural Economics 20, pp. 67-83.
Bailey, S.J., & Falconer, P. 1998. Charging for Admission to Museums and Galleries: A Framework for Analysing the Impact on Access. Journal of Cultural Economics 22: pp. 167-177.
Bergevoet, F., Kok, A., & de Wit, M. 2006. Netherlands guidelines for deaccessioning of museum objects. Netherlands Institute for Cultural Heritage.
Bille Hansen, T. (1997) The Willingness-to-Pay for the Royal Theatre in Copenhagen as a Public Good. Journal of Cultural Economics 21: pp. 1-28.
Bras, L. 2010. Crowdfunding en het museum. Erfgoed Nederland magazine 2, p. 20.
Cuccia, T. (2003) Contingent Valuation. In: R. Towse (ed.) A Handbook of Cultural Economics. Northampton: Edward Elgar Publishing, Inc., pp. 119-131.
Cuccia, T., & Signorello, G. (2002) Methods for Measuring the Demand for the Arts and Heritage: Theoretical Issues. In: I. Rizzo & R. Towse (eds.) The Economics of Heritage: A Study in the Political Economy of Culture in Sicily. Northampton: Edward Elgar Publishing, Inc., pp. 119-146.
Crowdfunder. http://www.crowdfunder.co.uk/. Consulted 8 June 2011.
Darnell, A.C. 1998. Some Simple Analytics of Access and Revenue Targets. Journal of Cultural Economics 22: pp. 189-196.
De Vocht, A. 2007. Basishandboek SPSS 15 voor Windows. Utrecht: Bijleveld Press.
DiMaggio, P. 1982. Cultural Entrepreneurship in Nineteenth-Century Boston: The Creation of an Organizational Base for High Culture in America. Media, Culture and Society 4, pp. 33-50.
Epstein, R.A. (2003) The Regrettable Necessity of Contingent Valuation. Journal of Cultural Economics 27 (3-4): pp. 259-274.
Feldstein, M. 1991. The Economics of Art Museums. Chicago: The University of Chicago Press.
73

REFERENCES
Frey, B.S., & Pommerehne, W.W. (1989) Muses and Markets. Explorations in the Economics of the Arts. Cambridge: Basil Blackwell.
Frey, B.S. 1998. Superstar Museums: An Economic Analysis. Journal of Cultural Economics 22: pp. 113-125.
Frey, B.S. 1999. State Support and Creativity in the Arts: Some New Considerations. Journal of Cultural Economics 23: pp. 71-85.
Frey, B.S. 2003a. Arts & Economics. Analysis & Cultural Policy. Berlin: Springer-Verlag.
Frey, B.S. 2003b. Public support. In: R. Towse (ed.) A Handbook of Cultural Economics. Cheltenham: Edward Elgar Publishing, pp. 389-398.
Frey, B.S., & Steiner, L. 2010. Pay as you go: a new proposal for museum pricing. University of Zürich: Working Paper Series.
Goudriaan, R., & Van ‘t Eind, G.J. 1985. To fee or not to fee: some effects of introducing admission fees in four museums in Rotterdam. In: V.L. Owen & W.S. Hendon (eds.) Managerial Economics for the Arts. Akron, Ohio: University of Akron. Association for Cultural Economics.
Heilbrun, J., & Gray, C.M. 2001. The Economics of Art and Culture. Cambridge: Cambridge University Press. Second edition.
Hemels, S.J.C. 2005. Door de muze omhelsd. Een onderzoek naar de inzet van belastingsubsidies voor kunst en cultuur in Nederland. Nijmegen: Wolf Legal Publishers.
Hutter, M. 1998. Communication Productivity: A Major Cause for the Changing Output of Art Museums. Journal of Cultural Economics 22: pp. 99-112.
ICOM, 2007. Museum Definition. http://icom.museum/who-we-are/the-vision/museum-definition.html. Consulted 15 March 2011.
Jaffry, S., & Apostolakis, A. 2010. Evaluating individual preferences for the British Museum. Journal of Cultural Economics 35 (1): pp. 49-75.
Johnson, P.S. 2003. Museums. In: R. Towse (ed.) A Handbook of Cultural Economics. Cheltenham: Edward Elgar Publishing, pp. 315-320.
Johnson, P., & Thomas, B. 1991. Museums: an economic perspective. In: S. Pearce (ed.) Museum Economics and the Community. London: The Athlone Press, pp. 5-40.
Johnson, P., & Thomas, B. 1998. The Economics of Museums: A Research Perspective. Journal of Cultural Economics 22, pp. 75-85.
Jongenelen, S. 2011. Van mecenas tot minnaar. Boekman 87, pp. 20-25.
Kappel, T. 2009. Ex Ante Crowdfunding and the Recording Industry: A Model for the U.S.? Downloaded on 7 May 2011 from: http://elr.lls.edu/issues/v29-issue3/documents/08.Kappel.pdf.
Kirchberg, V. 1998. Entrance Fees as a Subjective Barrier to Visiting Museums. Journal of Cultural Economics 22: pp. 1-13.
Klamer, A. 2006. Cultural entrepreneurship. www.klamer.nl.
74

REFERENCES
Klamer, A., & Zuidhof, P.W. 1998. The Role of the Third Sphere in the World of the Arts. Unpublished, Erasmus University. www.klamer.nl.
Klamer, A., & Langeveld, C. 2011. Pak aan: 100 en 1 ideeën voor alternatieve financiering van kunst en cultuur. Hilversum: Stichting Cultuur en Economie.
Loonwijzer.nl. http://www.loonwijzer.nl/home/Salarisnieuws/nettolonen-stijgen-licht-in-2011. Consulted 30 May 2011.
Loos, I., & Koren, G. 2011. Crowdfunding als kans voor de creatieve industrie. Boekman 87, pp. 28-33.
Luksetich, W.A., Lange, M., & Jacobs, P. 1987. The effectiveness of museum fund-raising efforts. In: Hillman-Chartrand, H., Hendon, W.S., & Horowitz, H. (eds.) Paying for the Arts. Akron, Ohio: University of Akron. Association for Cultural Economics.
Luksetich, W.A. & Partridge, M.D. 1997. Demand functions for museum services. Applied Economics 29, pp. 1553-1559.
Maddison, D., & Foster, F. 2003. Valuing congestion costs in the British Museum. Oxford Economic Papers 55: pp. 173-190.
Martin, F. (1994) Determining the Size of Museum Subsidies. Journal of Cultural Economics 18, pp. 255-270.
Marty, P.F. 2007. The changing nature of information work in museums. Journal of the American Society for Information Science and Technology 58 (1), pp. 97-101.
Mazzanti, M. (2001) Discrete Choice Models and Valuation Experiments. An Application to Cultural Heritage. Downloaded on 6 April 2011 from: http://www-3.unipv.it/websiep/wp/075.pdf.
Milosavljevic, M., Dale, R., Green,S.J., Paris, C., & Williams, S. 1998. Virtual museums on the information superhighway: Prospects and potholes. In: Proceedings of CIDOC'98, the Annual Conference of the International Committee for Documentation of the International Council of Museums. Melbourne, Australia. http://web.science.mq.edu.au/~mariam/papers/cidoc98/. Consulted 11 April 2011.
Mulder, A. 2 May 2011. Het Landelijk Crowdfunding-Platform Voor Cultuur. Het Publiek Als De Nieuwe Financier. http://koerskunst.nl/het-landelijk-crowdfundingplatform-voor-cultuur/. Consulted 24 June 2011.
Museum Boijmans Van Beuningen. http://www.boijmans.nl. Consulted 18 May 2011.Jaarverslag 2009.Jaarverslag 2010.
Musumeci, M. New Technologies and Heritage. In: I. Rizzo & R. Towse (eds.), The Economics of Heritage. A Study in the Political Economy of Culture in Sicily. Cheltenham: Edward Elgar, pp. 102-115.
Noonan, D.S. (2002) Contingent Valuation Studies in the Arts and Culture: An Annotated Bibliography. Downloaded on 8 January 2011 from: http://harrisschool.uchicago.edu/about/publications/working-papers/pdf/wp_03_04.pdf.
Noonan, D.S. (2003) Contingent Valuation and Cultural Resources: A Meta-Analytic Review of the Literature. Journal of Cultural Economics 27 (3-4): pp. 159-176.
75

REFERENCES
O’Hagan, J.W. 1995. National Museums: To Charge or Not to Charge? Journal of Cultural Economics 19: pp. 33-47.
O’Hagan, J.W. 1998. Art Museums: Collections, Deaccessioning and Donations. Journal of Cultural Economics 22: pp. 197-207.
Peacock, A. 1995. A Future for the Past: The Political Economy of Heritage. In R. Towse (ed.), Cultural Economics: the Arts, the Heritage, and the Media Industries. Cheltenham: Edward Elgar. Vol. II. 1997.
Peter, M.G., & Schwarz, S. 1985. Economic Growth of Museums. In: V.L. Owen & W.S. Hendon (eds.) Managerial Economics for the Arts. Akron, Ohio: University of Akron. Association for Cultural Economics.
Ranshuysen, L. 1998. Sekse en Cultuurdeelname, in: Kulturpolitische Mitteilungen, nr. 82 (III).
Ranshuysen, L. 2009. Museummonitor 2008. Downloaded from: http://www.lettyranshuysen.nl/pdf/2009_MM%202008.pdf.
Rentschler, R., & Potter, B. 1996. Accountability versus artistic development. The case for non-profit museums and performing arts organizations. Accounting, Auditing & Accountability Journal 9 (5), pp. 100-113.
Rentschler, R., Hede, A.-M., & Ramsey, T. 2004. Pricing in the Museum Sector: The Need to Balance Social Responsibility and Organisational Viability. ANZMAC 2004, Conference Proceedings. Victoria University.
Sahin, S.A. (2010) Robin Hood in Reverse? Audience diversity and audience appreciation at museum Boijmans van Beuningen. Master Thesis, Erasmus University Rotterdam.
Salazar Borda, J. (2007) Valuing congestion costs in small museums: the case of the Rubenshuis Museum in Antwerp. Master Thesis, Erasmus University Rotterdam.
Santagata, W., & Signorello, G. (2000) Contingent Valuation of a Cultural Public Good and Policy Design: The Case of “Napoli Musei Aperti” Journal of Cultural Economics 24: pp. 181-204.
Sanz, J.A., Herrero, L.C., & Bedate, A.M. (2003) Contingent Valuation and Semiparametric Methods: A Case Study of the National Museum of Sculpture in Valladolid, Spain. Journal of Cultural Economics 27: pp. 241-257.
Schuster, J.M. 1998. Neither Public Nor Private: The Hybridization of Museums. Journal of Cultural Economics 22: pp. 127-150.
Schuyt, Th.N.M., Gouwenberg, B.M., & Bekkers, R.H.F.P. (red.) 2009. Geven in Nederland 2009. Downloaded from: http://geveninnederland.nl/file/148/geven_in_nederland_2009boek.pdf
Snowball, J. D. (2007) Chapter 4: The Contingent Valuation Method. Measuring the Value of Culture: Methods and Examples in Cultural Economics. Springer, pp. 77-130.
Spellman, P. 2008. Crowdfunding: Arts Patronage for the Masses? http://blogs.sonicbids.com/communityteam/2008/09/22/crowdfunding-arts-patronage-for-the-masses/. Consulted 8 June 2011.
76

REFERENCES
Steenbergen, R. 2010. De Nieuwe Mecenas. Cultuur en de terugkeer van het particuliere geld. Business Contact
Steiner, F. 1997. Optimal Pricing of Museum Admission. Journal of Cultural Economics 21: pp. 307-333.
Sunstein, C. 2002. Coherent and incoherent valuation: a problem with contingent valuation of cultural amenities. The Cultural Policy Center at the University of Chicago: Working paper.
Surowiecki, J. 2004. The wisdom of crowds: Why the many are smarter than the few and how collective wisdom shapes business, economies, societies and nations. Little Brown.
Tate Modern. http://www.tate.org.uk/modern/exhibitions/unileverseries2010/default.shtm. Consulted 6 March 2011.
The National Lottery. http://www.national-lottery.co.uk/player/p/home.ftl. Consulted 20 June 2011.
Thompson, E., Berger, M., & Allen, S. (1998) Arts and the Kentucky economy. Center for Business and Economic Research, University of Kentucky.
Thompson, E., Berger, M., Blomquist, G., & Allen, S. (2002) Valuing the Arts: A Contingent Valuation Approach. Journal of Cultural Economics 26, pp. 87-113
Throsby, D. (2003) Determining the Value of Cultural Goods: How Much (or How Little) Does Contingent Valuation Tell Us? Journal of Cultural Economics 27 (3-4): pp. 275-285.
Timmer, P. 2007. Who is afraid of grey, orange on maroon? http://www.deaccessioning.eu/good-practices/130-good-practices/67-dont-forget-to-inform-the-staff-museum-boijmans-van-beuningen. Consulted 15 April 2011.
Tohmo, T. (2004) Economic value of a local museum. Factors of willingness-to-pay. Journal of Socio-Economics 33: pp. 229-240.
Towse, R. 2002. The Cultural Economy of Heritage. In: I. Rizzo & R. Towse (eds.), The Economics of Heritage. A Study in the Political Economy of Culture in Sicily. Cheltenham: Edward Elgar, pp. 3-19.
Towse, R. 2010. A Textbook of Cultural Economics. Cambridge: Cambridge University Press.
Verver, M. 2011. Vaar mee op de vloedgolf van sociale netwerken. Boekman 87, pp. 34-41.
Volkskrant. 17 December 2010. Louvre kan Drie Gratiën aankopen. http://www.volkskrant.nl/vk/nl/3372/beeldende-kunst/article/detail/1076842/2010/12/17/Louvre-kan-Drie-Gratien-aankopen.dhtml. Consulted 20 June 2011.
Voordekunst. http://www.voordekunst.nl/. Consulted 8 June 2011.
Weil, S.E. 1990. Rethinking the museum and other meditations. Washington: Smithsonian Institution Press.
Willis, K.G. (1994) Paying for heritage: what price for Durham Cathedral? Journal of Environmental Planning and Management 27 (3): pp. 267-278.
Wu, C. 2002. Corporate Art Collections. In: Privatizing Culture: Corporate Art Intervention since the 1980’s. London: Verso, pp. 212-270.
77

APPENDIX
Geachte bezoeker van Museum Boijmans Van Beuningen,
Alvast hartelijk dank voor uw medewerking aan dit publieksonderzoek van de Erasmus Universiteit Rotterdam. Dit onderzoek zal u naar schatting 5 minuten van uw tijd kosten. De vragenlijst bestaat uit drie delen, waarin u gevraagd wordt naar uw culturele interesses, uw bezoek aan Museum Boijmans Van Beuningen en uw mening over een hypothetisch scenario waarin het tentoonstellingsprogramma op een nieuwe manier financieel zou kunnen worden ondersteund.
Deelname is volledig anoniem en vrijwillig. Uw antwoorden zullen alleen gebruikt worden voor onderzoeksdoeleinden en zullen niet doorgespeeld worden aan derden.Voor eventuele vragen over dit onderzoek kunt u bij mij terecht.
Met vriendelijke groet,
Jessica VerboomMasterstudente Cultural Economics & Cultural EntrepreneurshipErasmus Universiteit Rotterdam
IN TE VULLEN DOOR ONDERZOEKER:
RESPONDENTNUMMER: _____
ENQUÊTENUMMER: _____
DATUM: ____ - ____ - ______
WEEKDAG:1 dinsdag2 woensdag3 donderdag4 vrijdag5 zaterdag6 zondag
TIJDSTIP ____ - ____ uur
De vragen beginnen op de volgende bladzijde.Graag één antwoord per vraag aankruisen, tenzij anders aangegeven.
78
Enquête naar de waardering van tentoonstellingen in Museum Boijmans Van Beuningen
APPENDIX
DEEL 1: BEZOEK KUNST EN CULTUURIn dit gedeelte worden u vragen gesteld over uw interesse in culturele activiteiten en uw bezoek aan Museum
Boijmans Van Beuningen in het bijzonder.
1. HOE VAAK PER JAAR BEZOEKT U DE VOLGENDE ACTIVITEITEN?
0 keer 1 keer 2-3 keer 4-5 keer meer dan 5 keer
Toneelvoorstellingen
Balletvoorstellingen
Muziekuitvoeringen
Cabaret
Bioscoop
Festivals
Erfgoed (monumenten)
Tentoonstellingen
2. HOE VAAK HEBT U DE AFGELOPEN TWEE JAAR Museum Boijmans Van Beuningen BEZOCHT?
Dit is de eerste keer De afgelopen twee jaar niet, maar ik heb het museum wel al eerder bezocht 1-2 keer 3-4 keer 5-6 keer Meer dan 6 keer
3. HOE LANG HEEFT NAAR SCHATTING UW BEZOEK VAN VANDAAG AAN Museum Boijmans Van Beuningen GEDUURD?
…………... minuten
4. HEBT U VANDAAG Museum Boijmans Van Beuningen ALLEEN BEZOCHT?
JA ⃝ NEE ⃝
↓HOEVEEL PERSONEN TELT UW GEZELSCHAP? (Uzelf niet meegerekend) ………………… personen
79

APPENDIX
5. OP EEN SCHAAL VAN 1 TOT 10, HOE BEOORDEELT U DE VOLGENDE TENTOONSTELLINGEN IN Museum Boijmans Van Beuningen? (Cijfer graag omcirkelen)
Zeer slecht Neutraal Zeer goedNiet gezien
De Collectie Verrijkt 1 2 3 4 5 6 7 8 9 10
De Pindakaasvloer van Wim T. Schippers 1 2 3 4 5 6 7 8 9 10
Schoonheid van de Wetenschap 1 2 3 4 5 6 7 8 9 10
Surreëel – foto’s uit de collectie 1 2 3 4 5 6 7 8 9 10
Dreaming of a Mega Renaissance – Boris van Berkum
1 2 3 4 5 6 7 8 9 10
Van Gogh & Roulin – Tijdelijke hereniging 1 2 3 4 5 6 7 8 9 10
6. WAT WAS DE BELANGRIJKSTE REDEN WAARVOOR U VANDAAG NAAR HET MUSEUM BENT GEKOMEN? (Één antwoord aankruisen)
De vaste collectie De Collectie Verrijkt (tijdelijke aanvulling vaste collectie) De Pindakaasvloer van Wim T. Schippers Schoonheid van de Wetenschap Surreëel – foto’s uit de collectie Dreaming of a Mega Renaissance – Boris van Berkum Van Gogh & Roulin – Tijdelijke hereniging De museumwinkel Het museumcafé Een speciale activiteit (lezing, rondleiding, e.d.) Gratis toegang
Anders, nl. …………………………………………………………
7. WELKE VAN DE VOLGENDE KEUZES ZIJN OP U VAN TOEPASSING? (Meerdere opties mogelijk)
80

APPENDIX
In bezit van CJP-pas In bezit van Museumkaart In bezit van Rotterdampas Lid van overige organisaties (vb. Vereniging Rembrandt, ICOM) Vriend/ Begunstiger van Museum Boijmans Van Beuningen Vriend/ Begunstiger van ander museum/ musea Geen van bovenstaande
DEEL 2: FINANCIERING VAN TENTOONSTELLINGENHieronder vindt u een mogelijk scenario voor Museum Boijmans Van Beuningen om de kwaliteit en het aantal
van haar tentoonstellingen te behouden en mogelijk zelfs te verbeteren. Nadat u het scenario hebt gelezen, wordt u gevraagd enkele vragen te beantwoorden over uw bereidheid om geld bij te dragen aan het museum
en haar tentoonstellingen.
SCENARIOMuseum Boijmans Van Beuningen organiseert per jaar ca. 25 tijdelijke tentoonstellingen naast haar vaste collectie. De tentoonstellingen worden voor een deel door het museum zelf gefinancierd. Deze eigen inkomsten komen voort uit: entreegelden, boekwinkel, restaurant, fondsenwerving, sponsoring en legaten. Het overige deel van het tentoonstellingsprogramma wordt nu door een gemeentesubsidie gefinancierd, maar door de bezuinigingen zal een gedeelte hiervan wegvallen.
Om deze bezuinigingen op te kunnen vangen, stelt het museum een speciaal fonds in dat gericht is op het financieren van haar tentoonstellingen. Voor dit fonds wordt bezoekers gevraagd of ze een vrijwillige bijdrage willen doen ten behoeve van het tentoonstellingsprogramma. Hiermee wil het museum jaarlijks voldoende draagvlak hebben om het niveau van haar tentoonstellingen, zowel kwantitatief als kwalitatief, te kunnen behouden.
8. GEGEVEN DIT SCENARIO, BENT U BEREID OM JAARLIJKS 20 EURO BIJ TE DRAGEN AAN DIT FONDS?
JA ⃝
↓BENT U BEREID OM JAARLIJKS 50 EURO BIJ TE
DRAGEN?
NEE ⃝
↓BENT U BEREID OM JAARLIJKS 10 EURO BIJ TE
DRAGEN?
JA ⃝ NEE ⃝ JA ⃝ NEE ⃝
↘ ↙IN BEIDE GEVALLEN
REKENING HOUDEND MET U VOORGAANDE ANTWOORDEN, WAT ZOU HET HOOGSTE BEDRAG ZIJN WAT U BEREID BENT BIJ TE DRAGEN AAN DIT FONDS?
…………………………… Euro
↓ ALS U NIET BEREID BENT IETS BIJ TE DRAGEN
81

APPENDIX
WAT IS DE BELANGRIJKSTE REDEN WAAROM U NIET BEREID BENT IETS BIJ TE DRAGEN AAN DIT FONDS? (Één antwoord aankruisen)
Ik betaal al voor entree. Ik denk dat de overheid het tentoonstellingsprogramma van het museum moet steunen. Ik denk niet dat mensen gevraagd mogen worden om een vrijwillige bijdrage te doen. Ik denk niet dat een speciaal fonds de juiste weg is. Ik denk niet dat mijn bijdrage daadwerkelijk naar de tentoonstellingen gaat.
Ik doneer al geld via een andere weg, nl. ……………………………………………………………………….
Anders, nl. ……………………………………………………………………………………………………………………….
9. WAT ZOU U WILLEN TERUGZIEN VAN UW (EVENTUELE) BIJDRAGE? (Meerdere opties mogelijk)
Meer tentoonstellingen (meer dan 25 per jaar) Verbeterde kwaliteit tentoonstellingen Meer toepassing van multimedia (vb. PDA’s) in tentoonstellingen als informatievoorziening Jaarlijkse korting op toegangsprijs museum Uitnodiging voor speciale evenementen Uitbreiding openingstijden in de ochtend (voor 11.00) Uitbreiding openingstijden in de avond (na 17.00) Niets Anders, nl. ……………………………………………………………
10. HEBT U IN DE LAATSTE 12 MAANDEN EEN VRIJWILLIGE FINANCIËLE BIJDRAGE GEDAAN AAN EEN CULTURELE INSTELLING IN NEDERLAND?
JA ⃝ NEE ⃝
DEEL 3: Over uzelfUw antwoorden op deze vragen zullen vertrouwelijk behandeld worden en zijn enkel voor de statistiek.
11. GESLACHT: m / v
12. LEEFTIJD: …………. jaar
13. NATIONALITEIT: ……………………………………………………..
14. WOONPLAATS: ……………………………………………………..
15. UIT HOEVEEL PERSONEN BESTAAT UW HUISHOUDEN?
1 persoon 2 personen
82

APPENDIX
3 personen 4 personen 5 of meer personen
16. WAT IS DE HOOGSTE OPLEIDING DIE U HEBT AFGEMAAKT?(Indien u nog op school zit of studeert: met welke opleiding bent u op dit moment bezig?)
Lager- of basisonderwijs (lo,lom, blo, vglo) Lager beroepsonderwijs (lts, huishoudschool, lbo, leao) Middelbaar voortgezet onderwijs (mavo, mulo) Middelbaar beroepsonderwijs (mts, meao, inas) Hoger voortgezet onderwijs (havo, vwo, hbs, gymnasium, lyceum) Hoger beroepsonderwijs (HBO, hts, heao) Wetenschappelijk onderwijs (WO)
17. WAT IS GEMIDDELD UW (BRUTO) INKOMEN PER MAAND?
0 - 1.000 € per maand 1.001 - 2.000 € per maand 2.001 - 3.000 € per maand 3.001 - 4.000 € per maand 4.001 - 5.000 € per maand 5.001 - 6.000 € per maand Meer dan € 6.000,- per maand
18. HEBT U NOG OPMERKINGEN OVER DIT ONDERZOEK?
…………………………………………………………………………………………………………………………………………………………….
…………………………………………………………………………………………………………………………………………………………….
…………………………………………………………………………………………………………………………………………………………….
…………………………………………………………………………………………………………………………………………………………….
19. HEBT U NOG SUGGESTIES VOOR ALTNERNATIEVE FINANCIERINGSVORMEN VOOR MUSEA IN NEDERLAND?
…………………………………………………………………………………………………………………………………………………………….
…………………………………………………………………………………………………………………………………………………………….
…………………………………………………………………………………………………………………………………………………………….
…………………………………………………………………………………………………………………………………………………………….
– DANK U VOOR UW MEDEWERKING! –
83

APPENDIX
84
