musical missteps: the severity of the sophomore slump in
TRANSCRIPT

Claremont CollegesScholarship @ Claremont
Scripps Senior Theses Scripps Student Scholarship
2014
Musical Missteps: The Severity of the SophomoreSlump in the Music IndustryShane M. ZackeryScripps College
This Open Access Senior Thesis is brought to you for free and open access by the Scripps Student Scholarship at Scholarship @ Claremont. It has beenaccepted for inclusion in Scripps Senior Theses by an authorized administrator of Scholarship @ Claremont. For more information, please [email protected].
Recommended CitationZackery, Shane M., "Musical Missteps: The Severity of the Sophomore Slump in the Music Industry" (2014). Scripps Senior Theses.Paper 335.http://scholarship.claremont.edu/scripps_theses/335

1
MUSICAL MISSTEPS: THE SEVERITY OF THE SOPHOMORE SLUMP IN THE MUSIC INDUSTRY
Shane Zackery
Scripps College Claremont, CA 91711

2
MUSICAL MISSTEPS: THE SEVERITY OF THE SOPHOMORE SLUMP IN THE MUSIC INDUSTRY
Abstract
This study looks at alternative models of follow-up album success in order to determine if there is a relationship between the decrease in Metascore ratings between the first and second album for a musician or band and the 1) music genre or 2) the number of years between the first and second album release. The results support the dominant thought, which suggests that neither belonging to a certain genre of music nor waiting more or less time to drop the second album makes an artist more susceptible to the Sophomore Slump. This finding is important because it forces us to identify other potential causes for the observed disappointing performance of a generally favorable musician’s second album.

3
1 Introduction
The Sophomore Slump, also known as the Sophomore Jinx, refers to a multi-
media phenomenon that occurs when the second effort of a sports player, director,
student, or musician, fails to match the success of the first effort. In music, this
phenomenon plays out when the second, or sophomore, album of a band fails to generate
an equal or greater level of acclaim than the first album. This phenomenon is particularly
discussed with bands that receive high or favorable praise during the release of their first
album and then fall short of consumer or critic expectations after the release of their
follow-up album. The Sophomore Slump can refer to cases where either consumers or
critics dislike the second album. The opinions of these groups do not always line up, as
each group has different criteria for defining success. For the purpose of this study, I will
focus on the opinion of critics, who have more systematic measures of musical quality.
While I did not find any literature that specifically discusses the Sophomore
Slump as it relates to music and its severity, past literature that looks at the topic of The
Slump in general is torn. Perception suggests that most bands and musicians generally
experience a slump in performance because statistically, a stellar musical act should
naturally regress toward some normal average performance. A notably exceptional first
performance or first album is referred to as just that—an exception, not a rule. Other
literature suggests that there are identifiable stresses, pressures, and stimuli whose
presence results in an identifiable drop in success of a person or group. These variables
have been found in students, athletes, movie directors, scholars, artists, and many other
groups.

4
Kruger, Savitsky, and Gilovich (1999) argue that the Sophomore Slump and
similar phenomena are the result of people’s misunderstandings of the statistical
correlations between two variables. They, and many others, point to this
misunderstanding as the bedrock for a number of superstitious beliefs. The question of
this study is not whether or not there is such a thing as the Sophomore Slump. The Slump
has been positively identified in a number of other places, such as in baseball batting
averages and GPAs for university students. In baseball, The Slump is defined as
occurring when a Rookie has an exceptional premiere season followed by a less than
spectacular second season. Schwarz (2005) notes that in Major League Baseball between
1961 and 2004, Rookie players between the ages of 19 and 23 saw a decline in their win-
shares average of 11.1%. This average was even higher for players 24 or older (15.3%).
I found strong evidence of a Sophomore Slump in the data set used in my study.
The drop in Metascore between the first and second album was 10.39 points on average,
or about 10% (Metascore is assigned on a scale that ranges between 0 and 100 points).
This is both statistically significant and comparable in magnitude to measure of the
Slump in other places like the example listed above. For this reason, I will assume a side
in favor of the existence of The Slump and look at the varying degrees to which musical
acts encounter this phenomenon, as indicated by a drop in Metascore, assigned by
Metacritic.com, between the first and second album. The explanatory variables that will
be observed are the genre of music and the number of years between the first and second
album release, as these may be important factors in identifying why some bands are more
likely to experience the Sophomore Slump more severely than others.

5
If it is possible to identify factors that may account for a slump in performance of
musical acts between their first and second projects, it is important to do so, as record
companies and the acts themselves can steel themselves against loss from particularly
harsh interactions with The Slump. If there is a particular genre that suffers more harshly
from it, record companies can strategize to sign fewer of these types of talents. Likewise,
bands who wish to remain relevant and lucrative in the industry will know which types of
music to record in order to capture the most praise and profits. Musical acts are under an
immense amount of stress to stay relevant in the minds of consumers. Knowing how
many years one needs in order to record a successful album would be beneficial in
lessening the pressure that bands face to release subsequent projects. Overall, knowing
which variables explain less success makes them easier to avoid. Therefore, identifying
these variables is important to both performers and record labels alike in order to secure
streams of income and profit and to build a solid reputation of quality performance and
production.
Genre and number of years between releases may influence the susceptibility of a
band or musician to the Sophomore Slump. Genres such as Pop and Pop Rock are more
widely permeated throughout mainstream culture than genres such as Indie Rock or Folk,
which have more niche markets. Therefore, Pop musicians may go through the
Sophomore Slump more harshly because there are more of them for people to critique
and be unimpressed with for subsequent releases. Pop is also a genre that has little
variation. Critics who praise musicians for their originality and new sounds may penalize
an artist’s repetition and lack of variation by giving them a lower score. On the other
hand, Indie Rock artists may be spared a brutal experience of The Slump because there

6
are so few of them in the overall market. Their releases would be more coveted and
therefore more graciously received due to their rarity as a limited resource. There is also
much more variation of sound and experimentation in the ‘Indie’ and ‘Alternative’
movements. Critics who may assign higher scores to more innovative acts favor these
traits.
Number of years between album releases may also be a component in the
downfall of formerly well-received musicians. The music industry is a highly competitive
market. Musicians are constantly under pressure from their labels to produce hit records
and they must continue to produce music in order to stay relevant. In this environment,
musicians who spend less time on the quality of their work in favor of producing work
quickly may suffer under the critique of professionals in the industry. This quantity-
quality tradeoff is common in many industries where there is a lot of pressure to produce
more and more output. It is therefore not surprising that The Slump would be present in
these industries.
Metacritic is a website that collects the opinions of the most respected online and
in print critics of movies, music, TV shows, DVDs, and games, and aggregates them to
produce a single score, called the Metascore. A decrease in the Metascore for a highly or
generally favorable band or musician between the first and second album is indicative of
the presence of the Sophomore Slump. Because Metascore reports on the genre and year
of release for all albums included in their database for a musician’s discography, the role
that these factors play in the presence of The Slump can be measured.
A decrease in the overall score between the first and second album could be
explained by one of these two factors. If this is the case, musicians who wish to have an

7
increasingly successful career in the music industry could be advised to produce music of
a certain genre or to pace their album releases in order to decrease the severity of their
encounter with The Sophomore Slump or avoid it altogether.
The purpose of this paper is to observe whether or not the genre or the number of
years that pass between the release of the first and second album weigh in on how
severely a band or musician suffers from the Sophomore Slump. First, I summarize
literature on The Slump in related areas of study. Next, I develop an empirical strategy to
test my hypothesis and describe the data used for analysis. Finally, I discuss my findings
and conclude with remarks regarding the implications of my work.
2 Literature Review
There have been many studies that have resulted in the publishing of literature
regarding the nature of the Sophomore Slump. Much of this research has been centered
on the subject of competitive athletes performance. However, there is an observable
occurrence of The Slump in many parts of society.
Golden (1995) noted that the briefest of searches would reveal that this
phenomenon of The Sophomore Slump is not strictly isolated to the sports industry, but
permeates through organizations, nations, and most importantly, the entertainment
industry. His book Sophomore Slumps: Disastrous Second Movies, Albums,
Singles, Books, and Other Stuff identifies huge successes followed by unfortunate
failures. For his research, the musical act must have hit number one in the pages of
Billboard magazine, which measures national sales and airplay of music, to be included.
He defines The Slump as a drop from number one to forty or below. Excluded from

8
Golden’s data are one-hit wonders. A number of the artists in my data set have only
released two albums to date. Further research will need to be done to determine whether
or not they will turn out to be one-hit wonders. Regardless of this exclusion, Golden
emphasis that the Sophomore Slump is an important event to observe, note, and analyze,
no matter how large or small. Golden does not identify explanatory variables that account
for the slip of the musical acts.
More closely related to the topic of this paper is research done on prize winning
and productivity. Research conducted by Borjas and Doran (2013) studied the
correlation between receiving the Fields Prize (thought of as the “Nobel Prize of
Mathematics”) and the productivity of mathematicians after they win. The explanatory
variables included number of papers published, citations received, and students mentored
post-win. Their study found that after winning the prestigious award, the winner’s
productivity declined. Half of this decline can be attributed to the increased desire for
experimentation in other more abstract fields. They also noted that receiving the award at
a young age (the award is given out to those under 40) contributes to the decrease in
productivity post-win.
Their findings are relevant to the Sophomore Slump as indicated by a drop in
Metascore for individual musicians. The work leading up to a band’s first album release
is parallel to the work of mathematicians and other researchers. The best effort is put in in
anticipation of the future payoff, i.e., garnering universal or favorable critical acclaim
with the release of the first album. Much like scientific research, this first album typically
has years of quality work and personal investment behind it. In application, Borjas and
Doran’s study implies that when bands earn the most prestigious prize of releasing that

9
first record, when the band is “young” and first starting out in its career, and the album is
well received, that a decline in Metascore rating will be observed as the band takes this
win and the liberties that come with it to experiment with their next album, which may be
less of a critical hit. Bourdieu (1985) would argue that this experimentation with the
second album is a result of the artist’s intention to be autonomous in his or her
production, to be the sole master of their product. He calls this effort the production of an
‘open work’ which subverts the mainstream ideology of producing revenue-generating
outputs and instead reverts back to the old hierarchal system of doing and saying as one
pleases for the sake of the art.
King (2007) looks at the 2003 U.S. market for movies and observed that there was
zero correlation between critic ratings for films and gross box office earnings. The study
differentiated between movies released on more than 1,000 screens and films with limited
releases (foreign films, domestic films, and documentaries). King notes that films with
only limited openings received higher than average ratings. The same may be true for
music in that genres that are less represented, less plentiful in the market, may received
higher ratings from critics and experience less of a percentage drop in Metascore.
Kennedy (2008) similarly examines the correlation between critical reviews and
predicting box office success in the importance of economic decision-making.
Particularly, in how many screens the movies should open on. In the study, Kennedy took
data from 220 movies released in 2007. His variables were domestic box office grosses,
opening weekend theaters, production costs (when given), domestic weekly box office
grosses for 22 selected movies, and Metacritic score for movies that had at least 10
reviews in both the critical and user review categories. The results suggested that while

10
there was no significant proof that it is profitable to release a film in more theaters if they
anticipate good reviews, it makes very much sense that a positive review will have a
positive effect on box office success and negative reviews will result in less consumer
interest and therefore a lackluster performance.
Galenson and Weinberg (2000) estimated the relationship between artists’ ages
and the value of their paintings. The study looked at two groups of modern painters, the
first born between 1900 and 1920, and the first between 1921 and 1970. The study found
that a substantial decline occurred over time in the age at which these artists produced
their most noteworthy work. The study argues that this decline was caused by a shift in
the nature of the demand for modern art during the 1950s, when the demands for
contemporary art skyrocketed. Their two cohorts where born either before (1900-1920) or
during/after (1921-1940) this shift in demand. The shift is noted to favor innovation as
the factor that marks up the premium on a piece of work. Experience was no longer a
factor of value in the work an artist created, and as such, the age at which “successful”
artists produced their “best” work declined drastically.
Caves (2000) suggests that the success of an album is not the sole responsibility
of the artist. He notes the music industry as one that is run by contracts, and that the
analysis of these may be the key to understand the observable behaviors that are
characteristic of certain genres (i.e., The Slump in entertainment industries). While the
musical act is responsible for producing the product, it is up to the discretion of the
record label to manufacture, distribute, and promote the album. According to Caves, the
consumers’ reaction to the end product, the album, is unpredictable. Therefore, it is up to
11
both the musician and the label to reduce the uncertainty of the prediction by maximizing
the expected value of the album.
These studies are only partially related to the underlying scope of this paper,
which is to determine whether or not there are explanatory variables that can indicate
why some musical acts experience the slump more severely than others. The general
structure of models like Borjas and Doran and Kennedy are interesting examples of what
studies surrounding the Sophomore Slump in record sales should look like.
I am not aware of any studies that specifically examine how the genre or number
of years between release dates, or any other explanatory variables, affects the severity of
The Sophomore Slump in music. However, recent studies show that performance in the
movie industry is significantly affected by being a sequel, release dates, genre, and other
ex ante factors (De La Cruz and Pedace (2011)).
3 Data
Metacritic (Metacritic.com) is the source for all of the data. Metacritic is widely
used by music consumers and critics and is broadly applied to discussions surrounding
the performance of products in many different forms of media both online and in other
industry outlets. The original sample contained 100 randomly selected bands or
musicians who experienced a drop in Metascore of at least 4 points between their debut
album and their second album. In total, 200 albums were included in the data. The bands
fall into 9 categories: Pop, Pop Rock, Rock, Alternative, Rap, R&B, Indie Rock, Dance,
and Electronic. These categories were the most prolific on Metacritic and had the most
artists who fit the profile of having had a debut and follow-up album that are reviewed by

12
Metacritic. All bands and musicians released their first album between 2000 and 2012
and their second album between 2003 and 2013.
The values for the Metascore of each album are taken from each album’s page on
Metacritic.com. The release dates for each album are used to determine how much time
passed between the first and second album release. It is important to note that the year of
release for each album was taken solely from Metacritic. I am aware that this data may
slightly differ from other sources (such as Wikipedia) for certain albums.
Due to differing opinions from critics, fans, and musicians themselves, it can be
very difficult to label a musician under one particular genre of music. The category of
music that an artist falls under may differ either slightly or drastically depending on the
source. In this study, information used to classify artists into genre is extracted solely
from Metacritic.com. Musicians are constantly experimenting with different styles of
music. Each album that a musician releases may slant toward a different genre. For
example, a rock band’s first album may be more Alternative, while the second is more
Indie. Furthermore, due to this experimentation, a rock band may decide to release a hip-
hop album but still identify as a rock band. Metacritic will sometimes include multiple
genre tags for a single album or artist. For the purposes of this set of data, musicians were
labeled based on the first genre label on the list assigned to them by Metacritic.com.
Musicians were included in this study only if they were observed to show consistency
between their first and second album in the labeling of the genre of their music. This
inclusion or exclusion of persons was done in order to avoid any egregious mislabeling.
Metacritic is one of many usable variables that measure the success of a
musician’s follow-up efforts to a generally favorable debut album release. It is not

13
without its own biases and flaws. Metacritic as a measure of quality is biased toward the
opinion of the professional critic. It does not account for the feelings of the consumer
whose ultimate consumption of the material generates revenue (although the two are
generally positively correlated). I use an album’s Metascore in this study in place of
generated revenue or number of units sold, which also has their own weaknesses.
Metacritic is used in place of sales because of the lack of accessible sales data. The
Metascore is also used instead of data from the Recording Industry Association of
America (RIAA), which awards Gold, Platinum, Multi-Platinum and Diamond
certification based on the number of albums sold or Nielsen SoundScan, the official
information and sales tracking system for Billboard music charts and the music industry.
RIAA awards certification based on albums and singles sold through retail markets.
Based on past gross discrepancies in number of units sold versus number of units shipped
(an album may ship multi-platinum but only sell gold) between data collected from RIAA
versus Nielsen SoundScan, the use of number of units sold has been deemed unreliable
for the purposes of this study.
I chose Metacritic because of its accessibility and affordability. Users and
researchers may simply go to the website and type in the name of a musician, band, or
artist and is provided access to the Metacritic database. This greatly reduces the work of
contacting each individual record label for the data of each individual musician. Having
tried this tactic, I will say that is very time consuming and that labels are very hesitant to
put this information straight into the hands of the general public. Using Metacritic is also
a good economic substitute for purchasing the data for Nielsen SoundScan, which is both
expensive for, and inaccessible to the average music consumer.

14
The Metascore, the score given to an album by Metacritic, is calculated from
actual professional critic scores. The website takes a large group of the community’s
most respected and prolific critics and assigns scores to their reviews. From there, a
weighted average is given to the album to summarize a range of opinions, thus reducing
individual biases based on music, artist, and genre preference. There are at least four
professional critic reviews that are averaged in order to derive the Metascore. The
weighed nature of the score comes from the method that Metacritic applies in assigning
more importance to some critics and publications than others based on “quality and
overall stature”. According to the website, more regarded sources are given more weight.
The resulting weighted average score is normalized on a bell curve in order to prevent
score clumping.
On Metacritic, site users and consumers may assign scores to albums based on
their satisfaction with the product. However, the final Metascore does not include user
votes. Fan scores are influenced by a number of consumer behaviors that are unrelated to
whether or not an album was successfully executed. The exclusion of this variable
eliminates fan and consumer bias, which may contribute to well mixed, high quality
records selling very few copies or a critical failure successfully selling millions.
Metacritic, much like the aforementioned sources of data like RIAA and Nielsen
SoundScan, is not perfect. While the Metascore does exclude the emotional, loyalty-
driven opinion of the consumer in its weighed average, there is still a bias in the scoring
of albums through the site. How much weight each professional critiquing source or
publication is given is subject to criteria that Metacritic itself assigns. How does
Metacritic decide which sources are of the highest, higher, low, and lowest qualities? The

15
lack of answers to this question, and to the larger question of what is the formula that
Metacritic uses to aggregate professional critic scores has the website under fire from a
number of product reviewers and user forums. The Metacritic formula is not shared with
the public and the website has given no indication that they plan to reveal its opaque
practices. Even with this uncertainty in scoring, there is no indication that Metacritic
differentially evaluates the first of second album of the same artist. For this reason, it is a
good measure of successive success and the obscure nature of Metacritic’s scoring is of
no consequence.
There is an inconsistent relationship between the Metascore and album success in
terms of units sold for the acts included in this data set. Some, like Florence and the
Machine, sold fewer albums on their second album than on their first and likewise had a
decrease in Metascore between their first and second album. Artists like Keri Hilson,
however, sold more copies of her second album (8,000 more) even though it was less of a
critical success. The album also received a lower Metascore (11 points lower) and
debuted lower on the Billboard 200 than her first album. This is one of the reasons as to
why the Metascore is used instead of number of units sold; units sold measures the
commercial success of a musical artist, but not necessarily the quality of the album,
which is usually judged by professional critics like those whose opinions are included in
Metacritic’s Metascore.
Metacritic, while being a cheap and accessible source of data, is not unlimited.
Only having launched 12 years ago in 2001, it is sorely lacking insightful data on some of
the most prolific and beloved musicians, bands, and artists to date. It does not include a
score for any musician or album that a user may type in on a whim. If it does have data

16
information for a particular musician, the entry may only include partial review data for
that musician’s discography, thus delivering an incomplete picture of the overall quality
and consistency in a musician’s career. For my analysis, this limits my ability to observe
whether or not the musical acts that I include in my study have an overall downward
trend in success over the course of their career or if they fit the limited definition of The
Sophomore Slump used in this study by seeing a decrease just between the first and
second album.
4 Empirical Methodology
As there is no previous research to serve as a model, the empirical model experimentally
includes only two characteristics of an album as explanatory variables. These are
primarily used to serve as examples of the types of variables that may explain the
difference in severity of the Sophomore Slump experience among musical acts. Using a
limited sample of music data, the initial model is:
!! =∝ +!!! + !! (1)
Where i denotes the musical act (band or musician). Y is the percentage drop in
Metascore for an individual band or musician, i. and ! is a vector of the dependent
variables such as time between album releases and indicators for genres. ! is the error
term. This methodology allows me to study associations between the Metascore and
different attributes of the albums.

17
A second equation is also used:
!!" =∝ +!!"#$%2!" + ! ∗ !! + !!" (2)
Where i denotes the musical act (band or musician). Y is the drop in Metascore for an
individual band or musician and j indicates the first or second album. !"#$%2! is an
indicator for the second album for each band or artist. !! denotes characteristics of an
artist such as genre. In my data set, this only varies by band; i. !!" is the error term.
The sample selection of bands and musicians in this study are being used to
generalize for the overall population of musical acts in the industry, but there may be
limits to these data in terms of how representative they are of the population as a whole
over the entire time in which there has been a comprehensive music industry. It should be
noted that the bands and musicians used in this study are fairly young, having debuted
only in the past 13 years. There is also variance in the ages of the genres themselves. For
instance, Pop as a movement has been recognized by the industry longer than Indie Rock.
Newer genres may be perceived as fresher in the opinions of critics who may assign
higher scores to them than to older genres that grow stale over time. I do not think that
we have much to worry about in terms of how these factors and the sample selection of
the musical will affect the results of this study. Every few years, there is a shift in the way
that critics evaluate music, much like the shift in artistic value identified by Galenson and
Weinberg, as consumer tastes fluctuate. There are also a number of new sources to
evaluate music, as critics retire and new music rating magazines and websites appear.

18
Before running any analysis, I expected to find that genres like Pop and R&B,
which have a dominate presence on radio stations, music video programs, and YouTube,
have a lower mean Metascore than less pervasive genres such as Electronic and Indie
Rock, for which less music is released and as there are fewer bands in the industry who
fit into these categories. As expected in Table 2, Pop had a mean Metascore of 66.05.
This was in comparison to genres like Electronic and Indie Rock, which had mean
Metascores of 72.68 and 72.03 respectively. These values in relation to the population
average, which was 70.895 points, indicate that Pop bands see lower Metacritic scores
than any other genre included in this study.
I also expected to find that Pop bands would see a more dramatic percentage drop
in Metascore than any other genre. As Table 3 indicates, this was surprisingly not the
case. None of the genres had vastly contrasting percentage drops in Metascore. The Pop
Rock genre saw the smallest percentage drop while Rap was observe to have the highest
percentage drop, followed closely by Dance and Pop.
5 Results
The Sophomore Slump is strongly present in the data set used in my study. As
shown in Table 1, the drop in Metascore between the first and second album for the
population was 10.39 points on average. A regression run on the change in Metascore
between the two albums revealed that this is a very statistically significant drop between
the scores of a musical act’s first and second album. This definitively identifies the
presence of the Sophomore Slump amongst this group of bands and musicians.
19
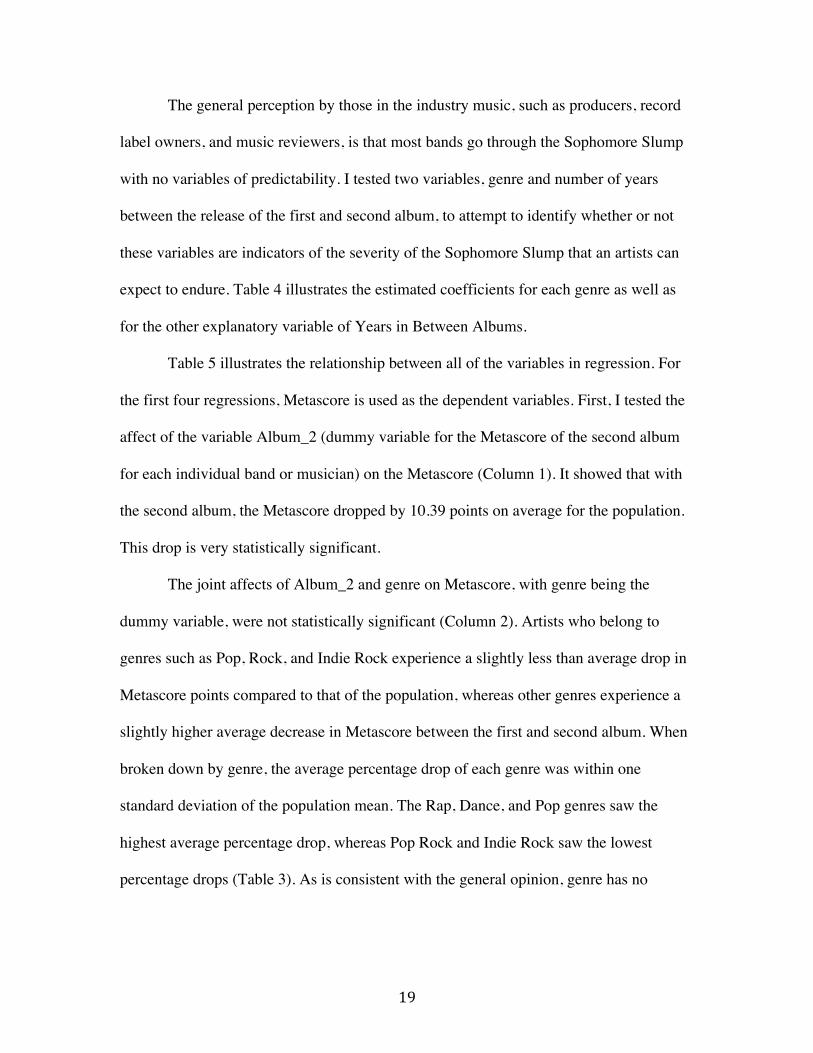
The general perception by those in the industry music, such as producers, record
label owners, and music reviewers, is that most bands go through the Sophomore Slump
with no variables of predictability. I tested two variables, genre and number of years
between the release of the first and second album, to attempt to identify whether or not
these variables are indicators of the severity of the Sophomore Slump that an artists can
expect to endure. Table 4 illustrates the estimated coefficients for each genre as well as
for the other explanatory variable of Years in Between Albums.
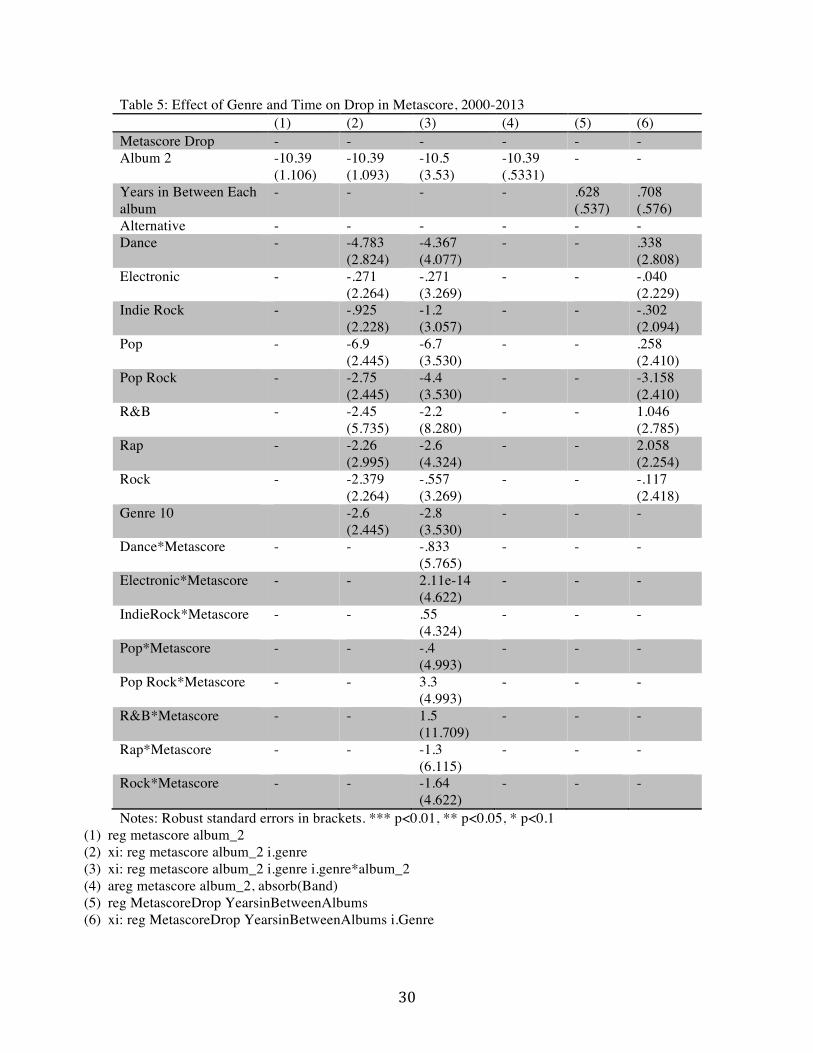
Table 5 illustrates the relationship between all of the variables in regression. For
the first four regressions, Metascore is used as the dependent variables. First, I tested the
affect of the variable Album_2 (dummy variable for the Metascore of the second album
for each individual band or musician) on the Metascore (Column 1). It showed that with
the second album, the Metascore dropped by 10.39 points on average for the population.
This drop is very statistically significant.
The joint affects of Album_2 and genre on Metascore, with genre being the
dummy variable, were not statistically significant (Column 2). Artists who belong to
genres such as Pop, Rock, and Indie Rock experience a slightly less than average drop in
Metascore points compared to that of the population, whereas other genres experience a
slightly higher average decrease in Metascore between the first and second album. When
broken down by genre, the average percentage drop of each genre was within one
standard deviation of the population mean. The Rap, Dance, and Pop genres saw the
highest average percentage drop, whereas Pop Rock and Indie Rock saw the lowest
percentage drops (Table 3). As is consistent with the general opinion, genre has no

20
statistically significant positive or negative affect on the drop in Metascore. The affects of
The Slump are universal across all genres.
Running the same scenario, but accounting for the influence of the genre on
Album_2, also proved to be statistically insignificant (Column 3). In Column 4, I
absorbed the categorical factor Band (each individual artist or musician) and looked for
the affect of Album_2 on the Metascore. Taking this into consideration, there is a slightly
higher decrease in Metascore of 10.5 points, but this is not statistically significant.
I then shifted to using the second empirical model, where drop in Metascore is the
dependent variable. I tested for the affect of years in between each album on the drop in
Metascore (Column 5). I followed up by including genre as a dummy variable (Column
6). Bands who waited an extremely short (less than a year) or extremely long time (more
than four years) after dropping their first album to release their follow-up experienced a
much lower percentage drop in Metascore than the sample population, while bands that
waited one year, two years, and four years to release their second album saw about the
same drop as that of the population. Much like the first, however, this second variable
also proved to have no statistically significant bearing on the drop in Metascore between
albums. This is again in line with the previously accepted opinion that the number of
years that pass between the release of the first and second album are not indicative of the
severity of experience with the Sophomore Slump.
6 Conclusion
When reading about the success or lack there of, of a particular band or musician
to produce a follow-up to generally successful album, there seems to be no observable
21
reason as to why some bands see a small drop in success and others seem to mudslide
into unpopularity. The presence of more or less of a certain brand of music on the market
seems to be enough of an indication as to why some critics rate some bands more harshly
than others. The goal of this study was to examine the role that the genre and pressures
from the industry to release music more or less often to stay relevant play in the drop of
Metascore between two albums.
I estimated my model of Sophomore Slump severity using the Metascore and the
percent change in Metascore as the dependent variables. The explanatory variables
include genre and number of years between albums. Using these two variables, my
empirical strategy was to examine how The Slump could be avoided in severity, or
altogether, by bands and their record labels.
Overall, the results suggested that neither of my chosen variables are factors in the
predicable magnitude of The Slump, as neither was observed to have a statistically
significant affect on Metascore or the percent change in Metascore. This outcome is
consistent with the widely held view that it is difficult to measure how severe the Slump
will be for an individual musical act. In the end, the hypothesis that the severity of The
Slump can in fact be measured based on the chosen variables is not supported.
In order to understand the disparity in second album success for individual artists,
more research is needed. This study has provided some evidence that there is in fact some
measurable phenomenon, such as the highly debated Sophomore Slump, that is present in
the music industry, although the genre of the band in question is not likely to be the
source of the unequal severity. In the same vein, the number of years between the release

22
of the debut and sophomore album makes for an unlikely cause for the observed variance
in drop in Metascore for each performer.
Future work in this area could expand on this study in a number of ways. First,
there was very little variance in Metascore of all 200 albums analyzed. Very few albums
were scored above 90 or below 40. Because the sample size is so limited, an increase in
sample size particularly in bands that fall to these extremes may yield more definitive
results. It also may be beneficial for an individual or group of individuals to test for
Sophomore Slump severity using a different source of data, such as the Nielsen
SoundScan data. Finally, subsequent research should test other variables (more), perhaps
on the side of demand, that could account for Slump severity, such as shifting musical
climates, consumer spending (during recessions or times of high unemployment), and the
availability of free music on the Internet.
There also may be other reasons as to why a band or musician does not do as well
on their second album as on their first. Different types of record labels, for example,
could have produced each album (this was in fact the case for many of the musical acts
included in this study). The first could have been released by a major label while the band
could have moved to an indie label, or self-produced for the second. These differences
could account for how much time a musical act is allotted in order to produce the
sophomore album and could cause access to quality equipment, production guidance (the
wisdom of big names in the music production industry), marketing resources, and
monetary resources, to vary.
The debut year of a band may also play a part in why the success of a musical act
on their first album may not carry on to their second album. “Buzz bands”, as defined by

23
the website hipsterrunoff.com, receive a large amount of both critical and consumer
acclaim depending on how well they fit the trend of what is “in”, in a particular moment.
As consumer and reviewer taste change over time, the sound that catapulted a band to
overnight success in one year may not be at a premium in subsequent years.
Also, it may be revealing to explore other possible explanatory variables such as
revenue spent on marketing, or designating the user scores on Metacritic as the dependent
variable and critic rating as an explanatory variable, or even creating a new scoring
system that takes both of these measures into account.
An interesting issue to tackle is the way in which we define the Sophomore
Slump. Is a decrease in the score between the first and second album, followed by a
decline from the second to third, third to fourth, and so on, not followed by an eventual
increase also a Sophomore Slump, or evidence of a one-hit wonder? What if the band
rollercoasters between high and low scores with each subsequent release? Is the decline
between the first and second album a Sophomore Slump or the first signs of an
inconsistent act? A limitation of this study is that it does not look beyond the
performance of the second album, as many of the bands have yet to release, or disbanded
before releasing, a third album. Looking at the full career of a band may be helpful in
refining the definition of the Slump and bands that fall under having experienced one.

24
References
Borjas, George J. and Doran, Kirk. 2013. Prizes and Productivity: How Willing the Fields
Medal. NBER Working Paper No. w19445. Available at SSRN:
http://ssrn.com/abstract=2328493
Bourdieu, P. 1984. Distinction: A Social Critique of the Judgment of Taste. Cambridge,
Mass.: Harvard University Press.
Caves, R. E. 2000. Creative industries. Cambridge, Mass.: Harvard University Press
"Certification Criteria." Http://www.riaa.com. N.p., n.d. Web. 13 Oct. 2013.
http://www.riaa.com/goldandplatinum.php?content_selector=criteria
Galenson, David W. and Bruce A. Weinberg. 2000. Age and The Quality Of Work: The
Case Of Modern American Painters. Journal of Political Economy, v108(4,Aug),
761-777.
Golden, Christopher. 1995. Sophomore Slumps: Disasterous Second Movies, Albums,
Singles, Books, and Other Stuff. Secaucus, NJ: Carol Pub. Group. Print.
Kennedy, Alec. 2008. Prediction Box Office Success: Do Critical Reviews Really
Matter? Berkeley Projects.
King, Timothy. 2007. Does film criticism affect box office earnings? Evidence from
movies released in the US in 2003. Journal of Cultural Economics. Springer.
Kruger, J., Savitsky, K., & Gilovich, T. 1999. Superstition and the regression effect.
Skeptical Inquirer (March/April), 24-29.
"Hipster Runoff." Hipster Runoff. N.p., n.d. Web. 20 Sept. 2013.
"How We Create the Metascore Magic." Metacritic. Metacritic, n.d. Web. 20 Sept. 2013.

25
De La Cruz, Guadalupe and Roberto Pedace. 2011. Homogeneity in Hollywood: Sex,
Race, and Discrimination in the Motion Picture Industry.
Shwarz, Alan. 2005. Real Year 2 Curse: Being Good in First Place. New York Times Late
Edition ed., sec. 8: 11. Web. 15 November 2013.

26
Table 1: Analysis Sample Summary Statistics Variable Mean Std Dev Min Max Metascore 70.895 9.381 43 92 Album 1 Metascore 76.090 7.105 58 92 Album 2 Metascore 65.700 8.479 43 87 Drop in Metascore 10.39 5.331 4 31 Years in Between Albums 2.14 .995 0 7 GenreAlternative .1 .301 0 1 Genre Dance .06 .239 0 1 Genre Electronic .14 .349 0 1 Genre Indie .2 .402 0 1 Genre Pop .2 .402 0 1 Genre R&B .06 .239 0 1 Genre Rap .14 .349 0 1 Genre Rock .1 .301 0 1

27
Table 2: Average Metascore by Genre Genre Mean Std. Dev. Min Max Alternative 72.95 9.811 53 91 Dance 68.167 10.134 47 86 Electronic 72.678 10.360 44 90 Indie Rock 72.025 7.614 58 87 Pop 66.05 10.050 43 82 Pop Rock 70.2 6.429 60 83 R&B 70.833 8.398 54 87 Rap 71.571 11.676 48 92 Rock 70.35 7.597 59 85

28
Table 3: Percentage Drop in Metascore by Genre Genre Mean Std. Dev. Min Max Alternative .137 .068 .051 .264 Dance .154 .080 .052 .254 Electronic .135 .094 .049 .413 Indie Rock .128 .065 .046 .256 Pop .153 .070 .060 .259 Pop Rock .097 .024 .062 .135 R&B .137 .074 .010 .191 Rap .160 .087 .054 .342 Rock .133 .048 .063 .218

29
Table 4: Drop in Metascore Model Estimates Explanatory variable Coefficient Standard Error Years in Between Albums 0.708 0.609 GenreAlternative 0.338 2.863 Genre Dance -0.040 2.402 Genre Electronic -0.302 1.964 Genre Indie 0.258 2.153 Genre Pop -3.158 1.632 Genre R&B 1.046 2.557 Genre Rap 2.058 2.324 Genre Rock -.117 2.007
30
Table 5: Effect of Genre and Time on Drop in Metascore, 2000-2013 (1) (2) (3) (4) (5) (6) Metascore Drop - - - - - - Album 2 -10.39
(1.106) -10.39 (1.093)
-10.5 (3.53)
-10.39 (.5331)
- -
Years in Between Each album
- - - - .628 (.537)
.708 (.576)
Alternative - - - - - - Dance - -4.783
(2.824) -4.367 (4.077)
- - .338 (2.808)
Electronic - -.271 (2.264)
-.271 (3.269)
- - -.040 (2.229)
Indie Rock - -.925 (2.228)
-1.2 (3.057)
- - -.302 (2.094)
Pop - -6.9 (2.445)
-6.7 (3.530)
- - .258 (2.410)
Pop Rock - -2.75 (2.445)
-4.4 (3.530)
- - -3.158 (2.410)
R&B - -2.45 (5.735)
-2.2 (8.280)
- - 1.046 (2.785)
Rap - -2.26 (2.995)
-2.6 (4.324)
- - 2.058 (2.254)
Rock - -2.379 (2.264)
-.557 (3.269)
- - -.117 (2.418)
Genre 10 -2.6 (2.445)
-2.8 (3.530)
- - -
Dance*Metascore - - -.833 (5.765)
- - -
Electronic*Metascore - - 2.11e-14 (4.622)
- - -
IndieRock*Metascore - - .55 (4.324)
- - -
Pop*Metascore - - -.4 (4.993)
- - -
Pop Rock*Metascore - - 3.3 (4.993)
- - -
R&B*Metascore - - 1.5 (11.709)
- - -
Rap*Metascore - - -1.3 (6.115)
- - -
Rock*Metascore - - -1.64 (4.622)
- - -
Notes: Robust standard errors in brackets. *** p<0.01, ** p<0.05, * p<0.1 (1) reg metascore album_2 (2) xi: reg metascore album_2 i.genre (3) xi: reg metascore album_2 i.genre i.genre*album_2 (4) areg metascore album_2, absorb(Band) (5) reg MetascoreDrop YearsinBetweenAlbums (6) xi: reg MetascoreDrop YearsinBetweenAlbums i.Genre