muskwa-kechika management area planning...
TRANSCRIPT

MUSKWA-KECHIKA MANAGEMENT AREA
PLANNING AND RESEARCHINTEGRATION
PROJECT(M-K-2004-2005-28)
REPORT
Prepared for:
Ministry of Sustainable Resource Management400-10003-110 Avenue
Fort St. John, B.C.V1J 6M7
Prepared by:
Timberline Forest Inventory Consultants Ltd.1579 9th Avenue
Prince George, B.C.V2L 3R8
and
Alpha Wildlife Research and Management229 Lilac Terrace,
Sherwood Park, AlbertaT8H 1W3
August 2005

MUSKWA-KECHIKA MANAGEMENT AREA PLANNING AND RESEARCH INTEGRATION PROJECT - i
Executive Summary
Under the Muskwa-Kechika Act (Bill 37) all management and planning in the Muskwa-KechikaManagement Area (M-KMA) must be conducted in accordance with the Muskwa-Kechika ManagementPlan. Five local strategic plans created under the direction of the management plan guide variousoperational activities. The five local strategic plans named under the Muskwa-Kechika Act and themanagement plan are:
• Landscape Unit Objectives,• Pre-Tenure Plans,• Recreation Management Plan,• Parks Management Plan, and• Wildlife Management Plan.
Each of these local strategic plans are in various stages of completion. Those which have been completedprovide a number of objectives for resource management.
Since it’s inception in 1997 the Muskwa-Kechika Advisory Board has directed funding to a number ofprojects covering a wide range of values and priorities including support of the development of the localstrategic plans, promoting awareness, research, and information management.
The Minsitry of Sustainable Resource Mangement seeks to provide recommendations on improvement tothe planning and management regime in the Muskwa-Kechika Management Area (M-KMA), to identifythe need for additional management decision support tools, and to assist in their development for thebenefit of regulators, managers and users. The recommendations will be developed through threeobjectives:
1. Assessment of the inventory and research for the M-KMA, plus identification of gaps in each.2. The development of a program for continuing cohesion and completeness in inventory and
research for the M-KMA.3. Development of a report proposing a framework for additional decision-support tools to be used
by managers and users.
In meeting the first of these objectives the Minsitry of Sustainable Resource Mangement has contractedTimberline Forest Inventory Consultants and Alpha Wildlife Research and Management to:
1. Catalogue the current state of resource inventories in the M-KMA2. Catalogue the research currently available for the M-KMA3. Provide an assessment of:
a. Gaps in our resource inventory, which are pertinent to the objectives of the LocalStrategic Plans and the Muskwa-Kechika Management Plan.
b. Gaps in our research knowledge relative to land resource management decisions that arelikely to arise.
Two needs were identified during the process of assembling M-MKA projects and local strategic planobjectives that limited the ability to conduct a detailed, objective-specific gap analysis:
1) Local strategic plan objectives require considerable refinement, more detailed definitionand coordination across local strategic plans before detailed inventory and research needs(gaps) can be identified; and

MUSKWA-KECHIKA MANAGEMENT AREA PLANNING AND RESEARCH INTEGRATION PROJECT - ii
2) A system to track and manage M-K Advisory Board funded projects is required. Thissystem must identify projects that have been proposed and / or funded, must track theprogress of multi-year projects, and should store and manage project deliverables onceprojects have been competed.
Given these current needs, a more general value-based approach to gap analysis was used and aframework for addressing the refinement and coordination of local strategic plan objectives is provided.
In accomplishing this task, a searchable MS ACCESS database has been developed to archive andmanage the catalogue of available research and inventory information as well as the catalogue ofmanagement objectives summarized from the available local strategic plans. Objectives and projects(research and inventory) are contained in separate tables within the same MS ACCESS database. Queriesand reports have been developed to summarize the information in a number of different ways. Customreports and queries may be developed to summarize the information to meet specific needs. As objectivesare refined and new inventory and research projects completed, this database can be updated andmaintained. Much of the information contained within the database has been summarized in thefollowing report. A complete list of objectives and projects has been included in Appendix I andAppendix II of the report, respectively.

MUSKWA-KECHIKA MANAGEMENT AREA PLANNING AND RESEARCH INTEGRATION PROJECT - iii
Table of Contents
1.0 BACKGROUND..................................................................................................................................... 1
2.0 METHODOLOGY ................................................................................................................................. 3
2.1 CATALOGUE OF MANAGEMENT OBJECTIVES............................................................................................... 32.2 CATALOGUE OF EXISTING INVENTORIES AND RESEARCH ............................................................................ 42.3 GAP ANALYSIS.......................................................................................................................................... 5
3.0 RESULTS ............................................................................................................................................... 6
3.1 LOCAL STRATEGIC PLAN OBJECTIVES ........................................................................................................ 63.2 RESOURCE INVENTORIES ........................................................................................................................... 6
3.2.1 Vegetation Resources Inventory (VRI).............................................................................................. 63.2.2 Forest Cover Inventory .................................................................................................................... 73.2.3 Ecosystem Mapping (PEM and TEM)............................................................................................... 73.2.4 Visual Landscape Inventory (VLI) .................................................................................................. 103.2.5 Recreation Opportunity Spectrum (ROS)........................................................................................ 103.2.6 Recreation Features Inventory (RFI).............................................................................................. 113.2.7 Inventories Catalogued Through the Timber Supply Review Process .............................................. 113.2.8 Non-Renewable Resource Inventories ............................................................................................ 14
3.3 IDENTIFIED GAPS IN INVENTORY AND RESEARCH ..................................................................................... 20
4.0 DISCUSSION AND RECOMMENDATIONS..................................................................................... 34
4.1 DEFICIENCIES OF CURRENT PLANNING DOCUMENTS ................................................................................. 344.2 A NEED FOR A SPATIALLY EXPLICIT SUSTAINABLE RESOURCE MANAGEMENT PLAN ................................. 35
5.0 REFERENCES ..................................................................................................................................... 41

MUSKWA-KECHIKA MANAGEMENT AREA PLANNING AND RESEARCH INTEGRATION PROJECT - iv
List of AppendicesAppendix I - Objectives By Sub-Category, Category and Source
Appendix II - Catalogue of M-KMA and Related Projects
Appendix III - Summary of Assessment Reports
Appendix IV - Summary of MINFILE Reports
Appendix V - Summary of British Columbia Age Data Reports
Appendix VI - Summary of Multi-Sensor Geophysical Surveys
Appendix VII - Summary of Rock Geochemistry Surveys
Appendix VIII - Summary of MEM Reported Petroleum and Natural Gas Wells
Appendix IX - Summary of Reported Petroleum and Natural Gas Surveys

MUSKWA-KECHIKA MANAGEMENT AREA PLANNING AND RESEARCH INTEGRATION PROJECT - v
List of TablesTABLE 1: NUMBER OF OBJECTIVES BY LOCAL STRATEGIC PLAN ........................................................................... 6TABLE 2: SUMMARY OF VRI AND FOREST COVER INVENTORIES ........................................................................... 7TABLE 3: SUMMARY OF ECOSYSTEM INVENTORIES............................................................................................... 8TABLE 4: SPECIES MATRIX OF COMPLETED WILDLIFE HABITAT RATINGS. ............................................................ 9TABLE 5: SUMMARY OF VISUAL LANDSCAPE, RECREATION OPPORTUNITY SPECTRUM, AND RECREATION
FEATURES INVENTORIES..................................................................................................................... 11TABLE 6: INVENTORY INFORMATION USED IN TSR III FOR THE FORT NELSON TSA (FOREST ECOSYSTEM
SOLUTIONS, 2004).............................................................................................................................. 12TABLE 7: INVENTORY INFORMATION USED IN TSR II FOR THE FORT ST. JOHN TSA (B.C. MINISTRY OF
FORESTS, 2002) ................................................................................................................................. 13TABLE 8: INVENTORY INFORMATION USED IN TSR II FOR THE MACKENZIE TSA (B.C. MINISTRY OF FORESTS,
2001)................................................................................................................................................. 14TABLE 9: REPORTED COAL FINDING IN THE M-KMA. ........................................................................................ 16TABLE 10: INITIAL SEARCH OF GEOSCAN FOR THE M-KMA. ............................................................................. 19TABLE 11: GENERAL TIMELINE FOR IMPLEMENTATION OF AN SRMP. ................................................................... 39
MUSKWA-KECHIKA MANAGEMENT AREA PLANNING AND RESEARCH INTEGRATION PROJECT - vi
List of AcronymsAMA Access Management AreasARIS Assessment Report Indexing SystemBCGS B.C. Geological SurveyCAD Conservation Area DesignCCRS Canada Centre for Remote SensingELU Ecological Land UnitsESS Earth Sciences SectorGIS Geographic Information SystemGSB B.C. Geological Survey BranchGSC Geological Survey of CanadaLRMP Land and Resource Management PlanMEM B.C. Ministry of Energy and MinesMEMPR B.C. Ministry of Energy, Mines and Petroleum ResourcesM-KMA Muskwa-Kechika Management AreaMOF B.C. Ministry of ForestsMSRM B.C. Ministry if Sustainable Resource ManagementNGR National Geochemical ReconnaissanceNRC Natural Resources CanadaNTS National Topographic SystemOGC B.C. Oil and Gas CommissionPAG Public Advisory GroupPDR Petroleum Development RoadsPEM Predictive Ecosystem MappingPTP Pre-Tenure PlanRFI Recreation Features InventoryRFP Request For ProposalRGS Regional Geochemical SurveyRISC Resource Inventory Standards CommitteeRMZ Resource Management ZoneROS Recreation Opportunity SpectrumSFM Sustainable Forestry ManagementSRMP Sustainable Resource Management PlanTEM Terrestrial Ecosystem MappingTSA Timber Supply AreaTSR Timber Supply ReviewURP Uranium Reconnaissance ProgramUTM Universal Transverse MercatorVLI Visual Landscape InventoryVRI Vegetation Resources InventoryWLAP B.C. Ministry of Water, Land and Air ProtectionWHR Wildlife Habitat RatingWTP Wildlife Tree Patch

MUSKWA-KECHIKA MANAGEMENT AREA PLANNING AND RESEARCH INTEGRATION PROJECT - 1
1.0 Background
The Muskwa-Kechika Management Plan was adopted through an order-in-council in October 1997,thereby creating the Muskwa-Kechika Management Area (M-KMA). The Management Plan, based ondirection from the Fort Nelson and Fort St. John Land and Resource Management Plans1 (LRMP),identifies the objectives from each LRMP that are to apply to the M-KMA. Further, the ManagementPlan defines five local strategic plans that, once completed, will guide operational activities in the M-KMA, consistent with LRMP objectives:
Landscape Unit ObjectivesGuides forest and range use under the Forest Practices Code of British Columbia Act.
Pre-Tenure PlansGuides oil and gas exploration and development, as defined by the Memorandum ofUnderstanding Respecting Operational Land Use Planning for Oil and Gas Activity in theNortheast of British Columbia, July 31, 1996.
Recreation Management PlanGuides recreation, as defined by the Memorandum of Understanding RespectingRecreation Planning in the Muskwa-Kechika Management Area, December 1997.
Park Management PlanA plan for the management of a park, ecological reserve or recreation area, as defined byParks, Master Plan Policy, April 15, 1986 and the attached zoning amendment, or theGuidelines Booklet for Management Direction Statements, 1996.
Wildlife Management PlanA plan for wildlife management, as defined by the Planning Guide to WildlifeManagement Areas, September 1996.
Each of these local strategic plans are in various stages of completion. Landscape unit objectives werecreated for the Obo River and Fox landscape units on October 4th, 2002. Pre-tenure plans were completedand approved for four pre-tenure planning areas in the M-KMA in May 2004. The RecreationManagement Plan for the M-KMA was completed in August 2004 and has yet to be approved. The ParksManagement Plan and the Wildlife Management Plan are currently in draft stages. Each of these plansidentifies key issues and outlines a number of objectives for management within the sector of resourcesvalues applicable to the plan.
With the creation of the M-KMA under the Muskwa-Kechika Act (Bill 37) the Muskwa-Kechika TrustFund was created for the following purposes, as defined in the Muskwa-Kechika Act:
(a) to support wildlife and wilderness resources of the management area throughresearch and integrated management of natural resource development; and
1 In 2000, area was added to the M-KMA based on recommendations from the Mackenzie LRMP. However, the M-KMA Management Plan has not been updated to include reference to pertinent sections of the Mackenzie LRMP.

MUSKWA-KECHIKA MANAGEMENT AREA PLANNING AND RESEARCH INTEGRATION PROJECT - 2
(b) to maintain in perpetuity the diversity and abundance of wildlife species and theecosystems on which they depend throughout the management area.
In support of this the Muskwa-Kechika Advisory Board has directed funding to a number of projectssince its inception in 1997. These projects cover a wide range of values and priorities including supportof the development of the local strategic plans, promoting awareness, research, and informationmanagement.
As stated in the Muskwa-Kechika Advisory Board Planning and Research Integration Project Request forProposal No. M-K-2004-2005-28 (the RFP), the MSRM intends to provide recommendations onimprovement to the planning and management regime in the Muskwa-Kechika Management Area (M-KMA), to identify the need for additional management decision support tools, and to assist in theirdevelopment for the benefit of regulators, managers and users. The recommendations will be developedthrough three objectives:
1. Assessment of the inventory and research for the M-KMA, plus identification of gaps in each.2. The development of a program for continuing cohesion and completeness in inventory and
research for the M-KMA.3. Development of a report proposing a framework for additional decision-support tools to be used
by managers and users.
This project achieves the first of these objectives by providing:
1. A catalogue of the current state of resource inventories in the M-KMA2. A catalogue of research currently available for the M-KMA3. An assessment of:
a. Gaps in our resource inventory, which are pertinent to the objectives of the LocalStrategic Plans and the Muskwa-Kechika Management Plan.
b. Gaps in our research knowledge relative to land resource management decisions that arelikely to arise.
The project does not provide a thorough literature review of the body of research and inventoryinformation for the M-KMA. Our assessment of the information is limited to the amount and breadth ofinformation collected relative to resource management objectives. It is anticipated that the results of thisproject will be used to identify information gaps and areas where a more detailed assessment of thequality of information is warranted.
This Planning and Research Integration project represents the first phase of a larger project to providestrategic direction towards the allocation of the Muskwa-Kechika Trust Fund dollars such that the valueof these dollars is maximized relative to the terms of reference of the trust fund and the direction providedby local strategic and higher level plans.

MUSKWA-KECHIKA MANAGEMENT AREA PLANNING AND RESEARCH INTEGRATION PROJECT - 3
2.0 Methodology
This project was broken down into three distinct tasks:
1. Catalogue and review of objective contained in the local strategic plans for the M-KMA;
2. Catalogue of available inventories and research for the M-KMA; and
3. Assessment of gaps in inventories and research relative to the objectives contained within thelocal strategic plans.
2.1 Catalogue of Management Objectives
Local strategic plan documents are the primary source of management objectives for the M-KMA. Thesedocuments are in various stages of completion and approval and are based on direction from the threeLand and Resource Management Plans (LRMP) in the M-KMA. As directed by MSRM, the followinglocal strategic plans, posted on the MSRM M-KMA website were used to catalogue objectives2:
• Local Strategic Recreation Management Plan for the Muskwa-Kechika Management Area Recommended Draft August 2004.
• Order to Establish the Obo River and Fox Landscape Units and Objectives.• Pre-Tenure Plans for Oil and Gas Development in the Muskwa-Kechika Management Area
May 2004.
The Wildlife Management Plan and the Parks Management Plan have yet to be completed and approvedby government. Draft versions of the Wildlife Management Plan were provided for the purposes of thisproject. Several attempts were made to acquire access to the Draft Parks Management Plan resulting insignificant delays to this project and extensions to the project deadline. Eventually the decision was made(in consultation with MRSM representatives) to continue with this project without addressing theobjectives contained in the Parks Management Plan.
Each local strategic plan was reviewed and the objectives from each of these plans are catalogued into anMS ACCESS database, included on the accompanying compact disk. Objectives are organized intocategories and sub-categories and keywords have been established for each objective to facilitatesearching and organization of objectives. The source document, source section, and source sectionheading are also provided for each objective. Four different objectives reports have been created in theMS ACCESS database (see Section 3.1). The first of these reports is provided in Appendix I.
The Fort Nelson, Fort St. John and Mackenzie LRMP documents were reviewed but objectives from theseplans were not explicitly included in the gap analysis as the pertinent objectives from the LRMP were tobe represented in the local strategic plans.
Some inconsistencies in the documentation on the MSRM M-KMA website were identified. In particularthe online version of the M-KMA Management Plan makes reference to sections of the LRMP documentsthat do not exist in the online versions of the LRMP documents.
2 Local Strategic Plans were downloaded from the MSRM M-KMA website(http://srmwww.gov.bc.ca/rmd/lrmp/mk/index.htm) between December 13th, 2004 and December 14th, 2004.
MUSKWA-KECHIKA MANAGEMENT AREA PLANNING AND RESEARCH INTEGRATION PROJECT - 4
2.2 Catalogue of Existing Inventories and Research
Inventory and research information for the M-KMA was collected from a number of sources. Thesesources include:
• The most recent TSR analysis reports for the Mackenzie, Fort Nelson, and Fort St. John timbersupply areas;
• The MSRM M-KMA website;• Various other B.C. Government websites;• Annual M-KMA expenditure plans - 1998 to 2004;• M-KMA Annual Reports – 1998 to 2004;• M-KMA project deliverables;• The Northern Land Use Institute Muskwa-Kechika Annotated Bibliographical Database3;• Personal Communications (see Section 5.0); and• Other pertinent literature.
Muskwa-Kechika Management Area annual expenditure plans were the primary source of information forprojects that have been funded by the Muskwa-Kechika Trust Fund since 1998. Projects from thesedocuments were cross-referenced with project lists provided by the M-KMA Co-ordinator. Manydiscrepancies between these lists of projects were identified with some project deliverables unaccountedfor. There was uncertainty of which proposed projects had been funded. Through discussion withMSRM and other representatives some of these issues were resolved. In some cases the location ofproject deliverables remains unknown. These projects are identified in the searchable MS ACCESSproject database.
Difficulties encountered in assembling project lists and deliverables point to the need for a system tomanage and track projects that have been proposed and / or funded through the Muskwa-Kechika TrustFund. Although outside the scope of this project and not specifically developed for this purpose, thesearchable MS ACCESS project database provided as part of this project accomplishes many of therequired tasks and could be modified to track M-K Trust Fund projects and store deliverables oncecomplete.
Pertinent information from projects not funded by the M-K Trust Fund was collected through discussionswith various industry and government officials and through a review of known literature. Specificindividuals were contacted for information on inventory and research projects pertinent to the M-KMA.These projects are included in the MS ACCESS project database.
B.C. Government websites were queried for standard inventory data for the M-KMA. Information wascollected on:
• Vegetation Resource Inventory (VRI),• Forest Cover Inventory,• Predictive Ecosystem Mapping (PEM),• Terrestrial Ecosystem Mapping (TEM),• Visual Landscape Inventory (VLI),
3 Significant effort was expended in attempting to incorporate entries from the NLUI database into the searchableproject database developed for this project. Arrangements were made with Terra Cognita to develop a datamigration tool. Prior to delivery of the NLUI data it was determined by the University of Northern British Columbia(the stewards of the NLUI database) that University lawyers would have to investigate issues around data ownershipbefore the data could be transferred with no indication of when this review might be completed. Based on this, thedecision was made to continue without this data.

MUSKWA-KECHIKA MANAGEMENT AREA PLANNING AND RESEARCH INTEGRATION PROJECT - 5
• Recreation Opportunity Spectrum (ROS),• Recreation Feature Inventory (RFI), and• Various non-renewable resource inventories.
These findings are included in the MS ACCESS project database and are described in Section 3.2.
Government officials from the ministries of Forest, Sustainable Resource Management, Energy, Minesand Petroleum Resources, and Water, Land and Air Protection were contacted for information on researchand inventory information in the M-KMA.
Finally, the Timber Supply Review documents for the Mackenzie, Fort Nelson, and Fort St. John timbersupply areas were reviewed. A summary of the inventory information used in these analyses is alsoincluded in Section 3.2.7.
2.3 Gap Analysis
The initial intent of this project was to evaluate the inventory and research needs of each objectiverelative to currently available information, providing a list of potential projects required to meet localstrategic plans objectives. However, an assessment of this level of detail is not possible and / or practicalfor a number of reasons:
1. Many local strategic plan objectives are general in nature and do not provide sufficient detail toidentify specific inventory and research needs and thereby conduct gap analysis.
2. Local strategic plans have been developed independent of one another and therefore have createdconflicting and overlapping objectives with varying levels of detail and precision. A process tocoordinate and integrate local strategic plan objectives should be undertaken before a detailed gapanalysis is conducted.
3. The number of management objectives contained within the four local strategic plans reviewed isso large that effective management and monitoring of these objectives is unrealistic. Indicatorsthat measure multiple objectives should be developed and inventory and research needs assessedon these indicators.
Given these difficulties a more general, value-based approach to gap analysis was used to assess generalresearch and inventory needs across the M-KMA. General values or themes were identified through areview of the local strategic and higher level (LRMP) plans. Key objectives under each value statementwere identified and the inventory and research requirements to meet these were established. Theserequirements were cross-referenced with the catalogue of information in the MS ACCESS projectdatabase to determine information and data gaps. Suggested projects that will address these gaps are alsoprovided. Research and inventory needs identified in local strategic plans are incorporated into thisanalysis. The results of the gap analysis is described in Section 3.3 and will be discussed further inSection 4.0.
MUSKWA-KECHIKA MANAGEMENT AREA PLANNING AND RESEARCH INTEGRATION PROJECT - 6
3.0 Results
3.1 Local Strategic Plan ObjectivesIn total 219 objectives were extracted from the four available local strategic plans. Numerous otherobjectives exist in pertinent sections of the Fort Nelson, Fort St. John and Mackenzie LRMP documents.Table 1 shows the number of objectives contained within each of the local strategic plans reviewed.
Table 1: Number of Objectives by Local Strategic Plan
Source Document Number ofObjectives
Draft Wildlife Management Plan 161Pre-Tenure Plans 33
Draft Recreation Management Plan 18Landscape Unit Objectives 7
Each objective has been organized into a category and sub-category in the MS ACCESS database on theCD accompanying this report. Within the MS ACCESS database four different reports have beendeveloped, each providing a different organization of the objectives. These reports can be modified usingthe basic functionality in ACCESS to filter and sort the objectives in a variety of ways. The fourobjectives reports can be found under the Reports tab of the main database window in MS ACCESS andare as follows:
• MKMAObjectives_Cat/Source/SubCat: Objectives grouped by category, source document, andsub-category;
• MKMAObjectives_Source/SubCat: Objectives grouped by source document and sub-category;• MKMAObjectives_SubCat: Objectives grouped by sub-category with category, source
document, and source document section references; and• MKMAObjectives_Keyword: A list of keywords for each objective grouped by source document,
category, and sub-category. These keywords are useful for sorting and filtering objectives.
The MKMAObjectives_SubCat report has been included in Appendix I of this report.
3.2 Resource Inventories
The following sections provide a description of the status of many of the standard inventory productswithin the M-KMA. Appendix II contains a list of inventory and research projects pertinent to M-KMA,based on the available information.
3.2.1 Vegetation Resources Inventory (VRI)Vegetation Resources Inventory is a photo-based, two-phased vegetation inventory program consisting of:
• Phase I: Photo Interpretation• Phase II: Ground Sampling
Within the ground sampling phase, Net Volume Adjustment Factor (NVAF) sampling is a mandatorycomponent that is integral in the calculation of inventory adjustment factors. The Ministry of SustainableResource Management, assisted by the Ministry of Forests and forest licensees, is implementing thecomponents of the VRI.

MUSKWA-KECHIKA MANAGEMENT AREA PLANNING AND RESEARCH INTEGRATION PROJECT - 7
Various VRI initiatives have been completed between 1998 and 2003 by Canfor, Slocan Ft. Nelson (nowCanfor), and Abitibi-Consolidated. The south half of the M-KMA and a fringe along the northeast edgehave been completed to VRI standards using a variety of approaches of either traditional (1:15,000 hardcopy photos) or softcopy (1:40,000 scanned images) methodologies with varying degrees of success andaccuracy. The VRI completed along the southeast edge of the M-KMA was completed to the integratedVRI / Terrain mapping standards being used in the Fort St. John, Dawson Creek, Fort St. James, andPrince George TSA
3.2.2 Forest Cover Inventory
The Forest Cover inventory standard is the predecessor to the VRI. This standard was used until 1995when it was replaced by the VRI.
The entire M-KMA area is covered by forest cover inventories dating from between 1971 to 1980 thatwere completed for the Ft. St. John, Mackenzie, Ft. Nelson, and Cassiar TSA. This inventory has beenreplaced wherever the VRI has been completed. These inventories (with the exception being speciescomposition) were interpreted to classes and subsequently the attributes were set to the class mid-points(as opposed to absolute attribute values). These inventories are extremely out of date.
Table 2: Summary of VRI and Forest Cover Inventories
Project Name ProjectDescription Year Study Area
Mackenzie TSA VRIProjects VRI's 2002-2003 South Half of M-KMA
Fort St. John TSAVRI/Terrain MappingProjects
VRI and TerrainMapping 2000-2003
Several partial mapsalong SE edge of theM-KMA
Fort Nelson VRI Projects VRI's 1998-2001Several partial mapsalong NE edge of theM-KMA
Ft. St. John TSA FCInventories
Forest CoverInventories 1972 SE M-KMA
Mackenzie TSA FCInventories
Forest CoverInventories 1972 / 1973 SW M-KMA
3.2.3 Ecosystem Mapping (PEM and TEM)
Ecosystem mapping provides a spatially explicit base inventory of the plant communities and structuralstages found across a landscape, and provides the foundation for ecosystem-based management of largeareas. This mapping is typically accomplished using photo interpretation and extensive ground-truthing(Terrestrial Ecosystem Mapping) or using predictive models and minor ground-truthing (PredictiveEcosystem Mapping).
Terrestrial Ecosystem Mapping (TEM) is the stratification of the landscape into units that reflectdifferences in climate, geomorphology, bedrock geology, and vegetation. A total of four classifications

MUSKWA-KECHIKA MANAGEMENT AREA PLANNING AND RESEARCH INTEGRATION PROJECT - 8
are typically mapped, including: ecoregions, biogeoclimatic units, ecosystem units (site series), and seralcommunity types (structural stage). Ecosystem units are delineated on aerial photographs based onbioterrain criteria and confirmed through field sampling.
Predictive Ecosystem Mapping (PEM) is designed to use available spatial data and knowledge ofecological-landscape relationships to automate the computer generation of ecosystem maps. Spatial datatypically includes forest cover, digital elevation models, biogeoclimatic units, and may also includebioterrain information.
Ecosystem mapping (PEM and TEM) has been completed for several portions of the M-KMA. TheMSRM data warehouse identifies five project areas with completed TEM projects, and 4 project areas(completed under the same, “Muskwa PEM” project name) that have completed PEM. Approximately30% of the M-KMA has available ecosystem mapping data; some areas have overlapping PEM and TEMdata. Most of the mapping that exists is along the leeward slopes of the M-KMA, although the Akie-Pesika project is on the windward slopes of the Rocky Mountains.
The Madrone report to the M-K Advisory Board (Madrone, 2000), on ecosystem mapping gap analysisidentifies two additional ecosystem mapping projects in the M-KMA (#7 and #8 in Table 3). The exactlocation standards used in these inventories and the location of data and other deliverables for theseprojects are not known.
Table 3: Summary of Ecosystem Inventories
Project Name ProjectDescription Year Study Area
1. Akie-Pesika TEM andWHR
1:20,000 TEM andWHR for 11 spp 1996-2001 Portions of Upper Akie
2. Dunedin TEM andWHR
1:50,000 TEM andWHR for 9 spp 1998 Portions of Sulphur/8 Mile
3. Smith Vents TEM andWHR
1:50,000 TEM andWHR for 8 spp 1998 Portions of Terminal and
Fishing Areas
4. Besa Prophet TEMand WHR
1:50,000 TEM andWHR for 11 spp 1999 Portions of Prophet Area
5. NE Burns TEM andWHR 1:50,000 TEM 1999
Portions of Northern RockyMountain Park and MuskwaWest
6. Muskwa PEM andWHR (4 areas)
1:50,000 PEM andWHR for 11 spp in4 Pre-Tenure Planareas
2002
Portions of Besa-Halfway,Muskwa West, StoneMountain, 8 Mile / Sulphur,and Churchill Area
7. Liard Hotsprings 1:20,000 TEM 1994-199522,000 ha within the MKadjacent to and overlappingwith the Smith / Vents TEM
8. Muskwa Foothills 1:250,000 TEM 1991-1992

MUSKWA-KECHIKA MANAGEMENT AREA PLANNING AND RESEARCH INTEGRATION PROJECT - 9
An additional PEM in the Fort Nelson TSA was completed in January 2005. This PEM is described as anon-standard PEM product that “was developed for an Ecosystem Representation Analysis as required forCSA certification”. Therefore, this PEM might be unsuitable as input for other analyses such as wildlifehabitat mapping or site index adjustment.” This PEM covers the entire Fort Nelson TSA.
All of the mapping posted to MSRM’s TEM and PEM data warehouses will have databases and spatialinformation consistent with RISC standard, and will be relatively simple to merge, and build upon in thefuture. The ecosystem mapping project names are listed below as they appear in the MSRM warehouse.
1. Akie-Pesika TEM2. Dunedin TEM3. Smith Vents TEM4. Besa Prophet TEM5. NE Burns TEM6. Muskwa PEM
a. PTP1b. PTP2c. PTP3d. PTP4
All but one TEM project have wildlife habitat ratings associated with them. The northeast Burns TEMdid not report wildlife habitat ratings as a component of the project. Table 4is a matrix of the differentspecies with completed habitat ratings for each project area.
Table 4: Species Matrix of Completed Wildlife Habitat Ratings.
Project Name
mar
ten
fishe
r
lynx
griz
zly
bear
elk
cari
bou
moo
se
ston
e sh
eep
mou
ntai
n go
at
wol
veri
ne
nort
hern
gos
haw
k
blac
k be
ar
mul
e de
er
whi
te ta
iled
deer
biso
n
cape
may
war
bler
bay-
brea
sted
war
bler
thre
e-to
ed w
oodp
ecke
r
1. Akie-Pesika TEM X X X X X X X X X X X2. Dunedin TEM X X X X X X X X X3. Smith Vents TEM X X X X X X X X4. Besa Prophet TEM X X X X X X X X X X X5. NE Burns TEM6. Muskwa PEM X X X X X X X X X X X
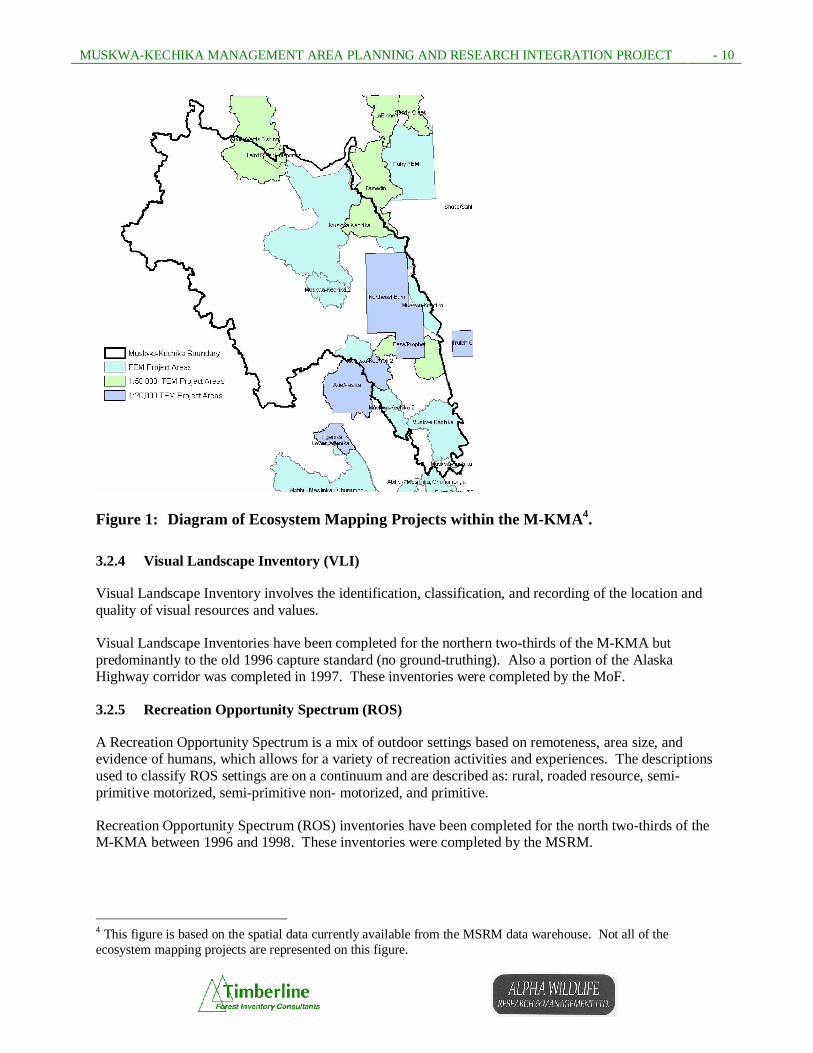
Figure 1 shows the location of some of the ecosystem mapping projects within the M-KMA. This figureis base on the spatial information available on the MSRM data warehouse and does not contain allecosystem mapping projects competed to-date. Two PDF maps, also downloaded from the MSRM datawarehouse show the location of all PEM and TEM mapping in the province. These maps are included onthe accompanying CD.
MUSKWA-KECHIKA MANAGEMENT AREA PLANNING AND RESEARCH INTEGRATION PROJECT - 10
Figure 1: Diagram of Ecosystem Mapping Projects within the M-KMA4.
3.2.4 Visual Landscape Inventory (VLI)
Visual Landscape Inventory involves the identification, classification, and recording of the location andquality of visual resources and values.
Visual Landscape Inventories have been completed for the northern two-thirds of the M-KMA butpredominantly to the old 1996 capture standard (no ground-truthing). Also a portion of the AlaskaHighway corridor was completed in 1997. These inventories were completed by the MoF.
3.2.5 Recreation Opportunity Spectrum (ROS)
A Recreation Opportunity Spectrum is a mix of outdoor settings based on remoteness, area size, andevidence of humans, which allows for a variety of recreation activities and experiences. The descriptionsused to classify ROS settings are on a continuum and are described as: rural, roaded resource, semi-primitive motorized, semi-primitive non- motorized, and primitive.
Recreation Opportunity Spectrum (ROS) inventories have been completed for the north two-thirds of theM-KMA between 1996 and 1998. These inventories were completed by the MSRM.
4 This figure is based on the spatial data currently available from the MSRM data warehouse. Not all of theecosystem mapping projects are represented on this figure.

MUSKWA-KECHIKA MANAGEMENT AREA PLANNING AND RESEARCH INTEGRATION PROJECT - 11
3.2.6 Recreation Features Inventory (RFI)
A Recreation Features Inventory is a component of the Recreation Inventory. The identification,classification, and recording of the types and locations of biophysical recreation and cultural features,existing and potential recreation activities, feature significance, and feature sensitivity. RecreationFeatures Inventories have been completed between 1991 and 1996 for the north two-thirds of the M-KMA. These inventories were completed by the MSRM.
Table 5: Summary of Visual Landscape, Recreation Opportunity Spectrum, andRecreation Features Inventories
Project Name Project Description Year Study Area
Forest Nelson DistrictVLI
Inventory of visual landscapeof the entire Ft. NelsonForest District
1993North two-thirds of M-KMA
Alaska Highway VLI
Inventory of visual landscapeof a portion of the AlaskaHwy corridor in the Ft.Nelson Forest District
1997 NE side alongAlaska Hwy.
Ft. Nelson ROS Ft. Nelson Forest District 1996-1998North two-thirds of M-KMA
Ft. Nelson RFI Ft. Nelson Forest District 1991-1996North two-thirds of M-KMA
3.2.7 Inventories Catalogued Through the Timber Supply Review Process
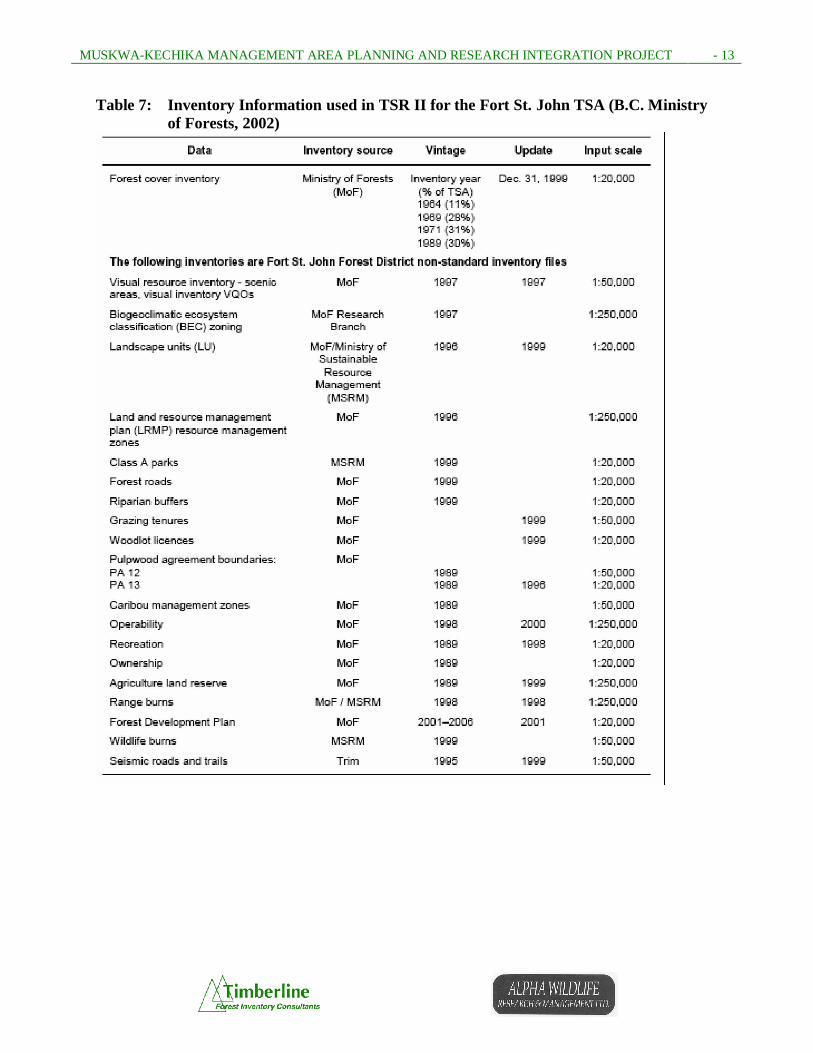
Under the Forest Act, the province must determine an allowable annual cut every five years for eachtimber supply area (TSA) and tree farm licence (TFL). This process includes the collection of the mostcurrent inventory information for incorporation into timber supply modelling. The M-KMA includesparts of three TSA: Fort Nelson, Fort St. John and Mackenzie. The inventory information used in theTSR process for each TSA are shown in Table 6, Table 7, and Table 8 respectively. Further informationon each of these information sources can be found in the corresponding Timber Supply Review AnalysisReport from the MoF Forest Analysis Branch website (http://www.for.gov.bc.ca/hts/tsas.htm).

MUSKWA-KECHIKA MANAGEMENT AREA PLANNING AND RESEARCH INTEGRATION PROJECT - 12
Table 6: Inventory Information used in TSR III for the Fort Nelson TSA (ForestEcosystem Solutions, 2004)
MUSKWA-KECHIKA MANAGEMENT AREA PLANNING AND RESEARCH INTEGRATION PROJECT - 13
Table 7: Inventory Information used in TSR II for the Fort St. John TSA (B.C. Ministryof Forests, 2002)

MUSKWA-KECHIKA MANAGEMENT AREA PLANNING AND RESEARCH INTEGRATION PROJECT - 14
Table 8: Inventory Information used in TSR II for the Mackenzie TSA (B.C. Ministry ofForests, 2001)
3.2.8 Non-Renewable Resource Inventories
Non-renewable resources in B.C. include minerals, coal, petroleum, and natural gas. Exploration for non-renewable resources is conducted through various types of point samples. One exception to this is area-based geophysical sampling and coal exploration. These inventories have not been tied to specificprojects and are maintained in a variety of data warehouses. As such, these inventories have not beenincluded in the project and objectives database but are described below. Many of these reports have beenincluded as Appendices to this report.
The agencies are involved in warehousing this data are as follows:
• The B.C. Ministry of Energy and Mines (MEM);• The B.C. Geological Survey (a branch of MEM) (BCGS);• Natural Resources Canada (NRC);• The Geological Survey of Canada (a branch of NRC) (GSC); and• The B.C. Oil and Gas Commission (a Crown Corporation) (OGC).

MUSKWA-KECHIKA MANAGEMENT AREA PLANNING AND RESEARCH INTEGRATION PROJECT - 15
BCGS and GSC have extensive databases on minerals, coal, petroleum and natural gas surveys in thisprovince. The OGC holds data on petroleum and natural gas surveys, as well. Common to most of thesesurveys is the use of the National Topographic System (NTS) 1:250,000 scale grid system to organizefindings. The M-KMA falls within the following 12 NTS 250k grids: 94B, C, E, F, G, J, K, L, M and N;and 104I and P.
Also common to many of these surveys is the Open File style of reporting findings within the geologycommunity to convey data by means of text, maps and / or tables. Industry, provincial and federalgeology publications often follow this convention. Further, all point sample data is presented withcoordinates in decimal latitude / longitude and / or Universal Transverse Mercator (UTM) to facilitatespatial searches.
The MEM website provides access to BCGS maps and databases through MapPlace web-based GISsearch engine, while the NRC website provides access to GSC maps and databases through itsGEOSCAN web-based library search engine.
What follows is a brief synopsis of each database, with the summary of data searches within the M-KMApresented in tables and appendices.
ARIS DatabaseThose who undertake mineral explorations submit exploration results in assessment reports to maintaintheir mineral tenures in compliance with the Mineral Tenure Act and the Coal Act. The mineral reportsare reviewed for compliance with the Mineral Tenure Act regulations and indexed in the ARIS(Assessment Report Indexing System) database. The library of more then 24,000 reports, on paper andfiche, is available for public viewing and copies are available through a distribution agent. The ARISdatabase products index (fiche, paper and diskette) and index maps (fiche and paper) are designed tosimplify access to the library of original reports, thus making exploration investment decisions andestimations of mineral potential easier.
The B.C. Geological Survey Branch (GSB) has over 26,000 approved mineral exploration assessmentreports filed by the exploration and mining industry since 1947. These reports provide information ongeological, geophysical, geochemical, drilling, and other exploration-related activities throughout B.C.The GSB maintains ARIS to provide for interactive viewing along with other GSB databases atMapPlace. Assessment Reports are kept confidential by the Crown for one calendar year aftersubmission. Appendix III summarizes the ARIS publicly available for the M-KMA.
MINFILE DatabaseMINFILE is the MEM digital mineral inventory database of over 11,600 mineral, coal and industrialmineral occurrences in B.C. MINFILE is used extensively by industry and government in areas ofexploration planning, resource information, land-use planning, and research. Capture of information inthe computer database is 90% complete, of which 81% is released.
The MINFILE database has information on:
1. More than 12,100 metallic mineral, industrial mineral and coal mines, deposits and occurrencesdocumented in British Columbia.
2. Names; commodities; status (showings to major producing mines).3. Location (NTS map, longitude/latitude, UTM, elevation and mining division).4. Mineralogy and alteration.5. Deposit character, classification, and type (based on B.C. mineral deposit profiles).

MUSKWA-KECHIKA MANAGEMENT AREA PLANNING AND RESEARCH INTEGRATION PROJECT - 16
6. Host rock (lithology, stratigraphic names and ages).7. Geological setting (tectonic belt, terrain, physiographic area, and metamorphism).8. Inventory (assays, reserves/resources, and production).9. Capsule geology and work history.10. References and publications.
Appendix V summarizes the MINFILE records for the M-KMA.
B.C. Age 2004 DatabaseB.C. Age 2004 is an MS ACCESS database containing all reported non-proprietary isotopic agedeterminations for bedrock units from B.C. This release contains 7759 age determinations from 4828rock samples, summarizing 622 published articles, theses or unpublished reports. The data is fullyrelational, and may be queried by the user based on absolute age (in Ma), location (NTS map sheet,terrain polygon, or decimal latitude longitude, as specified by the user) or source (e.g. author, journal title,etc.). This data has also been integrated into MapPlace.
Appendix VI summarizes radiometric age data collected under B.C. Age 2004 within the M-KMA.
B.C. Aggregate InventoryThe B.C. Aggregate Inventory is a sand and gravel inventory program administered by GSB, providing acurrent and comprehensive digital data base of aggregate inventory information, the technical expertiserequired to assist in provincial land-use issues, and predictive models to determine aggregate reservesrelated to different landforms. The data also includes the Ministry of Highways’ public pit inventorydata.
COALFILE DatabaseThe COALFILE Database is a large library of coal assessment reports dating from 1900 which ismaintained in Victoria by the GSB. These assessment reports have been submitted by explorationcompanies in compliance with the Coal Act.
Exploration data from the assessment reports have been summarized and stored in a digital databasecalled COALFILE. Information in COALFILE is organized in six record types or files. These filesconsist of:
1. Summary of data in reports;2. Comments concerning the reports;3. Record of maps in the reports;4. Trench information;5. Audit or Pit information; and6. Borehole information.
Table 9 summarizes the one COALFILE record within the M-KMA.
Table 9: Reported Coal Finding in the M-KMA.
ReportNo. Year Area NTS
Maps Latitude Longitude PDF Files
580 1972 PRCOAL*
094B10094B15 56.7510 -122.9110 580p2-45.pdf
http://www.em.gov.bc.ca/DL/COALReports/*PR = Peace River

MUSKWA-KECHIKA MANAGEMENT AREA PLANNING AND RESEARCH INTEGRATION PROJECT - 17
Multi-Sensor Geophysical SurveysGeophysical surveys include any method of resource exploration that makes use of the physical propertiesof the earth. They exploit any unusual property that the sought deposit might possess. Most geophysicalsurvey methods are active, in that a signal of some type is introduced into the ground via an electriccurrent or a small explosion (i.e. seismic) and the response is measured. Passive geophysical surveys arethose that measure a naturally occurring signal coming from the earth, such as the exploration forfluorescing minerals using UV light.
Electromagnetic, induced polarization and aerial and ground magnetic surveys are the most commongeophysical surveys for mineral exploration. Seismic, gamma ray spectrometry, and gravity surveys arethe most common geophysical surveys for petroleum and natural gas.
Geophysical surveys are generally undertaken by GSC. Due to the significant costs involved only threegeophysical surveys have been conducted within the M-KMA. This data is provided through theMapPlace website and reported in the Geoscan database.
They are:
• 1996 Fort Nelson Survey;• 1997 Cassiar Mountains Survey; and• 1999 Findlay River/ Toodoggone River Survey.
Appendix VI summarizes these three geophysical surveys using data from the federal GEOSCANdatabase.
Property File DatabaseThe Property File Database is a library that contains over 90 lineal metres of reports and maps that aregenerally unavailable elsewhere, and is maintained in Victoria by the GSB. These documents can beextremely valuable to researchers.
Property File contains:
1. Unpublished reports.2. Theses and papers.3. Field notes.4. Company prospectuses and pamphlets.5. Historical information.6. Geology, geochemistry, geophysics and drill information.7. Claim maps, sketches of workings and photographs.
Property File also contains general information on each NTS area, the National Mineral Inventory cards,topographic maps and some work histories. Research material is indexed and cross-referenced in theMINFILE database.
Regional Geochemical SurveyThe B.C. Ministry of Energy, Mines and Petroleum Resources (MEMPR), now MEM, has been involvedin reconnaissance-scale stream sediment and water surveys since 1976. This joint federal-provincialinitiative was originally referred to as the Uranium Reconnaissance Program (URP). In 1978 theprovincial program was renamed the Regional Geochemical Survey (RGS) and in 1987 the Provincebegan to independently administer surveys conducted in British Columbia. As part of Canada's NationalGeochemical Reconnaissance (NGR) program, the RGS program continues to maintain sample collection,preparation and analytical standards established by the Geological Survey of Canada. To date, over
MUSKWA-KECHIKA MANAGEMENT AREA PLANNING AND RESEARCH INTEGRATION PROJECT - 18
45,000 stream sediment and water samples have been collected from 43 - 1:250 000 NTS map sheetscovering approximately 70 % of the province. The resulting field and multi-element analytical data arecompiled into B.C.’s largest and most comprehensive stream sediment and water geochemical database.
MapPlace provides access to RGS data, but it appears that little if any was undertaken in the area that isnow the M-KMA except for the following three Open Files:
• Open File 1996-18. Geochemistry of the Gataga Mountain Area (Parts of NTS94L/7,8,9,10,11,14,15);
• Open File 1999-6. Geochemistry of Alkaline Lake Waters of the Northern Kechika Trough, B.C.(NTS 94M/2, 3, 4, 5, 6, 12; 104P/8, 9, 10, 15, 16); and
• Open File 2001-7. Geochemical Exploration Models, Volume 2: Shale Hosted Deposits onNorth-Eastern B.C. (NTS 94F/13, 94K/4 AND 94K/13).
Rock Geochemical SurveysRock geochemical surveys look to find six metals within rock samples delivered to MEM. The metals aregold, silver, copper, lead, zinc, and arsenic. Some of the minerals are precious, while others arepathfinders that may indicate the presence of other minerals. The findings of rock geochemical surveyscan be used to detect anomalous levels and facilitate further exploration. Appendix VII summarizes therock geochemical surveys findings within the M-KMA.
Petroleum and Natural GasThe eastern quarter of the M-KMA sits within the Western Canadian Basin. As such there are petroleumand natural gas well sites within the M-KMA for both exploration and production. However, there is adiscrepancy between petroleum and natural gas exploration data provided by GSB and OGC.
The list of petroleum and natural gas well sites provided by GSB is presented in Appendix VIII, butincludes far more well sites than the list of petroleum and natural gas well sites provided by OGCpresented in Appendix IX. Many of the well sites listed in Appendix VIII, however, were proposed sitesand not necessarily developed. Appendix IX summarizes petroleum and natural gas exploration surveysconducted in the M-KMA known to GSB.
What follows is a brief description of the digital spatial (and tabular) surface data held by the OGC.
Wells: The OGC currently has all well site locations (points) available for download on their FTP site.These are updated nightly. By the fall of 2005, the OGC will start collecting well pad data (polygons)and post it on the day of its approval. However, certain details on each well site are held in confidence bythe OGC for varying lengths of time to maintain competitive advantage.
Pipelines: The OGC has been collecting Pipeline Right of Ways (polygons) on the day of approvalthroughout 2005. This data will be made available in the coming months.
Facilities: The OGC has all facility locations (points) available for download on their FTP site. These areupdated regularly as new facilities are added.
Geophysical (seismic): The OGC currently has a very inaccurate, outdated and incomplete final planseismic line dataset (arc). By the fall of 2005, the OGC will start collecting all geophysical line data(proposed and final cut) and post it on the day of its approval.

MUSKWA-KECHIKA MANAGEMENT AREA PLANNING AND RESEARCH INTEGRATION PROJECT - 19
Petroleum Development Roads (PDR): This is a specific status road managed by the OGC. They have aPDR dataset (arc) available for download on their FTP site. It is usually updated yearly. By the fall of2005, the OGC will start collecting all PDR datasets and post it on the day of its approval.
Access Roads: Currently the OGC has no information on access roads. By the fall of 2005, the OGC willstart collecting all Access Road datasets and post it on the day of its approval. Access roads are notPetroleum Development Roads.
Ancillary and Other Applications: Currently the OGC has no information other than that attached topipeline applications. By the fall of 2005, the OGC will start collecting all ancillary and otherapplications datasets and post it on the day of its approval. Examples of features that are ancillary andwill require other applications are campsites, decking sites, temporary workspaces, etc.
Data currently available is posted to ftp://www.ogc.gov.bc.ca/outgoing/OGC_Data/
OGC data may become available through the B.C. Land and Resource Data Warehouse (http://lrdw.ca/)in the near future.
GEOSCAN DatabaseThe Canada Centre for Remote Sensing (CCRS) Scientific Publications Database has been integrated intothe GEOSCAN database, comprising more than 45,000 records of publications released by CCRS orGeological Survey of Canada (GSC) authors. GEOSCAN is now the repository for all Earth SciencesSector (ESS) bibliographic information. To limit your search to CCRS or GSC publications, use the"Document Type" pull-down menu. Clients can perform their own searches on-line or enlist theassistance of the ESIC Reference Service. Custom-formatted outputs are available upon request.Interfaces allow for searching of subsets of GSC publications. Table 10 presents several searches madethrough GEOSCAN using NTS block numbers and various key words.
Table 10: Initial Search of GEOSCAN for the M-KMA.
Search Parameter Number of Hits
94B 594C 1794E 894F 294G 1094J 394K 394L 094M 394N 0104I 19104P 2
Muskwa 21Muskwa-Kechika 1
Kechika 74M-KMA 0

MUSKWA-KECHIKA MANAGEMENT AREA PLANNING AND RESEARCH INTEGRATION PROJECT - 20
3.3 Identified Gaps in Inventory and Research
Based on the large number of objectives contained in local strategic plans of the M-KMA there arenumerous gaps in available inventory and research information that currently prevent many of theseobjectives from being realized. However, based on this review of the planning documents for the M-KMA, it is apparent that the greatest need for the M-KMA is to develop a coordinated planning approachto resource management that consolidates, coordinates the many objectives and resolves apparentlyconflicting objectives from the five planning sectors created through the local strategic plans.
Planning in the M-KMA is driven through the creation of five local strategic plans; each plan at varyingstages of completion, created seemingly independent of the other four plans. This has resulted in a largenumber of objectives created at widely varying scales and levels of precision and detail, over overlappingareas, and sometimes with conflicting objectives.
The initial intent of this project was to evaluate the inventory and research needs of each objectiverelative to currently available information, providing a list of potential projects required to meet localstrategic plan objectives. However, as discussed earlier, many objectives require further refinement andmore detailed definition before inventory and research needs can be properly assessed. In addition, issueswith conflicting and overlapping objectives should be resolved before gap analysis is conducted.
While conducting gap analysis on many objectives in their current form is problematic, there are severalcommon values contained in the numerous higher level and local strategic plans affecting the M-KMA.These general values and associated objectives have been used to assess some general inventory, researchand planning requirements for the M-KMA and provides the M-K Advisory Board with a number of keyprojects that will provide a solid foundation to management in the M-KMA. The following sectionprovides a review of general M-KMA values, the main objectives identified in the higher level and localstrategic plans, data gaps and suggested projects. It is our recommendation that management in the M-KMA should occur under the guidance of an integrated, spatially explicit Sustainable ResourceManagement Plan which is described in Section 4.0. These projects should be integrated andincorporated into this plan and revised accordingly.

MUSKWA-KECHIKA MANAGEMENT AREA PLANNING AND RESEARCH INTEGRATION PROJECT - 21
VALUES MAIN OBJECTIVES MAIN DATA GAPS SUGGESTED PROJECTS COMMENTS
Air Quality v Maintain acceptable airquality
v No terms or definitions of“acceptable air quality”
v No current statusinformation readilyavailable
v No air quality monitoringplan in place
v No management planavailable, should air qualitydeteriorate
v “Air Quality StrategicPlan” should be developedto address data gaps
This strategic plan should bedeveloped in association withan overall SustainableResource Management Plan
BiologicalDiversity -OVERALL
v Maintain NaturalBiodiversity
v Maintain Functioning andself-sustainable Ecosystems
v Incomplete BaseInventories, includingEcosystem Mapping,Vegetation Cover, habitatsupply, etc
v Development andImplementation of aconservation plan (CADproject may have this as anobjective, but thedeliverables for the CADproject are not available
v Complete PEM/TEM andVRI
v Assemble base inventorycoverages
v Multi-species (coarse andfine filter) habitat mappingand field verificationshould be assembled andcompleted using baseinventories
v Establish natural range ofvariability for ecosystemstructure, composition,landscape context, etc
These objectives arecommonly used as a ‘catch-all’ for many of the otherobjectives listed underbiological diversity. Oncebase inventories are completedand assembled, otherbiodiversity related objectivescan start being addressedHigh quality EcosystemMapping is necessary toeffectively implementlandscape level ecosystem-based management.Biodiversity conservationshould be integrated withindustrial activities in order todevelop effective programs.

MUSKWA-KECHIKA MANAGEMENT AREA PLANNING AND RESEARCH INTEGRATION PROJECT - 22
VALUES MAIN OBJECTIVES MAIN DATA GAPS SUGGESTED PROJECTS COMMENTSBiologicalDiversity –
FISH
v Maintain high qualityfisheries in natural settings
v Maintain fish habitat forbull trout
v Maintain fish habitat forarctic grayling
v Maintain fish habitat for allfish at risk
v Maintain genetic diversityof wild fish stock
v Final fish habitatmaps/ratings tables
v Spatially explicit fishhabitat management plan
v Incomplete/Unknownimpacts of recreation,angling, etc on fish stock
v Genetic analysis of priorityfish species
v Finalize fish habitatmaps/ratings
v Develop Fish habitatManagement Plan, withinan SRMP – coordinate withrecreation and tourism, aswell as resourcedevelopment, include amonitoring program for fishpopulations
v Characterize populationsacross their distributionalrange
v Assess impact of motorizedboats on priority fishspecies
v Compare current fishharvest with historical
v Analyze impacts of anglingon populations
Several related fish inventorieshave been completed in thepast 5 years, and now is agood time to develop a FishManagement Plan that mayalso include some targetedstudies on priority fishpopulation trends and geneticsreview – this should beincluded in an overall SRMP.A monitoring program toassess fish population trendswould be highly beneficial.

MUSKWA-KECHIKA MANAGEMENT AREA PLANNING AND RESEARCH INTEGRATION PROJECT - 23
VALUES MAIN OBJECTIVES MAIN DATA GAPS SUGGESTED PROJECTS COMMENTSBiologicalDiversity –WILDLIFE
v Maintain or increasepopulations of wildlifespecies designated not atrisk
v Control populations oftargeted species whennecessary for conservation
v Monitor population healthv Maintain a conservative
harvest
v Suitability mapping,population surveys,baseline health indicators,cumulative effectsassessment to determineacceptable limits of change,appropriate harvest levels,monitoring programs forfurbearers and big game:v Martenv Mountain goatv Coyotev Gray Wolfv Black Bearv Cougarv River Otterv Elkv Moosev Lynxv Mule Deerv White-tailed deerv Stone Sheepv Waterfowl
v Assemble all quality habitatsupply maps into multi-species habitat coverage
v Develop/Update habitatratings to fill in the gaps
v Field verification of habitatmapping where notavailable, utilize existingsurvey data where availableto validate maps
v Map critical habitatfeatures, such as minerallicks
v Determine importantelements/threats toimmigration habitat
v Impacts of human activitieson select species
v Identify appropriate harvestlevels for each species
v Develop monitoringprogram
There are many survey andmapping projects available forportions of the M-KMA, butthey need to collated andassessed for quality. The basepolygons from PEM and VRIshould be mandatory as thespatial polygons for all futurehabitat mapping. This willallow consistency acrossprojects, ease of datamanagement and some controlover quality and applicabilityof project results. A multi-species management program(including monitoring) needsto be implemented. For such aprogram to be useful, it mustexplain or predict how specieswill be associated with thevegetation and physicalstructure of a particular area.

MUSKWA-KECHIKA MANAGEMENT AREA PLANNING AND RESEARCH INTEGRATION PROJECT - 24
VALUES MAIN OBJECTIVES MAIN DATA GAPS SUGGESTED PROJECTS COMMENTSv Maintain or increase
Caribou numbersv Maintain ecological
integrity of the Caribouzone
v Minimize disturbance innatality sites and winterrange
v Coordinated datamanagement andmonitoring program
v Develop monitoringprogram
v Establish baseline healthindicators
v Collate all spatial andaspatial data for ease of useand analysis
v Increase natalityv Identify mortality causesv Identify and protect calving
grounds
Extensive time and resourceshave been spent on Caribou inthe M-KMA. Yet, recoveryplans still lack specificobjectives. Once inventorydata have been reviewed andorganized, it is necessary todevelop specific projects tomeet seasonal gaps indatabases, and answerquantifiable objectives. Ahigh-, medium- and low-quality habitat program shouldbe developed within a multi-species management program.
BiologicalDiversity –
SPECIES AT RISK
v Maintain or increase Plain’sBison numbers
v Provide or maintainadequate early seral stagehabitat for Plain’s Bison
v Structure, function anddistribution of Plains Bisonhabitat and behaviourremains in a natural range
v Minimize disturbance atsensitive times
v Updated populationnumbers and trends
v Seral stage managementstrategy and monitoringprogram
v Cumulative effectsassessment modeling todetermine acceptable limitsof change
v Develop monitoringprogram
v Establish baseline healthindicators
Seral stage mapping wascompleted with bison as anobjective – this should beincorporated into a populationand health study that includesBison as one of several speciesof interest.

MUSKWA-KECHIKA MANAGEMENT AREA PLANNING AND RESEARCH INTEGRATION PROJECT - 25
VALUES MAIN OBJECTIVES MAIN DATA GAPS SUGGESTED PROJECTS COMMENTSv Maintain or increase
populations of othermammals at risk, includingWolverine, Grizzly bear,fisher, northern long-earedmyotis, short-eared owl,sandhill crane, black-throated green warbler,wood bison, peregrinefalcon, Cape May warbler,Connecticut warbler
v Minimize disturbance atsensitive times
v Updated populationnumbers and trends
v Life history requirementsincorporated intomanagement plans
v Coordinated datamanagement andmonitoring program
v Spatially explicitdistribution of most SAR isunknown
v A multi-speciesmanagement program thatintegrates habitat use withvegetation inventories, andforecasts and monitorshabitat supply over time
While extensive effort hasbeen focused on the Caribou,there is little information onother species at risk. Thisneeds to be addressed in acoordinated manner with fieldguides, SAR awarenesssessions for the public, andmanagement and recoverystrategies, monitoringprograms.
v Develop and implementmanagement and recoverystrategies for vascularplants / invertebrates /amphibians at risk
v Unknown habitatrequirements of plants /invertebrates / amphibiansat risk
v Spatial distributionunknown
v Develop and implementmanagement and recoverystrategies for vascular plant/ invertebrates / amphibiansat risk, within a multi-species managementprogram.
v Assess the ability ofRiparian ManagementGuidelines to provideprotection to amphibians.
v Establish a monitoringprogram acrosssuccessional stagesemploying invertebrate andnon-vascular taxa asindicators.
This objective found in higherlevel plans could be metrelatively easily with acoordinated species at riskmanagement / recovery /monitoring plan.

MUSKWA-KECHIKA MANAGEMENT AREA PLANNING AND RESEARCH INTEGRATION PROJECT - 26
VALUES MAIN OBJECTIVES MAIN DATA GAPS SUGGESTED PROJECTS COMMENTS
BiologicalDiversity –
PLANTCOMMUNITIES
AT RISK
v Develop and implementmanagement and recoverystrategies for plantcommunities at risk
v Spatial distribution of plantcommunities at riskunknown
v No management / recoverystrategies available
v Monitoring program notdeveloped
v Complete Rare / SensitiveEcosystem Mapping, usingPEM/TEM as base
v Develop and implementmanagement and recoverystrategies for plantcommunities at risk, withina multi-speciesmanagement program
These projects could easily beintegrated with the vascularplants / amphibians /invertebrates at risk projects
v Manage fire to meet habitatobjectives within thenatural range of variability
v Fire history of M-KMAv Natural Range of variation
of seral stages
v Identify and update firehistory of M-KMA
v Complete seral stagemapping of M-KMA
v Assess utilization ofprescribed fires in M-KMAto meet wildlife habitatobjectives
Fire history studies may be alow priority relative to theother baseline inventories
BiologicalDiversity –HABITAT
v Prevent and controlinvasive plants
v Protect native species fromintroduced fish
v Database of potentialinvasive plants and fish
v Distribution of existinginvasive plants and fish
v Management andmonitoring strategy forinvasive plant and fish
v Develop database ofpotential invasive plantsand fish
v Map potential distributionof existing invasive plantsand fish
v Develop management andmonitoring strategy forinvasive plant and fish

MUSKWA-KECHIKA MANAGEMENT AREA PLANNING AND RESEARCH INTEGRATION PROJECT - 27
VALUES MAIN OBJECTIVES MAIN DATA GAPS SUGGESTED PROJECTS COMMENTSv Manage protected areas to
encourage conservation,research opportunities andrecreation
v Maintain representativeecosystems in a naturalrange
v Manage and maintainconnectivity of habitats
v Minimize habitatfragmentation
v Incomplete ecosystemmapping
v Incomplete seral stagemapping
v Connectivity andfragmentation analysis andforecasting plan
v Complete ecosystemmapping and seral stagemapping
v BEC-based ecosystemrepresentation analysis
v Identify habitat use bypriority or indicator speciesto develop a multi-specieshabitat managementprogram.
v Connectivity andfragmentation analysis i.e.patch size distribution andforecasting
v Establish naturaldisturbance patterns andeffect on habitat
A multi-species managementprogram requires soundvegetation inventories andecosystem mapping. Oncethese multi-speciesmanagement areas have beenidentified, one can effectivelymanage landscapes forconnectivity andfragmentation.
Socio-EconomicResources
v Provide opportunities forgrowth and expansion ofagricultural activities
v Agricultural opportunitiesunknown
v Map existing and potentialagricultural locations
v Develop agriculturalmanagement plan
Agricultural activities shouldbe managed according to aSRMP employing a multi-species management program.This is particularly importantfor the conservation of SAR.

MUSKWA-KECHIKA MANAGEMENT AREA PLANNING AND RESEARCH INTEGRATION PROJECT - 28
VALUES MAIN OBJECTIVES MAIN DATA GAPS SUGGESTED PROJECTS COMMENTSv Maintain opportunities for
oil and gas exploration,development andtransportation
v Minimize impacts of oiland gas activities on non-energy sectors throughavoidance or mitigationmeasures
v Pre-tenure plans notcompleted for all areas
v Monitoring strategy for pre-tenure plans not available
v Finalize pre-tenure plansnot completed for all areas
v Develop a monitoringstrategy for all pre-tenureplans
v Stronger mechanism formaking data packages forall oil and gas activitiesavailable publicly
v Document adaptivemanagement opportunitiesand approaches
Oil and gas activities shouldbe included in a SRMP, andmust take into accountvegetation types and habitatuse identified in multi-speciesmanagement programs.
v Maintain or enhance thecontinued sustainablesupply of timber
v What is timber supplyavailability specific to M-KMA
v Updated productivityestimates
v Impacts of oil and gas ontimber supply in M-KMA
v Complete site indexadjustment project on M-KMA
v Timber Supply Reviewspecific to M-KMA
v Detailed forest managementplan should be incorporatedwith overall SRMP
v Determine current status ofpatch and seral stages
v Develop strategy to updateall disturbances onlandscape
Logging activities should beincluded in a SRMP, andshould take into accountvegetation types and habitatuse identified in multi-speciesmanagement programs.
v Maintain opportunities formineral exploration,development and allow foraccess
v A spatially explicit mineralexploration and extractionpolicy
v A spatially explicit mineralexploration and extractionpolicy
Mining activities should beincluded in a SRMP, and musttake into account vegetationtypes and habitat use identifiedin multi-species managementprograms.

MUSKWA-KECHIKA MANAGEMENT AREA PLANNING AND RESEARCH INTEGRATION PROJECT - 29
VALUES MAIN OBJECTIVES MAIN DATA GAPS SUGGESTED PROJECTS COMMENTSv Provide and maintain guide
outfitting opportunitiesv A spatially explicit guide
outfitting database andmanagement policy
v A spatially explicit guideoutfitting database andmanagement policy
Outfitting activities should beintegrated in a multi-speciesmanagement program, and payparticular attention to SAR.
v Provide and maintaintrapping opportunities
v A spatially explicit trappinghistory database andmanagement policy
v Updated harvest estimatesfrom trappers
v A spatially explicit trappinghistory database andmanagement policy
v Update harvest estimatesusing a log book recordingtrapping effort.
v Monitor populationdynamics through carcasscollections.
Trapping activities should beincluded in a SRMP, and musttake into account vegetationtypes and habitat use identifiedin multi-species managementprograms.
v Maintain or increase accessfor the ranching sector tograzing opportunities
v Range mapping unavailable/ outdated
v Update known andpotential range areas
v Partner with other agenciesto develop grazingenhancement fund (FSJLRMP)
v Assess the impact ofranching on wildlife habitatand plant invasion.
Water Quality
v Maintain water quality andquantity
v Maintain watershedhydrological regimes
v Protect headwaters
v Management andmonitoring planning
v Develop a watershedmanagement plan and waterquality and quantitymonitoring program
v Establish a series ofindicators to monitor waterquality in managedlandscapes
The monitoring andmanagement plans can bedeveloped in association withother agencies, resourceextractors, etc for costefficiencies
MUSKWA-KECHIKA MANAGEMENT AREA PLANNING AND RESEARCH INTEGRATION PROJECT - 30
VALUES MAIN OBJECTIVES MAIN DATA GAPS SUGGESTED PROJECTS COMMENTS
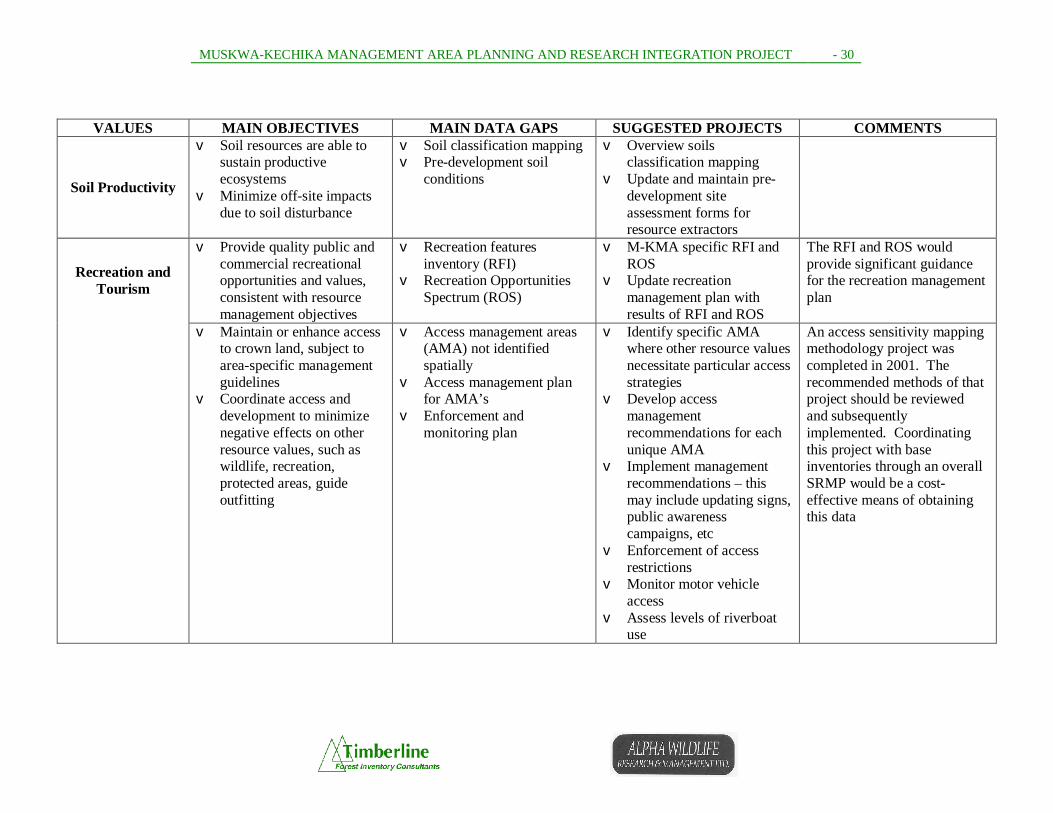
Soil Productivity
v Soil resources are able tosustain productiveecosystems
v Minimize off-site impactsdue to soil disturbance
v Soil classification mappingv Pre-development soil
conditions
v Overview soilsclassification mapping
v Update and maintain pre-development siteassessment forms forresource extractors
v Provide quality public andcommercial recreationalopportunities and values,consistent with resourcemanagement objectives
v Recreation featuresinventory (RFI)
v Recreation OpportunitiesSpectrum (ROS)
v M-KMA specific RFI andROS
v Update recreationmanagement plan withresults of RFI and ROS
The RFI and ROS wouldprovide significant guidancefor the recreation managementplan
Recreation andTourism
v Maintain or enhance accessto crown land, subject toarea-specific managementguidelines
v Coordinate access anddevelopment to minimizenegative effects on otherresource values, such aswildlife, recreation,protected areas, guideoutfitting
v Access management areas(AMA) not identifiedspatially
v Access management planfor AMA’s
v Enforcement andmonitoring plan
v Identify specific AMAwhere other resource valuesnecessitate particular accessstrategies
v Develop accessmanagementrecommendations for eachunique AMA
v Implement managementrecommendations – thismay include updating signs,public awarenesscampaigns, etc
v Enforcement of accessrestrictions
v Monitor motor vehicleaccess
v Assess levels of riverboatuse
An access sensitivity mappingmethodology project wascompleted in 2001. Therecommended methods of thatproject should be reviewedand subsequentlyimplemented. Coordinatingthis project with baseinventories through an overallSRMP would be a cost-effective means of obtainingthis data

MUSKWA-KECHIKA MANAGEMENT AREA PLANNING AND RESEARCH INTEGRATION PROJECT - 31
VALUES MAIN OBJECTIVES MAIN DATA GAPS SUGGESTED PROJECTS COMMENTSv Maintain existing
communications,transportation and utilitycorridors
v Provide opportunities fornew communications,transportation and utilitycorridors
v None v Include existing and futuretransportation corridors inSRMP
An overall M-KMAdevelopment plan thatintegrates social, economicand environmental concernswould allow for betterplanning of new corridors
v Mitigation of impacts fromrecreation, commercialaccess and development
v Minimize negative effectsof recreation on wildlife
v Reduce wildlife killed ontransportation corridors
v The number of wildlifekilled on transportationcorridors
v Are development,recreation and / or tourismactivities negativelyimpacting wildlife?
v Develop database to trackhuman-wildlife encounters
v Assess impacts ofdevelopment on past habitatsupply and populations
v Identify methods ofmanaging access to limitpredation
v Specific investigations ofblack bear human conflictsto determine if problemsare due to the ecology ofthe species (e.g., bears aremore carnivorous thanherbivorous) or to humanmanagement issues (e.g.,garbage, proximity of urbancenters, etc.)
v Improve public educationrelated to impacts ofrecreation on wildlife
MUSKWA-KECHIKA MANAGEMENT AREA PLANNING AND RESEARCH INTEGRATION PROJECT - 32
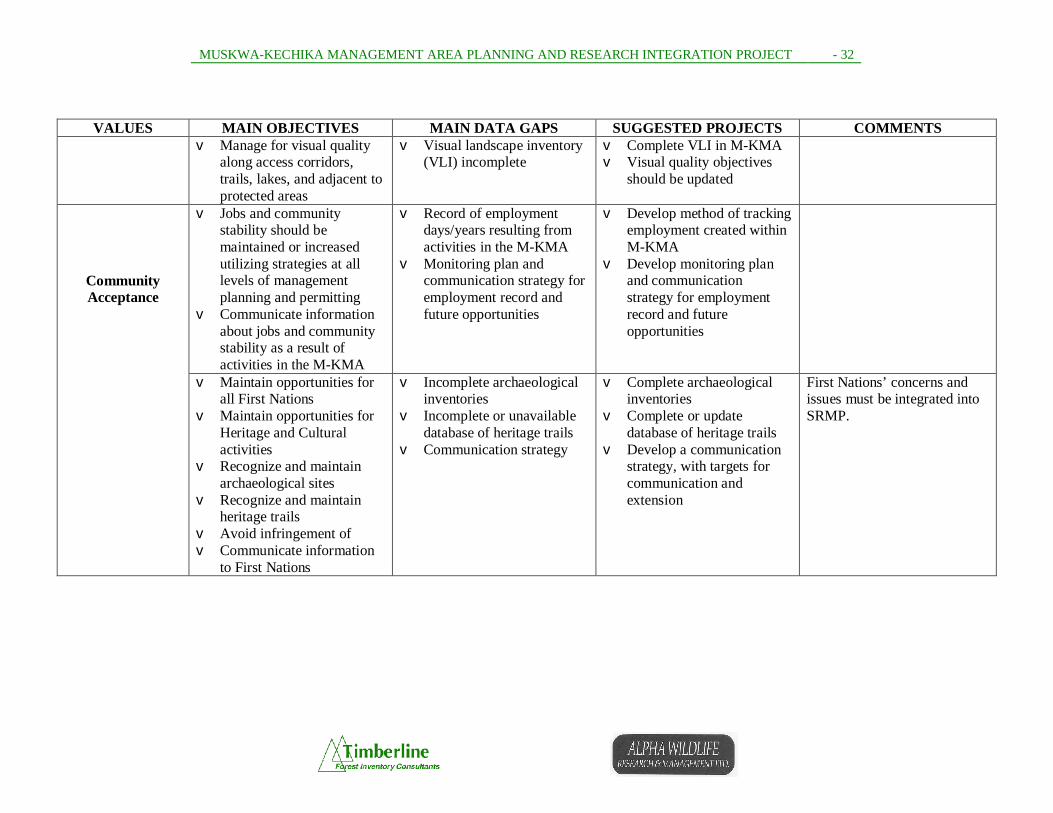
VALUES MAIN OBJECTIVES MAIN DATA GAPS SUGGESTED PROJECTS COMMENTSv Manage for visual quality
along access corridors,trails, lakes, and adjacent toprotected areas
v Visual landscape inventory(VLI) incomplete
v Complete VLI in M-KMAv Visual quality objectives
should be updated
v Jobs and communitystability should bemaintained or increasedutilizing strategies at alllevels of managementplanning and permitting
v Communicate informationabout jobs and communitystability as a result ofactivities in the M-KMA
v Record of employmentdays/years resulting fromactivities in the M-KMA
v Monitoring plan andcommunication strategy foremployment record andfuture opportunities
v Develop method of trackingemployment created withinM-KMA
v Develop monitoring planand communicationstrategy for employmentrecord and futureopportunities
CommunityAcceptance
v Maintain opportunities forall First Nations
v Maintain opportunities forHeritage and Culturalactivities
v Recognize and maintainarchaeological sites
v Recognize and maintainheritage trails
v Avoid infringement ofv Communicate information
to First Nations
v Incomplete archaeologicalinventories
v Incomplete or unavailabledatabase of heritage trails
v Communication strategy
v Complete archaeologicalinventories
v Complete or updatedatabase of heritage trails
v Develop a communicationstrategy, with targets forcommunication andextension
First Nations’ concerns andissues must be integrated intoSRMP.

MUSKWA-KECHIKA MANAGEMENT AREA PLANNING AND RESEARCH INTEGRATION PROJECT - 33
VALUES MAIN OBJECTIVES MAIN DATA GAPS SUGGESTED PROJECTS COMMENTSv M-KMA data to be
managed to allowresearchers and publicaccess to requiredinformation in a timely andcoordinated fashion
v Data management strategymissing or ineffective
v Develop spatial and aspatialdata management system,
v Utilize open sourcesoftware to provide webmapping applications
v Policy on data creation andutilization by researchersand others
v Develop a database tocatalogue, archive, searchand retrieve digital reports

MUSKWA-KECHIKA MANAGEMENT AREA PLANNING AND RESEARCH INTEGRATION PROJECT - 34
4.0 Discussion and Recommendations
There are 219 separate objectives contained in the four local strategic plans reviewed as part of thisproject. Undoubtedly the completion of the Parks Management Plan will introduce additionalmanagement objectives. Local strategic plans appear to have been prepared largely independent of oneanother and lack coordination across the five planning sectors dictated by the Muskwa-KechikaManagement Plan and Muskwa-Kechika Management Act. In particular, objectives are set for multiple,sometimes overlapping and conflicting values with little or no guidance as to how these conflicts mightbe resolved. Each local strategic plan deals with a portion of the M-KMA. There may be areas wherelocal strategic plans overlap and areas where there is no planning direction from local strategic plans.Objectives and targets from local strategic plans are set at widely varying scales with significantlydifferent levels of detail and precision. There is also considerable variation within individual localstrategic plans in the level of detail in defining objectives and targets.
Planning needs to be coordinated and consolidated and should precisely define how objectives are to bemet through specific indicators, targets and measures in order to be achievable and incorporated intomanagement activities. Information requirements for each indicator should be clearly defined. Of thecurrent set of local strategic plans, only the pre-tenure plan and landscape unit objectives provide clearlydefined indicators and targets that are, for the most part, measurable and verifiable. A large portion of theremaining objectives lack sufficient detail to reasonably define data requirements, develop indicators,establish baseline status or develop monitoring strategies. Once measurable and verifiable indicators havebeen developed for each objective, information gaps and data requirements can be established andprioritized. This process should occur through the development of a spatially explicit SustainableResources Management Plan for the M-KMA. This plan would direct M-K Trust Fund allocations,eliminating inventory and research gaps consistent with SRMP objectives, indicators and targets.
The Conservation Area Design (CAD) final report sums up the state of the base inventories andsubsequent modeling: “The underlying models have yet to be validated, tested or checked for sensitivityto estimated parameters. Additionally, most models are built upon data that also has underlyingweaknesses and spatial resolution limitations.” (Heinemeyer et al, 2004, page 9). In addition, theassumptions that were made in the CAD project itself resulted in a series of maps and analyses that areuseful only at the macroscopic level, and are not useful for adequately managing biodiversity.
Some of the assumptions that had to be made in the CAD truly demonstrate how limited the CAD modelsand maps are for anything more than a general overview of the ecological values that exist in the M-KMA. For example, the Ecological Land Units (ELU’s) generated as a surrogate for ecosystem mapping,are so coarse that any mapping, modeling or analyses based on such units is unreliable and likelymisleading, and may be more of a disservice to biodiversity management than having no analysiscompleted. Suggesting that a white spruce stand with 5% slope is ecologically the same or even similarto a black spruce stand with 80% slope is clearly an over-simplification of a model in order to account formissing data. This example is one of many that highlight the need for proper base inventories to form thefoundation of biodiversity management strategies.
4.1 Deficiencies of Current Planning Documents
In the last decade, various agencies and interest groups have generated a series of documents relative tothe M-KMA, all depicting genuine concerns to produce a balanced management of industrial activitiesand biodiversity conservation. Unfortunately, taken as a group, all of these documents identify aninordinate amount of objectives (see Appendix I), some of them redundant, but many with contradictory

MUSKWA-KECHIKA MANAGEMENT AREA PLANNING AND RESEARCH INTEGRATION PROJECT - 35
statements. As a result, when considering only the areas relevant to the M-KMA, the reader fails toidentify a concerted approach in the management of specific values, especially biological diversity(defined here as the variety and variability among living organisms and the ecological complexes inwhich they occur, NSF 1989). Furthermore, research programs conducted in the M-KMA during the last10 years are characterized by an apparent lack of information and / or coordination relative to vegetationinventories, communities’ structures, species richness, and ecological processes (e.g., animal-habitat andpredator-prey relationships).
Past inventories often favoured big game, at the expense of furbearers, non-game species, species at risk,etc. Many of these documents propose vague conservation strategies, largely due to incomplete datasets,some confusion about the use of different concepts (e.g., ecosystem vs. habitat), and the adoption ofreductionist approaches (e.g., aspatial ecosystem-based strategies, use of single elements as surrogates forspecies with complex, structured habitat requirements, etc.) based on untested theoretical concepts oroutdated references.
4.2 A Need for a Spatially Explicit Sustainable Resource Management Plan
In order to address most agencies’ objectives, it is necessary to develop a spatially explicit SustainableResource Management Plan for M-KMA with the purpose of promoting both biodiversity conservationand sustainable activities (i.e., cultural, recreational and industrial). A review of previous work suggeststhat such a plan would address the needs of coarse- and fine- filter species within a stratified landscape,where forest mosaics of various ages, compositions and origins are interspersed with non-forest covertypes. The plan would correspond to a multi-step process integrating scientific methods and managementprograms that have already been field-tested and proven effective for biodiversity conservation:
• Adequate vegetation community inventories (e.g., Timberline 1999, 2001, 2004, 2005).• Spatially explicit distributions for priority (e.g., species and community at risks, Proulx et al.
2003, 2004; LRMP-identified and commercial species) and indicator species and communities.These distributions relate to habitat use by animals during the most critical times of year;predictive distribution maps developed on the basis of habitat composition and structure arethoroughly field-tested with state-of-the-art protocols (e.g., Proulx and O’Doherty 2005).Spatially explicit distributions correspond to habitat types used by animals at regional levels. Theselection of priority/indicator species and communities must encompass various spatial andtemporal scales on the basis of a series of sound criteria (e.g., McLaren et al. 1998, Bani et al.2002). Such a list includes species that have been associated with late-successional stages (e.g.,Proulx et al. 2005a), or mosaics of various seral stages (Proulx 2005a, Proulx and Kariz 2005). Itis important to note that, although large animals (with large area requirements) may be selected asindicators (e.g., Noss et al. 1996, Wallis de Vries 1995, Heinemeyer et al. 2004, Proulx et al.2005b), smaller organisms (e.g., non-vascular plants, arthropods, small mammals, furbearers) arebetter suited to assess microenvironments and some ecological processes (Kerr 1997, Carey et al.1999, Vujanovic and Brisson 2001, Komonen 2003, Moen and Jonsson 2003, Proulx 2003b).
• Determination of multi-species management areas for coarse- and fine- filter species; in theseareas, various habitat conservation measures (e.g., OGMAs, reserves, WTPs, connectivitycorridors, etc.) may be implemented with properly managed industrial activities (Proulx 2005b).
• Integration of management constraints associated with the development of various industries,because the effective management of the human resource is critical to productive management ofthe natural resource (Lavin 1987).
• Integration of monitoring programs to permit planners, PAG, Fist Nations, various interestgroups, and government agencies to adapt management scenarios to changing socio-economicand biological constraints.
MUSKWA-KECHIKA MANAGEMENT AREA PLANNING AND RESEARCH INTEGRATION PROJECT - 36
A Spatially Explicit Sustainable Resource Management Plan for M-KMA does not currently exist, butmany of its components (Figure 1) have already been developed and validated by Bernier et al. (2001),Proulx and Bernier (2003), Proulx (2005b), and Proulx and Bernier (2005). Details of such a plan exceedthe scope of this report. It is worth mentioning, however, that this plan (Figure 1) properly addresses allthe objectives identified by various agencies and interest groups in their respective documents (AppendixI). It shares many of the conservation concepts presented in a recently developed Conservation AreaDesign (CAD) for the M-KMA (Heinemeyer et al. 2004), but is more holistic in approach, balancingsocial, economic and environmental values in the M-KMA. We recommend that a Spatially ExplicitSustainable Resource Management Plan be integrated with CAD’s macroscopic view of M-KMA regionsto delineate multi-species habitat areas (i.e., a refinement of Heinemeyer et al’ [2004] core areas) anddevelop a multi-resource management plan.
Stressing the Importance of Spatially Explicit, Organism-based Habitat ModelsOnce adequate vegetation and ecosystem datasets have been gathered for the whole area undermanagement, M-KMA managers must steer away from aspatial management programs and untestedecosystem-habitat models, where surrogates are often subjectively selected to identify ecosystems orcommunities with greater biodiversity potential. Aspatial management programs have been used in thepast for the establishment of OGMAs (e.g., MSRM, 2004) without knowing if this approach would resultin the identification of stands of acceptable quality for the maintenance of late-successional stages,wildlife communities, and species and communities at risk. In the last decade, several pseudo-spatial,theoretical models have been proposed (e.g., Forman 1995, McIntyre and Hobbs 1999, Bunnell et al.2003, Wells 2005, and others) based on unverified assumptions. As a result, associating species withsuch ecosystem models do not ensure thatpriority species will be located in most suitablehabitats. In Doak and Mills’ (1994) words, “aspecies or system may simply not operate inthe way envisioned by the theories applied toit”.
Habitat information is fundamental to matrixmanagement (patch size and orientation,contrast, connectivity, richness, etc.) and, inturn, to any comprehensive plan aiming toconserve biodiversity in managed landscapes.The understanding of distribution patterns forspecific species, which have been selectedeither because they represent well specific communities or because of their conservation status, is criticalfor determining:
3) The structural and floristic attributes that need to be retained to conserve particularspecies (Adams and Morrison 1993, Proulx 2001);
4) How many of these stand and / or landscape characteristics are needed (McComb andLindenmeyer 1999, Proulx 2001); and
5) How such attributes should be spatially arranged (Nelson and Morris 1994, Proulx2003a).
According to Root et al. (2003), three serious issues confront conservation planners worldwide. First,entire communities rather than single species need to be the focus of conservation efforts. Second,empirical information about vulnerable communities and their constituent species may be sparse. Third,species may be interacting with one another in complicated ways. Integrating the habitat needs of fine-
Levins (1966) showed that models of biological systems could begeneral, realistic, or precise. They may only be two of the three.Reductionist, aspatial or pseudo-spatial models tend to be generaland realistic. When faced with biodiversity conservation issues,spatially explicit, organism-based models (e.g., Proulx 2005), shouldbe considered because they are realistic and precise. Roger Powell North Carolina State University (2005, pers. commun.)

MUSKWA-KECHIKA MANAGEMENT AREA PLANNING AND RESEARCH INTEGRATION PROJECT - 37
and coarse-filter species (Proulx 2005b) is a good starting point for prioritizing the conservation ofspecific successional stages and protecting biodiversity.
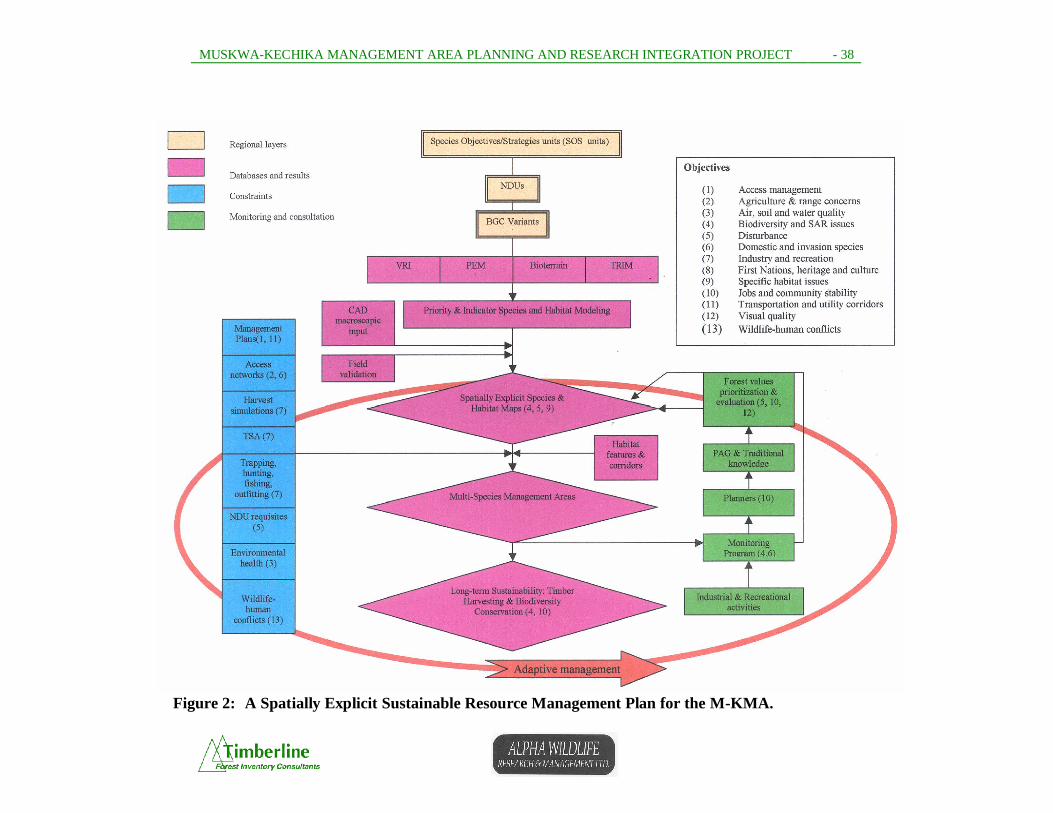
MUSKWA-KECHIKA MANAGEMENT AREA PLANNING AND RESEARCH INTEGRATION PROJECT - 38
Figure 2: A Spatially Explicit Sustainable Resource Management Plan for the M-KMA.

MUSKWA-KECHIKA MANAGEMENT AREA PLANNING AND RESEARCH INTEGRATION PROJECT - 39
Table 11 provides a general description of how the SRMP for the M-KMA might be developed andimplemented. Baseline (VRI / PEM) inventories should be completed in the first three years, providing afoundation for all future management research, inventory collection and monitoring. Predictivedistribution maps for priority species should be developed using existing VRI and PEM datasets and beexpanded as new inventory data is completed. Table 11 is a simplified example of how the developmentof an SRMP would be integrated with ongoing and past project work in the M-KMA.
Table 11: General Timeline for Implementation of an SRMP.
Year Action
0 Submission of Timberline/Alpha Wildlife report, and presentation to M-KMABoard
1
2Traditional knowledge andindustry consultations
3
Developmentof a SpatiallyExplicit SRMP
CompletionofVRI/PEMdatasets.Assessmentof pastVRI/PEMwork (ifjudgednecessary).
Predictivedistribution mapsfor priorityspecies & fieldvalidation usingexistingVRI/PEMdatasets, and newones generatedduring years 1 to3.
4
Wildlifepopulationdynamics andecologicalprocessesinvestigations.
Establishmentof multi-speciesmanagementareas,connectivitycorridors (seeFigure 1)
5 Long-term sustainability plan. Wildlife-conflicts educationprograms
6+
SRMPimplementationand update Monitoring (starting with year 6) every 3 years.
Adaptive management.Adjustment of multi-species management areas.
In summary, based on our review of the information available through the duration of this project wemake the following recommendations to the M-K Advisory Board:
1. Develop an inventory strategy that will allow an efficient, standardized means of completing theecosystem mapping and vegetation resources inventory for the M-KMA.
2. Consolidate and coordinate the overlapping objectives from multiple plans into a singleSustainable Resource Management Plan for the Muskwa-Kechika Management Area. Manyseparate planning zones will be based on pre-existing resource management zones.
3. Develop a 10-year plan for achieving priority objectives i.e. Species at Risk mapping andresearch may take a higher priority over other species, etc.
4. Develop and implement a data management plan for the M-KMA. This plan should address notonly the management of spatial data through a GIS but also the management of digital reports andother digital deliverables in a searchable archive. The data management plan should consider theuse of freely available open source software and the distribution of this data through an internet-based interface.

MUSKWA-KECHIKA MANAGEMENT AREA PLANNING AND RESEARCH INTEGRATION PROJECT - 40
5. Develop indicators for each objective in the SRMP with clearly defined inventory and researchneeds, measurement methodology, and monitoring and reporting requirements. Responsibilitiesfor monitoring and reporting should be clearly defined.
6. Develop a coordinated monitoring strategy that encompasses the monitoring and reportingrequirements of all plans under the SRMP and assigns responsibility for monitoring andreporting.
7. Support more partnerships with other agencies and resource businesses that are working towardsatisfying similar objectives in and around the M-KMA.
MUSKWA-KECHIKA MANAGEMENT AREA PLANNING AND RESEARCH INTEGRATION PROJECT - 41
5.0 References
Personal CommunicationAnthony Collett, PGeo, Geoscientist, Timberline Forest Inventory Consultants Ltd: Non-Renewable
Resource Inventories.John Deal, Canadian Forest Products Ltd: Caribou Inventory and Research.Louise Fox, Pacific Geoscience Centre, Geological Survey of Canada: Non-Renewable Resource
Inventories.Scott Fraser, Ministry of Water, Land and Air Protection: Parks Management Plan.Geoff Haines, Business Analyst, Oil and Gas Commission: Non-Renewable Resource Inventories.Pierre Johnstone, Ministry of Water, Land and Air Protection: Wildlife Management Plan.Chon Kim, formerly MOF Branch: Forest Cover Inventories.Bob Lane, PGeo Regional Geologist, Central/Northeast Region, Ministry of Energy, Mines and
Petroleum Resources: Non-Renewable Resource Inventories.Ray Lett, PGeo Geochemist, Geological Survey and Development Branch, Ministry of Energy, Mines and
Petroleum Resources: Non-Renewable Resource Inventories.Gib McArthur, PGeo, Manager, Resource Information Section, Ministry of Energy, Mines and Petroleum
Resources: Non-Renewable Resource Inventories.Scott McNay, formerly with Slocan Forest Products Ltd. - Mackenzie: Caribou Inventory and Research
in Mackenzie.Ted Murray, Formerly MSRM Branch: Recreation Features Inventory and Recreation Opportunity
Spectrum.Dick Nakatsu, MSRM Omenica Peace Region: Forest Cover and VRI.Kathy Parker, University of Northern British Columbia: Northern Land Use Institute Database, UNBC
project information.Lori Phillips, A/Stakeholder Relations Advisor, Oil and Gas Commission: Non-Renewable Resource
Inventories.Bob Purdon Senior Aboriginal Program Specialist, Oil and Gas Commission: Non-Renewable Resource
Inventories.Janet Riddell, PGeo Independent Geologist: Non-Renewable Resource Inventories.Luc Roberge, MOF Northern Interior Region: Visual Landscape InventoriesRandall Sweet, Manager, Resource Access, Oil and Gas Policy Section, Ministry of Energy, Mines and
Petroleum Resources: Non-Renewable Resource Inventories.John Wakelin, MSRM Resource Inventory Branch: Recreation Features Inv. and Recreation Opportunity
Spectrum.Ian Webster, PGeo Geologist, Resource Information Section, Ministry of Energy, Mines and Petroleum
Resources: Non-Renewable Resource Inventories.Gary Westfall, Northern Interior Region MoF: Recreation Features Inventory and Recreation Opportunity
Spectrum.
Literature ReferenceAdams, E. M., and M. L. Morrison. 1993. Effects of forest stand structure and composition on red-
breasted nuthatches and brown creepers. Journal of Wildlife Management 57: 616-629.

MUSKWA-KECHIKA MANAGEMENT AREA PLANNING AND RESEARCH INTEGRATION PROJECT - 42
Bani, L., M. Baietto, L. Bottoni, and R. Massa. 2002. The use of focal species in designing a habitatnetwork for a lowland area of Lombardy, Italy. Consernation Biology 16: 826-831.
B.C. Ministry of Energy and Mines. 2005. B.C. Ministry of Energy and Mines Website.http://www.em.gov.bc.ca.
B.C. Ministry of Forests. 2000. Fort Nelson Timber Supply Area Analysis Report. March 2000.Province of British Columbia. Victoria, B.C. 132pp.
B.C. Ministry of Forests. 2001. Mackenzie Timber Supply Area Analysis Report April 2001. Provinceof British Columbia. Victoria, B.C. 108pp.
B.C. Ministry of Forests. 2002. Fort St. John Timber Supply Area Analysis Report. June 2002.Province of British Columbia. Victoria, B.C. 152pp.
B.C. Ministry of Sustainable Resource Management. 2005. B.C. Ministry of Sustainable ResourceManagement Muskwa-Kechika Management Area Website. http://srmwww.gov.bc.ca/rmd/lrmp/mk/.
B.C. Ministry of Sustainable Resource Management. 2004. Background information and supportingdocumentation for the process involved in developing the recommended biodiversity objectives inthe PG TSA. Mimeogr., Northern Interior Region, Prince George.
Bernier, D., G. Proulx, and J. Johnson. 2001. Sustainable forestry initiative certification: discussionpaper for ecosystem indicators 1-5. Report published by Timberline Inventory Consultants andAlpha Wildlife Research & Management Ltd., and submitted to Canadian Forest Products Ltd.,Prince George, British Columbia 37 pages.
Bunnell, F. L., B. G. Dunsworth, D. J. Huggard, and L. L. Kremsater. 2003. Learning to sustainbiological diversity on Weyerhaeuser’s coastal tenure. The Forest Project, Weyerhaeuser, Nanaimo,B.C.
Carey, A. B., J. Kershner, B. Biswell, and L. Dominguez de Toledo. 1999. Ecological scale and forestdevelopment: squirrels, dietary fungi, and vascular plants in managed and unmanaged forests.Wildlife monographs No. 142.
Doak, D., and L. S. Mills. 1994. A useful role for theory in conservation. Ecology 75: 615-626.
Forest Ecosystem Solutions Ltd. 2004. Fort Nelson Timber Supply Timber Supply Review 3 DataPackage July 9, 2004. Prepared for the Fort Nelson TSA DFAM Group. 77pp.
Forman, R. T. 1995. Land mosaics: the ecology of landscapes and regions. Cambridge Univ. Press,New York.
Geological Survey of Canada. 2005. Geological Survey of Canada Website http://gsc.nrcan.gc.ca.Heinemeyer, K., R. Tingey, K. Ciruna, T. Lind, J. Pollock, B. Butterfield, J. Griggs, P. Iachetti, C. Bode,
T. Olenicki, E. Parkinson, C. Rumsey, and D. Sizemore. 2004. Conservation Area Design for theMuskwa-Kechika Management Area (M-KMA). A report of Nature Conservancy of Canada, RoundRiver Conservation Studies, and Dovetail Consulting Inc. submitted to B.C. Min. SustainableResour. Manage.
Kerr, J. T. 1997. Species richness, endemism, and the cjoice of areas for conservation. ConservationBiology 11: 1094-1100.
Komonen, A. 2003. Hotspots of insect diversity in boreal forests. Conservation Biology 17: 976-981.Lavin, M. J. 1987. Managing people managing trees: understanding today’s environment for natural
resource management. Forest Industry Lecture Series No. 19, University of Alberta, Edmonton.Levins, R. 1966. The strategy of model building in population biology. American Scientist 54: 421-431.

MUSKWA-KECHIKA MANAGEMENT AREA PLANNING AND RESEARCH INTEGRATION PROJECT - 43
Madrone Consultants Ltd. 2000. Ecosystem Mapping Program Development for the Muskwa-KechikaManagmenent Area (M-K - 99-2051). Muskwa-Kechika Trust Fund – Province of British Columba.Victoria, B.C. 56pp + app.
McComb, W. C., and D. B. Leindenmeyer. 1999. Dying, dead and down trees. Pages 335-372 in M.Hunter, ed. Maintaining biodiversity in forest ecosystems, Cambridge Univ. Press, Cambridge, UK.
McIntyre, S., and R. Hobbs. 1999. A framework for conceptualizing human effects on landscapes and itsrelevance to management and research models. Conservation Biology 13: 1282-1292.
Moen, J., and B. G. Jonsson. 2003. Edge effects on liverworts and lichens in forest patches in a mosaicof boreal forest and wetland. Conservation Biology 17: 380-388.
Muskwa-Kechika Advisory Board. 2005. Record of Decision Muskwa-Kechika Trust Fund 2005-2006.
Muskwa-Kechika Advisory Board. 2004. List of Muskwa-Kechika Trust Fund Projects for the Muskwa-Kechika Management Area. Trust Fund Projects from 1998 to March 31st, 2004.
Muskwa-Kechika Advisory Board. 2004. Record of Decision Muskwa-Kechika Trust Fund 2004-2005Expenditure Plan.
Muskwa-Kechika Advisory Board. 2003. Record of Decision Muskwa-Kechika Trust Fund 2003-2004Expenditure Plan. March 2003.
National Science Foundation (NSF). 1989. Loss of Biological Diversity: A Global Crisis RequiringInternational Solutions. A report to the National Science Board. Committee on InternationalScience's task force on global biodiversity. Washington D.C., 19 pages.
Nelson, J. L., and B. J. Morris. 1994. Nesting requirement of the yellow-tailed black cockatooCalyptorynchus funereus in mountain ash forest (Eucalyptus regnans) and implications for forestmanagement. Wildlife Research 21: 267-278.
Northern Inter_Agency Management Committee. 2004. Annual Report 2003-2004 on the Muskwa-Kechika Management Area. 76pp.
Noss, R. F., H. B. Quigley, M. G. Hornocker, T. Merrill, and P. C. Paquet. 1996. Conservation biologyand carnivore conservation in the Rocky Mountains. Conservation Biology 10: 949-963.
Proulx, G. 2001. Characteristics and management of American marten habitat at stand and landscapelevels. Alpha Wildlife Research & Management Ltd. report submitted to British Columbia Ministryof Forests, Prince George Forest District. 72 pages.
Proulx, G. 2003a. Predicting the distribution of mountain caribou, wolverine, fisher and grizzly bear inPrince George Forest District. II. Production and assessment of distribution maps for TFL30. AlphaWildlife Research & Management Ltd. report submitted to Canadian Forest Products Ltd., BritishColumbia Forest Investment Account Project. 31 pages.
Proulx, G. 2003b. On the use of verifier species in Canfor’s forest management programs. Pages 9-16 inC. Wainwright, editor. Species at risk, species indicators, and sustainable forest management inPrince George TSA: summary of presentations. FORREX – Forest Extension Partnership, Report 03-01, Kamloops, British Columbia.
Proulx, G. 2005a. Predicting the distribution of mountain caribou, wolverine, fisher and grizzly bear inPrince George Forest District III. Field verification of fisher predictive distribution maps, andobservations on other species at risk in Tree Farm Licence 30 – Final report. Alpha WildlifeResearch & Management Ltd. report submitted to Canadian Forest Products Ltd., British ColumbiaForest Investment Account Project, 20 pages.

MUSKWA-KECHIKA MANAGEMENT AREA PLANNING AND RESEARCH INTEGRATION PROJECT - 44
Proulx, G. 2005b. Integrating the habitat needs of fine- and coarse-filter species in landscape planning. InT. D. Hooper, editor. Proceedings of the Species at Risk 2004 Pathways to Recovery Conference.B.C. Species at Risk 2004 Pathways to Recovery Conference Organizing Committee, Victoria, B.C.:in press.
Proulx, G., and D. Bernier. 2003. Forest stewardship plan: a strategic approach for biodiversitymanagement in the Fort St. James District. Report published by Alpha Wildlife Research &Management Ltd. and Timberline Forest Inventory Consultants, and submitted to Canadian ForestProducts Ltd., Prince George, British Columbia, 13 pages.
Proulx, G., and D. Bernier. 2005. A comprehensive biodiversity conservation program: BOSS:submitted for publication.
Proulx, G., D. Bernier, and F. P. Caffrey. 2004. A field guide to species at risk in Canfor’s PlanningAreas in Central Interior British Columbia – 2004. Alpha Wildlife Publications, Sherwood Park,Alberta. 120 pages.
Proulx, G., D. Bernier, J. M. Heron, and K. A. Paige. 2003. A field guide to species at risk in the CoastForest Region of British Columbia. International Forest Products and British Columbia Ministry ofWater, Land and Air Protection, Victoria, 151 pages.
Proulx, G. , J. Farkvam, and R. Beauchesne. 2005b. Development of a query to predict late-winter muledeer distribution in Supply Block F, Prince George Forest District. Alpha Wildlife Research &Management Ltd. report submitted to Canadian Forest Products Ltd., British Columbia ForestInvestment Account Project, 16 pages.
Proulx, G., and R. Kariz. 2005. Winter habitat use by Moose, Alces alces, in central interior BritishColumbia. Canadian Field-Naturalist 119: in press.
Proulx, G., R. Kariz, and J. Farkvam. 2005a. Using forest inventory data to predict American martendistribution. In M. Santos-Reis, J.D.S. Birks, E.C. O’Doherty, and G. Proulx,, editors. 2005. Martesin carnivore communities. Alpha Wildlife Publications, Sherwood Park, Alberta, Canada: in press.
Proulx, G., and E. C. O’Doherty. 2005. Snowtracking to determine Martes winter distribution andhabitat use. In M. Santos-Reis, J.D.S. Birks, E.C. O’Doherty, and G. Proulx, editors. 2005. Martes incarnivore communities. Alpha Wildlife Publications, Sherwood Park, Alberta, Canada: in press.
Root, K. V., H. R. Akçakaya, and L. Ginzburg. 2003. A multiplespecies approach to ecologicalvaluation and conservation. Conservation Biology 17: 196-206.
Timberline Forest Inventory Consultants, 1999. Terrestrial Ecosystem Mapping of TFL 30. TechnicalReport prepared for Canadian Forest Products Ltd, Prince George, B.C.
Timberline Forest Inventory Consultants, 2001. Predictive Rare Ecosystem Mapping Methodology andStandards. Technical Report prepared for Ministry of Forests, Victoria, B.C.
Timberline Forest Inventory Consultants, 2004. Integrated TEM/VRI mapping for Mcleod Lake IndianBand. Technical Report prepared for Mcleod Lake Indian Band. Mcleod Lake, B.C.
Timberline Forest Inventory Consultants, 2005. Predictive Ecosystem Mapping of Prince George and FortSt. James Forest Districts. Technical Report prepared for Canadian Forest Products Ltd, PrinceGeorge, B.C.
Vujanovic V., and J. Brisson. 2001. Biodiversité microfomgique du Fagus grandifolia dans une forêtancienne: bioindicateurs et structure mycosociologique. Canadian field-Naturalist 115: 34-42.
Wallis de Vries, M. F. 1995. Large herbivores and the design of large-scale nature reserves in WesternEurope. Conservation Biology 9: 25-33.
Wells, R. W. 2005. Local level monitoring to sustain biological richness in the Fort Nelson TSA.Unpubl.report, unidentified organization, submitted to Canfor Fort Nelson Operations