mutual fund fragility - wharton financefinance.wharton.upenn.edu/~itayg/files/cme group-msri.pdf ·...
TRANSCRIPT

Mutual Fund FragilityNon-bank Runs and Financial Crises
CME GROUP-MSRI SEMINAR
Itay Goldstein, Wharton

Overview
The way investors get paid upon redemption in open-end mutual funds might create a first-mover advantage or strategic complementarities
This can amplify redemptions following adverse shocks
The problem gets more severe when the fund holds more illiquid assets
Implications for fund policies and possibly also for regulation
2

Bank Runs
Bank runs have plagued the financial system for many years
The concern of bank runs is a source of vast government intervention and regulation Deposit insurance Bank regulation (capital, liquidity, etc.) Various government authorities
involved: FDIC, Federal Reserve System, etc.
3

Economic Force behind Runs
Basic economic force behind runs is based on (Diamond and Dybvig, 1983): Strategic complementarities
Banks create liquidity by holding illiquid assets and liquid liabilities (deposits)
Depositors are promised a fixed amount if they want to withdraw
If many withdraw, the bank will have to liquidate assets at a loss, hurting those who don’t withdraw
Run arises as a self-fulfilling belief: People run because they think others will do so
4
What about Non-Bank Institutions?
Strategic complementarities and run-type behavior are not limited to banks
Recent Example provided by money-market funds
One feature that is common to money-market funds and banks is that they have fixed claims
This clearly enhances the first-mover advantage contributing to run dynamics
New thinking following the crisis involves moving away from the fixed-NAV model to a floating-NAV model as in other mutual funds
5

Run Dynamics in a Floating-NAV Model
However, moving to a floating-NAV model does not eliminate the first-mover advantage and the potential for run-like behavior
In a floating-NAV environment, investors can redeem shares and get the NAV as of the day of redemption
But, their redemptions will affect fund trading going forward hurting remaining investors in illiquid funds
This is the source of the first-mover advantage (or strategic complementarities)
6

7
Complementarities in Mutual Funds Redemptions
Day 1 Day 2 Day 3 Day 4 …
At 3:59pm, investor i submits redemption
NAV determined by the closing price at 4:00pm
Mutual fund trades to raise the cash or to restore cash balance.
• Source for complementarities: • Redemptions impose costs on remaining investors: • Costs include: commissions, bid-ask spread, price
impact, forced deviation from desired portfolio, liquidity-based trading.

Empirical Analysis of Flows in Equity Mutual Funds
Chen, Goldstein and Jiang (2010) Study flows in 4,393 actively-managed equity
funds from 1995-2005 Find stronger sensitivity of outflows to negative
performance in illiquid funds These funds generate greater complementarities Illiquid funds are: small-cap & mid-cap equity
funds (domestic or international), or single-country funds excluding US, UK, Japan and Canada. Or continuous measure of liquidity of portfolio
Pattern is weaker in funds that are mostly held by institutional investors Externalities are better internalized
8

Evidence from Chen, Goldstein, and Jiang (2010)
9

Corporate Bond Funds
Recently, there is growing interest in Corporate bond mutual funds in this context They are growing fast Their assets can be very illiquid and so
they generate stronger complementarities
Concern for fragility: Investors will pull their money out following signs of bad performance, amplified by the strategic complementarities
10

Distribution of Bond Fund Assets
11
0%
10%
20%
30%
40%
50%
60%
70%
80%
90%
100%
2000 2001 2002 2003 2004 2005 2006 2007 2008 2009 2010 2011 2012 2013
Corporate World Government Multisector State muni National muni
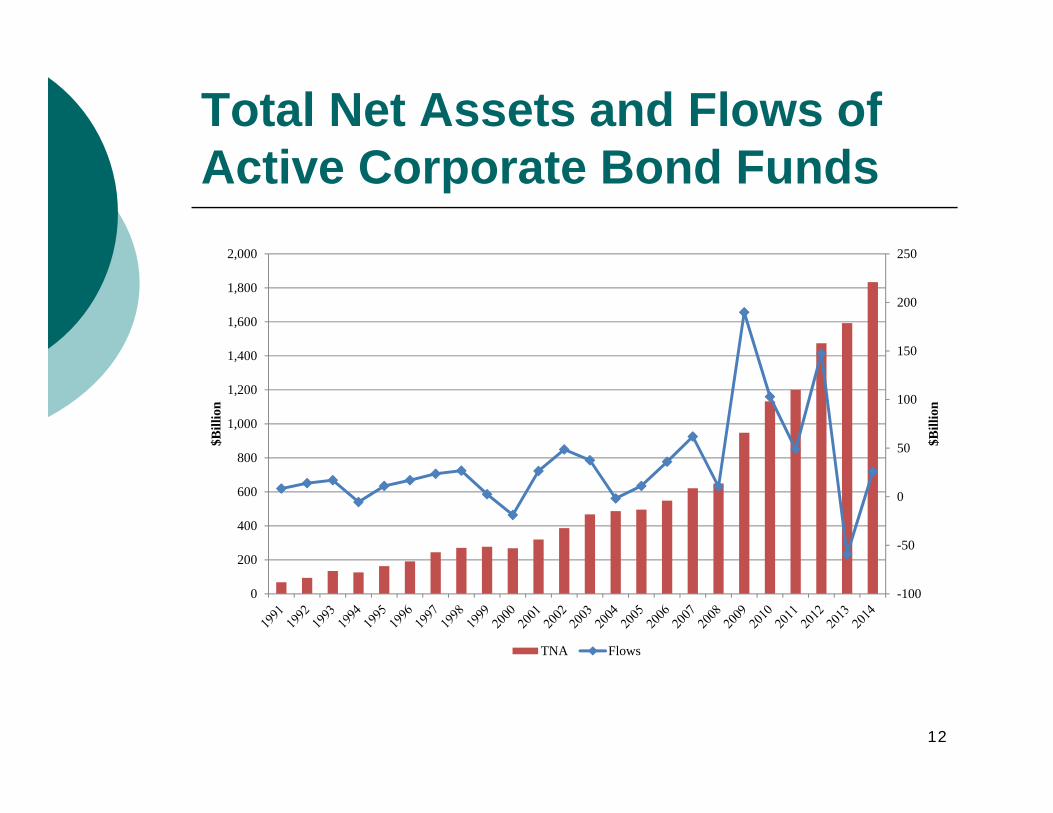
Total Net Assets and Flows of Active Corporate Bond Funds
12
-100
-50
0
50
100
150
200
250
0
200
400
600
800
1,000
1,200
1,400
1,600
1,800
2,000
$Bill
ion
$Bill
ion
TNA Flows

Empirical Analysis of Flows in Corporate Bond Mutual Funds
Goldstein, Jiang and Ng (2015) Study flows in 1,660 actively-managed corporate bond
funds from 1992-2014 Compare the pattern with that of equity funds Link pattern to illiquidity
Large literature on the flow-to-performance relation in equity funds, finding convex relation (greater sensitivity on upside than on downside)
We find that corporate bond funds are different: flow-to-performance relation tends to be concave
(greater sensitivity on downside than on upside) Pattern strengthens with illiquidity
Funds that hold less cash or periods with greater aggregate illiquidity
13

Flow Performance Relation of Corporate Bond Funds vs. Equity Funds
14
-0.1 -0.05 0 0.05 0.1-0.025
-0.02
-0.015
-0.01
-0.005
0
0.005
0.01
0.015
Performance
Flow
sBond Funds
-0.1 -0.05 0 0.05 0.1-0.02
-0.01
0
0.01
0.02
0.03
0.04
0.05
Performance
Flow
s
Stock Funds

Does redemption sensitivity disappear in aggregation?
15
-0.05 0 0.05-0.03
-0.025
-0.02
-0.015
-0.01
-0.005
0
0.005
0.01
0.015
Performance
Flow
s
Bond funds
-0.05 0 0.05-0.03
-0.025
-0.02
-0.015
-0.01
-0.005
0
0.005
0.01
0.015
Performance
Flow
s
Stock funds

Economic impact of Corporate Bond Fund Flows
Do outflows in bond funds have significant implications on market prices and the real economy?
Exploratory evidence Evaluate how corporate bond fund flows are related to Gilchrist
and Zakrajsek (2012)’s excess bond premium. Conduct a bivariate VAR with quarterly corporate bond fund
outflows and excess bond premium on a quarterly basis, and estimate the response of EBP to shocks to the corporate bond fund outflow.
Estimate the effect of corporate bond fund outflows on real-economy variables.
Sample period is from 1991Q1 to 2010Q3 with two lags of the endogenous variables.
16

Impact of Corporate Bond Fund Outflows on Excess Bond Premium
-.05
0.0
5.1
.15
% Im
pact
on
Exc
ess
Bond
Pre
miu
m
0 1 2 3 4 5 6 7 8 9 10 11 12 13 14 15 16 17 18 19 20Quarters after the Outflows shock
Following 1% increase in corporate bond fund outflows during a quarter, the excess bond premium rises during the contemporaneous quarter, and jumps up further by 9.2 and 7.6 basis points in next two quarters.
17

Impact of Corporate Bond Fund Outflows on GDP growth
-.15
-.1-.0
50
.05
% Im
pact
on
Log
GD
P G
row
th R
ates
0 1 2 3 4 5 6 7 8 9 10 11 12 13 14 15 16 17 18 19 20Quarters after the Outflows shock
18

Some Lessons
We need to pay attention to the liquidity mismatch created by mutual funds
Measures to reduce ‘first-mover advantage’ should be considered/implemented more prominently: Fund holding more liquidity/cash reserves (but, costly
to performance) Restriction on redemption frequency (but,
compromising liquidity to investors) Emergency rules: suspension of redemption;
redemption in kind…(but, seldom used, hard to implement)
Forward looking NAV calculation, e.g., swing pricing (but, hard to implement)
19

Some Lessons – Cont’d
Regulation may be needed if there are externalities going beyond the individual fund Fire-sale pricing leading to real implications
More broadly, regulating one part of the financial system will change the operation of other parts and create new risks Money market funds were largely a response to
tightened bank regulation Large activity in bond markets and bond funds is also
motivated by the need that cannot be easily filled by traditional banks
‘Shadow banking’ more generally
20