mutual fund investment how do mutual funds behave in emerging … · mutual fund investment how do...
TRANSCRIPT
POLICY RESEARCH WORKING PAPER 2529
Mutual Fund Investment How do mutual funds behavewhen they invest in emerging
in Emerging Markets economies? For one thing,mutual funds' flows are not
An Overview stable. Withdrawals from
emerging markets during
recent crises were large,
Graciela Kaminsky which squares with existing
Richard Lyons evidence of financial
Sergio Schmukler contagion.
The World Bank
Development Research Group
Macroeconomics and Growth
whichr sqarswih0xstn
Pub
lic D
iscl
osur
e A
utho
rized
Pub
lic D
iscl
osur
e A
utho
rized
Pub
lic D
iscl
osur
e A
utho
rized
Pub
lic D
iscl
osur
e A
utho
rized
POLICY RESEARCH WORKING PAPER 2529
Summary findings
International mutual funds are one of the main channels When investing abroad, U.S. mutual funds invest morefor capital flows to emerging economies. Although in equity than in bonds. World funds invest mainly inmutual funds have become important contributors to developed nations (Canada, Europe, Japan, and thefinancial market integration, little is known about their United States). Ten percent of their investment is in Asiainvestment allocation and strategies. Kaminsky, Lyons, and Latin America. Mutual funds usually invest in a fewand Schmukler provide an overview of mutual fund countries within each region.activity in emerging markets. Mutual fund investment was very responsive to the
First, they describe international mutual funds' relative crises of the 1990s. Withdrawals from emerging marketssize, asset allocation, and country allocation. during recent crises were large, which squares with
Second, they focus on fund behavior during crises, by existing evidence of financial contagion.analyzing data at the level of both investors and fund Investments in Asian and Latin American mutual fundsmanagers. are volatile. Because redemptions and injections are large
Among their findings: Equity investment in emerging relative to total funds under management, funds' flowsmarkets has grown rapidly in the 1990s, much of it are not stable. The cash held by managers duringflowing through mutual funds. Collectively, these funds injections and redemptions does not fluctuatehold a sizable share of market capitalization in emerging significantly, so investors' actions are typically reflectedeconomies. Asian and Latin American funds achieved the in emerging market inflows and outflows.fastest growth, but are smaller than domestic U.S. fundsand world funds.
This paper-a product of Macroeconomics and Growth, Development Research Group-is part of a larger effort in thegroup to understand the operation of financial markets and the effects of financial globalization. The study was funded bythe Bank's Research Support Budget under the research project "Mutual Funds in Emerging Markets." Copies of this paperare available free from the World Bank, 1818 H Street NW, Washington, DC 20433. Please contact Emily Khine, roomMC3 -347, telephone 202-473-7471, fax 202-522-351 8, email address [email protected]. Policy Research WorkingPapers are also posted on the Web at www.worldbank.org/research/workingpapers. The authors may be contacted [email protected], [email protected], or [email protected]. January 2001. (37 pages)
The Policy Research Working Paper Series disseminates the findings of work in progress to encourage the exchange of ideas aout
development issues. An objective ofthe series is to get the findings out quickly, even ifthe presentations are less than fully polished. Thepapers carry the names of the authors and should he cited accordingly. The findings, interpretations, and conclusions expressed in thispaper are entirely those of the authors. They do not necessarily represent the view of the World Bank, its Executive Directors, or the
countries they represent.
Produced by the Policy Research Dissemination Center
Mutual Fund Investment in Emerging Markets:An Overview
Graciela Kaminsky
Richard Lyons
Sergio Schmukler
JEL Classification Codes: F3, G1, G2
Keywords: mutual funds; emerging markets; capital flows; equity investment; contagion;crises
Respective affiliations are George Washington University, UC Berkeley and NBER, and the WorldBank, We benefited from comments received from Jonathan Garner and participants at theIMF/World Bank Conference on Contagion, IMF/World Bank Brown Bag Lunch, and a workshop atIDS-U. of Sussex. For help with data we thank Erik Sirri from the SEC, Konstantinos Tsatsaronisfrom the BIS, and Ian Wilson from Emerging Market Funds Research. For excellent researchassistance we thank Cicilia Harun, Sergio Kurlat, and Jon Tong. For financial support we thank theNSF, the World Bank (Latin American Regional Studies Program and Research Support Budget), andthe World Bank Research Advisory Committee.
Email addresses: gracicla([email protected], [email protected], ssclunukler(dworldbank.or .

I. Introduction
The crises initiated in Mexico 1994, Thailand 1997, and Russia 1998 had strong
spillover effects in their regions and around the world. As speculative attacks brought
down long-standing pegs, the attacked countries were driven into some of the deepest
recessions in modem times. Even countries that successfully defended their currencies
were scarred by deep recession due to the tight monetary conditions needed to fight the
attacks. These crises were not confined to national borders, nor were they confined to
specific regions. The Thai crisis engulfed-within days-Malaysia, Indonesia, and the
Philippines. The Russian crisis spread to countries as far apart as Brazil and Pakistan.
Even developed countries have been affected, with the Russian default and devaluation
reverberating in financial markets in the United States, Germany, and Great Britain.
The time clustering of crises in different countries generated a vast literature on
contagion.2 Several papers in the contagion literature concluded that financial links are
important in transmitting crises across countries. There is evidence that banks were
important in spreading the 1997 crisis, due to the lending channel, as shown by Kaminsky
and Reinhart (2000) and Van Rijckeghem and Weder (2000). Also, various aspects of
portfolio investors-such as hedge funds, closed-end country funds, and mutual funds-
were studied. [See, for example, Brown, Goetzmann, and Park (1998), Eichengreen and
Mathieson (1998), Frankel and Schmukler (1996, 1998, and 2000), Levy Yeyati and Ubide
(1998), Bowe and Domuta (1999), Borensztein and Gelos (1999), and Kaminsky, Lyons,
and Schmukler (2000a and 2000b), and Pan, Chain, and Wright (2000).] These papers
2 Many of the papers in this literature can be downloaded from www.worldbank.orc/contagioi.
1
conclude that there is evidence of institutional panic and herding. This type of behavior
might have helped spread crises even to countries with strong fundamentals. In Kaminsky,
Lyons, and Schmukler (2000a), we note that individuals, too, can contribute to this panic
by fleeing from funds--particularly mutual funds-forcing fund managers to sell when
fundamentals do not warrant selling.
The focus on institutional investors in generating contagion is warranted by the
simple fact that they are key players in the globalization of financial markets. International
investors integrate financial markets by holding assets from economies around the world.
Cross-border flows are important not only because they facilitate real investment and
diversify risk around the world, but also because when portfolio flows reverse, they
produce crises and sharp output contractions.
Cross-border investment, which has increased significantly in the 1990s, is mainly
channeled through mutual funds and pension funds. These fund types are especially
important for flows from developed countries to poorer countries.3 Moreover, these flows
from developed to poorer countries are large: a small fraction of a developed country's
assets can represent a large proportion of a middle-income country's market capitalization.
The objectives of this paper are twofold. First, the paper complements existing
work by providing an overview of the importance and behavior of international mutual
funds in emerging markets.4 The second objective is to determine whether mutual fund
investment tends to be stable, and whether stability holds also for crisis times. In principle,
3 Investment by poorer-country residents in international assets has increased, but remains relativelylimited (many restrictions still apply to local institutional investors). However, in many crises, localresidents fled the domestic market, producing large capital outflows relative to inflows.
4 Mutual funds from developing countries are also becoming important in some countries, helpingdevelop local capital markets. We do not cover those funds in this paper.
2
one would expect that mutual funds provide a way for individual investors, with long-run
horizons, to invest in bonds and equity. (Long horizons being relevant here because, over
the years, emerging countries--expected to converge to industrial countries-would need
to grow at a faster rate, and in the process provide higher returns than industrial countries.)
In this paper, we show the stability of mutual fund flows to emerging countries by
comparing the flows over time and, particularly, by focusing on crises.
There are two key advantages-beyond their growing importance-to studying
mutual funds vis-i-vis other investor types. The first is data quality. Mutual funds report
holdings to the SEC semi-annually. In addition, private companies compile mutual fund
data at higher frequencies, typically quarterly, by conducting surveys. These data enable
analysis in both the cross-sectional and time-series dimensions. In contrast, other
institutional investors, like pension funds and hedge funds, are not required to disclose
holdings. Nor have we found sources that compile voluntary disclosures for these investor
types.5 The second key advantage, beyond size, to studying mutual funds is that their
emerging market investment has grown considerably in scope and size. There now exist
quite specialized sub-categories within the broader mutual fund category. For example,
some funds specialize in a particular country; others specialize within a region; others
invest specifically in emerging markets; and others simply invest in emerging markets as
part of a global strategy.
The paper is organized as follows. Section II briefly describes the evolution of
capital flows to emerging markets. Section III covers the mutual fund investment in
Thus, to study the behavior of pension or hedge funds one would need estimates of portfolio changes.Brown, Goetzmann, and Park (1998) provide such estimates for hedge funds during the Asian crisis.
3
emerging markets, with particular attention to their size and holdings. Section IV analyzes
the behavior of mutual funds during crises. Section V concludes.
H. Brief istory of Capital Flows
Private capital flows are important for emerging economies, and that importance
continues to increase over time. Private flows now constitute most of the capital going to
emerging markets. By 1996, private flows accounted for 80 percent of total flows to all
developing countries. 6 Figure 1 and 2 summarize the major trends by plotting, respectively,
net private capital flows to the three largest emerging regions and the composition of flows
over the past 30 years.
Figure 1 shows that the 1970s witnessed a remarkable surge of capital flows to
emerging economies. The surge in flows was triggered by the oil shock in 1973-74, helped
by the growth of the Eurodollar market, and amplified by a spurt of bank lending during
1979-81. Latin America was the main recipient of this heavy capital inflow, with net flows
to the region peaking at $41 billion in 1981. Relative to regional GDP, inflows reached
about 6 percent. Flows in this episode mostly took the form of syndicated bank loans, as is
shown in Figure 2. The pace of international lending came to an abrupt end in 1982 with
the hike in world real interest rates to levels not seen since the 1930s. Suddenly, emerging
countries became the pariahs of international capital markets. Not only were they excluded
Emerging markets are typically defined as middle-income developing countries.
The data on capital flows comes from the World Bank databases, and from the World Bank publicationsPrivate Capital Flows to Developing Countries and Global Development Finance.
4
from voluntary capital markets, they were also forced to run current-account surpluses to
repay foreign debts.
By the late 1980s, there was a revival of international lending, with Latin America
becoming, once again, the darling of Wall Street. Flows to these countries made a
tremendous comeback. Capital flows to Asia also surged, increasing ten-fold from their
averages in the late 1980s. This time, however, the composition of capital flows changed
dramatically, with bank lending being replaced by foreign direct investment and portfolio
investment. As shown in Figure 2, bank lending to both Asia and Latin America declined
from 70 percent of net private capital flows in the 1970s to about 20 percent in the 1990s.
While foreign direct investment (FDI) constitutes the largest share of capital flow to Asia
and Latin America, portfolio investment (bonds and equity) has also increased
substantially, accounting for about 40 percent of total capital flows in the 1990s. In
absolute values, bond and equity flows to each region-excluding those counted as FDI-
increased from $1 billion in 1990 to $40 billion in 1996, with bond flows exceeding equity
flows since 1994 in Latin America. Note, too, that reported equity flows are
underestimated: any equity flow meant to acquire more than 10 percent of a company's
outstanding shares is recorded as FDI, which accounts for around 50 percent of total
capital flows.
Again in the 1990s, as in the 1980s, booms were followed by a slowdown of
capital inflows.8 The first episode occurred in the immediate aftermath of Mexico's
currency crisis in December 1994. In this case, capital inflows resumed for most countries
Many people refer to a slowdown in inflows as a "reversal." However, the term reversal is used in theliterature in various ways. For some, a reversal is a shift from inflows to outflows. For others, areversal is a reduction in inflows relative to what is expected.
5
within six months, and returned to their peak values soon thereafter. Capital flows to Asian
economies were largely unaffected, with the crisis being confined to a small number of
Latin American countries. The second, more severe slowdown came in 1997, during the
Asian crisis. The Russian default in August 1998 aggravated this process. This time,
capital flows collapsed to a trickle. The change in inflows was similar in magnitude to the
one after the so-called 1980s debt crisis, with total capital inflows to Latin America
declining about 35 percent and capital flows to Asia also falling about 35 percent.9 The
decline of short-term portfolio flows (bonds, equities, and bank lending) was even more
brutal, with flows in these categories declining about 60 percent in Latin America in 1998.
Overall, bond and equity flows to Latin America declined between 1996 and 1998, from
about $44 billion to about $15 billion. Bond and equity flows to Asia collapsed in 1998 to
$9 billion, from their peak in 1996 of $38 billion.
In sum, portfolio flows have become important among capital flows to emerging
markets. At the same time, portfolio flows have experienced large changes, forcing
countries to run current account surpluses and reduce internal demand, which lead to the
sharp contractions in output witnessed during recent crises. These flows are mostly
channeled through international institutional investors. In the next section, we analyze the
investment allocation of mutual funds, one of the most important of these institutional
investors in emerging markets.
9 During the debt crisis, capital inflows declined about 24 percent in the first year of the crisis and 53percent in the second year.
6
III. Mutual Fund Investment
Different data sources are needed to study the role of institutional investors. Unlike
the data on capital flows, which the World Bank collects on a regular basis, no agency has
complete information on institutional investors. Companies and institutions like the OECD,
the Securities and Exchange Commission (SEC), the Investment Company Institute,
Morningstar, Emerging Market Funds Research, Frank Russell, AMG Data Services,
Lipper Analytical Services, and State Street Bank have partial information on institutional
investors. One can obtain a general picture only by analyzing and combining the different
pieces of data, coming from various places.
This paper contributes to the literature not only by compiling information from
different sources and displaying it in a systematic way, but also by presenting new
evidence. The data from the World Bank and the BIS can be found in previous publications
in a very similar format. The data from other sources are new evidence, although part of
the data are displayed in a different format in some of the existing papers. The Appendix
Table summarizes the data sets used in this paper and their sources.
IH.a Size of Mutual Funds and Institutional Investors
Institutional investors-including mutual funds, pension funds, hedge funds, and
insurance companies-are a growing force in developed markets. Table 1 shows that
institutional investors held almost $11 trillion in the United States alone in 1995. U.S.
institutions of these four types held more than 50 percent of the assets held by institutions
across the world. When individual investors choose their portfolio allocation to emerging
7
markets, they typically make their purchase via mutual funds. In actively managed funds, it
is the fund manager who ultimately determines the portfolio allocation, by choosing how
the fund invests its assets (within the limits of the fund's defined scope). In index funds, the
manager's role is passive, aimed at replicating a predetermined index.
Mutual funds have become one of the main instruments for investing in emerging
markets. The first funds, in the 1980s, were closed-end funds; they are well suited to invest
in illiquid markets, because their shares cannot be redeemed. With increasing liquidity in
emerging markets, open-end funds have become the most widely used instrument. It is
important to recognize that mutual fund investors include other types of institutions as well.
For example, more than half of pension funds invest in emerging markets through existing
mutual funds. This is considered better for liquidity reasons and is also less expensive than
giving specific mandates to mangers. Therefore, by looking at mutual funds, one is counting
much of pension fund investment in emerging markets as well. A survey published at World
Bank (1997) estimates that pension funds hold around 1.5 to 2 percent of their portfolios
($50 billion-$70 billion) in assets from emerging markets.
Hedge funds are a newer type of institutional investor. They are still small relative
to the other institutional investor types. It is estimated that hedge funds held total assets of
around $81 billion by year-end 1997, only a small fraction of which is invested in
emerging markets.'0 Like other institutional investors, insurance companies are also
believed to invest only a small proportion of their assets in emerging markets. However,
to See Eichengreen and Mathieson (1998) for a detailed study on hedge funds.
8
unlike hedge funds, they hold a large amount of assets. More evidence on the investment
allocation of this industry is needed."
Of course, institutional investors in developed countries allocate part of their
international investment to both in developed and emerging markets. International
portfolios are more concentrated in equities than in bonds. However, banks invest part of
their own capital and some of their clients' assets in foreign bonds. Even though
institutional investors diversify internationally, there still exists a strong home bias. For
example, according to the World Bank (1997), U.S. equity pension funds held less than 9
percent of their assets in international instruments, and around 2 percent in emerging
markets (in 1994).
Even when international institutional investors only hold a small fraction of their
portfolio in emerging markets, they have an important presence in these economies, given
the relatively small size of their capital markets. Table 2 shows that funds dedicated to
emerging markets alone hold on average between 4 and 15 percent of the Asian, Latin
American, and transition economies' market capitalization. For comparison, Table 1
shows that holdings of U.S. mutual funds accounted for 15 percent of the U.S. market
capitalization (in 1996). In countries like Japan and the U.K., domestic funds held 4 and 8
percent of the local market capitalization in the same year.
In fact, the above estimates are conservative, because we have only included the
holdings of dedicated emerging market equity funds. This database excludes the holdings of
world funds, which account for a substantially larger share of the stock market
Beyond institutional investors, it is difficult to determine the direct holdings of individual investors.There are no regulatory agencies-like the Securities and Exchange Commission (SEC) or the Bankfor International Settlements (BIS)-or private companies-like Morningstar or Lipper AnalyticalServices-that keep appropriate records.
9
capitalization of emerging markets. 12 13 Moreover, some of the outstanding equity in
emerging markets-as well as in many developed countries-is not publicly traded
because it belongs to the families or corporations that control the companies. In sum, even
though we cannot provide precise estimates, one can argue that international mutual funds
hold a large and significant proportion of the publicly available equity.
Table 2 shows that the presence of mutual funds has grown substantially during the
1990s. Though net equity flows have declined from their 1993 peak-about 27 billion
dollars to Latin America and 21 billion dollars to Asia-the relative importance of mutual
funds has grown substantially. For example, dedicated emerging market equity funds held
$21 billion in Latin-American stocks at the end of 1995. By December 1997, their holdings
had increased to $40 billion. While mutual funds' growth in Asia has been less
pronounced, the presence of mutual funds is still important in many countries. Overall,
dedicated emerging market mutual funds held $77 billion in Asia at the onset of the crisis
(December 1996). While the absolute amount of mutual fund investment in transition
economies is not comparable to that in Asia and Latin America, funds' growth in these
transition economies has been remarkable. In fact, in terms of market capitalization, mutual
12 The data come from Emerging Market Funds Research, which collects aggregate data of emergingmarket mutual funds to track the net cash flows of nearly 1,400 international emerging market equityfunds, with an average position of about $120 billion in 1996. The data set covers both U.S.registered and offshore funds as well as funds registered in Luxembourg, United Kingdom, Ireland,Cayman Islands, Canada, and Switzerland. It includes both open and closed-end funds. Our data startwith the Mexican crisis and end in March 1999. Thus, it includes observations on the major currencycrises of the 1990s.
13 For example, the mutual fund industry estimates that international mutual funds hold between 60 and 70percent of the market capitalization in Hungary, instead of the estimates obtained in Table 2, whichall are below 30 percent. We thank Jonathan Garner, from DLJ, for raising this point.
10
funds have become big players in these markets, with their positions reaching large
proportions in Hungary and Poland.
lI.b Holdings of U.S. Mutual Funds
In this sub-section, we focus specifically on the mutual fund industry in the U.S. We
saw in Table 1 just how important the U.S. mutual fund industry is: it accounted for almost
60 percent of world mutual funds in 1995. Table 3 presents information on the number of
funds in the U.S., their net asset value, and the share of the largest funds in the second half
of the 1990s, reported according to the geographical specialization of their investment.
Figure 3 displays the allocation of mutual fund assets at the end of 1998, by asset type and
by regional exposure.14
Table 3 shows that the U.S. mutual fund industry expanded significantly during the
1990s. The total number of bond and stock funds increased from 2,355 to 10,144 from
1991 to 1998. Most assets were in bonds up to the end of 1993. In the last five years, most
assets switched to equity, increasing from 50 percent at the end of 1994 to 68 percent at the
end of 1998. The rest is mostly allocated to bonds (between 24 and 40 percent). Their net
asset value increased from $705 billion to $3.6 trillion between 1991 and 1998.
The exposure of U.S. mutual funds to emerging markets expanded substantially
during the 1990s as well. U.S. based open-end mutual funds had around $35 billion in
emerging markets by the end of 1996, from about $1 billion at the end of 1991. Figure 3
shows that, in 1998, 74 percent of the assets were held in assets from U.S. and Canada, 10
11
percent in European assets, 1 percent in Japanese assets, 1.3 in Asian assets, and 0.9
percent in Latin American assets. Although the percentage dedicated to emerging markets is
small, the large size of the U.S. mutual fund industry implies that the dollar amount held in
assets from emerging countries is significant.
Turning now to world funds, the number of funds in this category grew from 52 to
273 in the 1991-1998 period. The total net asset value increased from $16 billion to $125
billion over the same period. Most assets are allocated in stocks (between 83 and 87
percent). Bond holdings are small (between 2 and 4 percent). At the end of 1998, world
funds' assets were 34 percent from the U.S. and Canada, 37 percent from Europe, 4 percent
from Japan, 3 percent from Latin America, and 6 percent from Asia.
The most rapidly growing fund categories since 1991 are the emerging market
funds, Asia funds, and Latin American funds (though these fimds did start from a low
level). Emerging market funds increased from 3 funds in 1991 to 165 in 1998. The total net
asset value increased from $142 million to $13.5 billion over the same period, with a peak
of $17 billion in late 1997. These funds hold between 70 and 90 percent in stocks and the
rest in short-term interest-bearing securities ("cash"). In late 1998, 84 percent was
allocated to stocks. Regarding the geographic allocation, 30 percent was allocated in Asia,
30 percent in Latin America, and 11 percent in Europe.
Asia funds, excluding specialized Japanese funds, grew from 11 funds in 1991 to
154 in 1998. Their net assets grew from $1 billion to $6.5 billion over the same period.
Nevertheless, due to the Asian crisis, the total assets of Asian funds deteriorated during
14 Morningstar classifies the assets as being invested in one of six Countries/Regions: U.S. and Canada,Japan, Asia (ex Japan), Europe, Latin America, or other. Holdings are classified in one of four assetclasses: cash, stocks, bonds, or other.
12
1997 and 1998. At the end of 1996, the net asset value of Asia funds peaked, reaching $16
billion. One year later, the net asset value was $9 billion. These funds tend to hold at least
90 percent of their assets in stocks and the rest in cash. On December 31, 1998, 21 percent
was invested in Japan and 68 in the rest of Asia. The number of Latin American funds
increased from 1 to 47 between 1991 and 1998. Their net asset values increased
dramatically from $44 million to $1.8 billion. At the end of 1998, the Latin American funds
held 88 percent of their assets in stocks and 7 percent in cash.
Within each fund-type category, assets are concentrated in the largest funds. (This
does not hold for "All U.S. Funds" because 20 funds is a quite small share of the total
number of funds). Since 1991, the 20 largest world funds represented between 71 and 81
percent of this category. In the same period, emerging market funds captured between 67
and 100 percent of the market. The top 20 Asia funds accounted for 71-97 percent of the
market. In the case of the Latin American funds, the top funds accounted, on average, for 95
percent of the market.
Returning to Table 2, one can observe that not all the countries have the same
representation in dedicated mutual fund portfolios. Some countries capture a large share of
mutual fund assets. For example, Brazil, Mexico, Hong Kong, Korea, Malaysia, and
Taiwan receive the highest weight in mutual funds' portfolios; Colombia, Venezuela, and
China receive quite low weights. The country shares change over time.
In Asia, mutual funds invest primarily in Hong Kong, India, Korea, Malaysia,
Taiwan, and Thailand. Between 1995 and 1998, the share in Malaysia decreased from 12
percent to 4 percent, while the share in India Taiwan rose from 7 percent to around 14
percent. The top holding tends to be Hong Kong, with a share between 19 and 30 percent of
13
the fund assets. In Latin America, funds mostly invest in seven countries. On average they
hold the following portfolio: Brazil (38 percent), Mexico (30), Argentina (13), Chile (11),
Peru (3), Colombia (2), and Venezuela (2). The two largest countries-Brazil and
Mexico-account on average for 68 percent of the funds' holdings; while the four largest
countries-Argentina, Brazil, Chile, and Mexico-account for 93 percent of the assets.
Funds hold large positions in ADRs/GDRs (American and Global Depository Receipts),
traded on the New York Stock Exchange. Therefore, they often do not trade in the local
stock markets when investing abroad. Within the sample period, the share for Mexico grew
from 26 to 34 percent.'5 In the case of transition economies, mutual fund investment is
concentrated on five countries. On average, they hold assets in the Czech Republic (13
percent), Hungary (21), Poland (24), Russia & CIS (40), and the Slovak Republic (2). The
shares are volatile, for example, with Russia raging from 25 to 59 percent.
IV. The Behavior of Mutual Funds during Crises
Crises in the 1990s have not been country-specific, or even region-specific. Indeed,
there is consensus that crises have a contagious nature, with currency turmoil spreading to
countries as far apart as Argentina, the Czech Republic, and South Africa. Crises before
1990 also had a contagious nature, witness the debt crisis in 1982. But until recently,
contagion tended to be regional. The 1990s changed that. While the Asian flu was mostly
confined to south East Asia, it also triggered currency turmoil in Argentina, Mexico, and
Chile. The speculative attack on the Hong Kong dollar in October 1997 also traveled the
15 Data from Morningstar and SEC for Latin American funds show an almost identical picture.
14
globe, with even the stock market in the United States suffering sizable losses following the
15-percent fall of the Hang Seng index. The epidemic became more widespread following
the Russian default in August 1998, with stock market prices in all industrial countries
declining between 20 and 50 percent. The contagious nature of these recent crises has been
partly attributed to financial links, as we noted above.
The behavior of mutual funds can be consistent with contagion, either because they
generate spillovers or due to their feedback trading. First, international mutual funds can
contribute to spreading crises across countries if, for example, investors holding fund
shares might decide to sell their Asian funds when Russia devalues its currency. Or fund
managers of Latin American funds may sell assets in Brazil when a crisis hits Mexico.
These need not be irrational responses: new theories of rational herding explain the
transmission of crises through financial links. These models are based on elements like
asymmetric information and cross-market hedging. 16 Alternatively, if mutual fund investors
or managers follow past or current returns, their behavior will appear consistent with
contagion even though mutual funds are not main force driving the spillovers.
On the other hand, it is also possible that institutional investors, like mutual funds,
can be a stabilizing force. If investors buy mutual fund shares for long-run gains, they might
not withdraw their investments when there is a temporary crisis. For example, Marcis et al.
16 For example, in the model of Calvo and Mendoza (1998), the costs of gathering country-specificinformation induce rational investors to follow the herd. In the model of Calvo (1998), uninformedinvestors replicate selling by liquidity-squeezed informed investors, because the uninformedinvestors mistakenly (but rationally) believe that these sales are signaling worsening fundamentals.Kodres and Pritsker (1999) focus on investors who engage in cross-market hedging ofmacroeconomic risks. In that paper, international market comovement can occur in the absence ofany relevant information, and even in the absence of direct common factors across countries. Forexample, a negative shock to one country can lead informed investors to sell that country's assetsand buy assets of another country, increasing their exposure to the idiosyncratic factor of the secondcountry. Investors then hedge this new position by selling the assets of a third country, completingthe chain of contagion from the first country to the third.
15
(1995) and Rea (1996) claim that shareholders did not redeem shares during crisis
periods. Rather, they argue that net inflows to emerging markets are usually steady, and
crisis-period outflows are small and short-lived (at least during Mexico's crisis). Froot,
O'Connell, and Seasholes (2000) present a related picture, but without focusing on
institutional investors. They analyze, among other things, aggregated net flows into
individual emerging markets. Though net inflows decreased during the Mexican and Asian
crises, they find little evidence of net outflows.
In this section we provide evidence on the stability of mutual fund investment and
the behavior of mutual funds following speculative attacks. Where possible, we distinguish
the behavior of mutual fund managers from the actions of underlying investors. This section
examines data sets from various sources, including the Emerging Market Funds Research,
Morningstar, the SEC, and the BIS.
IV.a Mutual Fund Flows
We first examine the evidence of net flows from dedicated emerging market mutual
funds to Asia, Latin America, and transition economies (data from Emerging Market Funds
Research). Figure 4 shows the average quarterly net flows to these regions from 1995 to
1999. On balance, mutual fund flows to emerging markets since 1995 have been muted,
reaching about $20 billion, with booms in the capital flows being followed by pronounced
outflows, which were not persistent in the aftermath of the tequila crisis. Outflows from
Latin America reached about $4 billion in 1995, but mutual funds increased their positions
in Latin America by about $2 billion in the first half of 1996. The tequila crisis did not
have any spillovers in Asia or in transition economies. In fact, flows to Asia ballooned to
16
almost $11 billion, while flows to transition economies remained stable throughout 1995-
96. The picture changes after the outburst of currency turmoil in Asia. This time, mutual
funds pulled out not only from Asia, but from Latin America as well, with net outflows
from Latin America reaching about $1 billion in the six months following the collapse of
the Thai baht. Overall in 1998, mutual fund withdrawals took a turn for the worse, reaching
about $4 billion in Asia, with substantial outflows from Latin America and transition
economies.
Figure 5 provides a higher resolution picture of the spillover effects in crisis times.
It shows how the crisis, initiated in one country, triggered withdrawals in other countries.
The figure reports average quarterly flows (as a percent of mutual funds' initial positions)
to emerging countries in the two quarters following the recent crises. The top panel is the
aftermath of the Mexican devaluation in December 1994, the middle panel is the aftermath
of the collapse of the Thai baht in July 1997, and the bottom panel is the aftermath of the
Russian devaluation and moratorium in August 1998. To isolate the behavior of mutual
funds in crisis times, we subtract the mean flow (also in percent of their initial positions)
during the entire sample, 1995-1999.1 For example, following the Mexican devaluation,
mutual funds sold about 5 percent of their Brazilian positions (relative to their average
quarterly buying/selling during 1995 to 1999). Thus, as shown in the first panel in Figure 5,
Brazil experienced unusual withdrawals of about 5 percent in the aftermath of the Mexican
devaluation. To convey more clearly the extent of contagion across regions following the
initial speculative attack, we organize the country data according to the degree of severity
Models of asset trade (e.g., microstructure finance models) provide a theoretical basis for focusing onchanges in flow relative to what is expected; here, the latter is proxied by average flow.
17
of the outflows. Thus, for example, Malaysia was the country most affected in the aftennath
of the Russian crisis, with abnormal outflows of approximately 30 percent.
As discussed above, the repercussion of the three episodes of crises was
dramatically different. The so-called tequila crisis was circumscribed to Latin America.
Moreover, "abnormal" mutual fund withdrawals following the collapse of the Mexican
peso were confined to a handful of Latin American countries, with only Brazil and
Venezuela-besides the crisis country, Mexico-suffering average withdrawals of 5 and 2
percent in the two quarters following the devaluation. In contrast, mutual funds increased
their exposure to Asian countries and transition economies, with (above-trend) flows
oscillating around 4 percent for Asia and 11 percent for the transition economies.
The aftermath of the collapse of the Thai baht presents a different picture of the
international mutual funds industry. It is in this episode that we first observe signs of a
more general retrenchment of mutual funds in emerging markets. Mutual fund flows to
Asian economies are basically all well below trend in the two quarters following the
collapse of the Thai baht. Only flows to China, Pakistan, and Sri Lanka are above average.
Interestingly, after the collapse of the Thai baht, we observe substantial withdrawals from
Hong Kong, Singapore, Taiwan, with average quarterly withdrawals oscillating at about
12 percent above average in the case of Singapore and Taiwan, and about 7 percent for
Hong Kong. The retrenchment this time also reaches Latin America and the transition
economies, with withdrawals reaching about 6 percent for Colombia and 4 percent for the
Czech Republic during the two quarters following the outbreak of the Thai crisis.
Colombia, the Czech Republic, Chile, Hungary, and Peru are the countries most affected in
this episode, with outflows about 3 percent above average.
18
The flight away from emerging markets becomes more pronounced during the
Russian crisis, with about half of the countries in the sample experiencing abnormal sales
of about 10 percent or even larger. In some cases, withdrawals were massive. For
example, average mutual funds sales in Malaysia reached 30 percent and in the Czech
Republic were about 16 percent. Some Latin American countries were also dramatically
affected following the Russian collapse. For example, Colombia and Venezuela suffered
average quarterly outflows of about 8 percent. Mutual fund investments in Mexico and Peru
were the only ones that did not suffer following the worldwide turmoil triggered by the
Russian default. In fact, inflows to Mexico were 5 percent above the average observed in
the 1995-99 period.
IV.b Investors and Managers
Though mutual funds are commonly included among institutional investors, they
differ from hedge funds, pension funds, and insurance companies in the degree to which
underlying investors control portfolio size. Funds' behavior is thus determined by the
decisions of both managers and investors." This hybrid nature certainly affects mutual
funds' flows to countries and regions, as described in the previous sub-section.
This characteristic gives us a umique opportunity to study in detail the behavior of
two groups of agents. In Kaminsky, Lyons, and Schmukler (2000a), we study the behavior
of these groups, focusing on whether their trading strategies are driven by current and past
returns (e.g., momentum trading-the buying of past winners and selling of past losers).
19
Here, we provide more evidence on the influence of each group, reporting detailed data
from the BIS and the SEC. These data sets help us isolate the behavior of investors and
managers.
The behavior of underlying investors is described in Figures 6 and 7. Figure 6
shows the cash flows to Asian mutual funds over time, based in the U.S. and the U.K. This
decision belongs to investors. The figure shows that inflows to Asia were high before the
Asian crisis, particularly in 1995-96. After the Thai devaluation of 1997, large outflows
took place in the second half of 1997. The outflows continued in 1998, being particularly
large after the Russian crisis in the U.S.-based funds.
Figure 7 provides related information, plotting the evolution of aggregate net asset
positions and the injections/redemptions into/from the 13 Latin American mutual funds.' 9
Again, the latter are part of the investors' decision set. Injections (redemptions) are
measured by the percentage increase (decline) in the number of shares held by each mutual
fund (to control for fund size changes due to capital gains and losses). The pattern of
inflows and outflows corresponds to the recent crises. During the Mexican crisis, there
were large redemptions from Latin American funds, accounting for 25 percent of the
outstanding shares in the first quarter of 1995. Injections resumed to Latin American funds
1s Mutual funds here means open-end, non-index funds, which account for most of the funds that invest inemerging markets. For closed-end funds, investors do not control portfolio size. For index funds,managers have little control over portfolio holdings.
'9 The data come from Morningstar and the SEC. We work with holdings of the largest 13 Latin-Americaequity funds (open-end) from April 1993 to January 1999 (24 quarters). Those funds are FidelityLatin America, Morgan Stanley Dean Witter Institutional Latin America, Van Kampen Latin America(formerly Morgan Stanley), BT Investment Latin America Equity, TCW Galileo Latin AmericaEquity, TCW/Dean Witter Latin America Growth, Excelsior Latin America, Govett Latin America,Ivy South America, Scudder Latin America, T. Rowe Price Latin America, Merrill Lynch LatinAmerica, and Templeton Latin America. Not all of these funds existed from the beginning of oursample; on average we have about 10 quarters of data (out of a possible 24) per fund.
20
until the last quarter of 1997, during the Asian crisis. Redemptions continued during 1998,
increasing during the Russian crisis, and reaching 20 percent in late 1998 and early 1999.
As depicted in the graph, the fluctuations in injections/redemptions influence the funds' net
asset values, which are also determined by movements in the underlying stock prices.
The patterns of Figures 6 and 7 are closely associated to the ones on Figure 4.
During the Mexican crisis, investors pulled out of Latin American funds, and there was a
large outflow from Latin American countries. Then, investors and flows returned to Latin
American countries until the last quarter of 1997, when the Thai crisis expanded to other
countries. In Asia, there are no signs of fund outflows or investor redemptions during the
Mexican crisis, but there are large effects during the Asian crisis. This pattern suggests that
investors' decisions influence fund flows.
Now we turn to the managers. Managers cannot control the injections/redemptions
of underlying investors. What they can control is the use of "cash" or "short-term
positions" (e.g., U.S. Treasury bills). These positions help to buffer portfolios from
redemptions. Holding assets that are highly liquid allows managers to meet redemptions
without the need to sell less liquid assets. In principle, this can mute the volatility of
investment outflows. However, managers can also reinforce investors actions if they
increase their liquid positions in times of investor retrenchment. In this case, the volatility
of flows is amplified. It is also true that-in multiple-country portfolios-the decision
about which country to withdraw from belongs to the managers. 20 21
20 Investors obviously determine the withdrawal country in the case of single-country funds.
21 There are two drawbacks to this data set. First, here we use data only from Latin American funds. In thefuture, it will be interesting to study the behavior of managers by considering a broader set ofmutual-fund types. Second, our data do not provide a complete picture of managers' responses toliquidity squeezes because we do not have information on funds' credit lines with banks. Funds miredin redemptions may have resorted to using such credit lines.
21
Interestingly, short-term positions do not change as funds experience redemptions
or injections. This is clear from Table 4, which examines managers' choices about short-
term positions. The first row shows average short-term positions for all mutual funds. On
average, the funds in our sample hold approximately 5 percent of their assets in liquid
positions. The next three rows examine short-term positions in more detail according to the
size of the mutual fund. Again, we examine whether the size of the liquid positions changes
according to whether funds experience redemptions or injections. For the period examined,
it is the large funds that hold a larger share of their positions in liquid assets. This evidence
is somewhat unexpected because these are the funds that are likely to have better access to
bank credit lines and thus do not need to hold large liquid positions. With respect to the
funds' behavior in times of redemption and injection, both large and small mutual funds
hold smaller liquid positions in times of redemption, indicating that fund managers'
behavior has helped to smooth the effects of investors' withdrawals on equity markets in
Latin America. Medium-size funds, by contrast, hold more liquid assets in times of
redemption, thus magnifying investors' withdrawals from emerging markets.
V. Conclusion
The increasing globalization of financial markets and the crises of the 1990s have
spawned a vigorous literature on financial integration, international financial architecture,
and contagion. In this literature, a central element of the debate is the behavior of financial
markets. In particular, many have argued that financial markets are volatile and prone to
contagion. Most of this literature has focused on market imperfections, and how these
22
imperfections lead to herding behavior and financial cycles that are unrelated to market
fundamentals.
Though previous studies have covered several dimensions of foreign investors'
role in emerging markets, this paper provides an overview of a missing dimension-the
importance and behavior of international mutual funds. Institutional investors are the main
channel of financial flows to emerging markets, and mutual funds are large among the
institutional investors. Moreover, they are the only class of institutional investors for which
reliable data are available on an ongoing basis.
Several general findings emerged. First, equity investment in emerging markets has
grown rapidly in the 1990s. A significant proportion of that equity flow is channeled
through mutual funds. Collectively, these funds are large investors, and hold a sizeable
share of market capitalization in emerging countries.
Second, at the same time that mutual funds in general have experienced rapid
growth, Asian and Latin American funds were the ones achieving the fastest growth. Their
size remains small, however, when compared to domestic U.S. funds and world funds.
Third, when investing abroad, U.S. mutual funds invest mostly in equity rather than
bonds. Funds in the "World" category mainly invest in developed nations (the U.S.,
Canada, Europe, and Japan). Ten percent of their investment is devoted to Asia and Latin
America. Mutual funds mainly invest in the some countries within each region. In Latin
America, they primarily invest in Brazil and Mexico, then in Argentina and Chile. In Asia,
the largest shares are in Hong Kong, India, Korea, Malaysia, Taiwan, and Thailand. In
transition economies, mutual funds invest most of the assets in the Czech Republic,
Hungary, Poland, and Russia & CIS.
23
Fourth, mutual fund investment was very responsive during the crises of the 1990s.
The Mexican crisis mostly affected Latin America, while the Asian and Russian crises had
a large impact on Asian and Latin American funds. These findings are consistent with
previous finding in the contagion literature and with reports by industry analysts.
Fifth, the investment of underlying investors of Asian and Latin American funds is
volatile. Injections and redemptions are large relative to total funds under management.
The cash held by managers during injections/redemptions does not fluctuate significantly,
so the investors' actions are typically reflected in emerging market inflows and outflows.
To conclude, there are many questions that provide material for future research. To
test theories of financial crises, it would be valuable to examine the link between
institutional-investor behavior and country/market characteristics. Also, it would be useful
to compare the behavior of different types of funds-such as world, emerging market, and
regional funds-to provide evidence for discussions of international financial architecture.
These are areas that we are currently researching. Beyond studying institutional investors,
it would also be interesting to analyze the behavior of banks' proprietary trading in
emerging markets. This is an area where hard evidence is almost completely lacking.
24
References
Bank for International Settlements, 1998, 68th Annual Report, Basle, Switzerland.Borensztein, E. and Gelos, 1999, "A Panic-Prone Pack? The Behavior of Emerging Market
Mutual Funds," IMF.Bowe, Michal and Daniel Domuta, 1999, "Foreign Investor Behaviour and the Asian
Financial Crisis," working paper, University of Manchester.Brown, S., W. Goetzmann, and J. Park, 1998, "Hedge Funds and the Asian Currency Crisis
of 1997," NBER Working Paper 6427, February.Calvo, G., 1998, "Capital Market Contagion and Recession: An Explanation of the Russian
Virus," University of Maryland working paper.Calvo, G., and E. Mendoza, 2000, "Rational Herd Behavior and the Globalization of
Securities Markets," Journal ofInternational Economics, 51:1, June.Eichengreen, B., and D. Mathieson, 1998, "Hedge Funds and Financial Market Dynamics,"
Occasional Paper No. 166.Frankel, J. and S. Schmukler, 1996, "Country Fund Discounts and the Mexican Crisis of
December 1994: Did Local Residents Turn Pessimistic Before InternationalInvestors?" Open Economies Review, Vol. 7.
Frankel, J., and S. Schmukler, 1998, "Crisis, Contagion, and Country Funds," in R. Glick,ed., Managing Capital Flows and Exchange Rates (Cambridge University Press).
Frankel, J., and S. Schmukler, 2000, "Country Funds and Asymmetric Information,"International Journal ofFinance and Economics, 5:177-195.
Froot, K., P. O'Connell, and M. Seasholes, 2000, "The Portfolio Flows of InternationalInvestors, I," forthcoming Journal ofFinancial Economics.
Kaminsky, G. and C. Reinhart, 2000, "On Crises, Contagion, and Confusion," Journal ofInternational Economics, 51:1, June, pp. 145-168.
Kaminsky, G., R. Lyons, and S. Schmukler, 2000a, "Managers, Investors, and Crises:Mutual Fund Strategies in Emerging Markets," World Bank Working Paper No. 2399and NBER Working Paper 7855.
Kaminsky, G., R. Lyons, and S. Schmukler, 2000b, "Liquidity, Fragility, and Risk: TheBehavior of Mutual Funds during Crises," mimeo.
Kodres, L., and M. Pritsker, 1999, "A Rational Expectations Model of FinancialContagion," typescript, International Monetary Fund, May.
Levy Yeyati, Eduardo and Angel Ubide, 1998, "Crises, Contagion, and the Closed-EndCountry Fund Puzzle," IMF Working Paper 98-143
Marcis, R., S. West, and V. Leonard-Chambers, 1995, "Mutual Fund ShareholderResponse to Market Disruptions," Perspective, Investment Company Institute, 1:1.
Pan, Ming-Shiun, Kam Chain, and David Wright, 2000, "Divergent Expectations and theAsian Financial Crisis of 1997," forthcoming Journal of Financial Research.
Rea, J., 1996, "U.S. Emerging Market Funds: Hot Money or Stable Source of InvestmentCapital?" Perspective, Investment Company Institute, Vol. 2, No. 6.
Van Rijckeghem, Caroline and Beatrice Weder, 2000, 'Financial Contagion: Spilloversthrough Banking Centers," International Monetary Fund.
World Bank, 1997, Private Capital Flows to Developing Countries, World Bank PolicyResearch Report.
25
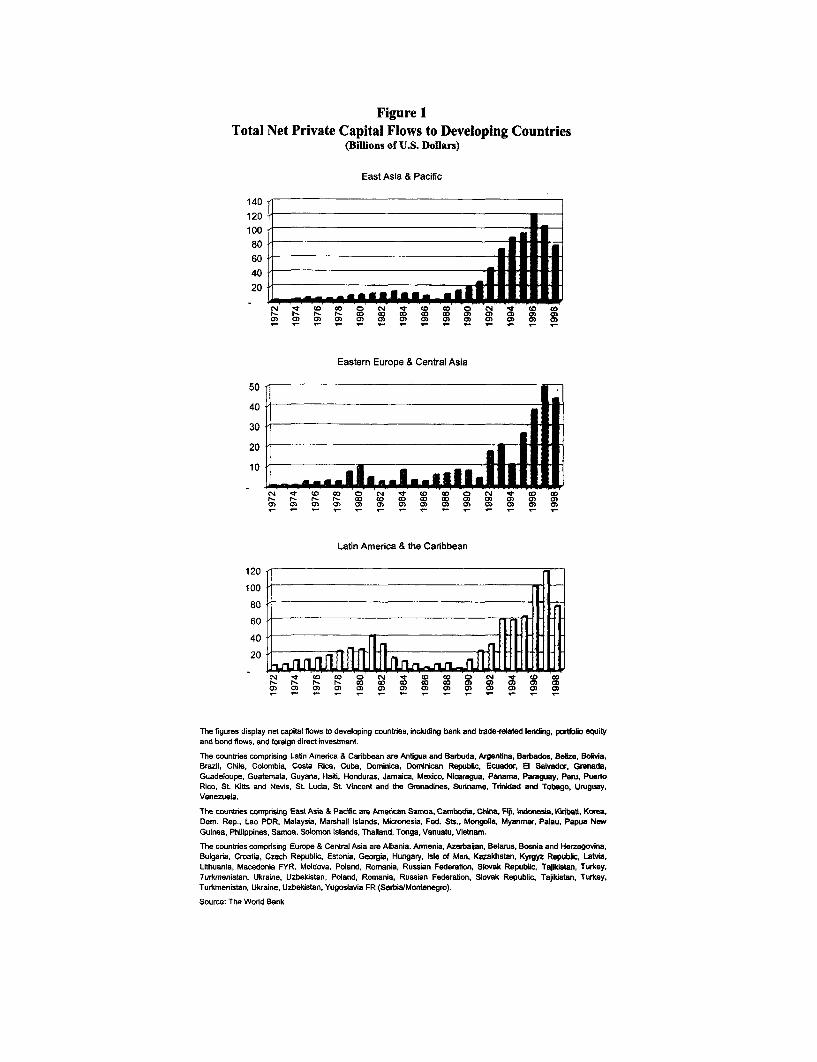
Figure 1Total Net Private Capital Flows to Developing Countries
(Billions of U.S. Dollars)
East Asia & Pacific
140
120
100806040
20
m It (o Go 0 C1 -W 0 co 0 -q to o
Eastern Europe & Central Asia
50
40
30
20
10
N q WO co 0 N 't CO 0 0 N 1 1 O COr- I- t c a G c 0 0t cot a M at ao at
Latin America & the Caribbean
120 -
100
80
60 Fill______________________
40
20 d___ __ __ _U __ __ UT__
The figures display net capital flows to developing countries, including bank and trade-related lending, portfolio equityand bond flows, and foreign direct investment.
The countries comprising Latin America & Caribbean are Antigua and Barbuda, Argentina, Barbados, Belize, Bolivia,Brazil, Chile, Colombia, Costa Pica, Cuba, Dominica, Dominican Republic, Ecuador, El Salvador, Grenada,Guadeloupe, Guatemala, Guyana, Haiti, Honduras, Jamaica, Mexico, Nicaragua, Panama, Paraguay, Peru, PuertoRico, St. Kitts and Nevis, St. Lucia, St. Vincent and the Grenadines, Suriname, Trinidad and Tobago, Uruguay,Venezuela.
The countries comprising East Asia & Pacific are American Samoa, Cambodia, China, Fit, Indonesia, Kiribati, Korea,Dem. Rep., Lao PDR, Malaysia, Marshall Islands, Micronesia, Fed. Sts., Mongolia, Myanmar, Palau, Papua NewGuinea, Philippines, Samoa, Solomon Islands, Thailand, Tonga, Vanuatu, Vietnam.
The countries comprising Europe & Central Asia are Albania, Armenia, Azerbajan, Belarus, Bosnia and Herzegovina,Bulgaria, Croatia, Czech Republic, Estonia, Georgia, Hungary, Isle of Man, Kazakhstan, Kyrgyz Republic, Latvia,Lithuania, Macedonia FYR, Moldova, Poland, Romania, Russian Federation, Slovak Republic, Tajikistan, Turkey,Turkmenistan, Ukraine, Uzbekistan, Poland, Romania, Russian Federation, Slovak Republic, Tajikistan, Turkey,Turkmenistan, Ukraine, Uzbekistan, Yugoslavia FR (Serbia/Montenegro).
Source: The World Bank
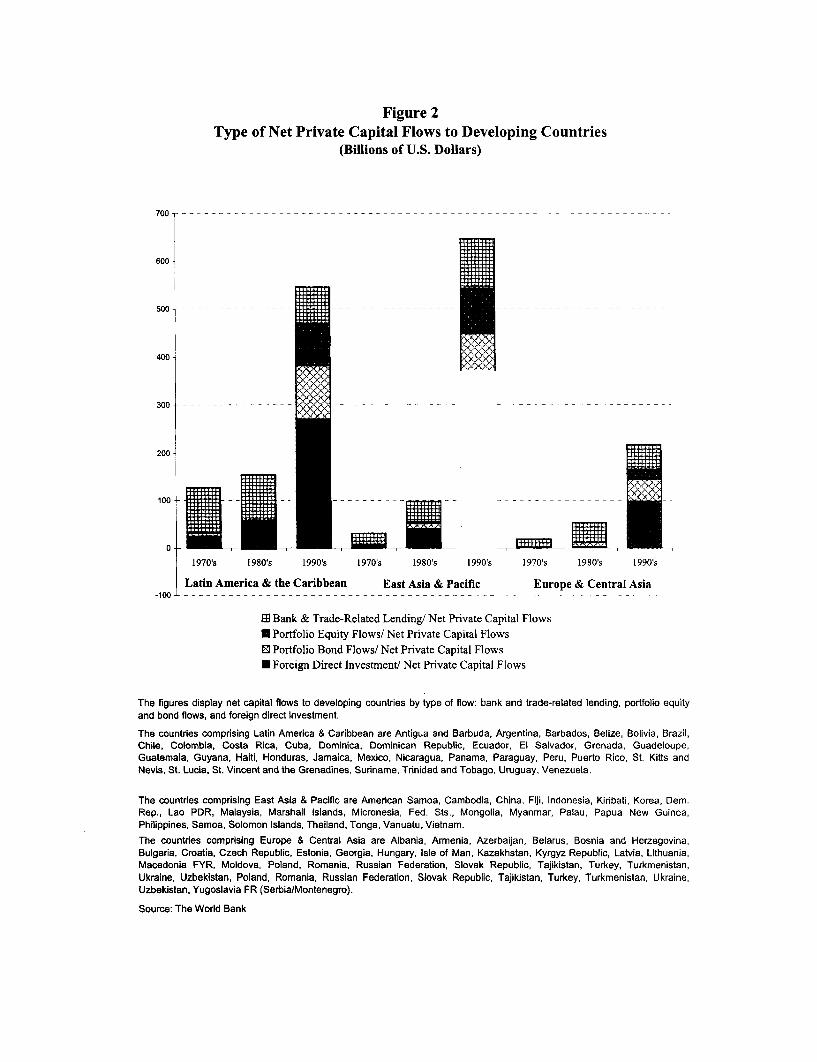
Figure 2Type of Net Private Capital Flows to Developing Countries
(Billions of U.S. Dollars)
700 - - - -
600
500 -- - - -- - - - - - - - - - - -- - - - - - - - - - - - -
400
300 - - - - - - - - - - - - - - - - - - - - - -- - - - - - - - - - - -
200
100 - f + i i - - - - - --- - - -- - --
0
1970's 1980's 1990's 1970's 1980's 1990's 1970's 1980's 1990's
Latin America & the Caribbean East Asia & Pacific Europe & Central Asia-100-'--------------------------------------------------------------------------- ------------
ED Bank & Trade-Related Lending/ Net Private Capital Flows* Portfolio Equity Flows/ Net Private Capital Flows* Portfolio Bond Flows/ Net Private Capital Flows* Foreign Direct Investment/ Net Private Capital Flows
The figures display net capital flows to developing countries by type of flow: bank and trade-related lending, portfolio equityand bond flows, and foreign direct investment.
The countries comprising Latin America & Caribbean are Antigua and Barbuda, Argentina, Barbados, Belize, Bolivia, Brazil,Chile, Colombia, Costa Rica, Cuba, Dominica, Dominican Republic, Ecuador, El Salvador, Grenada, Guadeloupe,Guatemala, Guyana, Haiti, Honduras, Jamaica, Mexico, Nicaragua, Panama, Paraguay, Peru, Puerto Rico, St. Kitts andNevis, St. Lucia, St. Vincent and the Grenadines, Suriname. Trinidad and Tobago, Uruguay, Venezuela.
The countries comprising East Asia & Pacific are American Samoa, Cambodia, China, Fiji, Indonesia, Kiribati, Korea, Dem.Rep., Lao PDR, Malaysia, Marshall Islands, Micronesia, Fed. Sts., Mongolia, Myanmar, Palau, Papua New Guinea,Philippines, Samoa, Solomon Islands, Thailand, Tonga, Vanuatu, Vietnam.
The countries comprising Europe & Central Asia are Albania, Armenia, Azerbaijan, Belarus, Bosnia and Herzegovina,Bulgaria, Croatia, Czech Republic, Estonia, Georgia, Hungary, Isle of Man, Kazakhstan, Kyrgyz Republic, Latvia, Lithuania,Macedonia FYR, Moldova, Poland, Romania, Russian Federation, Slovak Republic, Tajikistan, Turkey, Turkmenistan,Ukraine, Uzbekistan, Poland, Romania, Russian Federation, Slovak Republic, Tajikistan, Turkey, Turkmenistan, Ukraine,Uzbekistan, Yugoslavia FR (Serbia/Montenegro).
Source: The World Bank
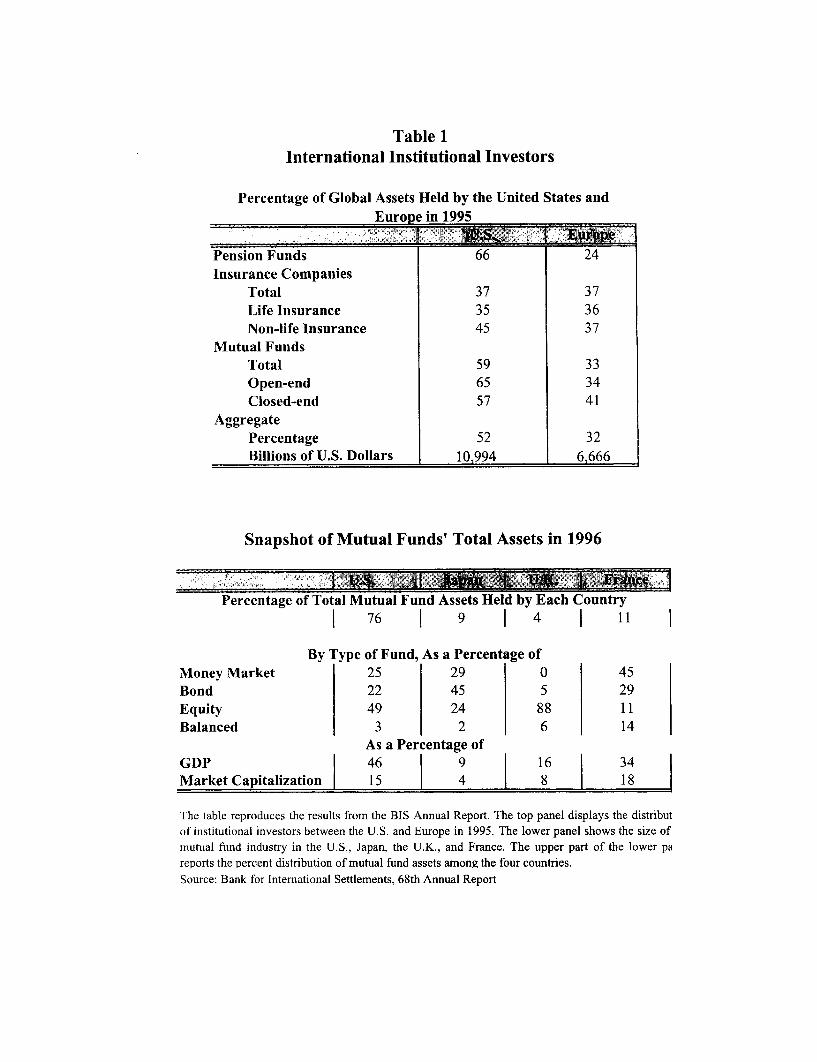
Table 1International Institutional Investors
Percentage of Global Assets Held by the United States andEurope in 1995
Pension Funds 66 24Insurance Companies
Total 37 37Life Insurance 35 36Non-life Insurance 45 37
Mutual FundsTotal 59 33Open-end 65 34Closed-end 57 41
AggregatePercentage 52 32Billions of U.S. Dollars 10,994 6,666
Snapshot of Mutual Funds' Total Assets in 1996
Percentage of Total Mutual Fund Assets Held by Each Country76 914 1 1
By Type of Fund, As a Percentage ofMoney Market 25 29 0 45Bond 22 45 5 29Equity 49 24 88 11Balanced 3 2 6 14
As a Percentage ofGDP 46 9 16 34Market Capitalization 15 4 8 18
The table reproduces the results from the BIS Annual Report. The top panel displays the distributof institutional investors between the U.S. and Europe in 1995. The lower panel shows the size ofmutual fund industry in the U.S., Japan, the U.K., and France. The upper part of the lower pareports the percent distribution of mutual fund assets among the four countries.Source: Bank for International Settlements, 68th Annual Report
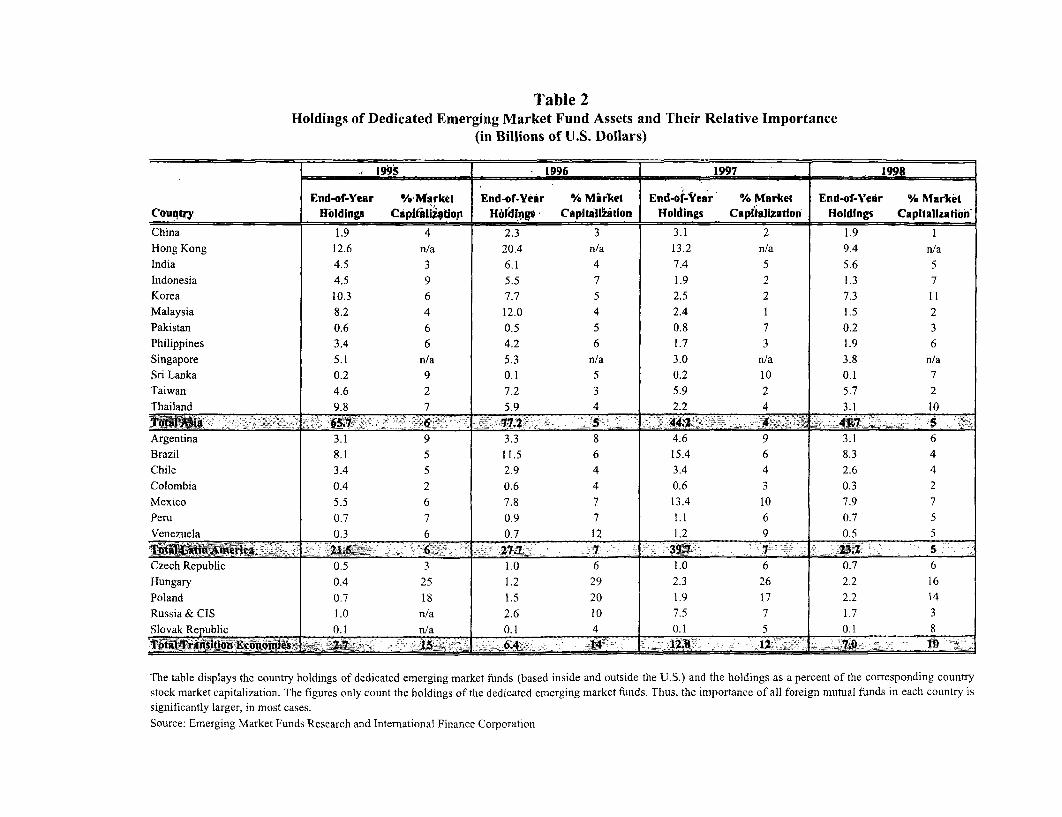
Table 2Holdings of Dedicated Emerging Market Fund Assets and Their Relative Importance
(in Billions of U.S. Dollars)
._ .1995 -1996 1997 1998
End-of-Year %WMarket End-of-Yir % Mirket End-of-Vear % Market End-of-YeAr % MarketCouqtry Ioldings Capiali4tion Holdings, Capitall6ktion Holdings Caplialization Holdings CapitalizationChina 1.9 4 2.3 3 3.1 2 1.9 1Hong Kong 12.6 n/a 20.4 n/a 13.2 n/a 9.4 n/aIndia 4.5 3 6.1 4 7.4 5 5.6 5Indonesia 4.5 9 5.5 7 1.9 2 1.3 7Korea 10.3 6 7.7 5 2.5 2 7.3 11Malaysia 8.2 4 12.0 4 2.4 1 1.5 2Pakistan 0.6 6 0.5 5 0.8 7 0.2 3Philippines 3.4 6 4.2 6 1.7 3 1.9 6Singapore 5.1 n/a 5.3 n/a 3.0 n/a 3.8 n/aSriLanka 0.2 9 0.1 5 0.2 10 0.1 7Taiwan 4.6 2 7.2 3 5.9 2 5.7 2Thailand 9.8 7 5.9 4 2.2 4 3.1 10Total Miai 65.7 6 77,2 5 44.2 4 41.75Argentina 3.1 9 3.3 8 4.6 9 3.1 6Brazil 8.1 5 11.5 6 15.4 6 8.3 4Chile 3.4 5 2.9 4 3.4 4 2.6 4Colombia 0.4 2 0.6 4 0.6 3 0.3 2Mexico 5.5 6 7.8 7 13.4 10 7.9 7Peru 0.7 7 0.9 7 1.1 6 0.7 5Venezuela 0.3 6 0.7 12 1.2 9 0.5 5Total Lastin Amcrica 21.15 6 27.7 739 7 7 23.1 5Czech Republic 0.5 3 1.0 6 1.0 6 0.7 6Hungary 0.4 25 1.2 29 2.3 26 2.2 16Poland 0.7 18 1.5 20 1.9 17 2.2 14Russia & CIS 1.0 n/a 2.6 10 7.5 7 1.7 3Slovak Republic 0.1 n/a 0.1 4 0.1 5 0.1 8TotalTransition Economies 2.7 1 6.4 14 - 12.8 12 7.__7-0 l
The table displays the country holdings of dedicated emerging market funds (based inside and outside the U.S.) and the holdings as a percent of the corresponding countrystock market capitalization. The figures only count the holdings of the dedicated emerging market funds. Thus, the importance of all foreign mutual funds in each country issignificantly larger, in most cases.Source: Emerging Market Funds Research and International Finance Corporation
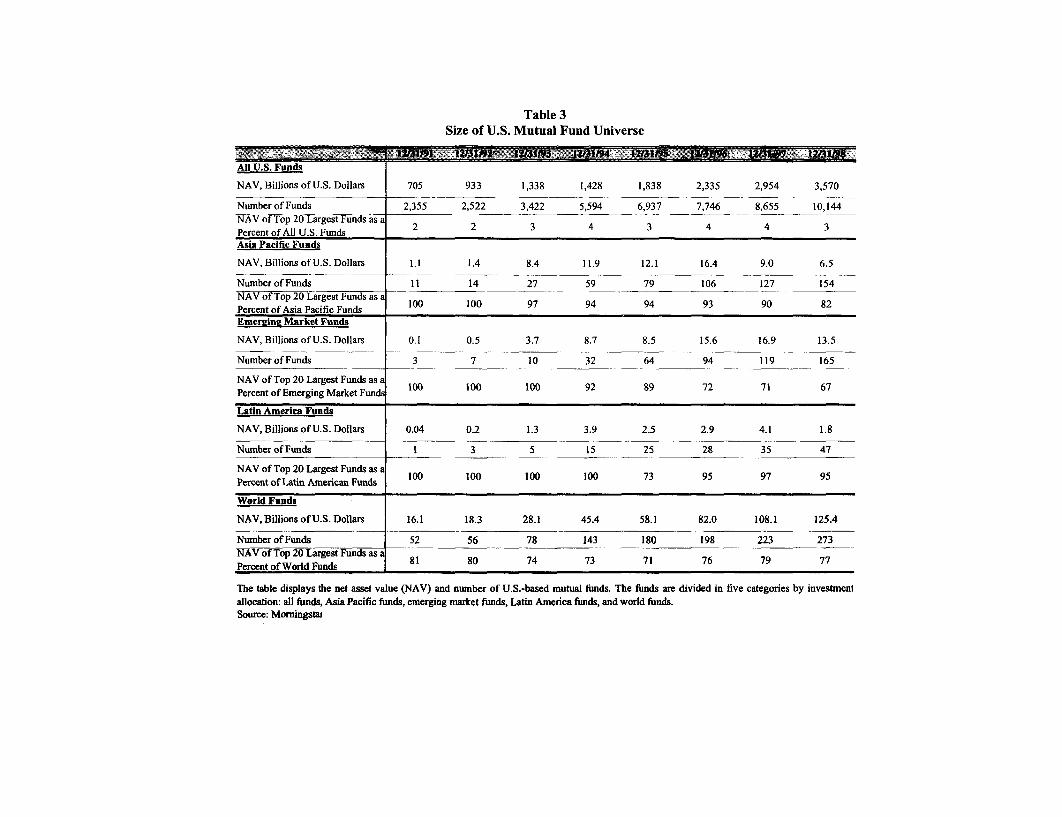
Table 3Size of U.S. Mutual Fund Universe
AII U.S. Funds
NAV, Billions of U.S. Dollars 705 933 1,338 1,428 1,838 2,335 2,954 3,570
Number of Funds 2,355 2,522 3,422 5,594 6,937 7,746 8,655 10,144NAV ofTop 20 Largest Funds asaPercent of All U.S. Funds 2 2 3 4 3 4 4 3
Asia Pacific Funds
NAV, Billions ofU.S. Dollars 1.1 1.4 8.4 11.9 12.1 16.4 9.0 6.5
Number of Funds 11 14 27 59 79 106 127 154NAV of Top 20 Largest Funds as aPercent of Asia Pacific Funds 100 100 97 94 94 93 90 82Emerping Market Funds
NAV, Billions ofU.S. Dollars 0.1 0.5 3.7 8.7 8.5 15.6 16.9 13.5
Number of Funds 3 7 10 32 64 94 119 165
NAV of Top 20 Largest Funds as aPercent of Emerging Market Funds 100 100 100 92 89 72 71 67
Latin America Funds
NAV, Billions ofU.S. Dollars 0.04 0.2 1.3 3.9 2.5 2.9 4.1 1.8
Number of Funds 1 3 5 15 25 28 35 47
NAV of Top 20 Largest Funds as aPeentfatnAmrca uns 100 100 100 100 73 95 97 95Percent of Latin American Funds
World Funds
NAV, Billions ofU.S. Dollars 16.1 18.3 28.1 45.4 58.1 82.0 108.1 125.4
Number of Funds 52 56 78 143 180 198 223 273NAV of Top 20 Largest Funds as a
PecetofWrl uns81 80 74 73 71 76 79 77Percent of World Funds
The table displays the net asset value (NAV) and number of U.S.-based mutual finds. The finds are divided in five categories by investmentallocation: all funds, Asia Pacific funds, emerging market funds, Latin America funds, and world funds.Source: Momingstar
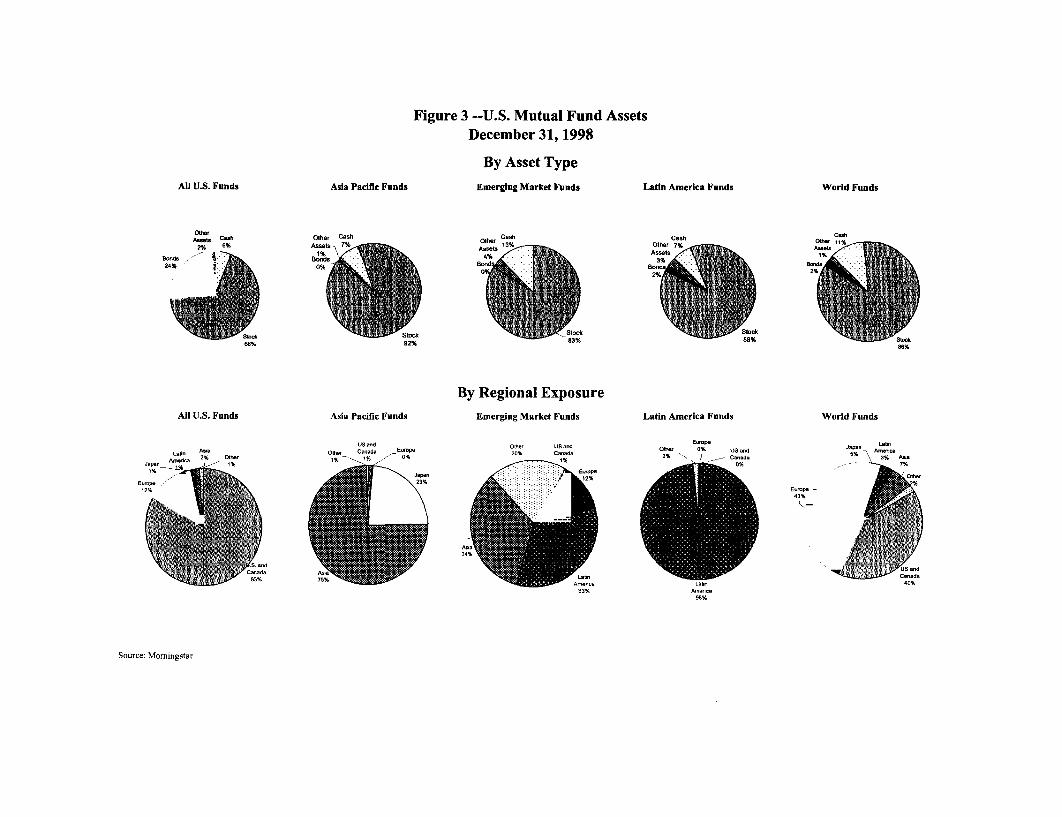
Figure 3 --U.S. Mutual Fund AssetsDecember 31, 1998
By Asset TypeAll U.S. Funds Asia Pacific Funds Emerging Market Funds Latin America Funds World Funds
ca.h other Cash Cash Cash Cash
Aset Cash other oths 112s6%
98%
Source: Morningstar
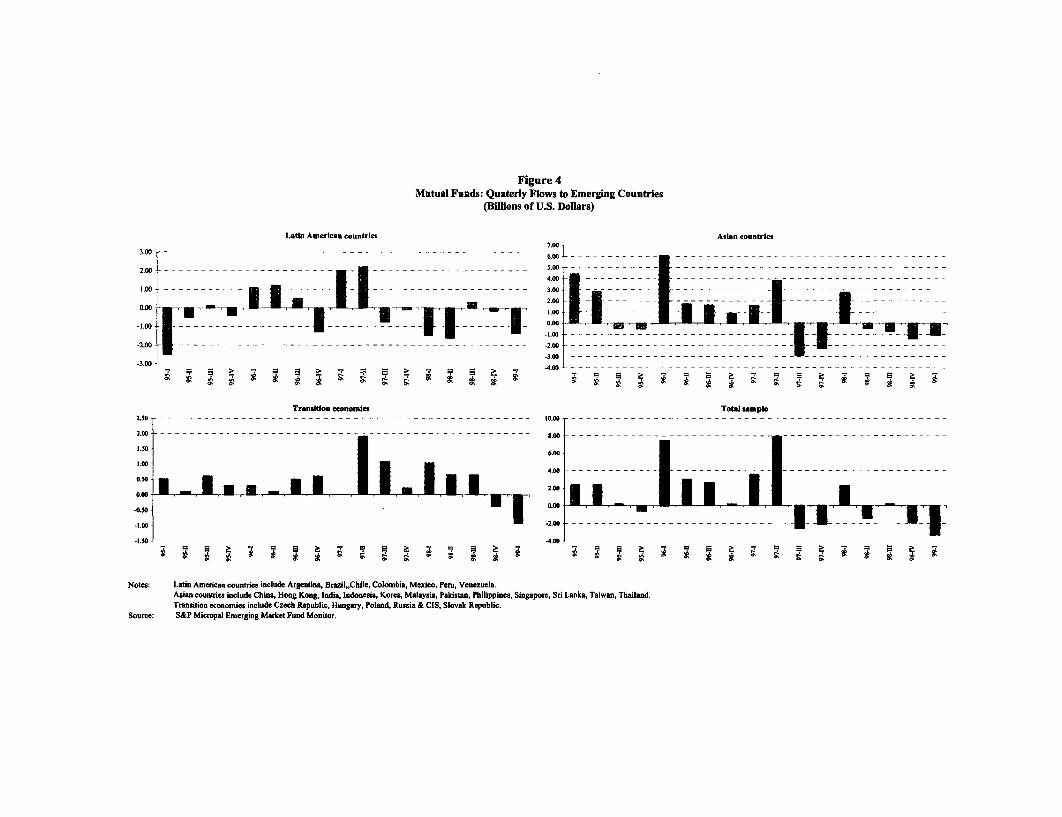
Figure 4Mutual Funds: Quaterly Flows to Emerging Countries
(Billions of U.S. Dollars)
Latin American countries Asian countries7400
304-.-- -- - - - - - - - - - - - - - - 00 - - - - - - - - - - - - - - - - - - - - - - - - - - - - - - - - - - - - - - --- --
200 - - _ -00 - --4t 00 -- - -
200 - ------ -- *- --- - 30 --
-1.00 - --------- - - - --- - - ------- - 000 o
-1.00 ----- --- - -- - - -- - -
-3300-3.00 -3.00 t - - - - - - - - - - - - - - - - - - - - - - - -
A -7
Transition economies Total sample2.500 -- - - - - --- - - - - - - - - - - - - - - - - -- - - - -- - - - - ---- - -.-- -- 800--- ---- - ------ - - - - - - - - ---- - - - --- -
1.50 600
1.00
0.00 - -l -400 ------- -------200
-1.50 4.00
Notes: Latin American countries include Argentina, Brazil,,Chile, Colombia, Mexico, Peru, Venezuela.Asian countries include China, Hong Kong, India, Indonesia, Korea, Malaysia, Pakistan, Philippines, Singapore, Sri Lanka, Taiwan. Thailand.Transition economies include Czech Republic, Hungary, Poland, Russia & CIS, Slovak Republic.
Source: S&P Micropal Emerging Market Fund Monitor.
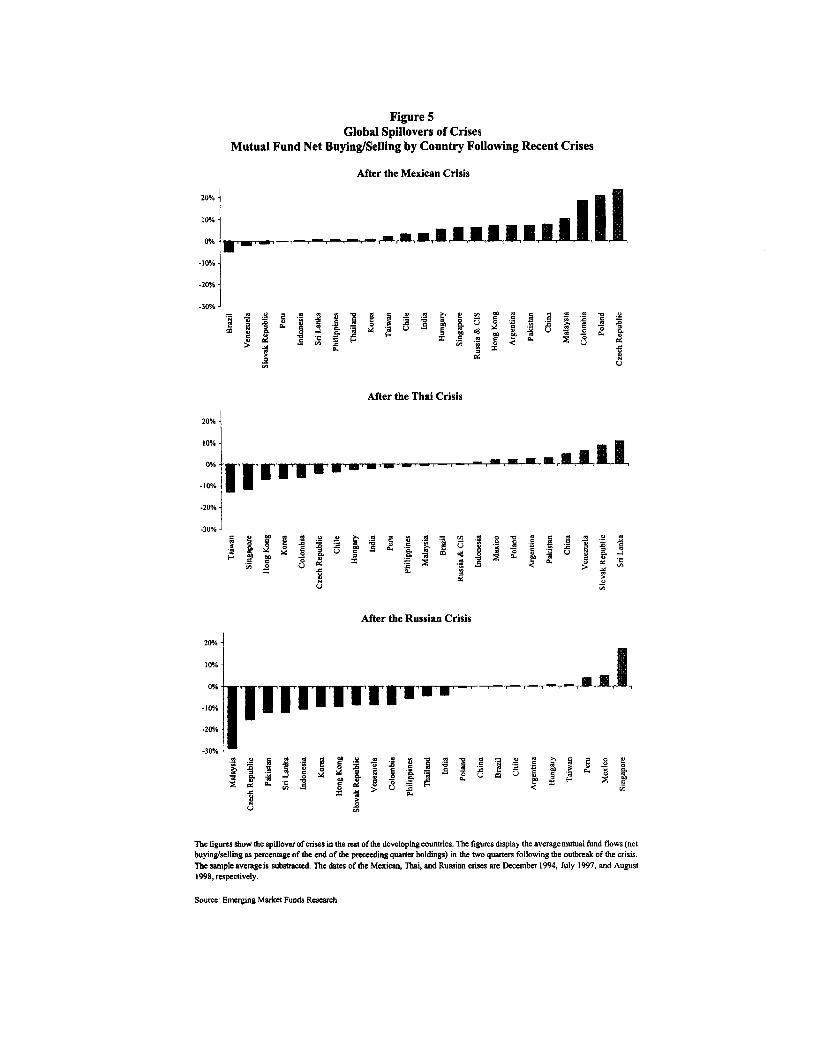
Figure 5Global Spillovers of Crises
Mutual Fund Net Buying/Selling by Country Following Recent Crises
After the Mexican Crisis
20%
10%:
-10%
-20%
-30%1
0 N
After the Thai Crisis
20%j
10%
-20%
-30%
0C . U C2 5.
'C i2 . > .
After the Russian Crisis
20%
-30%
0. C
The figures show dhe spillover of crises in the ress oftlie developing countries. The figures display the averagernutual fusnd flows (netbuying/selling as percentage of she end of the preceeding quarter holdings) in the two quarters following the outbreak of the crisis.The sample average is substracted. The dates of the Mexican, Thai, and Russian crises are December 1994, July 1997, and August1998, respectively.
Source: Emerging Market Funds Research
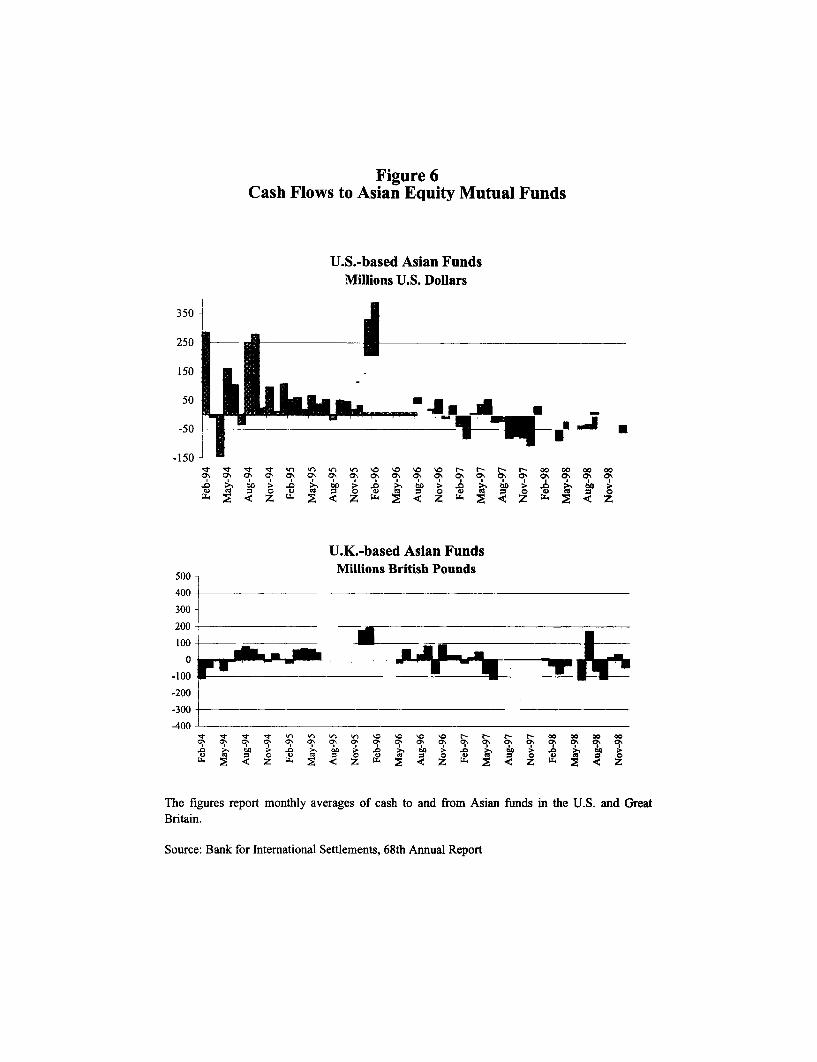
Figure 6Cash Flows to Asian Equity Mutual Funds
U.S.-based Asian FundsMillions U.S. Dollars
350
250
150
50
-50
-1500% 0M ON C% 0ý CN CN C% 0N 0C0N0% 0 0% C, ON ON CN 0\ 0\
U.K.-based Asian Funds
500 Millions British Pounds
400
300
200-- -
100
-100 VOL_
-200
-300
.400
The figures report monthly averages of cash to and from Asian funds in the U.S. and GreatBritain.
Source: Bank for International Settlements, 68th Annual Report
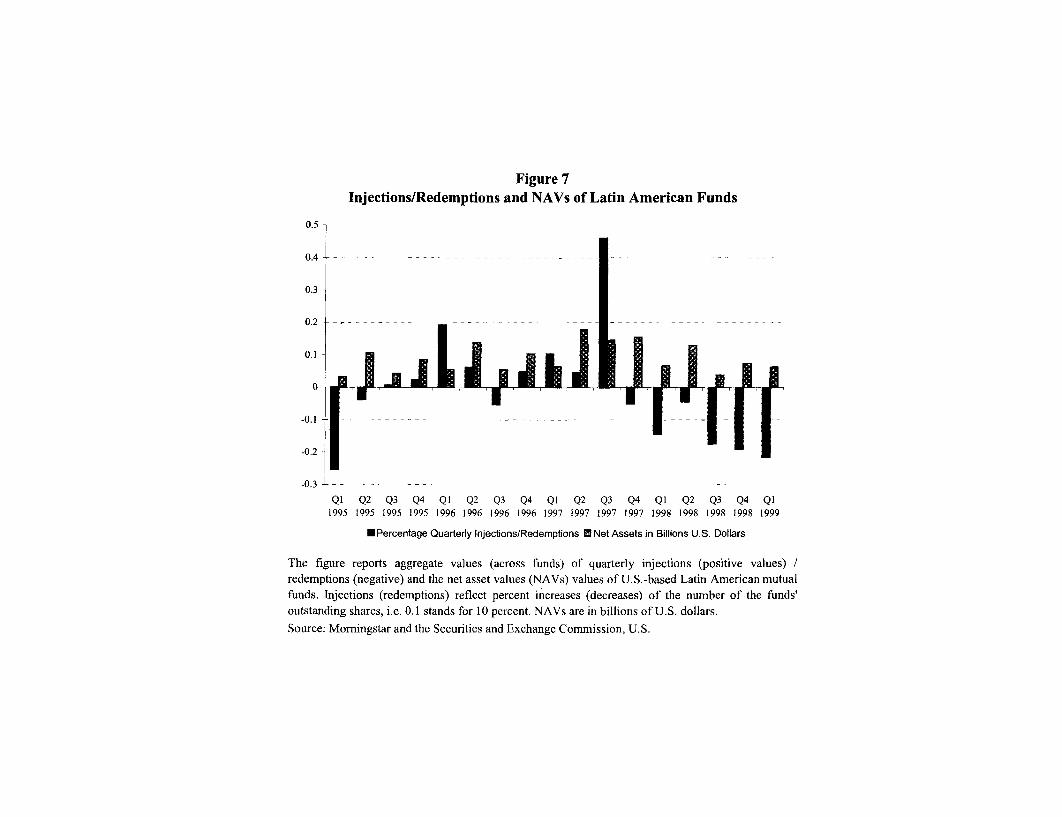
Figure 7Injections/Redemptions and NAVs of Latin American Funds
0.5
0 .4 - --- - --- -- - -- - -- -- - -- - - -- - -- -- -- - -- -- - -- - -- - ---
0.3
0 .2 - - - - -- - --- -- -- - -- - -- - -- -- - -- - - -- - - - -- - -- - -- - -- - -- - -
0.1
-0.1 __-------- --- -- -- - --------- -- ------ - -
-0.2
-0.3 ------- ----------------- ---- -----
Q1 Q2 Q3 Q4 Q1 Q2 Q3 Q4 QI Q2 Q3 Q4 Q1 Q2 Q3 Q4 Ql1995 1995 1995 1995 1996 1996 1996 1996 1997 1997 1997 1997 1998 1998 1998 1998 1999
EPercentage Quarterly Injections/Redemptions ENet Assets in Billions U.S. Dollars
The figure reports aggregate values (across funds) of quarterly injections (positive values) /redemptions (negative) and the net asset values (NAVs) values of U.S.-based Latin American mutualfunds. Injections (redemptions) reflect percent increases (decreases) of the number of the funds'outstanding shares, i.e. 0.1 stands for 10 percent. NAVs are in billions of U.S. dollars.
Source: Morningstar and the Securities and Exchange Commission, U.S.
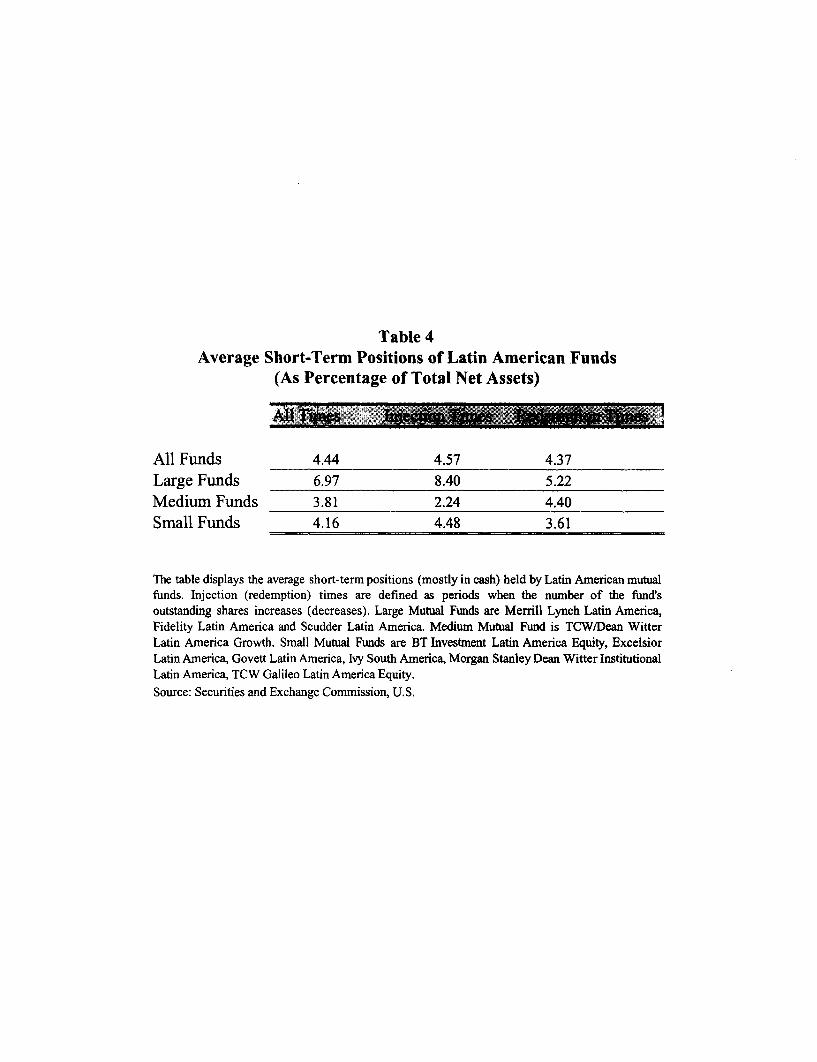
Table 4Average Short-Term Positions of Latin American Funds
(As Percentage of Total Net Assets)
All T4'nes I crpTps $ pp$g ie
All Funds 4.44 4.57 4.37Large Funds 6.97 8.40 5.22Medium Funds 3.81 2.24 4.40Small Funds 4.16 4.48 3.61
The table displays the average short-term positions (mostly in cash) held by Latin American mutualfunds. Injection (redemption) times are defined as periods when the number of the fund'soutstanding shares increases (decreases). Large Mutual Funds are Merrill Lynch Latin America,Fidelity Latin America and Scudder Latin America. Medium Mutual Fund is TCW/Dean WitterLatin America Growth. Small Mutual Funds are BT Investment Latin America Equity, ExcelsiorLatin America, Govett Latin America, Ivy South America, Morgan Stanley Dean Witter InstitutionalLatin America, TCW Galileo Latin America Equity.
Source: Securities and Exchange Commission, U.S.
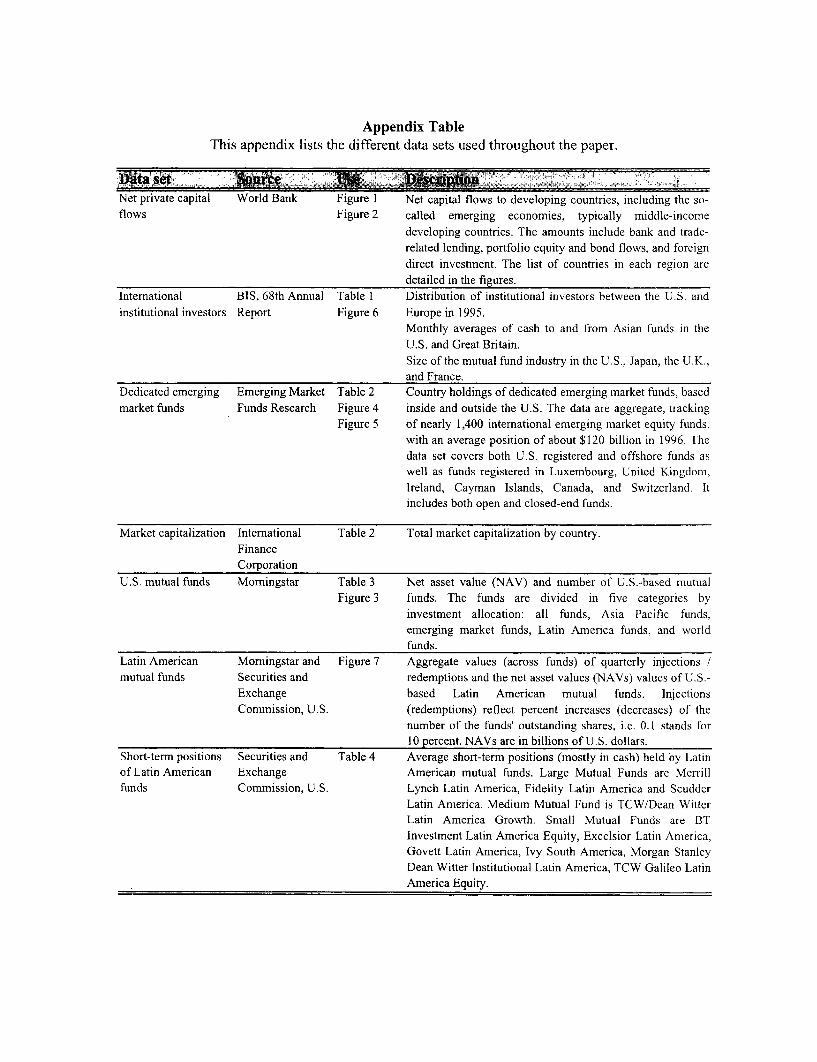
Appendix TableThis appendix lists the different data sets used throughout the paper.
Net private capital World Bank Figure I Net capital flows to developing countries, including the so-flows Figure 2 called emerging economies, typically middle-income
developing countries. The amounts include bank and trade-related lending, portfolio equity and bond flows, and foreigndirect investment. The list of countries in each region aredetailed in the figures.
International BIS, 68th Annual Table 1 Distribution of institutional investors between the U.S. and
institutional investors Report Figure 6 Europe in 1995.Monthly averages of cash to and from Asian funds in theU.S. and Great Britain.Size of the mutual fund industry in the U.S., Japan, the U.K.,and France.
Dedicated emerging Emerging Market Table 2 Country holdings of dedicated emerging market funds, basedmarket funds Funds Research Figure 4 inside and outside the U.S. The data are aggregate, tracking
Figure 5 of nearly 1,400 international emerging market equity funds,with an average position of about $120 billion in 1996. Thedata set covers both U.S. registered and offshore funds aswell as funds registered in Luxembourg, United Kingdom,Ireland, Cayman Islands, Canada, and Switzerland. Itincludes both open and closed-end funds.
Market capitalization International Table 2 Total market capitalization by country.FinanceCorporation
U.S. mutual funds Morningstar Table 3 Net asset value (NAV) and number of U.S.-based mutualFigure 3 funds. The funds are divided in five categories by
investment allocation: all funds, Asia Pacific funds,emerging market funds, Latin America funds, and worldfunds.
Latin American Morningstar and Figure 7 Aggregate values (across funds) of quarterly injections /mutual funds Securities and redemptions and the net asset values (NAVs) values of U.S.-
Exchange based Latin American mutual funds. InjectionsCommission, U.S. (redemptions) reflect percent increases (decreases) of the
number of the funds' outstanding shares, i.e. 0.1 stands for10 percent. NAVs are in billions of U.S. dollars.
Short-term positions Securities and Table 4 Average short-term positions (mostly in cash) held by Latinof Latin American Exchange American mutual funds. Large Mutual Funds are Merrillfunds Commission, U.S. Lynch Latin America, Fidelity Latin America and Scudder
Latin America. Medium Mutual Fund is TCW/Dean WitterLatin America Growth. Small Mutual Funds are BTInvestment Latin America Equity, Excelsior Latin America,Govett Latin America, Ivy South America, Morgan StanleyDean Witter Institutional Latin America, TCW Galileo LatinAmerica Equity.

Policy Research Working Paper Series
ContactTitle Author Date for paper
WPS2505 Family Altruism and Incentives Roberta Gatti December 2000 R. Bonfield31248
WPS2506 Ethnicity and Wage Determination Abigail Barr December 2000 R. Bonfieldin Ghana Abena Oduro 31248
WPS2507 Public Expenditures and Gunnar S. Eskeland December 2000 H. SladovichEnvironmental Protection: When Is 37698the Cost of Funds Irrelevant?
WPS2508 Sources of Financial Assistance for Mattias Lundberg December 2000 V. SoukhanovHouseholds Suffering an Adult Mead Over 35271Death in Kagera, Tanzania Phare Mujinja
WPS2509 How Tax Policy and Incentives Jacques Morisset December 2000 N. BusjeetAffect Foreign Direct Investment: Neda Pirnia 33997A Review
WPS2510 Environmental Protection and Gunnar S. Eskeland December 2000 H. SladovichOptimal Taxation 37698
WPS2511 Monetary Policy under Flexible Pierre-Richard Agenor December 2000 M. GosiengfiaoExchange Rates: An Introduction to 33363Inflation Targeting
WPS2512 Quantifying the Impact of Technical Keith E. Maskus December 2000 L. TabadaBarriers to Trade: A Framework for John S. Wilson 36896Analysis Tsunehiro Otsuki
WPS2513 Do State Holding Companies Facilitate Michel Kerf December 2000 M. LeonPrivate Participation in the Water Sector? 36151Evidence from C6te d'lvoire, the Gambia,Guinea, and Senegal
WPS2514 Intersectoral Dynamics and Economic Norbert M. Fiess January 2001 A. PillayGrowth in Ecuador Dorte Verner 88046
WPS2515 Firm-Level Survey Provides Data on Mary Hallward-Driemeier January 2001 E. KhineAsia's Corporate Crisis and Recovery 37471
WPS2516 Does Decentralization Increase Jean-Paul Faguet January 2001 H. SladovichResponsiveness to Local Needs? 37698Evidence from Bolivia
WPS2517 The Effect of International Monetary William Easterly January 2001 K. LabrieFund and World Bank Programs 31001on Poverty
Policy Research Working Paper Series
ContactTitle Author Date for paper
WPS2518 Can Reforming Global Institutions Andr6s Solimano January 2001 R. BonfieldHelp Developing Countries Share 31248More in the Benefits fromGlobalization?
WPS2519 Is Investment in Africa Too Low or Shantayanan Devarajan January 2001 H. SladovichToo High? Macro and Micro Evidence William R. Easterly 37698
Howard Pack
WPS2520 Wage Effects of Unions and Industrial Kristin F. Butcher January 2001 P. SaderCouncils in South Africa Cecilia Elena Rouse 33902
WPS2521 Labor Market Rigidity and the Alvaro Forteza January 2001 P. SaderSuccess of Economic Reforms Martin Rama 33902across More than 100 Countries
WPS2522 Trade in International Maritime Carsten Fink January 2001 L. TabadaServices: How Much Does Policy Aaditya Mattoo 36896Matter? Ileana Cristina Neagu
WPS2523 Can Duty Drawbacks Have a Olivier Cadot January 2001 L. TabadaProtectionist Bias? Evidence from Jaime de Melo 36896Mercosur
WPS2524 Racing to the Bottom? Foreign David Wheeler January 2001 D. WheelerInvestment and Air Pollution in 33401Developing Countries
WPS2525 Measuring Education Inequality: Vinod Thomas January 2001 A. DatoloumGini Coefficients of Education Yan Wang 36334
Xibo Fan
WPS2526 Linking Participatory Poverty Carrie Turk January 2001 H. SutrisnaAssessments to Policy and 88032Policymaking: Experience fromVietnam
WPS2527 Is Inequality Bad for Business? Alice Mesnard January 2001 P. SaderA Nonlinear Microeconomic Model Martin Ravallion 33902Of Wealth Effects on Self-Employment
WPS2528 Poverty and Public Celebrations in Vijayendra Rao January 2001 P. SaderRural India 33902