mutual funds basics types costs performance recent developments
TRANSCRIPT

Mutual Funds
Basics
Types
Costs
Performance
Recent Developments

Investments 6 2
Basics What is a Mutual Fund?
Financial intermediaries that invest on behalf of individual investors
Why Mutual Fund? Diversification and divisibility
Fractional shares yet many different securities Professional management
Portfolio managers and security analysts Lower transaction costs
Large block trade, reduced commissions and fees Record keeping and administration
Status report about distribution, dividends, etc.
Investments 6 3
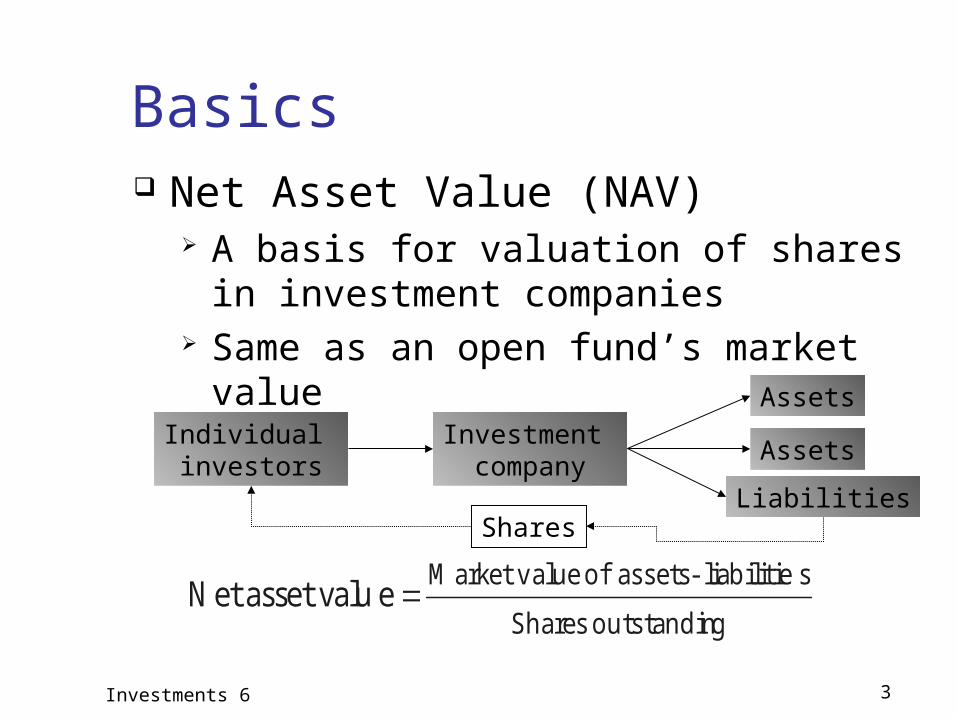
Basics Net Asset Value (NAV)
A basis for valuation of shares in investment companies
Same as an open fund’s market value
Individual investors
Investment company
Assets
Assets
LiabilitiesShares
gouts tandin Shares
sliab ilitie - as s ets o f ueM arket val easset valuN et
Investments 6 4
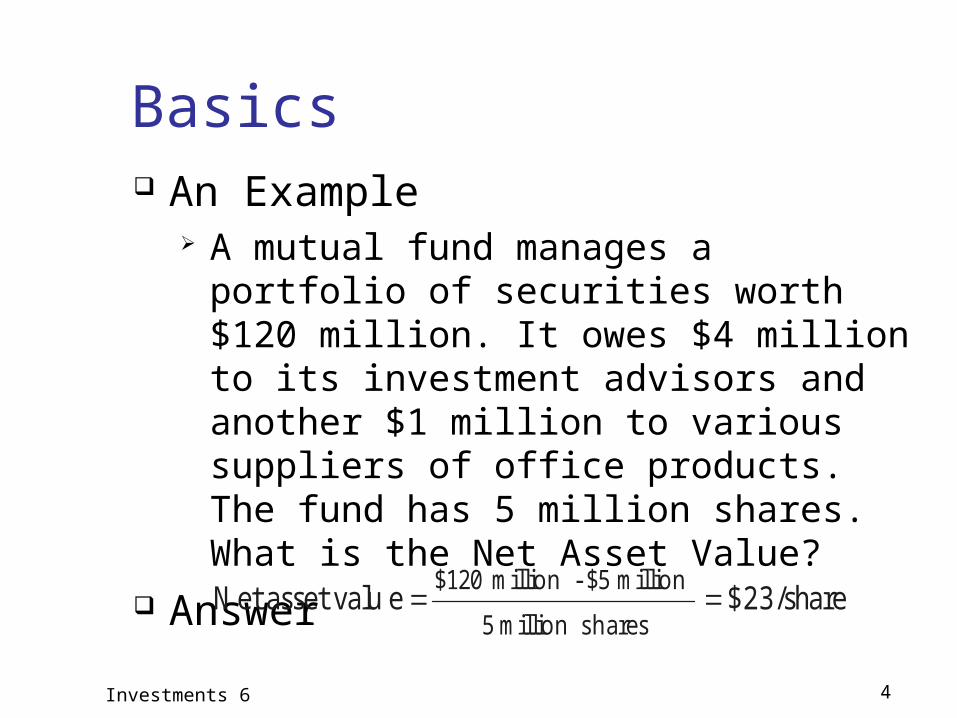
Basics An Example
A mutual fund manages a portfolio of securities worth $120 million. It owes $4 million to its investment advisors and another $1 million to various suppliers of office products. The fund has 5 million shares. What is the Net Asset Value?
Answer
$23/share easset valuN et s h aresmillio n 5
millio n $5 -millio n $120

Investments 6 5
Types: Open-End Funds Managed investment company
Investors can invest/divest in the fund by cashing in/out at NAV (at the day’s closing prices)
Market price = NAV: sold at par Dominant type of investment: over 90% Assets under management: nearly $12 trillion by
2011
Individual investors
Redeemable shares
Fund’s boardof directors
Managementcompany
Assets
Assets
Liabilities

Investments 6 6
Types: Investment Policies Money market funds
Specializing in money market securities Equity Funds
Fixed Income Funds Treasury, corporate, high yield bonds
Current income
Capital appreciation Maximum Capital Gains
Growth
Growth and Income
Income
Income and Security
Risk
Investments 6 7
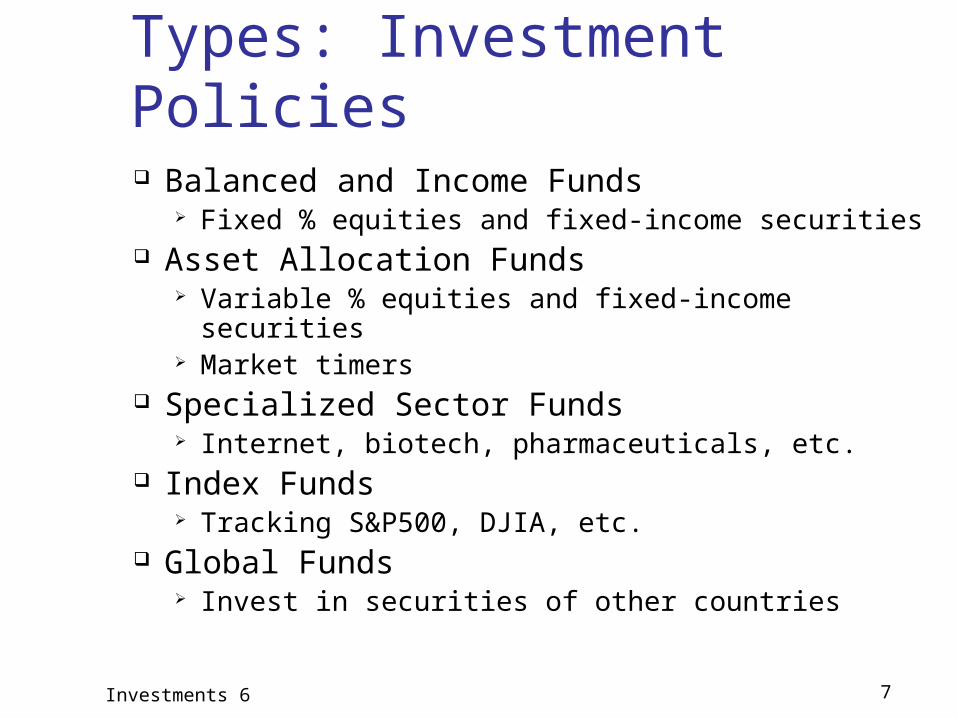
Types: Investment Policies Balanced and Income Funds
Fixed % equities and fixed-income securities Asset Allocation Funds
Variable % equities and fixed-income securities Market timers
Specialized Sector Funds Internet, biotech, pharmaceuticals, etc.
Index Funds Tracking S&P500, DJIA, etc.
Global Funds Invest in securities of other countries
Investments 6 8
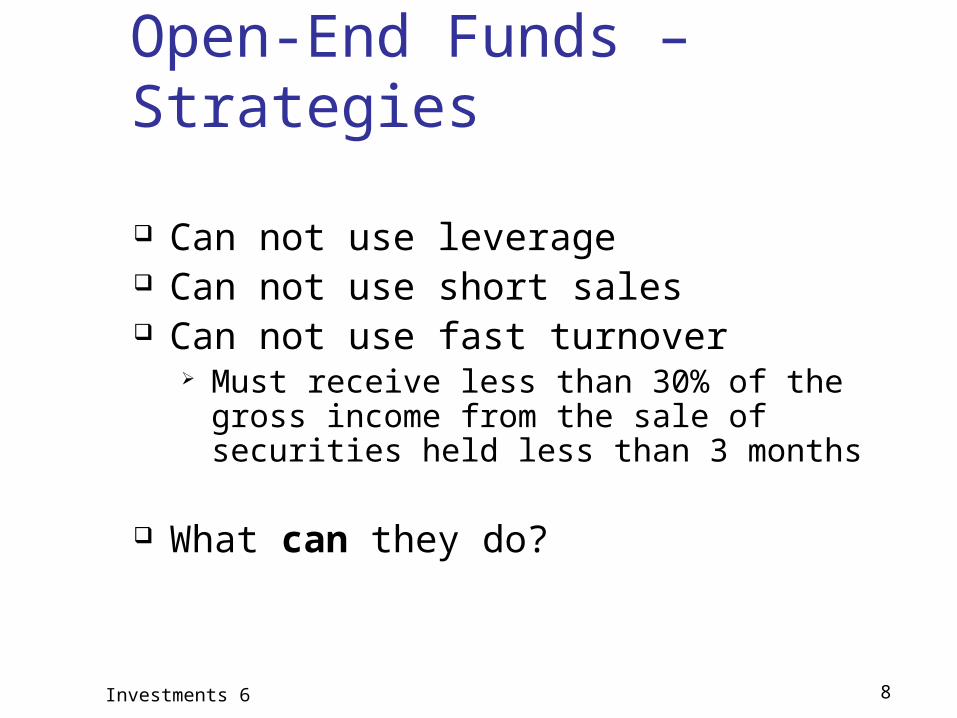
Open-End Funds – Strategies
Can not use leverage Can not use short sales Can not use fast turnover
Must receive less than 30% of the gross income from the sale of securities held less than 3 months
What can they do?
Investments 6 9
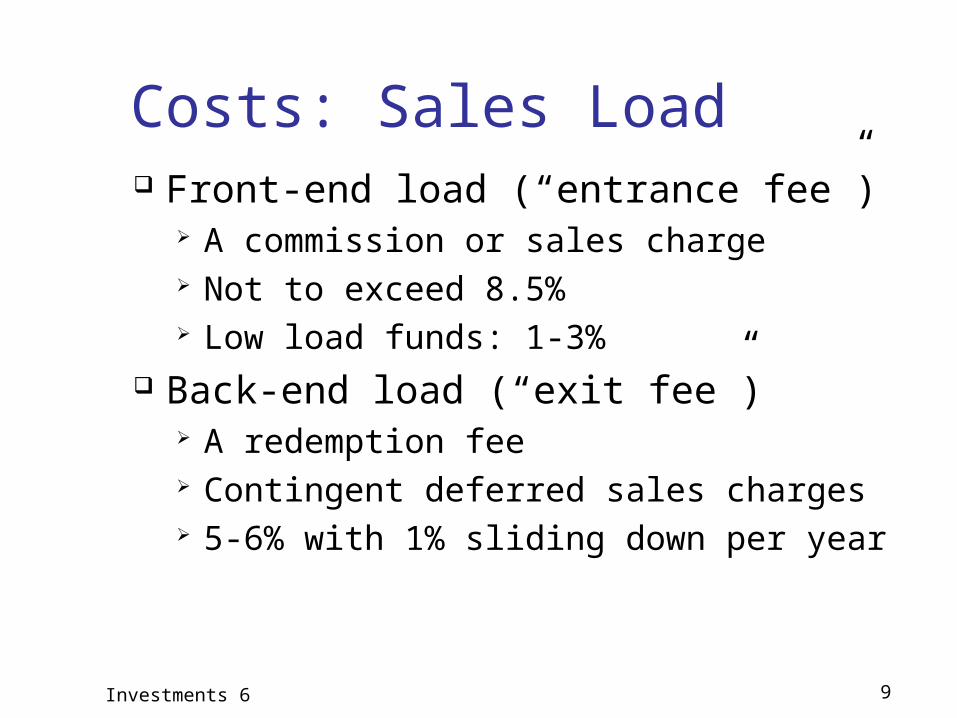
Costs: Sales Load Front-end load (“entrance fee”)
A commission or sales charge Not to exceed 8.5% Low load funds: 1-3%
Back-end load (“exit fee”) A redemption fee Contingent deferred sales charges 5-6% with 1% sliding down per year

Investments 6 10
Costs: Operating Expenses Administrative expenses Investment advisory fees
Range from 0.2% to 2% of asset value 12b-1 charges
Commissions to brokers, distribution costs Up to 1%
Payment of expenses No explicit bill for operating expenses Automatic deduction from fund assets

Investments 6 11
Costs: Example $10,000 each invested in fund A, B, C. Each
fund has 12% before-tax return out of which 5% is dividend yield. How much money you have in each fund after a year?
Results A: $10,000×[1+(.12–.005)] = $11,150 B: $10,000×[1+(.12–.01–.005)]= $11,050 C:(10,000–800)×[1+(.12–.005–.08×.05)]=$10,221
Dividend reinvestment subject to front-end load
Fees Fund A Fund B Fund C*Front loads 0.00% 0.00% 8.00%Expense Ratio 0.50% 1.00% 0.50%12b-1 charges 0.00% 0.50% 0.00%

Investments 6 12
Taxation “Pass-through” Status
Investors responsible for paying taxes Investors lose tax-timing options
Turnover rate Ratio of total trading volume to asset value Higher turnover ratio, higher tax liability E.g. e-Tech fund has asset value of $100 million,
over the last year. It sold $60 million of old stocks and bought the same amount of new stocks. What is the turnover ratio?
Turnover ratio = 60/100 = 60%
Investments 6 13
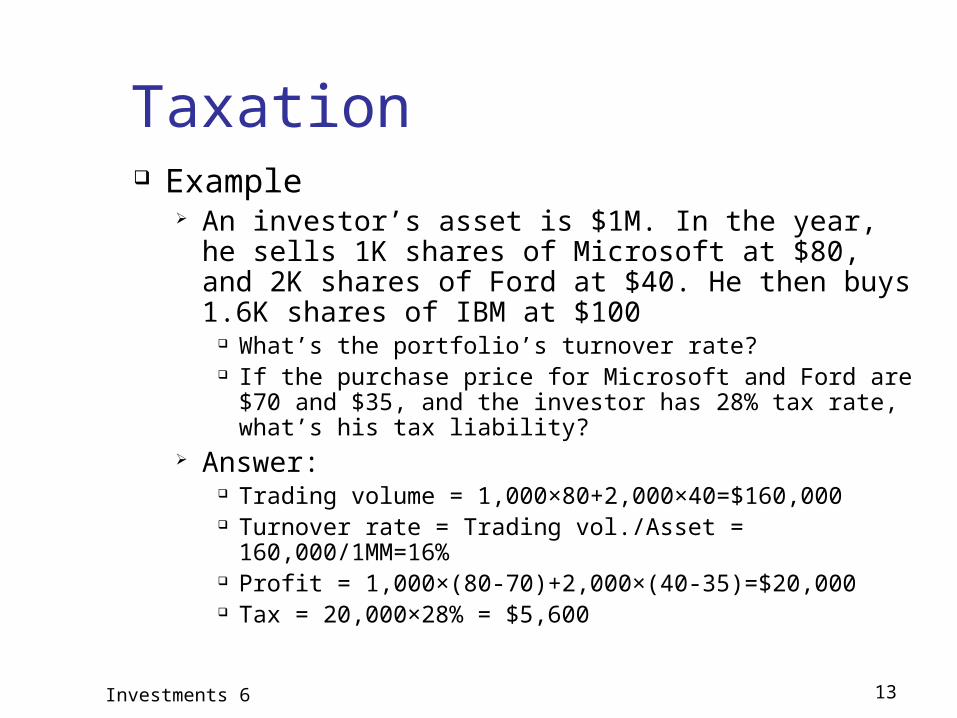
Taxation Example
An investor’s asset is $1M. In the year, he sells 1K shares of Microsoft at $80, and 2K shares of Ford at $40. He then buys 1.6K shares of IBM at $100
What’s the portfolio’s turnover rate? If the purchase price for Microsoft and Ford are $70 and
$35, and the investor has 28% tax rate, what’s his tax liability?
Answer: Trading volume = 1,000×80+2,000×40=$160,000 Turnover rate = Trading vol./Asset = 160,000/1MM=16% Profit = 1,000×(80-70)+2,000×(40-35)=$20,000 Tax = 20,000×28% = $5,600

Investments 6 14
Closed-End Funds (CEFs) Managed investment company
Investors invest/divest in the fund by buying/selling the company shares
Individual investors
Non-redeemable shares
Fund’s boardof directors
Managementcompany
Assets
Assets
Liabilities
Exchange listed
Investments 6 15
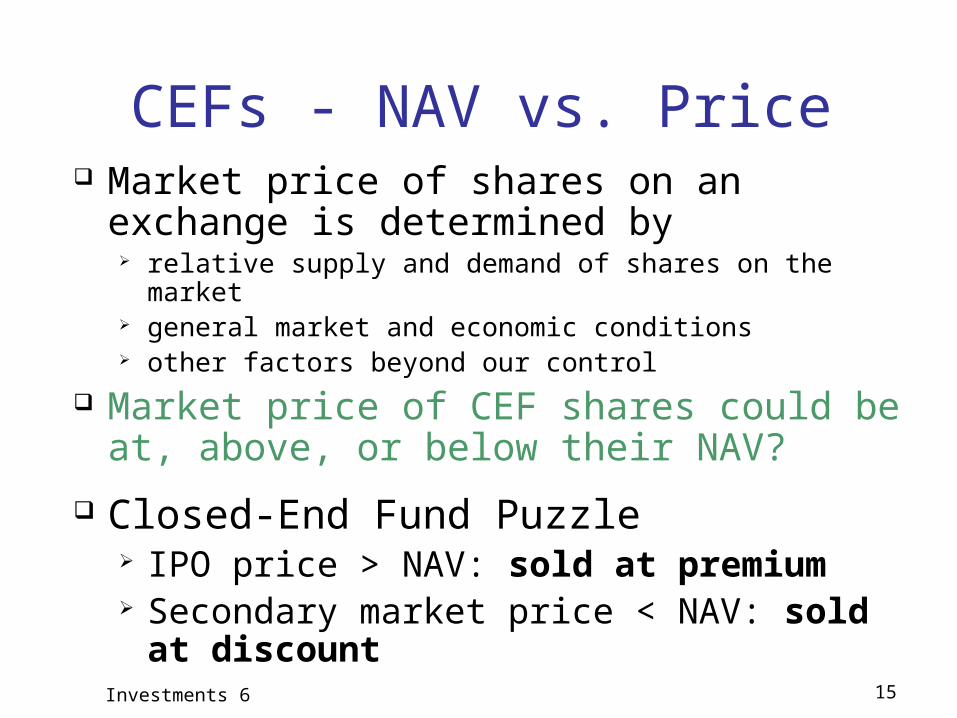
CEFs - NAV vs. Price Market price of shares on an exchange is
determined by relative supply and demand of shares on the market general market and economic conditions other factors beyond our control
Market price of CEF shares could be at, above, or below their NAV?
Closed-End Fund Puzzle IPO price > NAV: sold at premium Secondary market price < NAV: sold at
discount

Investments 6 16
CEFs – SnapshotFund NAV Mkt Price Prem/Disc % 52 Wk Return %
Adams Express Company (ADX) 12.89 11.11 −13.81 26.13
Advent/Clay Enhcd G&I (LCM) 12.16 11.58 −4.77 23.52
BlackRock Equity Div (BDV) 10.65 10.03 −5.82 27.39
BlackRock Str Eq Div Achv (BDT) 11.8 10.68 −9.49 26.17
Cohen & Steers CE Oppty (FOF) 14.64 13.46 −8.06 25.17
Cohen & Steers Dvd Mjrs (DVM) 14.70 13.82 −5.99 49.28
Eaton Vance Tax Div Inc (EVT) 18.75 17.19 −8.32 29.89
Gabelli Div & Inc Tr (GDV) 18.64 16.58 −11.05 43.52
Gabelli Equity Trust (GAB) 6.08 6.10 0.33 48.48
General Amer Investors (GAM) 32.71 28.26 −13.60 30.93
Guggenheim Enh Eq Inc (GPM) 9.58 9.65 0.73 38.93

Investments 6 17
CEFs – Issuers and Resources CEFs are issued or sponsored by many financial
companies, e.g. BlackRock Eaton Vance ING Nuveen PIMCO Vanguard
http://www.cefconnect.com/ – comprehensive CEF resource site sponsored by Nuveen Investments
Investments 6 18
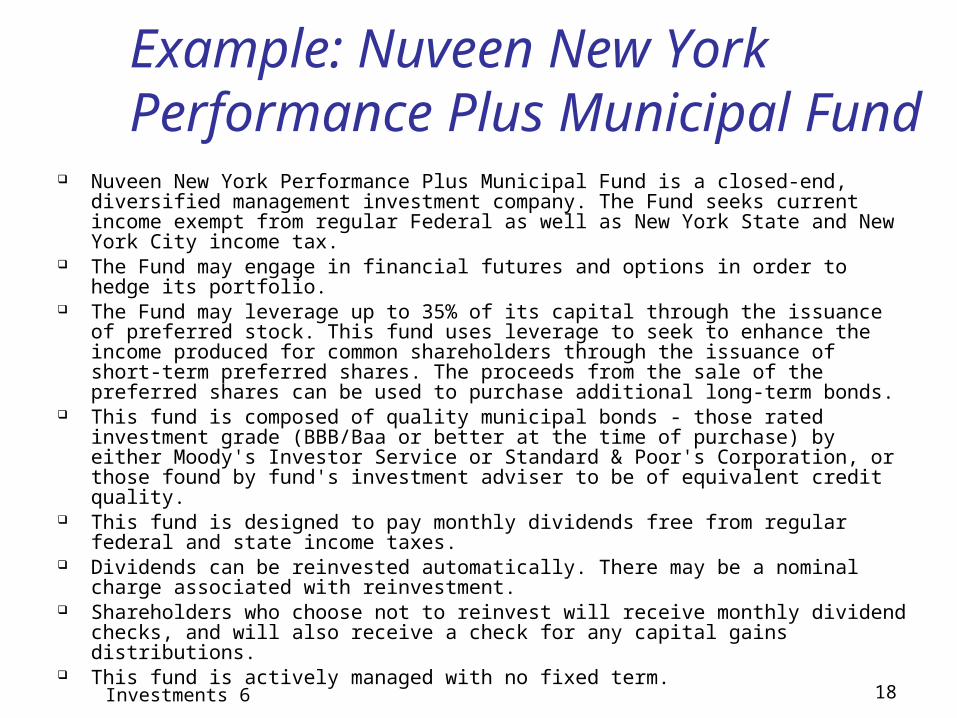
Example: Nuveen New York Performance Plus Municipal Fund
Nuveen New York Performance Plus Municipal Fund is a closed-end, diversified management investment company. The Fund seeks current income exempt from regular Federal as well as New York State and New York City income tax.
The Fund may engage in financial futures and options in order to hedge its portfolio. The Fund may leverage up to 35% of its capital through the issuance of preferred
stock. This fund uses leverage to seek to enhance the income produced for common shareholders through the issuance of short-term preferred shares. The proceeds from the sale of the preferred shares can be used to purchase additional long-term bonds.
This fund is composed of quality municipal bonds - those rated investment grade (BBB/Baa or better at the time of purchase) by either Moody's Investor Service or Standard & Poor's Corporation, or those found by fund's investment adviser to be of equivalent credit quality.
This fund is designed to pay monthly dividends free from regular federal and state income taxes.
Dividends can be reinvested automatically. There may be a nominal charge associated with reinvestment.
Shareholders who choose not to reinvest will receive monthly dividend checks, and will also receive a check for any capital gains distributions.
This fund is actively managed with no fixed term.

Investments 6 19
Example: Nuveen New York Performance Plus Municipal Fund
Portfolio Manager: Scott Romans NYSE Symbol: NNP NASDAQ Symbol: XNNPX Cusip Number: 67062R104 Inception Date: 11/16/1989 Inception NAV: $14.05 Inception Share Price: $15.00 Total Net Assets as of 12/6/2013: $310.293M Share Price as of 12/6/2013: $13.03 NAV as of 12/6/2013: $14.70 Premium/Discount as of 12/6/2013: -11.36%
Investments 6 20
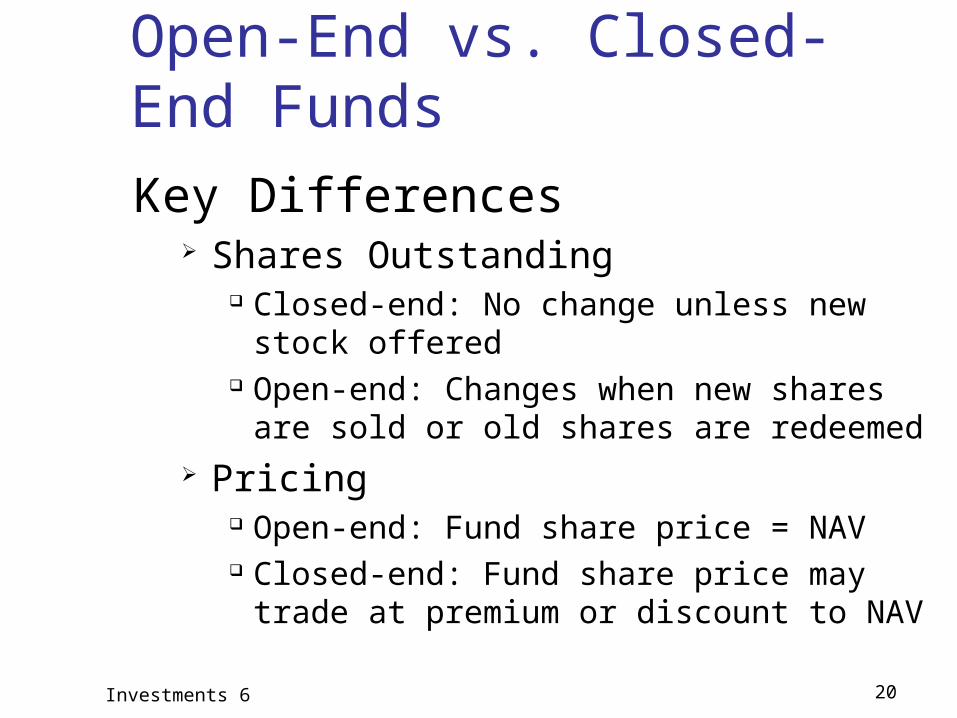
Open-End vs. Closed-End Funds
Key Differences Shares Outstanding
Closed-end: No change unless new stock offered
Open-end: Changes when new shares are sold or old shares are redeemed
Pricing Open-end: Fund share price = NAV Closed-end: Fund share price may trade at
premium or discount to NAV

Investments 6 21
Mutual Fund Resources Prospectus
Investment objectives and policies Fee structure
Morningstar (web or Fund Sourcebook) Yahoo Finance (market data => mutual fund)
Performance Expense ratio Minimal initial investment Turnover rate Manager Top holdings

Investments 6 22
Performance How well mutual funds fare?
Evidence On average, equity fund outperforms money market as
compensation for investment risk. Benchmark: Wilshire 5000, S&P500, etc
You can buy and hold index at very low cost (~18bp) Vanguard S&P 500 or Total stock market fund
Risk adjustment: beta risk, factor risk, etc Higher return does not mean a fund is better, risk has to
be factored in to evaluate a fund performance.
Investments 6 23
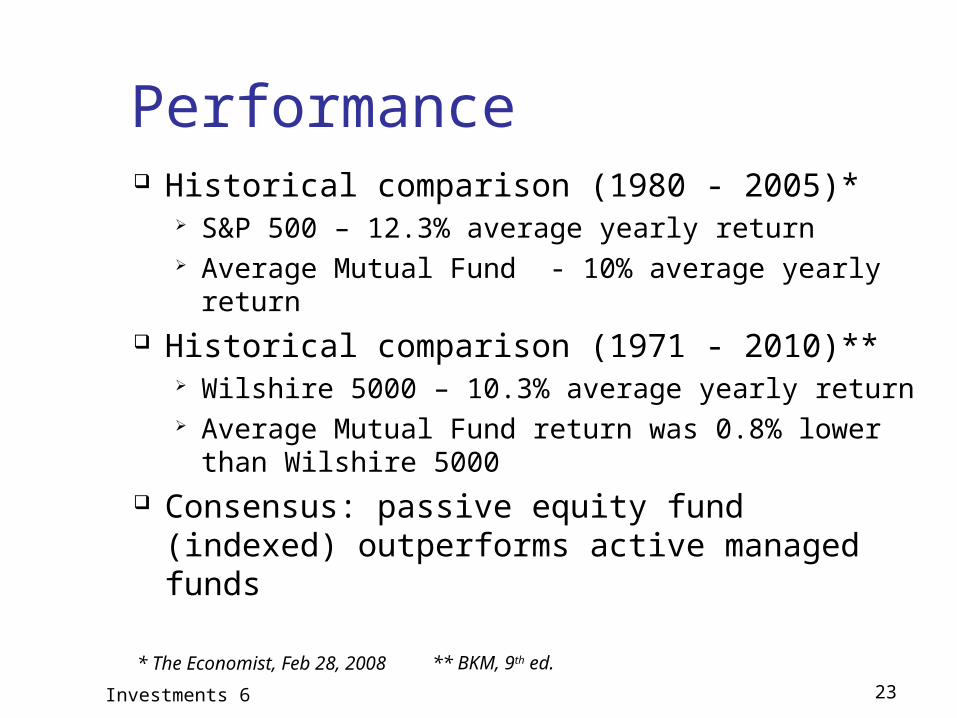
Performance Historical comparison (1980 - 2005)*
S&P 500 – 12.3% average yearly return Average Mutual Fund - 10% average yearly return
Historical comparison (1971 - 2010)** Wilshire 5000 – 10.3% average yearly return Average Mutual Fund return was 0.8% lower than
Wilshire 5000 Consensus: passive equity fund (indexed)
outperforms active managed funds
* The Economist, Feb 28, 2008 ** BKM, 9th ed.

Investments 6 24
Performance
Investments 6 25
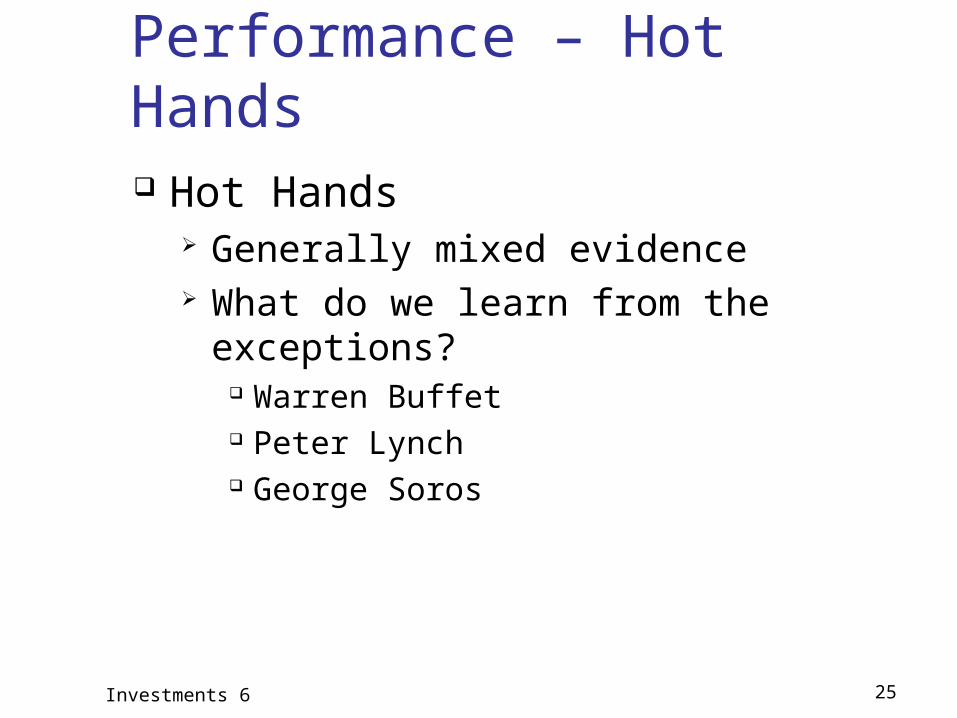
Performance – Hot Hands Hot Hands
Generally mixed evidence What do we learn from the exceptions?
Warren Buffet Peter Lynch George Soros

Investments 6 26
Performance – Past and Future

Investments 6 27
Performance – Past and Future
Investments 13 28
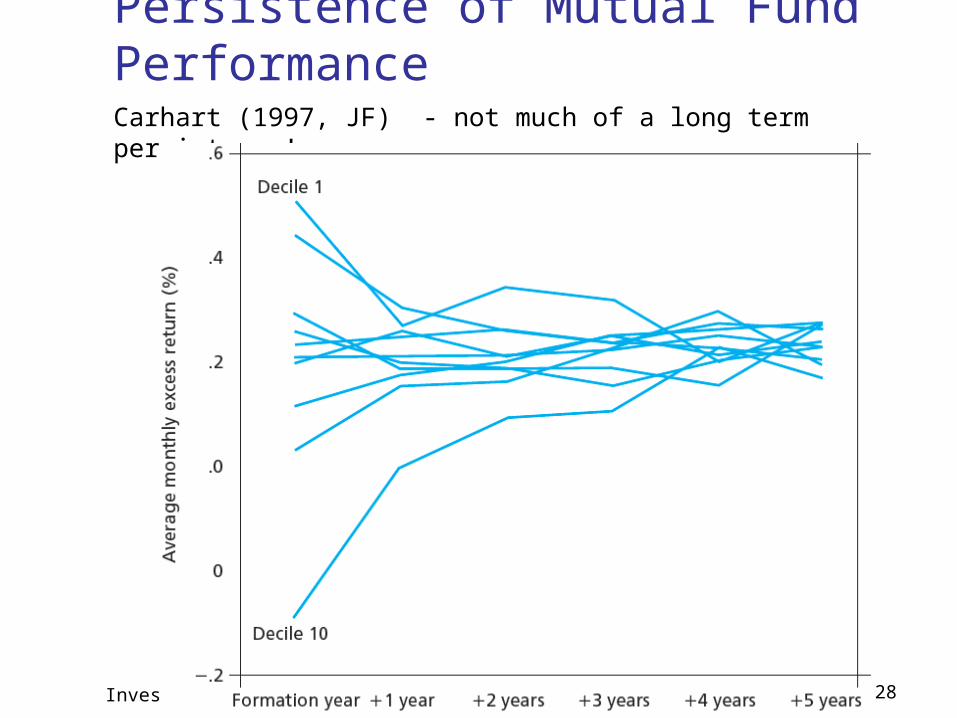
Persistence of Mutual Fund PerformanceCarhart (1997, JF) - not much of a long term persistence!
Investments 6 29
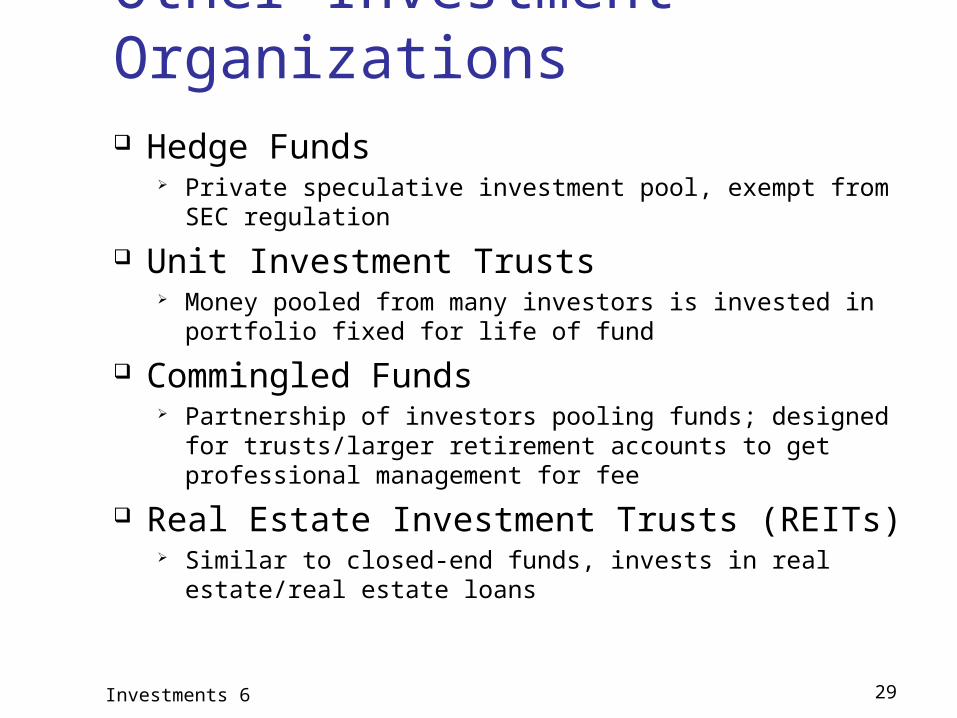
Other Investment Organizations Hedge Funds
Private speculative investment pool, exempt from SEC regulation
Unit Investment Trusts Money pooled from many investors is invested in portfolio
fixed for life of fund
Commingled Funds Partnership of investors pooling funds; designed for
trusts/larger retirement accounts to get professional management for fee
Real Estate Investment Trusts (REITs) Similar to closed-end funds, invests in real estate/real estate
loans

Investments 6 30
Hedge Funds Strategies
No restrictions Objectives
Arbitrage To achieve absolute
returns Usually market-
neutral (market-hedged) positions
Check this out: www.hedgeindex.com
Investments 6 31
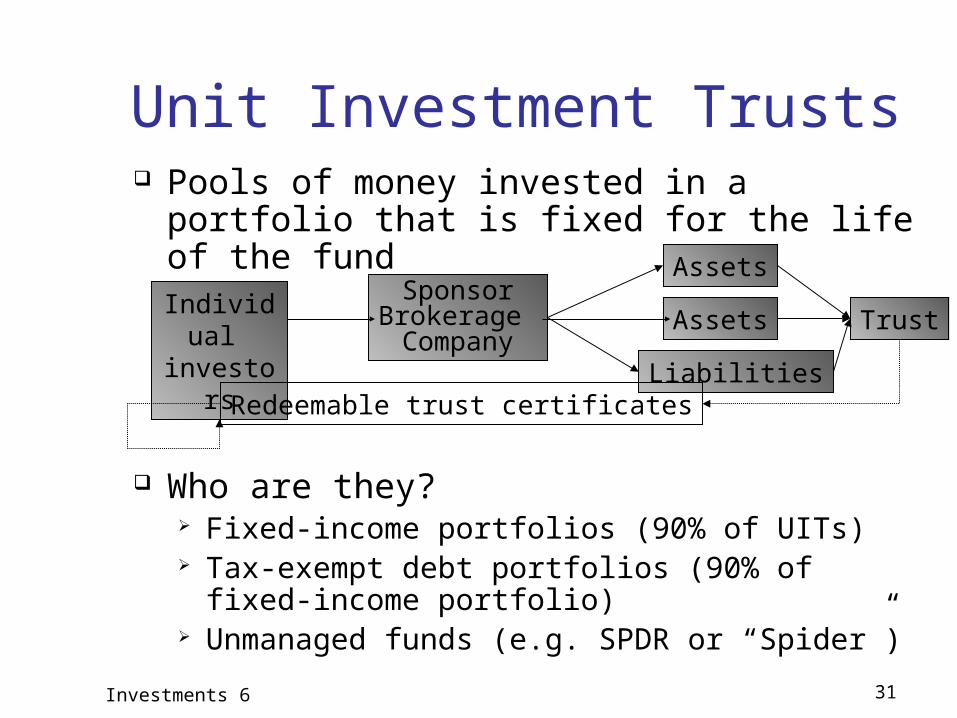
Unit Investment Trusts Pools of money invested in a portfolio that is
fixed for the life of the fund
Who are they? Fixed-income portfolios (90% of UITs) Tax-exempt debt portfolios (90% of fixed-income
portfolio) Unmanaged funds (e.g. SPDR or “Spider”)
Individual investors
SponsorBrokerage Company
Assets
Assets
LiabilitiesRedeemable trust certificates
Trust

Investments 6 32
Unit Investment Trusts What’s in for the sponsors
Sell trust shares at a premium over NAV An Example
A trust purchases $5 million of assets. It then sells 5,000 shares to the public at a price of $1,030 per share. What is the premium?
Answer3% Premium
$1,000
$1,000 -$1,030
Investments 6 33
Recent Developments - ETFs Exchange-Traded Funds (ETFs)
Funds that allow investors to trade index portfolios
Examples: “Spiders,” “Diamonds,” and “Cubes” Spiders - the first index ETF started in 1993 iShares by BlackRock Market Vectors by Van Eck Global
Investments 6 34
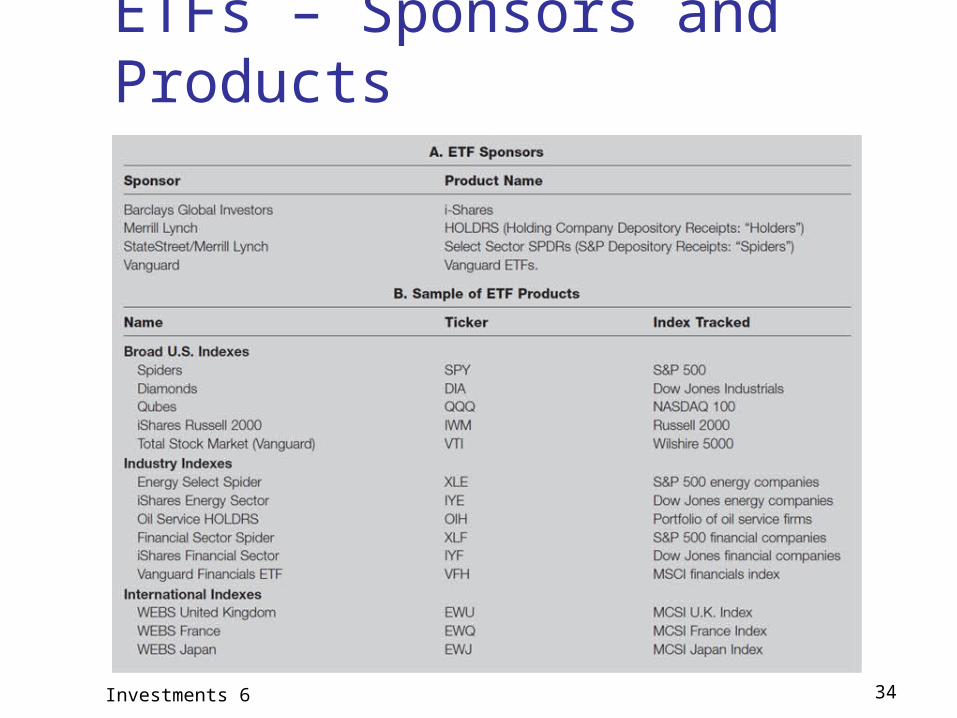
ETFs – Sponsors and Products

Investments 6 35
ETFs – Pros and Cons Potential Advantages
Trade continuously throughout day like stocks
Can be sold short or purchased on margin Lower costs (no marketing, lower fund
expenses) Potentially lower tax rates
Potential Disadvantages Small deviations from NAV possible Brokerage commission to buy ETF

Investments 6 36
Growth of U.S. ETFs over Time
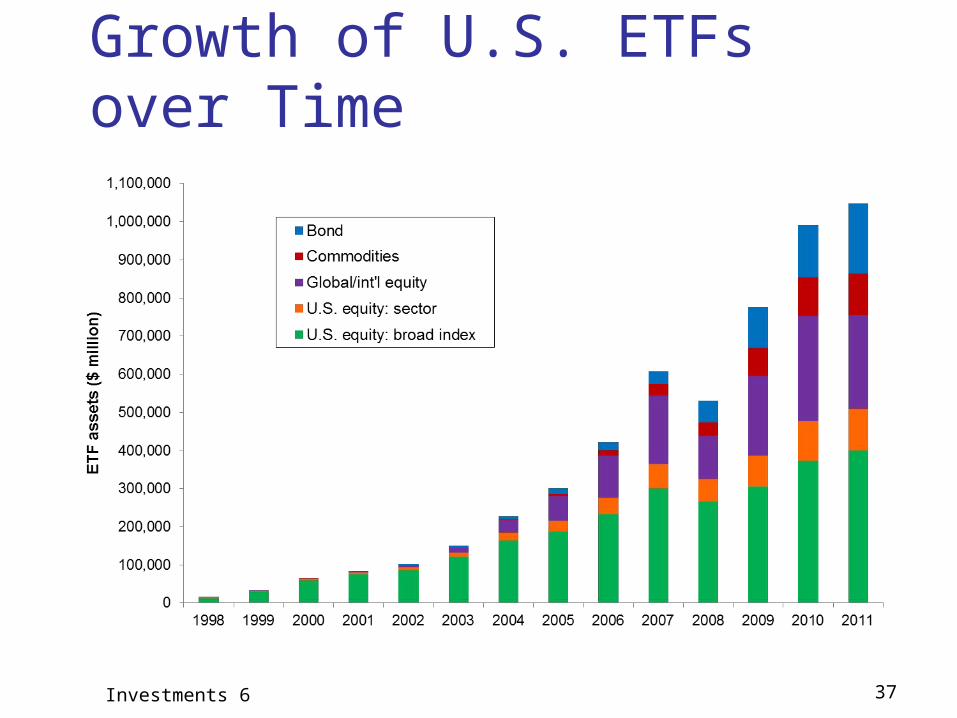
Investments 6 37
Growth of U.S. ETFs over Time

Investments 6 38
Where are We Now? Investment Company Assets Under
Management, 2011 ($ Billion)