mutual information based stock networks and portfolio
TRANSCRIPT

RESEARCH ARTICLE
Mutual information based stock networks and
portfolio selection for intraday traders using
high frequency data: An Indian market case
study
Charu SharmaID*, Amber Habib
Department of Mathematics, Shiv Nadar University, Gautam Buddha Nagar, Uttar Pradesh, India
Abstract
In this paper, we explore the problem of establishing a network among the stocks of a
market at high frequency level and give an application to program trading. Our work uses
high frequency data from the National Stock Exchange, India, for the year 2014. To
begin, we analyse the spectrum of the correlation matrix to establish the presence of lin-
ear relations amongst the stock returns. A comparison of correlations with pairwise
mutual information shows the further existence of non-linear relations which are not cap-
tured by correlation. We also see that the non-linear relations are more pronounced at the
high frequency level in comparison to the daily returns used in earlier work. We provide
two applications of this approach. First, we construct minimal spanning trees for the stock
network based on mutual information and study their topology. The year 2014 saw the
conduct of general elections in India and the data allows us to explore their impact on
aspects of the network, such as the scale-free property and sectorial clusters. Second,
having established the presence of non-linear relations, we would like to be able to exploit
them. Previous authors have suggested that peripheral stocks in the network would make
good proxies for the Markowitz portfolio but with a much smaller number of stocks. We
show that peripheral stocks selected using mutual information perform significantly better
than ones selected using correlation.
1) Introduction
High frequency trading is the buying and selling of large numbers of stocks in very short inter-
vals of time, usually fractions of seconds. With advancement in computing and technology, it
is possible for investors to carry out such trades using algorithmic trading. A good trading
strategy should be equipped to understand the movement of stocks even at a tick-by-tick level.
Among various factors, which influence the change in a stock price, change in the prices of
other stocks is one of the most significant. Over the years, many researchers [1–11] have used
random matrix theory (RMT) on the empirical correlation matrix to understand the co-
PLOS ONE | https://doi.org/10.1371/journal.pone.0221910 August 29, 2019 1 / 19
a1111111111
a1111111111
a1111111111
a1111111111
a1111111111
OPEN ACCESS
Citation: Sharma C, Habib A (2019) Mutual
information based stock networks and portfolio
selection for intraday traders using high frequency
data: An Indian market case study. PLoS ONE 14
(8): e0221910. https://doi.org/10.1371/journal.
pone.0221910
Editor: Stefan Cristian Gherghina, The Bucharest
University of Economic Studies, ROMANIA
Received: May 24, 2019
Accepted: August 16, 2019
Published: August 29, 2019
Copyright: © 2019 Sharma, Habib. This is an open
access article distributed under the terms of the
Creative Commons Attribution License, which
permits unrestricted use, distribution, and
reproduction in any medium, provided the original
author and source are credited.
Data Availability Statement: All the processed
data corresponding to each figure is uploaded as a
supporting file named “S4 Table”. The raw data
was purchased from DotEx International Limited.,
now named as NSE Data & Analytics Limited. The
terms of purchase prohibit us from redistributing
the Historical Data or any component of it.
However, the raw data can be purchased from NSE
Data & Analytics at: (https://www.nseindia.com/
supra_global/content/dotex/data_products.htm).

movements of the stocks based on daily rates of return. The cross-correlation matrix of daily
stock returns with respect to a developed market like US was studied in depth using RMT in
2001 [2]. Later, in 2007, Pan & Sinha [4] studied the cross correlation matrix of daily stock
returns both in developed and developing countries, namely US and India. Under all these
studies, spectral properties of empirical correlation matrix of rate of returns were compared to
that of random matrix which would have appeared if stock returns were uncorrelated [2,4]. It
was observed that an emerging market like India shows stronger interactions in price move-
ments as compared to a developed market. Their analysis was also based on the daily rates of
return. In this paper, we first study the spectrum of the correlation matrix but now at high fre-
quency level, using 30-second time intervals, with respect to the Indian market. Most of the
studies based on RMT performed on different exchanges in the past suggest that the bulk of
the eigenvalues are in agreement with the Marchenko-Pastur distributions with few excep-
tions. The large eigenvalues which deviate from the Marchenko-Pastur distributions are stud-
ied to understand the influence of the market as a whole and also sectorial effects [1–11].
However, correlation coefficient is a measure of linear relation between the variables. If there
is a non-linear relationship, the correlation coefficient may fail to capture it. Thus, there is a
great need to develop methods which are able to detect and describe the non-linearity amongst
the stocks, especially at a high frequency level.
Mutual information is one such measure that measures mutual dependence between ran-
dom variables in general. Researchers in the past have used methods based on mutual informa-
tion in building biological networks [12–13]. However, developing stock networks based on
mutual information is at a very early stage [14–23]. In 2018, Guo, Zhang and Tian [18] studied
Chinese stock network using the mutual information networks based on daily returns of
stocks. They showed that mutual information based model captures the daily dynamics of the
stock networks better in comparison to the correlation based model. However, exploration of
this method at a high frequency level was left as an open problem. In 2019, Barbi and Prata-
viera [20] studied networks based on nonlinear dependencies in Brazilian equity market with a
tick size of 15 minutes. In the same year, Khoojine and Han [21] studied Chinese stock market
turbulence in the year 2015–2016 by analysing topological properties of the complex network
obtained based on mutual information. We, in our analysis have considered high frequency
data of Indian stock market, with a tick size of 30 seconds. We compare the traditional correla-
tion coefficient method with the mutual information method and show that the mutual infor-
mation method is a more efficient method at a high frequency level as well. Centrality
measures like eigenvector centrality help us to analyse important stocks and business sectors
in respect to the Indian stock market.
We also demonstrate how networks based on mutual information can be used for picking
portfolios with small number of stocks, preferred by the intraday traders. The Markowitz or
mean-variance model for portfolio selection is the traditional model used for selecting efficient
portfolios. This method uses variance of the portfolio as a quantifier of the risk associated with
the portfolio and tries to minimize it, while at the same time attaining required return from
the portfolio. This method works well under the assumption of a linear relation amongst the
stocks. To overcome this issue, Philippatos and Wilson [23] gave an entropy-based model
which minimizes the entropy of the portfolio and maximizes the rate of return. Since then
many researchers have proposed different models based on entropy to get a diversified portfo-
lio, which is less risky, and at the same time give good returns [24]. These strategies are useful
for long-term investors but might not work for a short-term investor like a day trader who
cannot afford to invest in too many stocks at a time. In 2013, Pozzi, Matteo and Aste [25], sug-
gested that stocks present in the periphery of a minimum spanning tree network based on
exponential weighted correlations are a good choice of investment. In our analysis, we
Mutual information and portfolio selection for intraday traders using high frequency data
PLOS ONE | https://doi.org/10.1371/journal.pone.0221910 August 29, 2019 2 / 19
Funding: This work is jointly supported by National
Board of Higher Mathematics and Institute for
Innovations and Inventions with Mathematics and
IT (IIIMIT), Shiv Nadar University. Charu Sharma
and Amber Habib received a grant from National
Board of Higher Mathematics, grant number: 2/48
(23)/2016/NBHM (RP)/R&D II/4339. Charu
Sharma is the principal investigator and Amber
Habib is a co-investigator, website: http://www.
nbhm.dae.gov.in/. The funders had no role in study
design, data collection and analysis, decision to
publish, or preparation of the manuscript.
Competing interests: The authors have declared
that no competing interests exist.
compare the peripheral portfolios obtained using correlations and mutual information meth-
ods and show that portfolios based on mutual information techniques are more efficient.
Estimating mutual information with good accuracy is itself an important research area in
the field of information theory. In the past, various numerical algorithms have been proposed
to estimate mutual information accurately and efficiently [26–28]. Cellucci, Albano and Rapp
[26] compared some of these algorithms in terms of efficiency and accuracy. Their analysis
showed that the Fraser-Swinney algorithm is the best in terms of accuracy but takes quite a
long time. The adaptive partition method takes about 0.5% of the calculation time required by
Fraser-Swinney while its accuracy is better in comparison to the uniform bin method. We use
the adaptive partition method to estimate mutual information on 30-second data.
The remaining part of the paper is broadly divided into 4 sections. In section 2, we describe
the data used in our analysis. In section 3, we give an overview of the methods and methodol-
ogy used. In section 4, we give a detailed comparative study of the networks based on their
topological features. In this section, we also give an application on how to use the dynamics of
stock networks for portfolio selection especially for an intraday trader. In the last section, we
conclude by highlighting the salient observations and interpretations that follow from our
analysis.
2) Data description
We obtained tick-by-tick data for the year 2014 from the National Stock Exchange, India. The
data was filtered to get all the stocks listed in CNX100 during that year. 11 stocks were dropped
from the analysis due to insufficient or missing data. Table 1 gives the details of the composi-
tion of the CNX100 index. The exchange opens at 9 o’clock in the morning and is functional
till 4 PM. The trades start picking up in the first half-hour, while the last half-hour shows some
ambiguity or incompleteness in the data. Considering this, we have used the data between
9:30AM and 3:30PM in our analysis. Every 30-second interval is considered a tick, and thus in
each day we have 720 tick points for each stock. For the kth stock, we first calculate the volume
weighted average price (VWAP), Skt per 30 seconds,
Skt ¼
Piv
ki S
kiP
ivkið1Þ
Table 1. Sectorial distributions of the 89 stocks considered in our analysis.
Industry Type No. of Stocks analysed
INDUSTRIAL MANUFACTURING 5
CEMENT & CEMENT PRODUCTS 5
SERVICES 2
AUTOMOBILE 10
CONSUMER GOODS 14
PHARMA 10
FINANCIAL SERVICES 14
ENERGY 10
TELECOM 3
METALS 6
CONSTRUCTION 2
IT 6
CHEMICALS 1
FERTILISERS & PESTICIDES 1
https://doi.org/10.1371/journal.pone.0221910.t001
Mutual information and portfolio selection for intraday traders using high frequency data
PLOS ONE | https://doi.org/10.1371/journal.pone.0221910 August 29, 2019 3 / 19

Here, vki is the volume of the kth stock traded at the actual tick i and Ski is the stock price at the
tick i in 30- second widow at time t. The log return at time t is then calculated using Eq 2. The
gaps, where no trades were seen during a 30-second interval, were filled with the last traded
price of the stock.
Rktþ1¼ lnðSk
tþ1Þ � lnðSk
t Þ ð2Þ
In addition, we considered the year 2014 for our analysis since this was a year when general
elections were held in India and a change in government was observed. We wanted to analyse
the effect of this major event on the network. For this purpose, we divided our data into three
parts: (a) pre-election period: Jan-Feb 2014 (b) election period: Mar-May 2014, (c) post-elec-
tion period Jun-Dec 2014. Since promotional rallies took place in the month of March, elec-
tions in the month of April and declaration of results in the month of May, so we marked the
months March, April and May as the election period. Table 2 summarizes the details of the
data. It was observed, that the market became more volatile during the time when election
results were announced (S1(B) Fig) and this trend continued for some time during the post-
election period (S1(C) Fig).
3) Methods and methodology
3.1 RMT approach on correlation coefficient matrix
Correlation coefficient between two random variables measures the strength of the linear rela-
tionship between them. We build the correlation matrix C of size 89×89 separately for all the
three time spans, pre-election, election and post-election. Fig 1 gives the boxplot correspond-
ing to the distribution of the correlation coefficients for the three different time spans. During
the election period, more pairs are seen to have higher correlation coefficient in comparison to
pre-election and post-election periods. This can be understood as a result of the election effect
on the market as a whole. Researchers in the past have studied the effect of general elections on
the stock market [29] and observed that during election time investors develop common
expectations around the anticipated results. Thus, during the election process, market becomes
volatile and at the same time stronger and more number of interactions are observed amongst
the stocks.
The statistical properties of the correlation matrix are well established in the literature [1–
11]. With a large number of variables say k and a large number of sample points say m, and
under the hypothesis that C is a random correlation matrix, the distribution of eigenvalues of
C can be well approximated by the Marchenko-Pastur distribution. For large k and m, i.e.,
Table 2. Summary of three different datasets, pre-election, election, post-election.
Jan-Feb 2014 Mar-May 2014 Jun-Dec 2014
No. of trading days 42 46 141
No. of stocks 89 89 89
No. of samples (30 sec tick size) 30198 33074 101379
average rate of return (�r) −1.80×10⁻⁶ −2.81×10⁻⁷ −1.13×10⁻⁶
sample standard deviation(s) 1.31×10⁻⁴ 1.73×10⁻⁴ 1.57×10⁻⁴
maximum rate of return 1.04×10⁻³ 2.41×10⁻³ 1.65×10⁻³
minimum rate of return −2.86×10⁻³ −2.43×10⁻³ −2.26×10⁻³
range 3.9×10⁻³ 4.83×10⁻³ 3.92×10⁻³
https://doi.org/10.1371/journal.pone.0221910.t002
Mutual information and portfolio selection for intraday traders using high frequency data
PLOS ONE | https://doi.org/10.1371/journal.pone.0221910 August 29, 2019 4 / 19

k!1, m!1 such that Q ¼ mk is fixed, the probability distribution of the eigenvalues of a ran-
dom correlation matrix is given by
frm lð Þ ¼Q2p
ffiffiffiffiffiffiffiffiffiffiffiffiffiffiffiffiffiffiffiffiffiffiffiffiffiffiffiffiffiffiffiffiffiffiffiffiffiffiffiðlmax � lÞðl � lminÞ
p
lð3Þ
where λmax and λmin are the maximum and minimum eigenvalue of C given by
lmax ¼ 1þ
ffiffiffiffi1
Q
r� �2
and lmin ¼ 1 �
ffiffiffiffi1
Q
r� �2
ð4Þ
If the empirical distribution based on sample data deviates from the theoretical distribution,
then one can reject the null hypothesis that entries in C are random. S2 Fig gives the empirical
pdfs and theoretical pdfs of the eigenvalues of C. In addition, Table 3 summarizes the statistics
from the empirical and theoretical distribution. More than 40% of the eigenvalues of the corre-
lation matrix were seen to be deviated from the Marchenko-Pastur distribution in all three
time-spans. Eigenvectors corresponding to large eigenvalues, also known as principal compo-
nents, carry useful information in comparison to eigenvectors corresponding to small eigen-
values. We therefore analysed only the eigenvectors corresponding to large eigenvalues
deviating from the RMT.
Also, in order to show that the deviation from the RMT is not because of the finite number
of variables, 89 in our case, we tested this procedure on the testing data generated by randomly
shuffling the returns for each stock. S3 Fig gives the comparison of the empirical pdfs and the-
oretical pdfs of the eigenvalues of C corresponding to the testing data. It is quite evident that
the testing data matches well with the Marchenko-Pastur distribution, indicating that the devi-
ations from this distribution in the original data are genuinely due to the correlation between
the stock returns.
Fig 1. Box plot representation of distribution of correlation coefficient between all 3916 pairs of stocks. (a) corresponds to pre-election
period, (b) election period and (c) post-election period; the central red line in the box indicates the median, and the bottom and top edges of
the box indicate the 25th and 75th percentiles, respectively. Outliers are represented by +. The 75th percentile corresponding to election
period and post-election is high in comparison to pre-election period. Also more outliers (+) are visible during election period, which
accounts for the distinction of correlation patterns in the three time-periods.
https://doi.org/10.1371/journal.pone.0221910.g001
Mutual information and portfolio selection for intraday traders using high frequency data
PLOS ONE | https://doi.org/10.1371/journal.pone.0221910 August 29, 2019 5 / 19

3.2 Mutual information method
Mutual Information between two random variables captures mutual dependence between
them and is zero if and only if they are independent. In information theory, Shannon Entropy
is a measure of “uncertainty” or “unpredictability” of a random variable or a random vector.
For discrete random variables X and Y, their joint entropy is defined as
HðX;YÞ ¼ �P
i
Pj fX;Yðxi; yjÞlogð fX;Yðxi; yjÞÞ ¼ E½� logð fX;YÞ� ð5Þ
where fX,Y(xi,yj) is the joint probability mass function of X and Y. Also, entropy of a discrete
random variable with probability mass function fX is defined as
HðXÞ ¼ �P
i fXðxiÞlogð fXðxiÞÞ ¼ E½� logð fXÞ� ð6Þ
The mutual information of discrete random variables X and Y is defined as
I X;Yð Þ ¼ H Xð Þ þH Yð Þ � H X;Yð Þ ¼P
i
PjfX;Yðxi; yjÞlog
fX;Yðxi; yjÞfXðxiÞfYðyjÞ
!
ð7Þ
A generalization to the continuous case is
I X;Yð Þ ¼ ∬fX;Yðx; yÞlogfX;Yðx; yÞfXðxÞfYðyÞ
� �
dxdy ð8Þ
Cellucci, Albano and Rapp [26] carried out a comparative study of methods to estimate
mutual information in the case of continuous random variables. We have used the non-uni-
form adaptive partition algorithm in preference to the Fraser-Swinney algorithm [26], as it
offers the best combination of efficiency and accuracy. The key idea of this algorithm is to esti-
mate joint probability density function fX,Y of random variables X and Y with high accuracy
using a non-uniform partition of XY plane. We partition intervals (xmin,xmax) and (ymin,ymax)
using NE elements such that there are approximately equal number of sample points in each
element of a partition; xmin and ymin are the respective empirical minimum of X and Y and
similarly xmax and ymax are the respective maximums. Also NE is calculated such that in case of
independent random variables, the expected number of elements in each partition of XY plane
should at least be 5 which is equivalent to find greatest integer NE such that NE �ND5
� �2, where
ND is total number of sample points [26]. Table 2 gives the number of sample points (ND) in
different time-periods.
Table 3. Estimated parameters corresponding to distribution of spectrum of correlation matrix.
Serial No. Eigenvalue estimation pre-election election post-election
1. λmax (theoretical) 1.11 1.11 1.06
2. lmax (empirical) 7.40 7.68 8.23
3. lmax=lmax6.66 6.94 7.77
4. lmin < l < lmax (%) 58.43% 50.56% 42.13%
5. l > lmax (%) 6.74% 8.99% 7.87%
6. l < lmin (%) 34.83% 40.45% 50.00%
λmax and λmin are calculated using Eq 4 and lmax is maximum of the eigenvalue of the correlation matrix. Row 1 and row 2 in the table give the parameter estimations;
row 3 gives the ratio; row 4 gives proportion of eigenvalues l lying within theoretical limits; rows 5 and 6 give proportion of eigenvalues l greater than and less than
theoretical limits respectively.
https://doi.org/10.1371/journal.pone.0221910.t003
Mutual information and portfolio selection for intraday traders using high frequency data
PLOS ONE | https://doi.org/10.1371/journal.pone.0221910 August 29, 2019 6 / 19

Based on mutual information, the normalized distance [18] between two stocks k and s is
defined as
d Rk;Rs� �
¼ 1 �IðRk;RsÞ
HðRk;RsÞð9Þ
where Rk and Rs random vectors representing the rate of returns of stock k and s respectively.
3.3 Minimum spanning tree
For connected graphs, a spanning tree is a subgraph that connects every node in the graph and
has no cycles. There may exist more than one spanning tree for a given graph. If weights are
assigned to each edge, then a minimum spanning tree (MST) is a spanning tree whose edges
have the least total weight. To build a MST stock network, we quantify the distance between
each pair of stocks and use this distance as the edge weight between each pair of stocks. In our
analysis, we have considered two models on stocks rate of returns, one based on linear rela-
tionship using correlation coefficient and the other based on non-linear relationship using
mutual information. For both cases, we define measure of distance between pairs of stocks,
Eqs 9 and 10, and use them to construct MSTs. There are two well-known methods to con-
struct MST: Kruskal’s algorithm and Prim’s algorithm. Kruskal’s algorithm is more suited to
the case when we are working on a sparse network i.e. number of edges are less while Prim’s
algorithm is more suited when we have a dense graph. Since stock networks are dense, we
chose Prim’s algorithm to build the MST network. Prim’s algorithm starts with an arbitrary
node; add an edge from this node to another node corresponding to the shortest distance,
which has not yet been included in the graph. Then repeat this process until all the nodes are
included in the graph.
4) Discussion
4.1 Comparative study of the methods
In the past, researchers have used correlation coefficient of daily rate of return of stocks to
understand the networks amongst them [1–11]. Pan and Sinha [4] studied daily rate of return
in context of Indian stock market and they observed strong correlation movement in compari-
son to a developed country like US. In their study, they observed that the bulk of the data is in
synergy with RMT with a few deviations that indicate market effect. In our analysis, we work
on high frequency data with a tick size of 30 seconds. Around 42%, 50% and 58% deviations
are observed from the RMT during pre-election, election and post-election period respectively,
out of which 6.74%, 8.99% and 7.87% deviations correspond to large eigenvalues for the three
time spans respectively (Table 3). The compositions of the first and second eigenvectors (S4
Fig) indicate that the stocks corresponding to financial sector and the IT sectors are the key
contributors over all the three-time spans. Unlike earlier studies based on daily rate of returns
[2, 4], the composition of the first eigenvector in our analysis points towards a sectorial effect.
During the pre-election time, financial sector, IT sector and energy sector are key contributors
in the second eigenvector. However, during the election and post- election it is the financial
sector and the energy sector, which are the dominant contributors towards second eigenvec-
tor. From third eigenvector onwards, no direct interpretation is observed.
Deviations from the RMT suggest that the correlations observed are not all due to random-
ness and hence, in order to study the linear relationship between the stocks in depth, we con-
struct a minimum spanning tree graph with the distance metric as,
dðRk;RsÞ ¼ ð1 � jrRk;Rs jÞ; ð10Þ
Mutual information and portfolio selection for intraday traders using high frequency data
PLOS ONE | https://doi.org/10.1371/journal.pone.0221910 August 29, 2019 7 / 19
where rRk;Rs is correlation coefficient between the rate of returns of the two stocks Rk,Rs. To
capture the non-linearity in the data, we also construct the mutual information based MST
using the distance given in Eq 9. We have used Gephi 0.9.2 (https://gephi.org/) to plot these
networks. We also did a hypothesis test of independence at 5% level of significance. Null
hypothesis: two stocks are independent; Alternate hypothesis: they are not independent. In the
cases where null hypothesis cannot be rejected, we assign the value of mutual information to
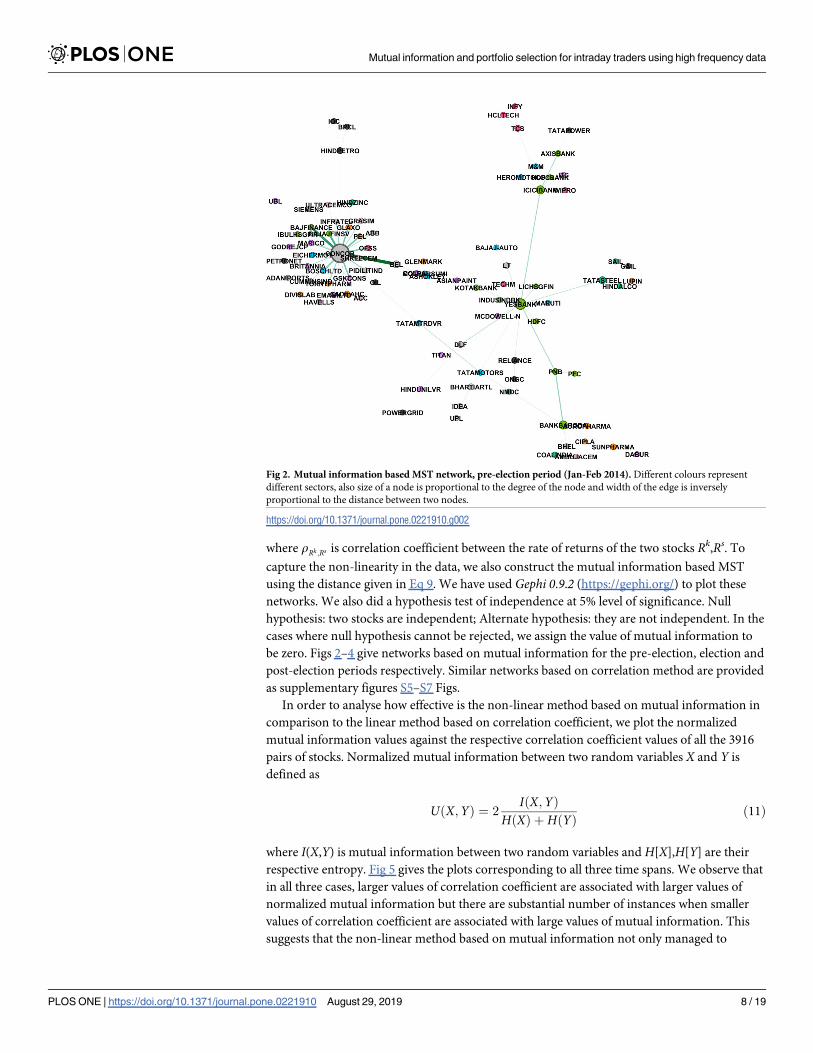
be zero. Figs 2–4 give networks based on mutual information for the pre-election, election and
post-election periods respectively. Similar networks based on correlation method are provided
as supplementary figures S5–S7 Figs.
In order to analyse how effective is the non-linear method based on mutual information in
comparison to the linear method based on correlation coefficient, we plot the normalized
mutual information values against the respective correlation coefficient values of all the 3916
pairs of stocks. Normalized mutual information between two random variables X and Y is
defined as
U X;Yð Þ ¼ 2IðX;YÞ
HðXÞ þ HðYÞð11Þ
where I(X,Y) is mutual information between two random variables and H[X],H[Y] are their
respective entropy. Fig 5 gives the plots corresponding to all three time spans. We observe that
in all three cases, larger values of correlation coefficient are associated with larger values of
normalized mutual information but there are substantial number of instances when smaller
values of correlation coefficient are associated with large values of mutual information. This
suggests that the non-linear method based on mutual information not only managed to
Fig 2. Mutual information based MST network, pre-election period (Jan-Feb 2014). Different colours represent
different sectors, also size of a node is proportional to the degree of the node and width of the edge is inversely
proportional to the distance between two nodes.
https://doi.org/10.1371/journal.pone.0221910.g002
Mutual information and portfolio selection for intraday traders using high frequency data
PLOS ONE | https://doi.org/10.1371/journal.pone.0221910 August 29, 2019 8 / 19

capture strong linear relationships but at the same time capture the non-linearity found in the
data which the method based on correlation coefficient failed to capture. Also, there are
instances when mutual information values are small in comparison to the values of correlation.
However, such instances are few and also the magnitude of the correlation coefficient of the
pairs falling in this category is very small, less than 0.1. We believe this could be due to some
random noise in the data. Overall, it is quite evident that mutual information method is more
effective in capturing the interaction between the stocks, in comparison to the widely used cor-
relation method for building stock networks. We also plot similar graph between correlation
and mutual information but now considering daily rate of returns for the entire year 2014 (Fig
6). It is observed from the graph that except for one pair, high values of mutual information
are associated with high values of correlations. There are some pairs where higher values of
mutual information are associated with lower values of correlations but the magnitude of the
mutual information in such cases are not very large. It is observed, that the non-linearity cap-
tured by the mutual information at high frequency level is much more pronounced in compar-
ison to daily return data.
Fig 3. Mutual information based MST network, election period (Mar-May 2014). Different colours represent
different sectors, also size of a node is proportional to the degree of the node and width of the edge is inversely
proportional to the distance between two nodes.
https://doi.org/10.1371/journal.pone.0221910.g003
Mutual information and portfolio selection for intraday traders using high frequency data
PLOS ONE | https://doi.org/10.1371/journal.pone.0221910 August 29, 2019 9 / 19

In order to get more insights, we also study some of the centrality measures like degree,
degree distributions and eigenvector centrality with respect to stock networks obtained using
Fig 4. Mutual information based MST network, post-election period (Jun-Dec 2014). Different colours represent
different sectors, also size of a node is proportional to the degree of the node and width of the edge is inversely
proportional to the distance between two nodes.
https://doi.org/10.1371/journal.pone.0221910.g004
Fig 5. Correlation coefficient versus mutual information: high frequency data. On x-axis we have correlation coefficients and on y-axis
we have normalized mutual information for all 3916 pairs. (a), (b) and (c) correspond to pre-election, election and post-election periods.
https://doi.org/10.1371/journal.pone.0221910.g005
Mutual information and portfolio selection for intraday traders using high frequency data
PLOS ONE | https://doi.org/10.1371/journal.pone.0221910 August 29, 2019 10 / 19

mutual information and correlation coefficient methods. We use the eigenvector centrality
measure to pick the best stocks for asset allocation at each instant of a tick and study the stabil-
ity of their selection. We also compare the performance of the portfolio selected based on
mutual information method with the portfolio selected based on correlation method and the
portfolio selected using Markowitz method.
Fig 6. Correlation coefficient versus mutual information: daily returns for the year 2014. On x-axis we have correlation coefficients and
on y-axis we have normalized mutual information for all 3916 pairs. (a), (b) and (c) correspond to pre-election, election and post-election
periods.
https://doi.org/10.1371/journal.pone.0221910.g006
Fig 7. Power law fit to the degree distribution based on mutual information and correlation coefficients. (a) corresponds to
network based on mutual information for the pre-election period, (b) corresponds to network based on mutual information for the
election period, (c) corresponds to network based on mutual information for the post-election period, similarly (c), (d) and (e)
corresponds to network based on correlation coefficient for the pre-election, election and post-election period respectively. Solid blue
circles corresponds to empirical frequency and dashed line corresponds to the pdf of fitted power-law distribution.
https://doi.org/10.1371/journal.pone.0221910.g007
Mutual information and portfolio selection for intraday traders using high frequency data
PLOS ONE | https://doi.org/10.1371/journal.pone.0221910 August 29, 2019 11 / 19

4.2 Degree distribution of the networks
In a graph, the degree of a node is the number of links attached to that node. Nodes with high
degrees are important and they are called hubs. Stocks corresponding to hubs in a network can
be viewed as stocks, which are linked to good enough number of other stocks, and thus any
flow of information amongst the stocks found in periphery of hubs takes place through these
hubs. We looked at degree distribution of the stocks in all the three MST stock networks.
Stocks from financial sector, like ICICI Bank, PNB, Yes Bank, observed to have degrees more
than 4, are clearly the dominant stocks irrespective of the methods and the time span. Other
than financial sector, there are a few stocks from the IT and Energy sector which are found to
have high degree.
Emergence of hubs in a network is seen as a property of a scale free network, i.e. a network
whose degree distribution follows power law distribution, with power law exponent α,
2<α<3. We, therefore analyse the probability distribution of the degrees of the stocks in the
networks based on correlation coefficient method and mutual information method, for the
three time periods. Clauset, Shalizi and Newman [30] suggested that in case of a discrete ran-
dom variable the power law exponent can be approximated by
a ffi 1þ nPn
i¼1ln
di
dmin � 0:5
� �� �� 1
ð12Þ
where n is number of sample points d1,d2,. . . dn. dmin is the cut-off parameter. Since degrees
are always greater than or equal to 1, so we took dmin to be 1 in all the cases. We also used
goodness of fit test based on Kolmogrov-Smirnov (KS) statistic to find the p -values in order to
test if the fit is good or not. A high p-values suggest that the power law fit, with exponent a, is a
good fit and a lower p-values suggest that it is not. Synthetic data was generated 5000 times to
calculate p-values in each case. In Fig 7 we plot empirical frequency of the degrees and fitted
power law corresponding to each of the six networks. Table 4 gives the respective estimates of
α and the p-values. In all the cases, p-values are found to be greater than or equal to 2% (>1%
level of significance), in some cases even greater than 10%. Thus, we conclude that the power
law is a plausible distribution fit to our data. It is quite evident that the estimated value of aðaÞ
is observed to be smallest during the election time for the both correlation based network as
well as mutual information based network. We also observe that the correlation-based net-
works did not have the scale-free property. However, mutual information based networks cor-
responding to pre-election and post-election period had the scale-free property. Further,
during the election period the power law exponent corresponding to mutual information
based network was less than 2. This is an indication of a thicker tail, i.e., there are greater num-
ber of nodes with high degree in the MST network. This suggests that there are stronger
Table 4. Estimated power law exponent a for degree distribution.
α ðp valueÞNetwork based on correlation coefficient
method
α ðp valueÞNetwork based on mutual information
method
Pre-election
Jan-Feb 2014
1.95(0.14) 2.02(0.02)
Election
Mar-May
2014
1.93(0.11) 1.93(0.09)
Post-election
Jun-Dec 2014
1.93(0.21) 2.01(0.03)
https://doi.org/10.1371/journal.pone.0221910.t004
Mutual information and portfolio selection for intraday traders using high frequency data
PLOS ONE | https://doi.org/10.1371/journal.pone.0221910 August 29, 2019 12 / 19

interactions amongst the stocks during this time. As an implication, we may observe that port-
folio diversification would become less effective during this period.
4.3 Eigenvector centrality measure
We also consider the eigenvector centrality measure to identify important stocks in terms of
flow of information and to identify the surroundings of such stocks. For each node, we define
a relative score such that for a node, its connections to high-scoring nodes contribute more
towards its score in comparison to all the low scoring nodes in its neighbourhood. The spectra
of the adjacency matrix and Laplacian matrix help us to define such a scoring system and iden-
tify the neighbourhoods of highly scoring nodes [31–32].
The adjacency matrix of a graph is a n×n matrix, where n is the number of nodes in the
graph, and the (i,j)th entry in the adjacency matrix is 1 if there is an edge between node i and jand it is 0 if there is no such edge. Adjacency matrix is a non-negative matrix and as an appli-
cation of the Perron-Frobenius theorem, the eigenvector corresponding to the highest eigen-
value, also known as Perron eigenvector, emerges as a good choice for the scoring system that
we are looking for [31]. High scoring stocks based on Perron eigenvector corresponding to
mutual information networks for the three timespans, are included as supplementary tables;
S1–S3 Tables.
In order to capture the stocks present in the neighbourhood of the stocks with high scores,
we consider the Fiedler vector. Fiedler vector is the eigenvector corresponding to the second
smallest eigenvalue of the Laplacian matrix [32]. This vector is used to detect communities
within the network. We study communities corresponding to high scoring nodes, i.e. the
stocks found in the neighbourhood of these high scoring nodes.
In a community, high scoring nodes can be interpreted as key agents, through which infor-
mation gets transferred to other members in their respective communities. Thus, these high
scoring nodes can be thought of as stocks which are more susceptible to market risk at least in
comparison to the nodes present in the periphery of their community. Thus, stocks corre-
sponding to the peripheral nodes could act as a good choice for portfolio selection. Pozzi, Mat-
teo and Aste [25] in 2013 suggested a correlation based peripheral stock methodology for
portfolio selection. We therefore give a mutual information based peripheral stock methodol-
ogy and perform a comparative study for the portfolio selection.
4.4 Portfolio selection at a high frequency level: a comparative study
For an intraday trader it is almost impossible to invest in a large number of stocks. We propose
a method where an investor may invest in fewer numbers of stocks and remain competitive
with a fully diversified portfolio consisting of larger number of stocks. We worked on 30-sec-
ond data of 89 stocks picked from CNX100 index of National Stock Exchange of India for the
entire year 2014. At each instant, we considered past 2-hours sample data and tested the stabil-
ity of the portfolios obtained over the next two hours. Firstly, we filtered out the best 45 effi-
cient stocks out of 89 stocks based on high �r=s ratio, i.e. high ration of sample mean to sample
standard deviation, based on the past 2 hours. High �r=s of a stock ensures that the average
return of the stock is high with low standard deviation, thus stock is stable with high returns.
These 45 stocks were then further analysed to obtain portfolios based on five different
methods:
• Method 1:Markowitz portfolio selection, portfolio which maximizes the Sharpe ratio by
investing in all 45 stocks
Mutual information and portfolio selection for intraday traders using high frequency data
PLOS ONE | https://doi.org/10.1371/journal.pone.0221910 August 29, 2019 13 / 19

• Method 2: Markowitz portfolio selection, portfolio which maximizes the Sharpe ratio by
investing in all 45 stocks using exponential weighted correlation coefficients [25, 33].
• Method 3: Picking peripheral stocks (stocks with low eigenvector centrality scores) in MST
constructed based on correlation method. We analysed portfolios composed of 3, 5, or 10
most peripheral stocks.
Fig 8. An example of a peripheral portfolio obtained from MI based MST network of 44 stocks. Minimum
spanning tree network based on mutual information method for data corresponding to Jan 1, 2014, 9:30:00 hrs to
11:30:00 hours (240 thirty-second time ticks). 5 peripheral stocks out of 44 stocks obtain using method 5 is represented
by green colour. Size of nodes are proportional to their corresponding weights in Markowitz portfolio constructed by
minimizing the Sharpe ratio.
https://doi.org/10.1371/journal.pone.0221910.g008
Fig 9. Performance of portfolios. On y-axis we have taken �r�=s (averaged over all 47718 portfolios ~ 1 year, 2014) and on x-axis 240 time ticks
corresponding to 30second, 1 minute, 1.5 minute. . .240 minutes, from the time of investments. Green colour plus (+): Markowitz portfolio
consisting of 45 stocks which maximizes Sharpe ratio using exponential weighted correlation; Blue colour circle (o): Markowitz portfolio
consisting of 45 stocks which maximizes Sharpe ratio using simple correlations; Black colour square (): mutual information based portfolio
consisting of 5 peripheral stocks; Red colour triangle (⊿): correlation based portfolio consisting of 5 peripheral stocks; Cyan colour cross (�):
exponential weighted correlation based portfolio consisting of peripheral stocks; (a) comparison based on 3 peripheral stocks (b) comparison
based on 5 peripheral stocks (c) comparison based on 10 peripheral stocks.
https://doi.org/10.1371/journal.pone.0221910.g009
Mutual information and portfolio selection for intraday traders using high frequency data
PLOS ONE | https://doi.org/10.1371/journal.pone.0221910 August 29, 2019 14 / 19

• Method 4: Picking peripheral stocks (stocks with low eigenvector centrality scores) in MST
constructed based on exponential weighted correlation method [25, 33]. Again, we analysed
portfolios composed of 3, 5, or 10 most peripheral stocks.
• Method 5: Picking peripheral stocks (stocks with low eigenvector centrality scores) in MST
constructed based on mutual information method. Again, portfolios composed of 3, 5, or 10
most peripheral stocks. Fig 8 corresponds to one such composition of the portfolio which
consist of 5 peripheral stocks.
Exponential weighted correlation is calculated using exponential weighted sample mean
and exponential weighted sample variance [33] where weights are such that more weight is
given to the recent most event in comparison to the past events. Pozzi, Matteo and Aste [33]
have suggested the use of exponential weighted correlation based models instead of simple cor-
relation. We thus compare our proposed model with both these models.
At each instant, we took past 2-hour data, constructed the portfolios based on all five meth-
ods, a total of 5×47718 portfolios in 1 year (2014), and then tested their performance over the
next 2 hours by calculating the respective rate of returns. For each method, there were 47718
such portfolios, and for each portfolio, we calculated the rate of return in the next 30second, 1
minute, 1.5 minute. . .2 hours from the time of investment. One would like to invest such that
the average return �r is large and at the same time fluctuations are small, i.e. sample standard
deviation s is small. Thus we tested the performance of each method by calculating �r=s respec-
tively for the next 30second, 1 minute, 1.5 minute,. . .2 hour, averaged over all 47718 portfolios.
In Fig 9, 240 instants of time corresponding to 2 hours from the time of investment are taken
on the x axis and �r=s (averaged over all 47718 portfolios in the entire year) on y axis. Clearly,
portfolios corresponding to Markowitz method consisting of all 45 stocks perform the best
though there is hardly any difference between the case of simple correlations and the case of
exponential weighted correlations. From the perspective of an intraday trader, it is almost
impossible for a trader to invest in all 45 stocks at a time and thus one would like to invest in
best 4 to 6 diversified stocks. Pozzi, Matteo and Aste [25] had earlier suggested to invest in
peripheral stocks in the MST network constructed using exponential weighted correlation. We
therefore construct portfolios constituting 3, 5 or 10 most peripheral stocks found in the MST
networks i.e. stocks with the lowest eigenvector centrality score, corresponding to MST based
on correlation, exponential weighted correlation and mutual information methods. Portfolios
obtained using mutual information method are seen to be much better in terms of stability
and efficiency in comparison to the ones obtained using correlations (Fig 9).
5) Conclusion
The aim of this paper was to study interactions between the stocks at a high frequency level
with respect to the Indian stock market. For this purpose, we picked 30 seconds as our tick size
and studied behaviour of 89 more frequently traded stocks out of 100 stocks listed in CNX100
for the year 2014. We analysed the spectrum of the correlation matrix to study the random-
ness. More than 40% deviations were observed from the RMT indicating that the pairwise cor-
relation coefficients are not random. We then compared the pairwise correlation coefficients
with their respective mutual information. Our analysis showed existence of non-linearity in
the high frequency data, that mutual information managed to capture very well. We thus pro-
pose that networks based on mutual information, in comparison to the networks based on cor-
relation coefficient, capture the dynamics between the stocks at a high frequency level
effectively. Networks constructed using mutual information showed a scale-free property with
Mutual information and portfolio selection for intraday traders using high frequency data
PLOS ONE | https://doi.org/10.1371/journal.pone.0221910 August 29, 2019 15 / 19

power law exponent 2 < a < 3 (p–value�0.02) in comparison to correlation coefficient
method during pre-election and post-election periods. During election period however, power
law exponent a was observed to be less than 2, indicating that there are quite a number of
stocks with large degrees. Thus, a major political event like a general election induces a co-
movement of stocks in the market. Also, as a practical application, we have presented a mutual
information based methodology of selecting a portfolio consisting of very small number of
stocks, as small as 3, 5 or 10, which on an average promises to deliver good returns along with
lesser fluctuations even at high frequency level.
Based on our analysis, we finally conclude that stock networks based on the mutual infor-
mation method capture the dynamics of the stock market more effectively at high frequency
level. In future, one may explore the applications of mutual information and other nonlinearity
measures to estimate risk more effectively and develop better trading strategies. We also plan
to investigate the use of other centrality measures for portfolio selection.
Supporting information
S1 Fig. Log rate of return graphs for CNX100. (a) corresponds to pre-election period, (b)
election period and (c) post-election period; x-axis corresponds to tick points and on y-axis we
have log rate of returns corresponding to each tick.
(TIF)
S2 Fig. Eigenvalue distribution of correlation matrix. (a) pre-election, (b) election and (c)
post-election period. Histograms corresponds to empirical probability distribution and solid
red line corresponds to the theoretical pdf.
(TIF)
S3 Fig. Eigenvalue distribution of correlation matrix on the testing data obtained after
reshuffling of the returns of each stock. (a), (b) and (c) are graphs corresponding to pre-elec-
tion, election and post-election period by testing on one such shuffled dataset. (d), (e) and (f)
are graphs corresponding to pre-election, election and post-election period on ensemble test-
ing datasets, i.e. repeating one such trial 50 times. Histograms correspond to empirical proba-
bility distribution and solid line corresponds to the theoretical pdf.
(TIF)
S4 Fig. Composition of first three principal eigenvectors of the correlation matrix. Bars
represents eigenvector components for each stock corresponding to three largest eigenvalues
for the three timespan. (a), (d) and (g) corresponds to the largest eigenvector, (b), (e) and (h)
corresponds to second largest eigenvector and (c), (f) and (i) corresponds to the third eigen-
vector for pre-election, election and post-election period respectively. Stocks on the x-axis are
arranged according to sectors, A:automobile, B:Consumer Goods, C:Pharmasuticals, D:Finan-
cial Services, E:Energy and F:IT sector.
(TIF)
S5 Fig. Correlation based MST network, pre-election period (Jan-Feb 2014). Different col-
ours represent different sectors, also size of a node is proportional to the degree of the node
and width of the edge is inversely proportional to the distance between two nodes.
(TIF)
S6 Fig. Correlation based MST network, election period (Mar-May 2014). Different colours
represent different sectors, also size of a node is proportional to the degree of the node and
width of the edge is inversely proportional to the distance between two nodes.
(TIF)
Mutual information and portfolio selection for intraday traders using high frequency data
PLOS ONE | https://doi.org/10.1371/journal.pone.0221910 August 29, 2019 16 / 19

S7 Fig. Correlation based MST network, post-election period (Jun-Dec 2014). Different col-
ours represent different sectors, also size of a node is proportional to the degree of the node
and width of the edge is inversely proportional to the distance between two nodes.
(TIF)
S1 Table. High scoring stocks with scores from Perron vector, pre-election period (Jan-Feb
2014).
(DOCX)
S2 Table. High scoring stocks with scores from Perron vector, election period (Mar-May
2014).
(DOCX)
S3 Table. High scoring stocks with scores from Perron vector, post-election period (Jun-
Dec 2014).
(DOCX)
S4 Table. Data corresponding to Figs 1–9, S1–S7 Figs.
(XLSX)
Acknowledgments
We are immensely grateful to Professors Sunil Bowry, Sanjeev Agrawal, Sudeepto Bhatta-
charya, Karmeshu for their valuable comments.
Author Contributions
Conceptualization: Charu Sharma, Amber Habib.
Data curation: Charu Sharma.
Formal analysis: Charu Sharma.
Funding acquisition: Charu Sharma, Amber Habib.
Investigation: Charu Sharma.
Methodology: Charu Sharma.
Project administration: Charu Sharma.
Resources: Charu Sharma.
Software: Charu Sharma.
Supervision: Charu Sharma.
Validation: Charu Sharma.
Visualization: Charu Sharma.
Writing – original draft: Charu Sharma.
Writing – review & editing: Charu Sharma, Amber Habib.
References1. Laloux L, Cizeau P, Bouchaud JP, Potters M. Noise Dressing of Financial Correlation Matrices. Physi-
cal. Review Letters. 1999 Aug; 83. https://doi.org/10.1103/PhysRevLett.83.3324
Mutual information and portfolio selection for intraday traders using high frequency data
PLOS ONE | https://doi.org/10.1371/journal.pone.0221910 August 29, 2019 17 / 19

2. Gopikrishnan P, Rosenow B, Plerou V, Stanley HE. Quantifying and interpreting collective behavior in
financial markets. Physical Review E. 2001. https://doi.org/10.1103/PhysRevE.64.035106 PMID:
11580379
3. Plerou V, Gopikrishnan P, Rosenow B, Amaral LAN, Stanley HE. Collective behavior of stock price
movements–a random matrix theory approach. Physical A: Statistical Mechanics and its Applications.
2001; 299(1–2). https://doi.org/10.1016/S0378-4371(01)00293-X
4. Pan RK, Sinha S. Collective behavior of stock price movements in an emerging market. Physical
Review E. 2007; 76(4). https://doi.org/10.1103/PhysRevE.76.046116 PMID: 17995069
5. Kim MJ, Kwak YB, Kim SY. Dependence structure of the Korean stock market in high frequency data.
Physica A. 2010. https://doi.org/10.1016/j.physa.2010.11.026
6. Chen H, Mai Y, Li SP. Analysis of network clustering behavior of the Chinese stock market. Physica A.
2014. https://doi.org/10.1016/j.physa.2014.07.039
7. Mantegna RN. Hierarchical structure in financial markets. Eur. Phys. 1999; 11(193–197). https://doi.
org/10.1007/s100510050929
8. Song DM, Tumminello M, Zhou WX, Mantegna RN. Evolution of worldwide stock markets, correlation
structure and correlation based graphs. Physical Review E. 2011. https://doi.org/10.1103/PhysRevE.
84.026108 PMID: 21929065
9. Ponta L, Pastore S, Cincotti S. Static and dynamic factors in an information-based multi asset artificial
stock market. Physica A: Statistical Mechanics and its applications. 2017; 492. https://doi.org/10.1016/
j.physa.2017.11.012
10. Ji J, Huang C, Cao Y, Hu S. The network structure of Chinese finance market through the method of
complex network and random matrix theory. Concurrency and Computation: Practice and Experiences.
2019. https://doi.org/10.1002/cpe.4877
11. Soramaki K, Cook SR, Laubsch A. A network-based method for visual identification of systemic risks.
Journal of Network Theory in Finance.2016; 2(1), 67–101. https://doi.org/10.21314/JHTF.2016,016
12. Song L, Langfelder P, Horvath S. Comparison of co-expression measures: mutual information, correla-
tion, and model based indices. BMC Bioinfomatics. 2012. https://doi.org/10.1186/1471-2105-13-328
PMID: 23217028
13. Wang YX, Huang H. Review on statistical methods for gene network reconstruction using expression
data. Journal of Theoretical Biology. 2014. https://doi.org/10.1016/j.jtbi.2014.03.040 PMID: 24726980
14. Kwon O, Yang J-S. Information flow between stock indices. Europhysics letters. 2008; 82. https://doi.
org/10.1209/0295-5075/82/68003
15. Villaverde AF, Ross Moran JF, Banga JR. MIDER: Network Inference with Mutual Information Distance
and Entropy Reduction. PLOS One. 2014. https://doi.org/10.1371/journal.pone.0096732 PMID:
24806471
16. Fiedor P. Network in financial markets based on mutual information rate. Physical Review E. 2014.
https://doi.org/10.1103/PhysRevE.89.052801 PMID: 25353838
17. Tao Y, Fiedor P, Holda A. Network analysis of the Shanghai stock exchange based on partial mutual
information. Journal of Risk and Financial Management. 2015. https://doi.org/10.3390/jrfm8020266
18. Guo X, Zhang H, Tian T. Development of stock correlation networks using mutual information and finan-
cial big data. PLOS One. 2018. https://doi.org/10.1371/journal.pone.0195941 PMID: 29668715
19. Ponta L, Carbone A. Information measure for financial time series: Quantifying short-term market het-
erogeneity. Physica A. 2018; 510(132–144). https://doi.org/10.1016/j.physa.2018.06.085
20. Barbi AQ, Prataviera GA. Nonlinear dependencies on Brazilian equity network from mutual information
minimum spanning trees. Physica A. 2019; 523 (876–885). https://doi.org/10.1016/j.physa.2019.04.
147
21. Khoojine AS, Han D. Network analysis of the Chinese stock market during the turbulence of 2015–2016
using log-returns, volumes and mutual information. Physica A:Statistical Mechanics and its Applica-
tions. 2019; 523(1091–1109). https://doi.org/10.1016/j.physa.2019.04.128
22. Sandoval S. Jr. Networks of log returns ad volatilities of International stock market indexes. Journal of
Network Theory in Finance. 2017; 3(41–82). https://doi.org/10.21314/JNTF.2017.033
23. Philippatos GC, Wilson CJ. Entropy, market risk, and the selection of efficient portfolios. Applied Eco-
nomics. 1972; 4(209–220).
24. Zhou R, Cai R, Tong G. Applications of entropy in finance: A review. Entropy. 2013; 15(4909–4931).
https://doi.org/10.3390/e15114909
25. Pozzi F, Matteo TD, Aste T. Spread of Risk across financial markets: better to invest in peripheries. Sci-
entific Reports. 2013. https://doi.org/10.1038/srep01665 PMID: 23588852
Mutual information and portfolio selection for intraday traders using high frequency data
PLOS ONE | https://doi.org/10.1371/journal.pone.0221910 August 29, 2019 18 / 19

26. Cellucci CJ, Albano AM, Rapp PE. Statistical validation of mutual information calculation of alternative
numerical algorithm. Physical Review E. 2005; 71. https://doi.org/10.1103/PhysRevE.71.066208
PMID: 16089850
27. Kraskov A, Stogbauer H, Grassberger P. Estimating mutual information. Physical Review E. 2004; 69.
https://doi.org/10.1103/PhysRevE.69.066138 PMID: 15244698
28. Steuer R, Kurths J, Daub CO, Weise J, Selbig J. The mutual information: Detecting and evaluating
dependencies between variables. Bioinformatics. 2002; 18(S231–S240). https://doi.org/10.1093/
bioinformatics/18.suppl_2.s231 PMID: 12386007
29. Goodell JW, Vahamaa S. US presidential elections and implied volatility: The role of political uncer-
tainty. Journal of Banking and Finance. 2013; 37(1108–1117). https://doi.org/10.1016/j.jbankfin.2012.
12.001
30. Clauset A, Shalizi CR, Newman M.E.J. Power law distributions in empirical data. SIAM Review. 2009;
51(661–703). https://doi.org/10.1137/070710111
31. Meyer CD. Matrix analysis and applied linear algebra. SIAM. 2000. ISBN 978-0-89871-454-8.
32. Fiedler M. Algebraic connectivity of Graphs. Czechoslovak Mathematical Journal, 1973; pp. 298–305.
33. Pozzi F, Matteo TD, Aste T. Exponential smoothing weighted correlations. The European Physical Jour-
nal B. 2012; 85–295. https://doi.org/10.1140/epjb/e2012-30636-6
Mutual information and portfolio selection for intraday traders using high frequency data
PLOS ONE | https://doi.org/10.1371/journal.pone.0221910 August 29, 2019 19 / 19