mutual information - jallen.faculty.arizona.edu · mutual information indicates shared information...
TRANSCRIPT

Mutual Information
Amusingly rehashed byLauritz

High Entropy for Mutual Information…for now
• Quantifies the amount of data (information) shared (mutual) between variables.
• Connectivity• Self explanatory!• Robust to many distributions of data• Widely used in many fields of study

Built from Entropyen∙tro∙pynoun \ˈen‐trə‐pē\plural en∙tro∙piesDefinition of ENTROPY1: a measure of the unavailable energy in a closed thermodynamic system that is also usually considered to be a measure of the system's disorder, that is a property of the system's state, and that varies directly with any reversible change in heat in the system and inversely with the temperature of the system; broadly : the degree of disorder or uncertainty in a system2a : the degradation of the matter and energy in the universe to an ultimate state of inert uniformityb : a process of degradation or running down or a trend to disorder3: CHAOS, DISORGANIZATION, RANDOMNESS— en∙tro∙pic adjective— en∙tro∙pi∙cal∙ly adverb
From http://www.merriam‐webster.com/dictionary/entropy

Entropy in Information Theory• Metric of uncertainty ‐random• Shannon entropy: Quantifies and predicts information (bits) in a message. Average unpredictability
• X: Amount of surprise
‐High entropy implies thesignal can take on many statesor configurations‐Low entropy only limited number of configurations
Here is a link to the original article A Mathematical Theory of Communication:http://cm.bell‐labs.com/cm/ms/what/shannonday/shannon1948.pdf

Disappointing –Yet surprisingly exciting

Shannon Entropy
Sid Vicious
Jimmy Urine

Shannon Entropy

Shannon Entropy
Claude Elwood Shannon
Masters thesis at MIT on electromechanical relays (phone routing switches) became important in digital circuits and development of digital computers

Recipe for Entropy
H = measure of entropyp = probability of observing instance (i) in bin for x and yn = Number of bins

Recipe for Entropy
1. Create bins 2. Determine probability for each bin3. Multiply probability by log2 of probability4. Sum all of these and multiply by ‐1

Recipe for Entropy
1. Create bins bin data (via Matlab function hist)nbins = 50;[hdat1,x1] = hist(signal1,nbins);[hdat2,x2] = hist(signal2,nbins);

Recipe for Entropy
2. Determine probability for each binconvert histograms to probability valueshdat1 = hdat1./sum(hdat1);hdat2 = hdat2./sum(hdat2);

Recipe for Entropy
3. Multiply probably by log2 of probability4. Sum all of these and multiply by ‐1 (to produce positive results since sum of probabilities are always negative)for i=1:2eval([ 'entro(' num2str(i) ') = ‐sum(hdat' num2str(i)
'.*log2(hdat' num2str(i) '+eps));' ]);end
The sum of probabilities are negative! Probabilities are always < 1 !Log of less than 1 is negative!

Recipe for Entropy
3. Multiply probably by log2 of probability4. Sum all of these and multiply by ‐1 (to produce positive results)Or use:entro(1) = ‐sum(hdat1.*log2(hdat1+eps));entro(2) = ‐sum(hdat2.*log2(hdat2+eps));
The sum of probabilities are negative! Probabilities are always < 1 !Log of less than 1 is negative!

Recipe for Entropy
disp([ 'Entropies of sine wave and random noise are ' num2str(entro(1)) ' and ' num2str(entro(2)) '.' ]);
Entropies of sine wave and random noise are …
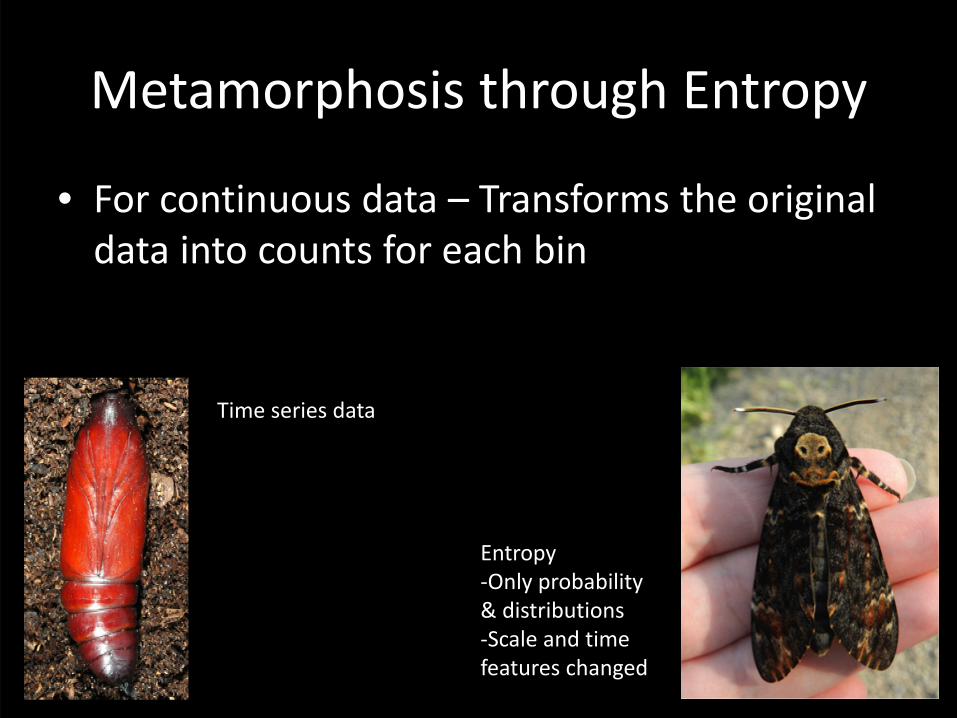
Metamorphosis through Entropy
• For continuous data – Transforms the original data into counts for each bin
Time series data
Entropy‐Only probability & distributions‐Scale and time features changed
Bits of Entropy• Bits (from X): “Uncertainty of a binary variable that has equal probability of being zero or one”
‐Comes from Log2• “Nat” = natural log
• “Ban” =log10

Bits of EntropyBits are nice because permutation changes the data to Z‐scores‐Also Bits sounds better. Who wants a ban? gNats are annoying (eg “What’d you find Bob?” “I got 19 nats”)
Zero Probability, Negative Infinity, & EPS???
NOT a list of potential band names!
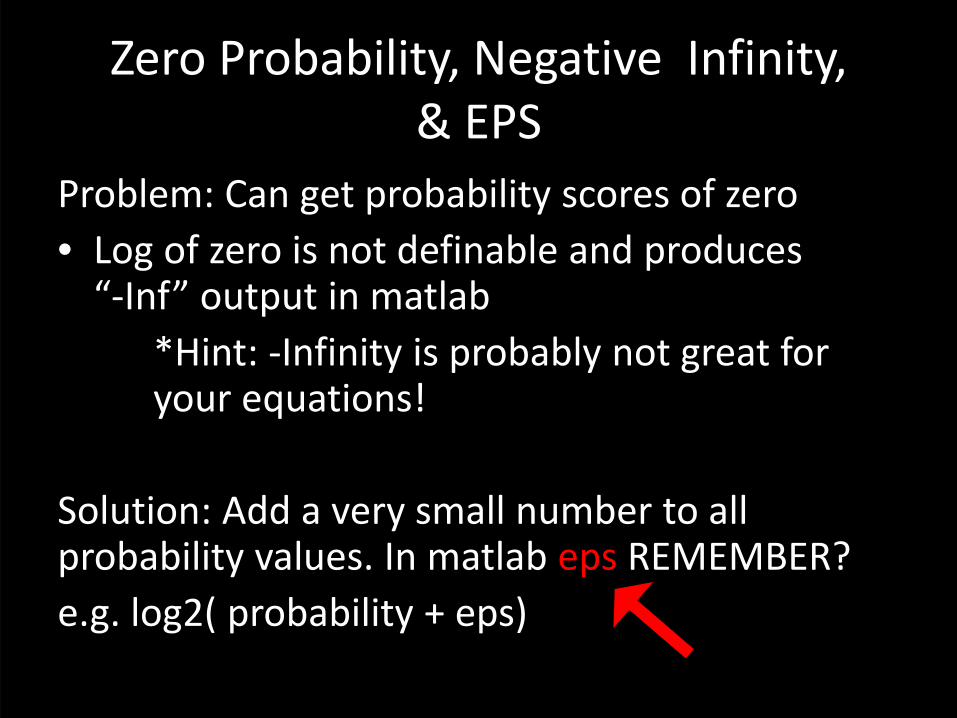
Zero Probability, Negative Infinity, & EPS
Problem: Can get probability scores of zero • Log of zero is not definable and produces “‐Inf” output in matlab
*Hint: ‐Infinity is probably not great foryour equations!
Solution: Add a very small number to all probability values. In matlab eps REMEMBER?e.g. log2( probability + eps)
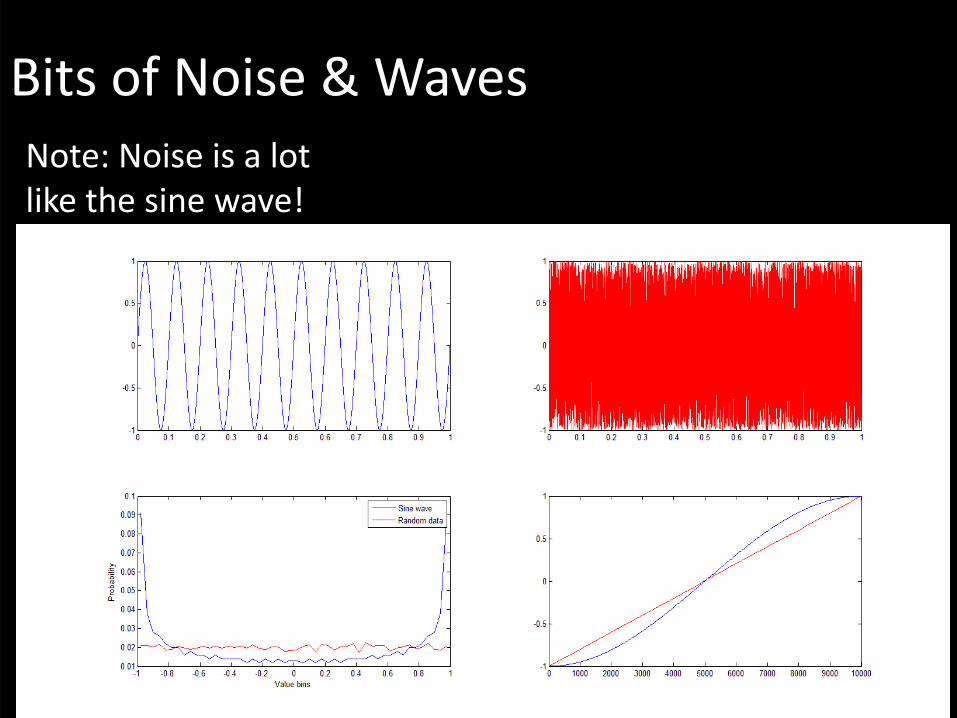
Bits of Noise & WavesNote: Noise is a lot like the sine wave!
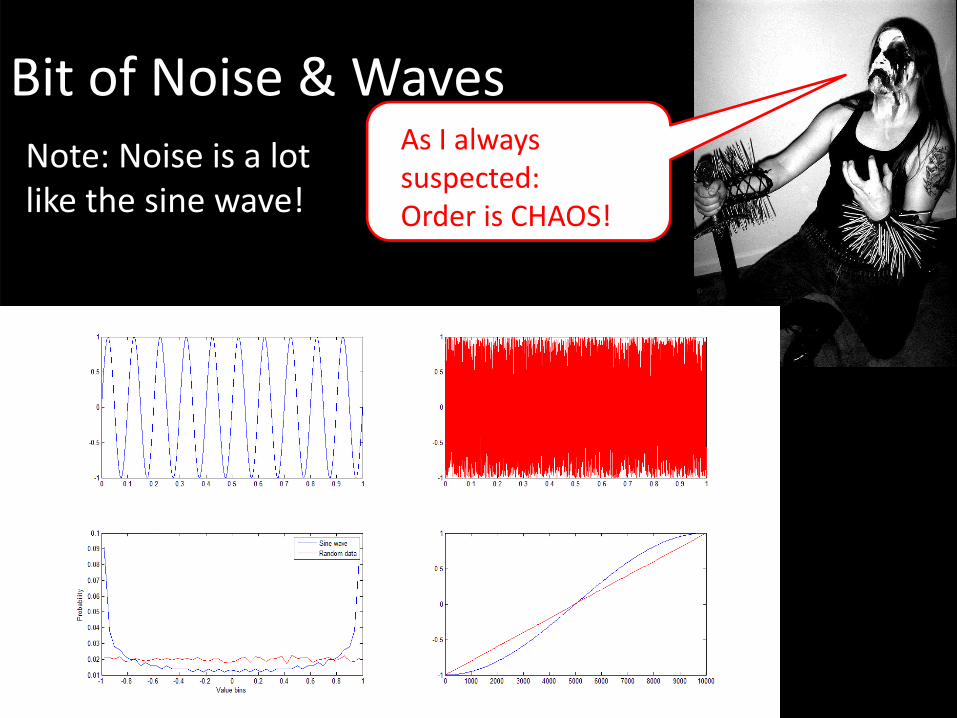
Bit of Noise & WavesNote: Noise is a lot like the sine wave!
As I always suspected:Order is CHAOS!

Bit of Noise & WavesNote: Noise is a lot like the sine wave!
As I always suspected:Order is CHAOS!
Not so fast Norwegian black metal enthusiast.As my friend Mike X says, this just means that the two signals contain similar amounts of information
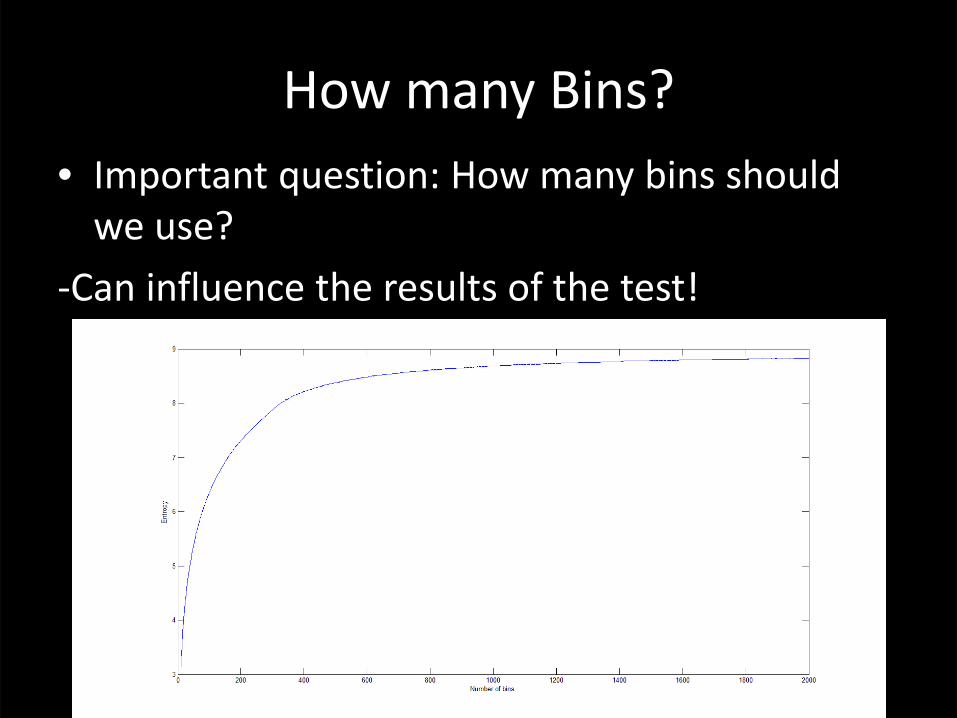
How many Bins?• Important question: How many bins should we use?
‐Can influence the results of the test!

How many Bins?
A small number would decrease sensitivity E.g. 3 bins

How many Bins?
A large number would cause a loss of generality (e.g. 1 value per bin: hist(signal1,length(signal1)

How many Bins?Statistical SolutionsAKA battle of the bands ‐Which band rules?Freedman‐Diaconis Rule Sturges’ RuleScotts Rule
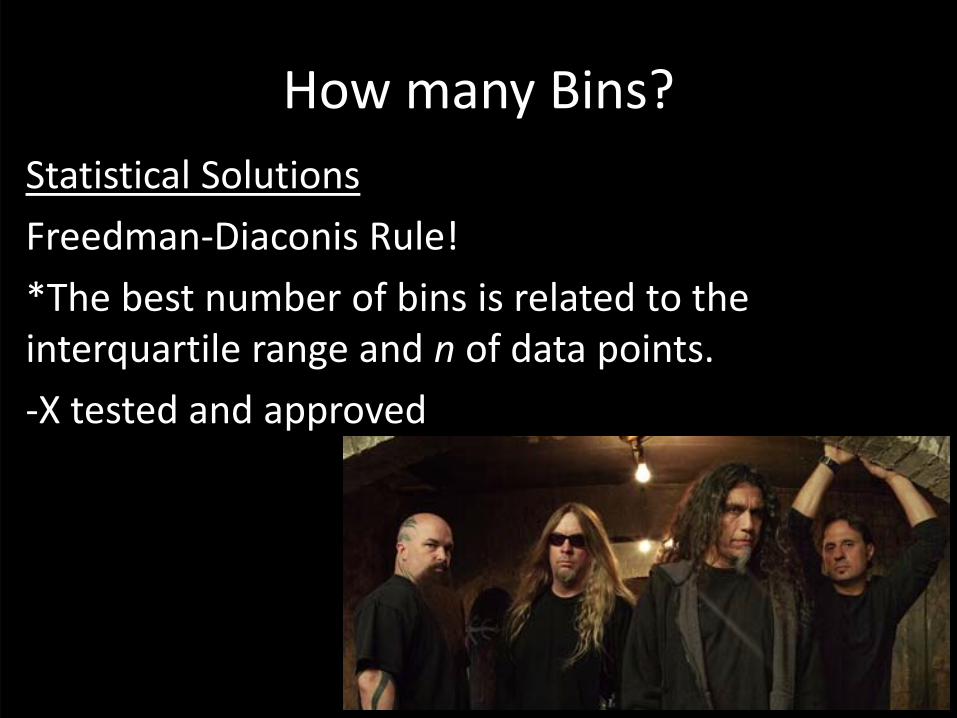
How many Bins?Statistical SolutionsFreedman‐Diaconis Rule!*The best number of bins is related to the interquartile range and n of data points.‐X tested and approved

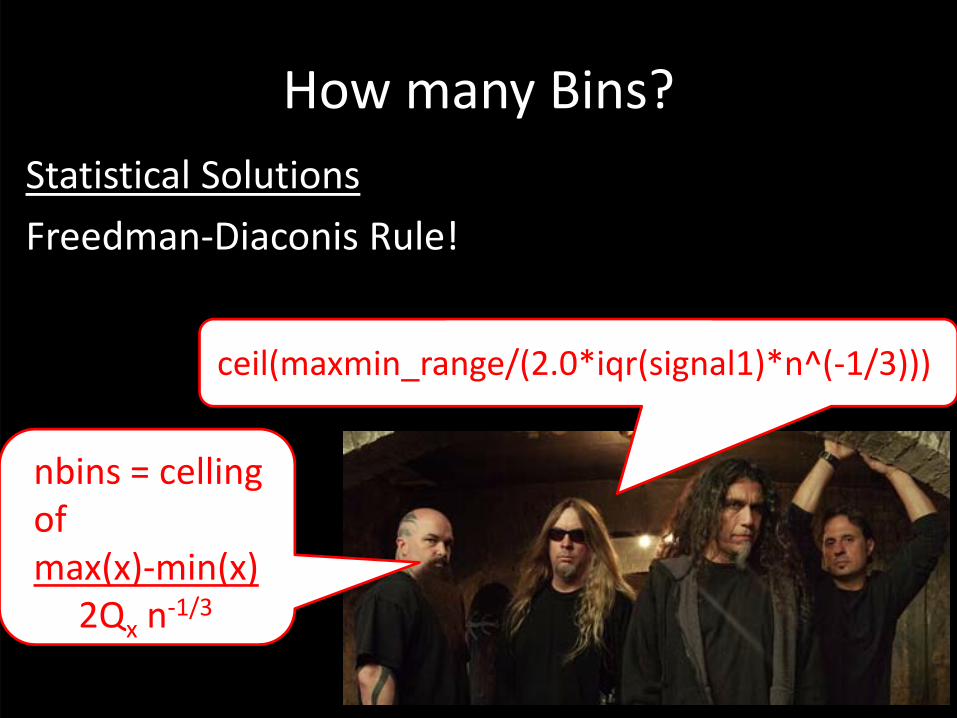
How many Bins?Statistical SolutionsFreedman‐Diaconis Rule!
nbins = celling of max(x)‐min(x)
2Qx n‐1/3
Q= Interquartile range of distribution X (25th & 75 percentiles)n = total number data pointsMax(x) & Min(x) of values in x
How many Bins?Statistical SolutionsFreedman‐Diaconis Rule!
nbins = celling of max(x)‐min(x)
2Qx n‐1/3
ceil(maxmin_range/(2.0*iqr(signal1)*n^(‐1/3)))

Side note: Persi Diaconis
Was a professional magician Now mathematician at Stanford
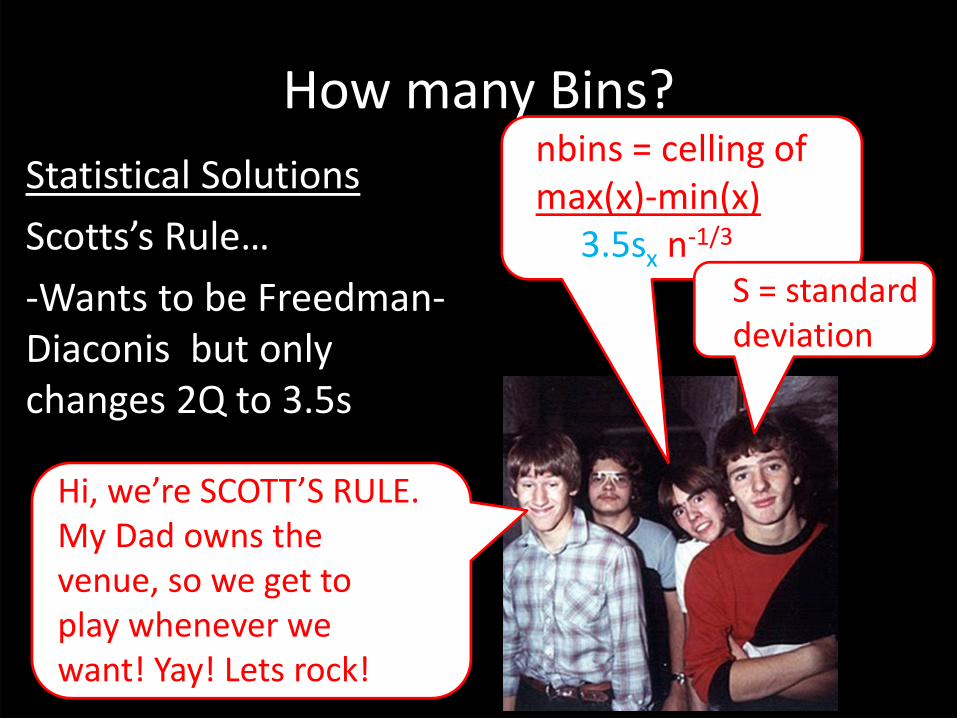
How many Bins?Statistical SolutionsScotts’s Rule…‐Wants to be Freedman‐Diaconis but onlychanges 2Q to 3.5s
Hi, we’re SCOTT’S RULE. My Dad owns the venue, so we get to play whenever we want! Yay! Lets rock!
nbins = celling of max(x)‐min(x)
3.5sx n‐1/3S = standard deviation

How many Bins?Statistical SolutionsScotts’s Rule!
ceil(maxmin_range/(3.5*std(signal1)*n^(‐1/3)))
nbins = celling of max(x)‐min(x)
3.5sx n‐1/3
How many Bins?Statistical SolutionsScotts’s Rule!Yo Yo YoYou suckas assume a normal distribution! That’s whack!
OH BURN! Vanilla Ice just said “word to your mother!”
Ouch!

How many Bins?Statistical SolutionsSturges’ Rule!
The optimal number of bins are determined by 1+log2n
ceil(1+log2(n))
How many Bins?Statistical SolutionsSturges’ Rule!
1+log2n
That is an astute observation Mr. Claypool! Thanks for your insightful critique.
Well done, but have you fine young men noticed that you don’t consider the range, only the number. This causes you to underestimate the appropriate number of bins when the number is greater than a several hundred?

How many Bins?The Freedman‐Diaconis Rule has no assumptions about the distribution!
So I guess that means it can be applied to ANY distribution of data!
That means we can apply it to EEG time‐frequency data which can have power or circular distribution!
How many Bins?
Freedman‐DiaconisRULES!!!!!
Sadly, all the rules here are only for ONE variable…
What?

How many Bins?Yah! The number of bins could be different for each variable!
Really?
How many Bins? OH NO!!
Remember: The same number of bins should be used for ALL your variables. If not this could bias your results

How many Bins? NOOOO!!!! What do we do now??
Yes! Check this out: Bin sizes correlate with mutual information!
How many Bins?Never fear my head bang addled friends, I can help with that! Simply: 1. Calculate the optimal number of bins for each variable. 2. round up the average 3. Use this with all variables!
Oh Zowwie!! That is amazing!
That sure is swell Mike X! You saved us!

How many Bins? Indeed. Yes, yes, please hold your applause. Sigh…
X! X! X! X!!!!X! X! X! X!!!!
X! X! X! X!!!!X! X! X! X!!!!
% optimal n of bins for each variablen = length(signal1);maxmin_range = max(signal1)‐min(signal1);fd_bins1 = ceil(maxmin_range/(2.0*iqr(signal1)*n^(‐1/3))); % Freedman‐Diaconis
n = length(signal2);maxmin_range = max(signal2)‐min(signal2);fd_bins2 =ceil(maxmin_range/(2.0*iqr(signal2)*n^(‐1/3)));% Freedman‐Diaconis
% and use the average...fd_bins = ceil((fd_bins1+fd_bins2)/2);

Time OR Trials OR
Time AND Trials• For mutual information (discussed in detail later) when processed over trials, temporal precision is increased.
• Good when looking for phase locked changes
• Time: Good when looking for non‐phase locked
connectivity.
Time OR Trials OR
Time AND Trials• Since entropy is not reliant on the temporal structure of the original signal…Entropy can be calculated over time AND over trials together (data points * trials)
• Increases the amount of usable data• Allows for utilization of short trials

Example Time AND Trials

Joint Entropy • Total entropy between two variables
Its just like before but with a new variable Y and j & m for counting
Also, you take the co‐distribution of x & y rather than just 1 distribution

Joint Entropy • Total entropy between two variables jointprobs = zeros(fd_bins);
for i1=1:fd_binsfor i2=1:fd_binsjointprobs(i1,i2) =
sum(bins1==i1 & bins2==i2);end
end
That creates a joint frequency table showing the probability that a set of value occurs in a particular bin. Cypress Hill is calculating ours right now.
In matlab, you have two nested loops that count the number of times the two signals are in the same bin!

Mutual InformationIndicates shared information between variables
Nice! Now if you we want to calculate mutual information, all we need to do is add entropy for each variable together then subtract the joint entropy!!
Hey yo, Phil. The probability that you will correctly Shannonize this matrix is now 100%
That’s right!MI(X,Y)=H(X)+H(Y)‐H(X,Y)

Mutual InformationAhhh, you can clearly see here that MI is sensitive to linear,log, circular and other relationships between data.Sadly, MI does not discern the type of relationship.

Mutual InformationEntropy can not be negative. As such, a small nof data points can inflate MI scores!

Mutual Information ‐ InflationLuckily the influence can be detectedFor Entropy:entropy_error = inline('(b‐1)./(2.*n.*log(2))');
For Mutual Information:mutinfo_error = inline('(b‐1).^2./(2.*n.*log(2))');
INFLATION ERROR!!??How do we fix such atrocity Ozzy?
I will show you 3 ways!

Mutual InformationTo help correct for inflation:1. Subtract the errors from their respective score (MI‐Mutinfo_Error & H‐entropy_Error)*see pp 3992. Hope the error is constant across conditions3. Determine a null hypothesis and test with permutations
Error is ever‐present Ozzy! In all conditions!DESPAIR!

Mutual InformationUhhh… Ok.Do yourself a favor and make sure your data is clean! If not, ensure that the noise is consistent across conditions. We don’t want spurious biases do we? ‐If you are worried, try using a signal to noise equation. ‐Low pass at 40hz if only interested in time domain‐Analysis of frequency data helps reduce noise!
There is only noise! GIVE ME ALL random frequencies!

See the Noise
Mutual information is decreased by noise
What?

See the Noise‐ Number of samples does not decrease noise
Different than means, because noise does not average out, seen here with the decrease in mutual information relative to optimal scores

Frequency Analysis:Phase and Power
MI Power MI Phase
Cross‐Trial power Spearmans ISPC‐Trials
MI is different from cross correlations, MI must reveal different dynamics!

Frequency Analysis:Phase and Power
MI Power MI Phase
Cross‐Trial power Spearmans ISPC‐Trials
Not necessarily. Since MI does not indicate positive or negative relationships, this is similar to the absolute value.
BRUTAL

Frequency Analysis:Phase and PowerOzzy. This information is BIDIRECTIONAL. How can it describe the direction of effects?
We can do this with “Lagged Mutual Information.” We simply time shift one signal and determine MI for different time delays!

Frequency Analysis:Phase and Power
lagz=‐onecycleidx:onecycleidx;milags=zeros(size(lagz));for li=1:length(lagz)if lagz(li)<0milags(li) =
mutualinformationx(pow1(1:end+lagz(li),:),pow2(‐lagz(li)+1:end,:),30); % reverse sign for negative lagselseif lagz(li)==0milags(li) =
mutualinformationx(pow1,pow2,30); % special case for no lagelseif lagz(li)>0milags(li) =
mutualinformationx(pow1(lagz(li)+1:end,:),pow2(1:end‐lagz(li),:),30);end
end
Remember though, if used on frequency data, the MAXIMUM lag time should be one cycle

Frequency Analysis:Phase and PowerBut Ozzy, directional information isn’t separate from common inputs and the shared history of the variables.
That is a limitation. However, “Transfer Entropy” will actively consider shared history (e.g. in some ways like autoregression).
Panacea PermutationWe can’t run stats on this data! It is not even close to normally distributed!
Permutation can be used! It controls for lots of potential biases, like sample size. It is also useful because it corrects for multiple comparisons!
Also, it changes the data into Z‐scores if *bits* are used!
Frequency Analysis:Phase and Power
Oh ok, so we just shift time randomly in one of the signals a bunch (hundreds).
Yah! Remember though, entropy is independent of the original temporal information for one variable, BUT joint entropy can be influenced!
Sweet! Now we can look at the Z‐scores or run parametric stats on the group data!

Frequency Analysis:Phase and Power
When we report our finding, we should probably include the formulas!
Good idea! The formulas are pretty simple! More to the point though, we should report all our parameters and data features
Also, the number of bins and how we got there. The number of trials and data points too! Signal to noise might be good
Entropy about MI Reduced
• We now have mutual information.
• Good job team!