my experience with ti–ni-based and ti-based shape memory
TRANSCRIPT

SPECIAL ISSUE: A TRIBUTE TO PROF. SHUICHI MIYAZAKI – FROM FUNDAMENTALS TO APPLICATIONS, INVITED REVIEW PAPER
My Experience with Ti–Ni-Based and Ti-Based Shape MemoryAlloys
Shuichi Miyazaki1,2
Published online: 4 October 2017
� ASM International 2017
Abstract The present author has been studying shape
memory alloys including Cu–Al–Ni, Ti–Ni-based, and Ni-
free Ti-based alloys since 1979. This paper reviews the
present author’s research results for the latter two materials
since 1981. The topics on the Ti–Ni-based alloys include
the achievement of superelasticity in Ti–Ni alloys through
understanding of the role of microstructures consisting of
dislocations and precipitates, followed by the contribution
to the development of application market of shape memory
effect and superelasticity, characterization of the R-phase
and monoclinic martensitic transformations, clarification of
the basic characteristics of fatigue properties, development
of sputter-deposited shape memory thin films and fabrica-
tion of prototypes of microactuators utilizing thin films,
development of high temperature shape memory alloys,
and so on. The topics of Ni-free Ti-based shape memory
alloys include the characterization of the orthorhombic
phase martensitic transformation and related shape mem-
ory effect and superelasticity, the effects of texture, omega
phase and adding elements on the martensitic transforma-
tion and shape memory properties, clarification of the
unique effects of oxygen addition to induce non-linear
large elasticity, Invar effect and heating-induced marten-
sitic transformation, and so on.
Keywords Shape memory � Superelasticity �Transformation strain � NiTi\materials � Martensite �Ti-based shape memory alloy � Shape memory films
Introduction
The shape memory effect in Ti–Ni was first reported as
dramatic demonstration of temperature-sensitive dimen-
sional changes in plastically deformed Ti–Ni specimens by
Dr. William J. Buehler’s group of the U.S. Naval Ordnance
Laboratory in 1963 [1], though the shape memory phe-
nomenon was first found as serendipitous discovery at the
laboratory management meeting to review ongoing pro-
jects in 1961 [2].
Since the discovery of the shape memory effect in the
Ti–Ni, this alloy has attracted many scientists and engi-
neers. However, there had been many difficult phenomena
unsolved until 1981 when the present author achieved the
superelasticity in the Ti–Ni by utilizing microstructures
consisting of dislocations and/or precipitates [3, 4] which
were formed by heat treatment at an intermediate temper-
ature region. Table 1 shows research topics on Ti–Ni-based
alloys investigated by the present author since 1980 [3–60].
The mechanism to achieve the superelasticity and quite
stable shape memory effect utilizing such microstructures
of the Ti–Ni was clearly explained in 1982 [4]. By this
finding of the effect of microstructures, the equilibrium
phase diagram of Ti–Ni was needed to be modified so as to
extend the B2 single phase region down to room temper-
ature. After understanding the relationship between
microstructures versus functions and phenomena, the pre-
sent author tried to clarify a variety of aspects of the Ti–Ni-
based alloys. These include basic properties such as
Luders-like deformation [5], the effect of texture on
& Shuichi Miyazaki
1 Division of Materials Science, University of Tsukuba,
Tsukuba, Ibaraki 305-8573, Japan
2 Foundation for Advancement of International Science,
Tsukuba, Ibaraki 305-0821, Japan
123
Shap. Mem. Superelasticity (2017) 3:279–314
https://doi.org/10.1007/s40830-017-0122-3

deformation behavior [6], formation of Ti3Ni4 precipitates
by aging treatment [4, 7–11]. More basic properties were
characterized by using Ti–Ni single crystals which were
made by the strain-anneal method in order to prevent
contamination of oxygen and elements of crucibles. It was
successful in making several large grains of 50 mm length
and 20–30 mm width, with which systematic researches
were possible to clarify the crystal structures of the
martensite [12] and R-phase [19, 20], the crystallography
of the martensitic transformation [13, 14] and R-phase
Table 1 Findings in Ti–Ni-
based alloysCategory Finding Year Reference
A (Basic properties)
Achievement of SE 1981– [3, 4]
Luders-like deformation 1981 [5]
Texture 2000 [6]
Aging treatment, Ti3Ni4, and R-phase 1982– [4, 7–11]
B (Single crystals)
Crystal structure of M 1985 [12]
Crystallography of M transformation 1984– [13, 14]
Orientation dependence of deformation behavior (M) 1983 [15, 16]
Mechanism of SME associated with M 1989 [17, 18]
Crystal structure of R-phase 1988 [19, 20]
Orientation dependence of deformation behavior (R) 1988 [19, 20]
Mechanism of SME associated with R-phase 1988 [19, 20]
C (Fatigue properties)
Thermal cycling 1986 [21]
Stress cycling 1986 [22]
Fatigue life 1988– [23–25]
Crack nucleation 1988 [26]
Crack propagation 1988 [27]
D (Ti–Ni–X ternary alloys)
Ti–Ni–Cu 1997 [28–31]
Ti–Ni–Nb 1992 [32, 33]
Ti–Ni–Fe 1984 [34]
E (High-temperature SMAs)
Ti–Ni–Hf–Nb 2011 [35]
Ti–Ni–Pd–Cu 2012– [36–38]
F (Sputter-deposited thin films)
SME, SE 1992– [39–41]
Microstructure 1996– [42–44]
Ti–Ni–Cu thin films 1996– [45–49]
Ti–Ni–Pd thin films 2004– [50]
Ti–Ni–Zr thin films 2009 [51]
Microactuators 2002– [49, 52,
53]
Microtubes 2008 [54]
Multilayer thin films 2005– [55, 56]
G (Melt-spun ribbons)
Ti–Ni 2007 [57]
Ti–Ni–Pt 2006 [58]
H (Reviews)
TiNi-based alloys 1989 [59]
Thin films 1999 [60]
High-temperature alloys 2015 [38]
M martensite, R Rhombohedral-phase (R-phase)
280 Shap. Mem. Superelasticity (2017) 3:279–314
123

transformation [19, 20], the orientation dependence of
deformation behavior associated with the martensitic
transformation [15, 16] and R-phase transformation
[19, 20], and the mechanisms of shape memory effects due
to both the transformations [17–20]. The Ti–Ni alloys
revealed unique fatigue properties including functional
degradation such as thermal cycling [21] and stress cycling
[22], fatigue life [23–25], fatigue crack nucleation [26], and
fatigue crack propagation [27] which could be understood
systematically by clarifying the effects of the martensitic
transformation start temperature Ms, test temperature, and
alloy composition. The basic properties of Ti–Ni–X ternary
alloys were characterized for Ti–Ni–Cu [28–31], Ti–Ni–
Nb [32, 33], and Ti–Ni–Fe [34]. High temperature shape
memory alloys such as Ti–Ni–Hf–Nb [35] and Ti–Ni–Pd–
Cu [36–38] were developed; these alloys presented
deformable nature and stability at high temperatures,
respectively. Due to keen demands for the applications of
MEMS (Micro Electro Mechanical Systems), Ti–Ni thin
films with micron meter thickness were fabricated by
sputter-deposition method. These thin films revealed per-
fect shape memory effect and superelasticity [39–41] and
specific microstructures were found useful for achieving
stable shape memory behavior [42–44]. Ti–Ni-X ternary
alloy thin films were also developed to reveal narrow stress
hysteresis in Ti–Ni–Cu [45–49] and high transformation
temperatures in Ti–Ni–Pd [52, 50] and Ti–Ni–Zr [51].
Diaphragm-type microactuators were fabricated utilizing
these thin films and they revealed fast actuation with even
100 Hz by the joule heating method [49, 53]. Ti–Ni
superelastic microtubes were also fabricated by the sputter-
deposition method [54]. Multilayer thin films consisting of
sputter-deposited Ni and Ti thin layers were successfully
alloyed by following heat treatment revealing shape
memory effect and specific microstructures [55, 56]. Rib-
bons of Ti–Ni and Ti–Ni–Pt with 10–30 lm thickness were
also fabricated by the melt-spinning method [57, 58].
Reviews on Ti–Ni [59], sputter-deposited thin films [60],
and high-temperature shape memory alloys [38] were
published to summarize some of the above results.
Since the success of applications utilizing Ti–Ni-based
shape memory and superelastic alloys in medical fields,
developing Ni-free Ti-based shape memory and supere-
lastic alloys was considered to be important and attractive
research topics. The present author’s group has investi-
gated and developed such Ni-free Ti-based alloys since
2002 as shown in Table 2 [61–102]. The developed Ti-
based alloys which reveal shape memory effect and
superelasticity are Ti–Nb binary alloys [61–65], many
ternary alloys such as Ti–Nb–Al [66–70], Ti–Mo–Ga
[71, 72], Ti–Nb–Ga [73], Ti–Nb–O [74], Ti–Nb–Zr
[75, 76, 95, 102], Ti–Nb–Mo [77, 78], and Ti–Nb–Ta
[79, 80, 95, 102] and quaternary alloys [84, 93, 94]. Basics
of crystallography and microstructures were characterized,
including the martensitic transformation
[62, 65, 69, 80, 81], textures [68, 80], microstructures
[63, 65, 81, 82], and x phase [62, 63]. Unique properties
achieved by the addition of interstitial elements such as O
[83–88], N [89, 90] and B [91] were characterized. Such
unique properties are non-linear and large elastic defor-
mation [83, 92], Invar effect [84, 86, 88], large shape
recovery [93–95], cyclic deformation [64, 94], unique
twinning systems in metastable b phase [96], and heating-
induced martensitic transformation [85]. Attractive high-
temperature shape memory alloys were developed such as
Ti–Ta [97, 98], Ti–Ta–Al [99], and Ti–Ta–Sn [100],
because they do not have any problems of brittleness.
Review papers including some of the above topics were
published for Ti–Nb binary alloys [92, 101] and Ti–Nb–(Zr
or Ta) ternary alloys [95, 102].
This paper is a short summery instead of a full review,
presenting a short historical flow of the present author’s
researches using some of the above results and their con-
tribution to the basic understanding of Ti–Ni-based and Ni-
free Ti-based shape memory alloys and the great progress
of the applications using shape memory effect and
superelasticity on the market. Thus, the readers may refer
to each of the references about the details of the experi-
mental information and results of each topic if necessary.
Ti–Ni-Based Alloys
Achievement of Superelasticity in Ti–Ni
The present author started studying Ti–Ni alloys in 1980.
The commonly used heat treatment condition for achieving
martensitic transformation was solution treatment followed
by quenching into water in order not to permit phase sep-
aration and diffusion of atoms during cooling. Such a
typical method was first applied for steels and also neces-
sary for shape memory alloys which reveal the martensitic
transformation, because the single phase region of the
parent phase for steels and shape memory alloys existed
only at a high-temperature region in their equilibrium
phase diagrams.
There had been many difficult phenomena to be
understood for the Ti–Ni, such as the control and roles of
microstructures, involvement of unstable phase transfor-
mation which appears sometimes but not always and was
known later as the R-phase (Rhombohedral-phase), etc.
The author could not obtain any acceptable established
experimental methods for studying Ti–Ni alloys from
published information. The present author started investi-
gating the effect of heat treatment on the properties of Ti–
Ni alloys, considering that even the equilibrium phase
Shap. Mem. Superelasticity (2017) 3:279–314 281
123

diagram was not perfect and Ti is easily contaminated by
oxygen.
The author applied solution treatment followed by
cooling in a furnace for a Ni-rich Ti–50.6 at.%Ni [3]. (This
heat treatment condition was misdescribed as rapidly
quenched into iced water in Ref. [3] due to some confusion
at that time.) The specimen was tensile tested at various
temperatures, revealing quite stable shape memory effect
and superelasticity, the latter of which had never been
observed in Ti–Ni alloys. It was lucky for the author to use
a Ni-rich Ti–50.6 at.%Ni instead of an equiatomic Ti–Ni,
because the latter would not reveal superelasticity after
solution treatment. The author wanted to know what hap-
pened in the specimen. Then, a variety of heat treatment
conditions were applied to both alloys of near-equiatomic
Ti-49.8 at.%Ni and Ni-rich Ti–50.6 at.%Ni [4]. The Ti-
49.8 at.%Ni revealed stable shape memory effect and
superelasticity only when annealed at intermediate tem-
peratures such as 673 K after cold drawing. However, it
revealed neither perfect shape memory effect nor supere-
lasticity if solution treated at 1273 K. Ti–50.6 at.%Ni
revealed both stable shape memory effect and superelas-
ticity when annealed at 673 K after cold drawing or solu-
tion treated at 1273 K followed by aging treatment at
673 K.
Typical microstructures of such specimens prepared by
cold-rolling are shown in Figs. 1 and 2. Figure 1a shows
that the as-rolled Ti-49.8 at.%Ni reveals rolling-induced
many dislocations in severely strained martensite and
parent phases. By annealing the specimen at 673 K, a high
density of dislocations still existed but the strained condi-
tion was removed as shown in Fig. 1b. Annealing at 773
Table 2 Findings in Ti-based
alloysCategory Finding Year Reference
A (Alloy development)
Ti–Nb 2004– [61–65]
Ti–Nb–Al 2004– [66–70]
Ti–Mo–Ga 2004– [71, 72]
Ti–Nb–Ga 2004 [73]
Ti–Nb–O 2005 [74]
Ti–Nb–Zr 2005– [75, 76]
Ti–Nb–Mo 2010– [77, 78]
Ti–Nb–Ta 2006 [79, 80]
B (Crystallography and microstructure)
Martensitic transformation 2006– [62, 65, 69, 80, 81]
Texture 2006 [68, 80]
Microstructure 2008– [63, 65, 81, 82]
x phase 2006– [62, 63]
C (Interstitial element addition)
O 2011– [83–88]
N 2008– [89, 90]
B 2015 [91]
D (Unique properties)
Non-linear elastic deformation 2011– [83, 92]
Invar effect 2013– [84, 86, 88]
Large shape recovery 2015 [93–95]
Cyclic deformation 2009– [64, 94]
Twinning deformation 2014 [96]
Heating-induced martensitic transformation 2014 [85]
E (High-temperature SMA)
Ti–Ta 2009 [97, 98]
Ti–Ta–Al 2011 [99]
Ti–Ta–Sn 2011 [100]
F (Reviews)
TiNb-based 2006– [92, 101]
Ti–Nb–Zr, Ti–Nb–Ta 2015– [95, 102]
282 Shap. Mem. Superelasticity (2017) 3:279–314
123

and 873 K revealed recrystallization and grain growth as
shown in Figs. 1c, d, respectively. The Ti-49.8 at.%Ni
annealed at 673 K revealed superelasticity as well as
stable shape memory effect. The Ti–50.6 at.%Ni revealed
Ti3Ni4 precipitates when aging treated at 673 and 773 K
after solution treatment at 1273 K as shown in Fig. 2a, b,
respectively. The alloy composition of the precipitates was
not known at that time and later determined by other
researches, but it was clear even at that time that the pre-
cipitates were Ni-rich because such precipitates appeared
only in Ni-rich Ti–Ni but not in an equiatomic Ti–Ni.
When the annealing temperature was 873 K, there was no
precipitate any more as shown in Fig. 2c.
The Ti–50.6 at.%Ni aging treated at 673 K revealed
stable shape memory effect and superelasticity due to the
formation of the fine Ti3Ni4 precipitates. Then, the mech-
anism of achieving stable shape memory effect and
superelasticity was clarified such that fine microstructures
consisting of dislocations or fine Ti3Ni4 precipitates play a
role of increasing the critical stress for plastic deformation.
This finding was followed by further improvement of shape
memory effect and superelasticity in Ti–50.6 at.%Ni which
was annealed at 673 K without preceding solution treat-
ment, because the specimen included both a high density of
dislocations and fine Ti3Ni4 precipitates. Such properties
revealed in the specimen are shown in Fig. 3, where almost
perfect superelasticity was observed even after subjected to
800 MPa. After the findings of the above phenomena, it
was natural to reconsider the existing equilibrium phase
diagram of Ti–Ni in such a way that there must be a single
phase region of the B2 parent phase until down to near
room temperature and a metastable phase of Ni-rich Ti–Ni
phase at an intermediate temperature region, which is
shown in Fig. 4.
Another basic property of Luders-like deformation was
observed in a Ti–Ni alloy [5], and texture dependence of
deformation behavior was investigated in Ti–Ni rolled
plates [6]. Detailed investigation of Ti3Ni4 precipitates was
conducted in Ni-rich Ti–Ni alloys by changing aging and
annealing conditions [4, 7–11].
Development of Application Market of Ti–Ni
The above thermomechanical treatment method to achieve
superelasticity as well as quite stable shape memory effect
in Ti–Ni was filed for a patent in Japan in 1982 and
patented in 1990 [103]. After this invention, the history of
Ti–Ni moved quickly as shown in Fig. 5. The shape
memory effect of Ti–Ni was found in USA in 1961 [1, 2],
while the superelasticity of Ti–Ni was achieved in Japan in
Fig. 1 Transmission electron micrographs of Ti-49.8 at.%Ni annealed at various temperatures. a as-rolled, b 673 K, c 773 K, and d 873 K
Shap. Mem. Superelasticity (2017) 3:279–314 283
123

1981 [3, 4]. After understanding the relationship between
microstructures versus functions and phenomena in Ti–Ni,
the basic characteristics including many other unknown
features of Ti–Ni had been clarified during the following
20 years. By the control of microstructures and composi-
tions, the monoclinic martensitic transformation and the
R-phase transformation could be separated to be investi-
gated independently, and fatigue properties could be sys-
tematically understood as a function of transformation
temperature, test temperature, and alloy composition.
Meantime, many useful applications using superelas-
ticity in addition to shape memory effect appeared on the
market. Materials manufacturing companies started pro-
ducing and selling Ti–Ni devices using the above-men-
tioned thermomechanical treatment as shown in Figs. 6 and
7, and many users could obtain such devices for their own
applications. In Japan, many people became to know shape
memory alloys through mass-communications such as
newspapers, television, magazines, and books since 1981,
then a variety of application ideas valid or invalid when
considering the properties of Ti–Ni appeared as shown in
Fig. 8, which shows the number of patents filed for
applications and materials in Japan since 1978. The number
increased drastically from 1981. These numbers are prob-
ably 70% of those of the world; thus, it is equivalent to the
world tendency of filing patents relating shape memory
alloys. The number of patents filed every year in Japan
seems keeping 200–300 even at present.
Figure 9 shows some examples of applications appeared
on the market as a function of year. The patents of new
Fig. 2 Transmission electron
micrographs of Ti–50.6 at.%Ni
solution treated followed by
aging at various temperatures.
a 673 K, b 773 K, and c 873 K
284 Shap. Mem. Superelasticity (2017) 3:279–314
123

materials filed by the present author are also shown. A very
famous application of pipe coupling can be seen in an early
stage of 1970s. The application demanded only one time
shape recovery and required neither perfect shape recovery
nor many times cycling use; thus, the application was
successful even though the application could not use the
perfect shape recovery. However, many other successful
Fig. 3 Stress-strain curves measured at various temperatures in Ti–
50.6 at.%Ni annealed at 673 K for 3.6 ks, revealing stable shape
memory effect and superelasticity
Fig. 4 An equilibrium phase diagram of Ti–Ni
Fig. 5 A brief history of the development and applications of Ti–Ni
Fig. 6 Ti–Ni shape memory devices
Fig. 7 Shape memory alloy actuators
Fig. 8 Number of application patents filed in Japan
Shap. Mem. Superelasticity (2017) 3:279–314 285
123

applications utilizing shape memory effect required perfect
shape recovery for many times. These applications
appeared from 1981 when the thermomechanical treatment
method was invented. Many applications also appeared
utilizing superelasticity since 1981. Without the invention
of the thermomechanical treatment achieving the supere-
lasticity, all these applications could not be possible to
appear. The ratio between the number of applications using
superelasticity and that of applications using shape mem-
ory effect will be 80–20. Since eighty percent of the
applications utilizing superelasticity belong to medical
fields, it seems that much material is used for medical
applications. Figure 10 shows a photograph of a confer-
ence circular of SMST in 2005, revealing many medical
stents using superelasticity and each stent being supplied
by each corresponding company, indicating the great
advantage of superelasticity for medical applications. By
the present more than 10 years later since then, the stent
market has grown intensively. A book on biomedical shape
memory alloys was published due to the demand of
information of medical applications of shape memory
alloys [104]. Another book on technologies and applica-
tions of shape memory alloys was also published due to
requests from many people in engineering and medical
fields [105].
Martensitic Transformation
There are two types of martensites depending on alloy
composition. One type is the monoclinic structure B19’
which appears in Ti–Ni [12], while another type of
orthorhombic structure B19 appears in Ti–Ni–Cu [31].
Depending on the type of crystal structures, there are 12
lattice correspondences between B2 and monoclinic
martensite [13, 14], while 6 lattice correspondences
between B2 and orthorhombic martensite. Accordingly,
there are 24 habit plane variants for the monoclinic
martensite, while 12 for the orthorhombic martensite. By
tensile testing single crystals of Ti–Ni with various crystal
directions for tensile axes, the orientation dependence of
recoverable strain could be measured as shown in Fig. 11
[15]. Habit planes were also measured in the tensile-tested
single crystals [13, 14]. The stress–strain curves at various
temperatures were also investigated to show shape memory
and superelastic behavior in single crystals [16].
Using a single crystal of aging treated Ti–Ni, the spec-
imen was tensile loaded to reveal stress-induced martensite
variants which could be indexed correctly because the
orientation of the single crystal was determined by X-ray
diffraction as shown in Fig. 12a [17]. Following cooling
induced the self-accommodation morphologies of triangles
as shown by a circle in Fig. 12b. The triangle morphology
consists of three habit plane variants on the photograph as
shown in Fig. 13, but probably of four habit plane variants
in three dimensionally [17]. After cooling the specimen
down to below Mf temperature, it was tensile loaded to
observe martensite variants reorientation to reach the
maximum recoverable strain. Then, it was heated to
Fig. 9 History showing materials development and applications
using shape memory effect and superelasticity
Fig. 10 Various stents made of Ti–Ni superelastic alloys
286 Shap. Mem. Superelasticity (2017) 3:279–314
123

observe the reverse martensitic transformation from the
martensite to the parent B2 through the R-phase [18]. The
shape memory mechanism was clarified by the observation.
R-phase Transformation
The R-phase was curious and difficult to understand since
the finding of Ti–Ni until 1981, i.e., appearing at room
temperature but disappearing by the transmission electron
microscope observation due to heating by electron beams.
Such curious phenomena appeared due to the narrow
transformation temperature hysteresis of only several K.
However, the R-phase transformation could be clearly
separated from the martensitic transformation by control-
ling microstructures consisting of dislocations and precip-
itates since 1981.
Figure 14 shows the B2 parent phase in a solution-
treated Ti–50.6 at.%Ni. A near-equiatomic Ti-49.8 at.%Ni
shows the R-phase in a microstructure consisting of a high
density of dislocations as shown in Fig. 15. The Ti–
50.6 at.%Ni reveals the R-phase in a microstructure con-
sisting of fine Ti3Ni4 precipitates after solution treatment
followed by aging treatment at 673 K as shown in Fig. 16.
Figure 17 also shows the R-phase in a microstructure
consisting of dislocations and fine precipitates in an
annealed Ti–50.6 at.%Ni. From these observations [11]
and further investigation on Ti–Ni–X ternary alloys [34], it
was concluded that the R-phase does not appear when the
R-phase transformation start temperature TR is lower than
the martensitic transformation start temperature Ms (Ms(a))
as shown in Fig. 18. However, when TR is higher than Ms
such as Ms(b) and Ms(c), the R-phase transformation
appears prior to the martensitic transformation upon cool-
ing. This can be achieved by using some of the following
factors which decrease Ms effectively more than TR.
1) Ni-content (solid solution)
2) Aging (Ti3Ni4 precipitates)
3) Cold working ? annealing (dislocations)
4) Third element addition (Fe, Al etc.) (solid solution)
5) Thermal cycling (dislocations)
Among these factors, the first one of increasing Ni-
content cannot reveal the R-phase transformation, because
increasing Ni-content also decreases TR effectively as Ms in
a solid-solution condition; thus, TR cannot be higher than
Ms. The fourth factor of adding the third element decreases
Ms more effectively than TR, thus revealing the R-phase
transformation upon cooling in a solid-solution condition.
Other factors (2), (3), and (5) form microstructures con-
sisting of dislocations and/or Ti3Ni4 precipitates which
suppress the martensitic transformation more effectively
than the R-phase transformation, thus revealing the
R-phase transformation. Using the above factors (2)–(5), it
became easy to investigate the R-phase transformation by
separating from the martensitic transformation. Such
investigations clarified the basic characteristics of the
Fig. 11 Orientation dependence of the transformation strain calcu-
lated and experimentally measured in Ti–Ni single crystals
Fig. 12 Optical micrograph showing a stress-induced martensite
variants and b the formation of the self-accommodation morphology
of martensite variants
Shap. Mem. Superelasticity (2017) 3:279–314 287
123

R-phase transformation and related deformation behavior
as follows.
Since the R-phase transformation is essentially same as
the martensitic transformation which is the crystal structure
change without being accompanied by diffusion, it causes
the shape memory effect and superelastic deformation to
occur. The two-stage deformation behavior occurs when
both the two phase transformations are involved in a
specimen [4, 20]. Such deformation behavior as a function
of test temperature is schematically shown in Fig. 19 [4].
The lattice correspondence between the B2 parent phase
and the R-phase is shown in Fig. 20 [20]. The length of the
three axes of the R-phase are same as that of the B2, while
the rhombohedral angle a decreases with decreasing tem-
perature from TR. The angle a versus temperature rela-
tionship measured by X-ray diffraction is shown in Fig. 21
[20]. The recoverable strain due to the R-phase
transformation can be calculated using the data of Fig. 21,
resulting in the contour lines revealing the orientation
dependence of the recoverable strain as shown in Fig. 22.
The corresponding experimental data were obtained by
tensile testing Ti–Ni single crystals with various tensile
orientations, and the results are also shown by closed cir-
cles in Fig. 22. Both the experimental data and the calcu-
lated data are very much consistent.
The self-accommodation morphology appeared in an
aging treated Ni-rich Ti–Ni single crystal as shown in
Fig. 23a [19]. Four types of traces can be seen, represent-
ing four twinning planes of the R-phase. The self-accom-
modation morphology was analyzed carefully, resulting in
the morphology consisting of four R-phase variants which
make the net strain zero as shown in Fig. 24. This some-
how complex morphology of self-accommodation is
formed by the effect of stress distribution around Ti3Ni4
Fig. 13 Schematic
figures showing a a triangular
morphology and
b corresponding to twinned
microstructures of three variants
Fig. 14 A transmission
electron micrograph showing
B2 in a solution-treated Ti–
50.6 at.%Ni
288 Shap. Mem. Superelasticity (2017) 3:279–314
123

precipitates. By applying a small force, the self-accom-
modation morphology easily changes to another morphol-
ogy clearly revealing two twinning planes of (011) and
(100) as shown in Fig. 23b, where four R-phase variants
coexist. By further tensile loading, twinning planes move
and disappear resulting in the most favorable R-phase
variant formed, corresponding to the maximum recoverable
strain condition. After unloading followed by heating, the
specimen revealed shape memory effect by the reverse
R-phase transformation [19, 20]. It was reported later by
other researchers that a simpler morphology of self-ac-
commodation consisting of four R-phase variants appeared
in a solution-treated Ti–Ni–Fe, since fine precipitates were
not included.
Fatigue Properties
Fatigue properties of shape memory alloys include func-
tional degradation and fatigue behavior. The functional
degradation appears as the changes in the transformation
temperatures and deformation behavior. Thermal cycling
changes Ms in the solution-treated Ti–49.8 at.%Ni as
shown in Fig. 25a [21], the Ms being measured by the
electrical resistance versus temperature curves. However,
when the same alloy is annealed at 673 K without solution
treatment after cold-rolling, the Ms does not change even
after 100 thermal cycling as shown in Fig. 25b. The former
specimen induced dislocations during the forward
martensitic transformation and its reverse transformation
upon cooling and heating, resulting in the formation of
Fig. 15 A transmission
electron micrograph showing
the R-phase and a high density
of dislocations in Ti–
49.8 at.%Ni annealed at 673 K
Fig. 16 A transmission
electron micrograph showing
the R-phase and fine precipitates
in Ti–50.6 at.%Ni aging treated
after solution treatment
Shap. Mem. Superelasticity (2017) 3:279–314 289
123

dislocation barriers against the martensitic transformation
to decrease Ms. In the latter case of the annealed speci-
mens, a stable microstructure consisting of a high density
of dislocations exists. Such a dislocation microstructure is
so stable that introduction of further dislocations is sup-
pressed during the forward and reverse transformations,
resulting in less change in Ms as shown in Fig. 25b. Similar
functional stability was achieved both in Ti–50.6 at.%Ni
and Ti–51.6 at.%Ni which were aging treated at 673 K
after solid solution treatment at 1273 K as shown in
Fig. 26. Both the specimens included fine Ti3Ni4 precipi-
tates, which suppressed introduction of dislocations during
thermal cycling due to the precipitation hardening
mechanism.
Stable superelastic deformation behavior appeared in
Ti–Ni alloys which include a high density of dislocations
and/or fine Ti3Ni4 precipitates as shown in Fig. 27 [22].
Stress cycling exerts severe effects on the microstructure,
hence the critical stress for inducing the martensitic
transformation decreases with increasing the number of
stress cycling as shown in Fig. 27a–d. This indicates that
the effect of stress cycling is more severe than that of
thermal cycling. However, such stress cycling effect was
suppressed by the training effect as shown in Fig. 27e,
where stable superelastic deformation behavior appeared in
the specimen which was 100 times stress cycled prior to the
experiments in Fig. 27e.
Figure 28 shows the strain amplitude (De) versus fatigue
life (Nf) curves measured by a rotary bending machine at
various temperatures [25]. Each De–Nf curve is divided
into three lines which correspond to cyclic deformation
below the proportional limit strain, between the propor-
tional limit and elastic limit strains and above the elastic
limit strain, where the specimens were rotary bending
Fig. 17 A transmission
electron micrograph showing
the R-phase, dislocations and
precipitates in an annealed Ti–
50.6 at.%Ni without solution
treatment
Fig. 18 A schematic figure explaining the appearance of the R-phase
transformation by depressing the martensitic transformation
Fig. 19 Schematic stress–strain curves at various temperatures
showing the two-stage transformation
290 Shap. Mem. Superelasticity (2017) 3:279–314
123

cycled by pure elastic deformation, macroscopically elastic
but locally martensitic transformation and macroscopically
martensitic transformation, respectively. The overall fati-
gue life at each temperature increases with decreasing test
temperature.
Figure 29 shows the stress versus fatigue life curves
measured by tensile loading and unloading fatigue tests at
three test temperatures during controlling the applied
maximum stress. The fatigue life was also measured during
controlling the applied maximum strain, and the corre-
sponding stress versus fatigue life curve is also shown in
Fig. 29. Each of the stress versus fatigue life curve is
divided into two regions at around the critical stress (rM)
for inducing the martensitic transformation. The deforma-
tion mode above rM is the stress-induced martensitic
transformation, while that below rM is the elastic defor-
mation. The fatigue life below rM increases with increasing
test temperature; however, the fatigue life above rM is
almost similar irrespective of test temperature.
Fig. 20 Crystal structures of
a B2 phase and b R-phase
Fig. 21 Temperature dependence of the rhombohedral angle of the
R-phase, TR being the R-phase transformation start temperature
Fig. 22 Orientation dependence of the R-phase transformation strain
calculated and experimentally measured in Ti–Ni single crystals, the
strains being the values at (TR - 35) K
Fig. 23 a A self-accommodation morphology of the R-phase and
b twinned morphology after applying a small force to (a)
Shap. Mem. Superelasticity (2017) 3:279–314 291
123

Figure 30 shows the fracture surface of the annealed Ti–
50.8 at.%Ni which was prepared by a high-frequency
vacuum induction melting method using a carbon crucible,
where a TiC inclusion was found at the crack nucleation
site as shown in Fig. 30a and the magnification is shown in
Fig. 30b. This suggests that pure Ti–Ni alloys are neces-
sary for not supplying crack nucleation sites like TiC
inclusions. Then, pure Ti–Ni specimens with similar Ni-
contents were prepared by the electron beam melting
method. However, the stress versus fatigue life curves of
the specimens prepared by both the melting methods were
similar; thus, the fatigue life was not improved by purifi-
cation. The reason of this is explained as follows.
Figure 31 shows that a fatigue crack nucleation site was
a grain boundary where stress concentration occurred due
to the strain misfit along the grain boundary after forming
different martensite variants in each of the grains con-
nected at the grain boundary. After the crack nucleation
along the grain boundary, the crack propagates transgran-
ularly into neighboring grains as shown in Fig. 31. This
result indicates that a fatigue crack nucleates at a TiC
inclusion for a specimen prepared by the high-frequency
vacuum induction melting method using a carbon crucible
or at a grain boundary for a specimen without TiC inclu-
sions. Both crack nucleation sites provide similar stress
concentration so that the fatigue life seems not to be
improved by purification.
The fatigue crack propagation is also an important
phenomenon. Figure 32 shows the fatigue crack propaga-
tion rate (Da/DN) as a function of stress intensity factor
(DK) measured at various test temperatures [27]. The crack
propagation rate is lowest when tested at 253 K which is
below Ms, while it increases with increasing test tempera-
ture above Ms up to 333 K, because the critical stress for
inducing the martensitic transformation increases with
increasing test temperature. It becomes constant irrespec-
tive of test temperature when the test temperature is higher
than 333 K, where the critical stress for inducing the
martensitic transformation is so high that the martensitic
transformation is not effective to suppress the crack prop-
agation by decreasing the stress concentration at the crack
tip or conventional plastic deformation occurs. The crack
propagation rates measured at above 333 K are similar to
that predicted by the empirical equation for conventional
Fig. 24 a A self-accommodation morphology of the R-phase and
b the corresponding morphology consisting of four R-phase variants
Fig. 25 Effect of thermal cycling on Ms measured by the electrical
resistance versus temperature curve of a Ti–49.8 at.%Ni aging treated
following solution treatment and b Ti–49.8 at.%Ni annealed without
solution treatment
292 Shap. Mem. Superelasticity (2017) 3:279–314
123

metals and alloys, which do not reveal the martensitic
transformation (Da/DN = 5.1 9 106 (DK/E)3.5), using
DK and Young’s modulus E of Ti–Ni as shown by the
dashed line in Fig. 32.
Ti–Ni–X Alloys
The Ti–Ni–Cu alloys showed interesting transformation
and deformation behavior. It was found that the stress
hysteresis was affected by alloy composition [28]. The Ti–
40Ni–10Cu (at.%) revealed superelastic deformation with
low stress hysteresis of 100 MPa which was less than a half
of that of the binary Ti–50.6 at.%Ni as shown in Fig. 33
[28]. The superelastic deformation was stable against
cyclic deformation due to the small stress hysteresis.
The transformation temperatures and crystal structures
of Ti–(50 - X)Ni–XCu (at.%) were investigated within a
range of X = 0–13 at.% as shown in Fig. 34 [29, 30]. The
martensitic transformation start temperature Ms decreases
with increasing Cu content until 7.5 at.%, then decreases
rapidly with further increasing Cu content. The martensite
Fig. 26 Effect of thermal cycling on Ms measured by the electrical
resistance versus temperature curve of a Ti–50.6 at.%Ni and b Ti–
51.6 at.%Ni aging treated following solution treatment
Fig. 27 Cyclic superelastic deformation in Ti–Ni with different alloy
compositions and different heat treatment conditions
Fig. 28 Strain amplitude (De)–fatigue life (Nf) curves of Ti–Ni wires
measured at various temperatures by a rotary bending fatigue tester
Shap. Mem. Superelasticity (2017) 3:279–314 293
123

appeared at the Ms is the monoclinic B19’ martensite.
Another martensitic transformation, orthorhombic B19
martensite, appears prior to the B19’ martensitic transfor-
mation when Cu content is higher than 7.5 at.%. This
means that two-stage martensitic transformation appears
when Cu content is higher than 7.5 at.%. The B19
martensitic transformation is characterized by a small
temperature hysteresis, causing the small stress hysteresis
of the superelastic deformation as shown in Fig. 33. The
effect of Ti content on the transformation and deformation
behavior was also systematically investigated in XTi–
(92 - X)Ni–8Cu (at.%) alloys [31].
Ti–Ni–Nb alloys reveal a wide temperature hysteresis
which is useful in applying for pipe coupling applications
for jet airplanes [32, 33], because they are used at tem-
perature of 223 K during flight, while the temperature is
around 293 K during staying at the ground. The Ms must be
lower than 223 K, and the reverse martensitic transfor-
mation finish temperature Af must be higher than around
293 K for safe usage and easy setting.
The mechanical behavior associated with the R-phase
transformation was first clarified in a Ti–47Ni–3Fe (at.%)
alloy [34]. It was found that the superelasticity appeared
associated with the R-phase transformation. Two-stage
deformation behavior was clarified depending on test
temperature. In case of a binary Ti–Ni alloy, two-stage
superelastic behavior was also observed as shown in
Fig. 19 [11].
High-Temperature SMAs
High-temperature shape memory alloys have been exten-
sively investigated because of keen demands for appli-
cations used at temperatures above 373 K (100 �C).
Figure 35 shows some examples of applications utilizing
shape memory effect appeared on the market. All these
applications have been only used at temperatures between
room temperature and 80 �C, because the Ti–Ni alloys
supplied by material manufacturers do not show the
reverse transformation above 80 �C. There have been
developed many high-temperature shape memory alloys
such as Ti–Ni–Hf, Ti–Ni–Zr, and Ti–Ni–Pd. However,
these alloys are not ductile enough, so that the develop-
ment of deformable high-temperature shape memory
alloys has been demanded. One of such deformable high-
temperature shape memory alloys which were developed
by the present author’s group is (Ti–49.5Ni–15Hf)100-X–
XNb (X = 0–20 at.%) alloy. The ternary Ti–Ni–Hf alloy
is not ductile as shown in Fig. 36, where the Ti–Ni–Hf
Fig. 29 Effect of test temperature on fatigue life of Ti–50.8 at.%Ni
which was annealed at 673 K
Fig. 30 Scanning electron
micrographs of a fatigue-
fractured-surface of Ti–
50.8 at.%Ni which was solution
treated at 1273 K
294 Shap. Mem. Superelasticity (2017) 3:279–314
123

reveals only 20% cold workability. However, the cold
workability of Ti–Ni–Hf–Nb quaternary alloys increases
with increasing Nb content, revealing more than 60%
when Nb content exceeds 10%. The reason why the
quaternary alloys become ductile is shown in Fig. 37
which is a scanning electron images observed in back-
scattered electron mode. With increasing Nb content, a
lamellar microstructure consisting of B2 and Nb phases
appears and increases its volume fraction. This
microstructure is formed by a eutectic solidification. The
Ti–Ni–Hf–15 at.%Nb reveals a full eutectic phase
Fig. 31 A scanning electron micrograph showing a fatigue crack
nucleation along a grain boundary
Fig. 32 Effect of test temperature on the fatigue crack propagation
rate (Da/DN) versus stress intensity factor (DK)
Fig. 33 Comparison between the cyclic superelastic deformation
behaviors in Ti–50.6 at.%Ni and Ti–40Ni–10Cu (at.%) which were
annealed at 673 K
Fig. 34 A phase diagram of Ti–(50 - X)Ni–XCu (X = 0–13) (at.%)
showing the effect of Cu content on transformation temperatures
Fig. 35 Temperature range covering application examples on the
market
Shap. Mem. Superelasticity (2017) 3:279–314 295
123

microstructure. The B2 phase causes the shape memory
effect to occur, while the Nb phase deforms plastically
during cold working. Similar results were obtained in the
Ti–Ni–Zr–Nb alloys.
The Ti–Ni–Pd–Cu alloy was also developed as to reveal
stable shape memory effect at temperatures above 100 �C[36, 37]. The stability at high temperatures was achieved
by precipitation hardening. Two types of precipitates,
TiPdCu and Ti2Pd types, were formed in Ti–50Ni–15Pd–
10Cu [36]. These precipitates are stable even at 873 K,
where dislocations disappear due to recrystallization. A
review paper on the Ti–Ni–Pd–Cu is available [38].
Beta Ti-based high-temperature shape memory alloys
such as Ti–Ta, Ti–Ta–Al, and Ti–Ta–Sn were also devel-
oped [97–100], and they will be described later in one
section of the next chapter for Ni-free Ti-based alloys.
Sputter-Deposited SMA Thin Films
Micro-electro-mechanical systems (MEMS) such as
microvalves, micropumps, and micromachines require
microactuators with high power and high frequency. Shape
memory alloys were considered to be useful for such
purposes. Thus, the sputter-deposition technique could be
the first candidate for fabricating thin film shape memory
alloys. However, it was not easy to make perfect shape
memory effect in sputter-deposited thin films, because the
Fig. 36 Effect of Nb content on the cold workability of Ti–49.5Ni–
15Hf–Nb alloys. Images of cold-rolled specimens are included in the
lower side (Ti–49.5Ni–15Hf) and at the center [(Ti–49.5Ni–15Hf)–
15Nb]
Fig. 37 Back-scattered
scanning electron images of
(Ti–49.5Ni–15Hf)–(0–20)Nb
alloys. a Ti–49.5Ni–15Hf,
b (Ti–49.5Ni–15Hf)–1Nb,
c (Ti–49.5Ni–15Hf)–5Nb,
d (Ti–49.5Ni–15Hf)–10Nb,
e (Ti–49.5Ni–15Hf)–15Nb, and
f (Ti–49.5Ni–15Hf)–20Nb
296 Shap. Mem. Superelasticity (2017) 3:279–314
123

sputter-deposition technique had not been used for making
thin film shape memory alloys successfully. The present
author’s group started to develop sputter-deposited thin
film shape memory alloys since 1990, and succeeded in
achieving perfect shape memory effect and superelasticity
[39–41, 60].
The sputter-deposited thin films revealed unique pre-
cipitates which are formed in Ti-rich Ti–Ni thin films.
After sputter-deposition at room temperature, the films are
always amorphous. Heat treatment for crystallization is
needed to make thin film shape memory alloys. Figure 38
shows such precipitates formed in a Ti–48.2 at.%Ni thin
film. Plate-shaped precipitates are observed aligning on
{100} planes of B2 phase [42, 43]. These precipitates are
useful for increasing strength so as to increase the stability
of shape recovery. Grain size refining is also useful in
obtaining stable shape recovery [44].
In order to achieve actuation of high frequency, it is
necessary to increase the transformation temperatures or
decrease the transformation temperature hysteresis when
the actuator is operated by joule heating method without
any cooling devices: the former method is effective for
increasing cooling rate by operating it at high temperatures,
while the latter is effective to narrowing the temperature
variation range for actuation so as to increase the fre-
quency. Ti–Ni–Pd [50] and Ti–Ni–Zr [51] thin films were
developed to increase the transformation temperatures,
while Ti–Ni–Cu [48, 49] thin films were fabricated for
narrowing the temperature variation necessary for
actuation.
Fabrication of Microactuators
Prototypes of microactuators were fabricated utilizing Ti–
Ni, Ti–Ni–Pd, and Ti–Ni–Cu thin films [48, 49, 53]. An
example of such microactuators is shown schematically in
Fig. 39, where a thin film (Ti–Ni, Ti–Ni–Pd, or Ti–Ni–Cu)
of 2 lm thickness is sputter-deposited on a SiO2 layer of
1 lm thickness. During heating and cooling, the dia-
phragm-type microactuator changed the shape to flat and
convex, respectively. An example of the movement of such
microactuator is shown in Fig. 40 [53]. The duty ratio of
heating and cooling (switching on and off electrical current)
is 3:97, because longer cooling time is necessary to wait the
temperature decreasing down without any specific cooling
device and shorter heating time is enough for increasing
temperature because of high heating rate. Figure 41 shows
that the maximum height of the diaphragm of the
microactuator as a function of frequency. The Ti–Ni binary
alloy thin film actuator shows that the maximum height
suddenly decreases with increasing frequency. However,
the Ti–Ni–Pd ternary alloy thin film actuator reveals effi-
cient movement because 80% of the maximum height at
frequency of 1 Hz is maintained at frequency of 100 Hz.
This is the proof that higher transformation temperature thin
films are effective for high speed actuation. Such high speed
actuation was also observed in Ti–Ni–Cu with narrow
transformation temperature hysteresis [48]. Microactuators
utilizing the R-phase transformation in Ti–Ni binary alloy
also revealed similar high speed actuation [52].
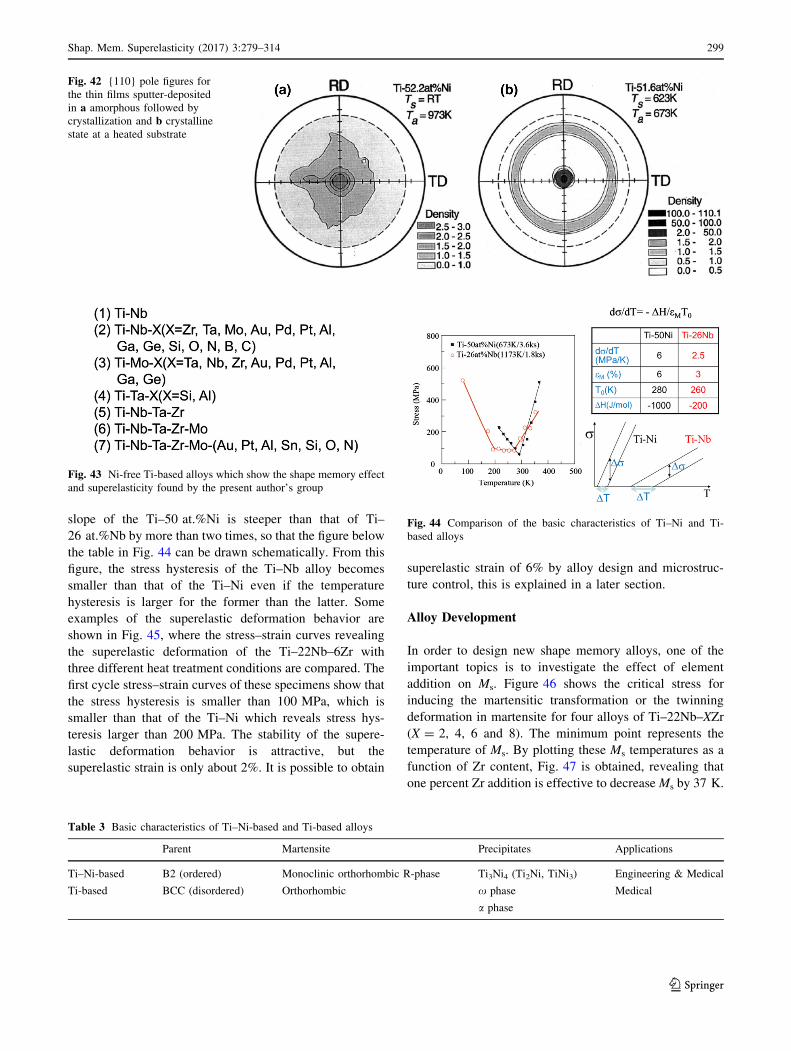
Another unique characteristic of such sputter-deposited
thin films is shown in Fig. 42, where textures of sputter-
deposited thin films are compared [53]. When a thin film is
sputter-deposited at room temperature, the film is amor-
phous. Following heat treatment induces crystallization
from amorphous phase to B2 phase. In such a case, the thin
film shows a texture shown in Fig. 42a: this texture is not
so strong. However, when sputter-deposition is conducted
on a heated substrate with a temperature higher than
crystallization temperature, the texture is strong as shown
Fig. 38 A high-resolution electron micrograph showing plate precipitates in a sputter-deposited Ti–48.2 at.%Ni thin film
Shap. Mem. Superelasticity (2017) 3:279–314 297
123

in Fig. 42b, which reveals a typical fiber texture with the
maximum intensity of 100. Because of the attractive
function of such microactuators, a book on thin film shape
memory alloys was published [106].
Further Investigation on Thin Film Shape Memory
Alloys
Superelastic microtubes are attractive for medical appli-
cations such as stents. If thinner tubes are required, the
sputter-deposition method is available. Such superelastic
tubes were successfully fabricated by applying sputter-de-
position during rotating a Cu wire substrate [54]. Sputter-
deposition technique was also applied to make Ti–Ni
multilayer thin films consisting of Ti and Ni films layered
alternately [55, 56]. After sputter-deposition of the multi-
layer thin films, the films were heat treated for alloying to
make Ti–Ni thin film shape memory alloys. Unique
alloying process was observed. Another method, melt-
spinning, is applicable for making thin plate shape memory
alloys with thickness of 10–30 lm. It was also shown that
the melt-spun ribbons reveal perfect shape memory effect
and specific microstructures [57, 58].
Ni-Free Ti-Based Alloys
The motivation of developing b Ti-based shape memory
alloys is to develop materials which are more biocompat-
ible and possess better properties than Ti–Ni alloys by the
replacement of Ni with other elements which are safe for
human bodies. Such safe elements are Nb, Mo, Zr, Ta, Sn,
Au, Ge, Ga, O, N, etc. The author’s group has developed bTi-based alloys which reveal shape memory effect and
superelasticity as shown in Fig. 43. The detailed basic
properties of some of these alloys can be seen in [61–65]
for Ti–Nb, [66–70] for Ti–Nb–Al, [71, 72] for Ti–Mo–Ga,
[73] for Ti–Nb–Ga, [74] for Ti–Nb–O, [75, 76] for Ti–Nb–
Zr, [77, 78] for Ti–Nb–Mo, and [79, 80] for Ti–Nb–Ta.
The comparison between the basic characteristics of Ti–
Ni-based and Ti-based alloys is shown in Table 3. The
parent phases of Ti–Ni-based alloy and Ti-based alloy are
B2 ordered structure and BCC disordered structure,
respectively. The martensite phases for these two alloys are
monoclinic, orthorhombic, and rhombohedral phases for
the former alloy and orthorhombic phase for the Ti-based
alloy. The precipitates available for modification of prop-
erties are Ti3Ni4 for the former alloy and x and a phases
for the latter alloy. Major application fields are both
engineering and medical fields for the former alloy and
mainly medical fields for the latter alloy.
Another comparison between the basic characteristics
between these two alloys is shown in Fig. 44. The critical
stress is plotted as a function of test temperature for Ti–
50 at.%Ni and Ti–26 at.%Nb alloys in the left figure in-
cluded in Fig. 44. From these data and their stress–strain
curves, the basic characteristics of these two alloys can be
obtained as shown in the table included in Fig. 44. The
Fig. 39 A schematic figure showing a diaphragm-type microactuator
consisting of a Ti–Ni thin film deposited on a SiO2 layer of Si
substrate
Fig. 40 Dynamic characteristics showing the height of a diaphragm-
type microactuator versus time relationship
Fig. 41 The maximum height of microactuators with Ti–Ni and Ti–
Ni–Pd thin films as a function of cyclic frequency
298 Shap. Mem. Superelasticity (2017) 3:279–314
123
slope of the Ti–50 at.%Ni is steeper than that of Ti–
26 at.%Nb by more than two times, so that the figure below
the table in Fig. 44 can be drawn schematically. From this
figure, the stress hysteresis of the Ti–Nb alloy becomes
smaller than that of the Ti–Ni even if the temperature
hysteresis is larger for the former than the latter. Some
examples of the superelastic deformation behavior are
shown in Fig. 45, where the stress–strain curves revealing
the superelastic deformation of the Ti–22Nb–6Zr with
three different heat treatment conditions are compared. The
first cycle stress–strain curves of these specimens show that
the stress hysteresis is smaller than 100 MPa, which is
smaller than that of the Ti–Ni which reveals stress hys-
teresis larger than 200 MPa. The stability of the supere-
lastic deformation behavior is attractive, but the
superelastic strain is only about 2%. It is possible to obtain
superelastic strain of 6% by alloy design and microstruc-
ture control, this is explained in a later section.
Alloy Development
In order to design new shape memory alloys, one of the
important topics is to investigate the effect of element
addition on Ms. Figure 46 shows the critical stress for
inducing the martensitic transformation or the twinning
deformation in martensite for four alloys of Ti–22Nb–XZr
(X = 2, 4, 6 and 8). The minimum point represents the
temperature of Ms. By plotting these Ms temperatures as a
function of Zr content, Fig. 47 is obtained, revealing that
one percent Zr addition is effective to decrease Ms by 37 K.
Fig. 42 {110} pole figures for
the thin films sputter-deposited
in a amorphous followed by
crystallization and b crystalline
state at a heated substrate
Fig. 43 Ni-free Ti-based alloys which show the shape memory effect
and superelasticity found by the present author’s group
Fig. 44 Comparison of the basic characteristics of Ti–Ni and Ti-
based alloys
Table 3 Basic characteristics of Ti–Ni-based and Ti-based alloys
Parent Martensite Precipitates Applications
Ti–Ni-based B2 (ordered) Monoclinic orthorhombic R-phase Ti3Ni4 (Ti2Ni, TiNi3) Engineering & Medical
Ti-based BCC (disordered) Orthorhombic x phase
a phase
Medical
Shap. Mem. Superelasticity (2017) 3:279–314 299
123

The effects of other elements addition were also investi-
gated resulting in Fig. 48. For example, oxygen is effective
to decrease Ms by 160 K per one % addition.
Orthorhombic Martensitic Transformation
Martensitic transformation can be easily observed on the
specimen surface by the optical microscopy as shown in
Fig. 49. The Ti–20 at.%Nb and Ti–22 at.%Nb alloys
reveal surface relief due to the orthorhombic a00 martensitic
transformation, because the Ms temperatures of these
specimens are higher than the room temperature. With
increasing Nb content, Ms decreases. The Ti–24 at.%Nb
shows the combination of martensite and parent phases,
because the Ms is around the room temperature. The Ms of
Ti–26 at.%Nb is lower than the room temperature reveal-
ing no martensite, suggesting that this specimen reveals
superelastic behavior.
More precisely, the transmission electron microscopy is
applicable to observe the microstructures as shown in
Fig. 50, where a’’ martensite variants can be observed in
the three specimens with less Nb contents, but the Ti-
26 at.%Nb reveals the parent b phase with fine x phase
particles. The x phase plays important roles in the Ti-based
shape memory alloys, and the effect of x phase will be
explained in a later section on x phase. Figure 51 shows
three phases of the b parent phase, a00 martensite phase, and
x phase [63]. The x phase seems suppressing the growth
of the martensite variant.
The transmission electron microscopy also revealed a
typical self-accommodation morphology consisting of
three martensite variants in two-dimensional morphology
or four variants in three-dimensional morphology
[65, 69, 81].
Texture
The maximum recoverable strain is estimated by calcu-
lating the lattice distortion due to the martensitic trans-
formation utilizing lattice constants of parent b phase and
a00 martensite. Figure 52 shows the crystal structures and
the lattice constants (a0 and a0, b0, c0) of the b phase and a00
martensite, respectively, and their lattice correspondence
[62]. By using these data, the distortions can be estimated
Fig. 45 Effect of annealing temperature on the superelastic defor-
mation behavior of Ti–22Nb–6Zr
Fig. 46 Effect of test temperature on the critical stress of yielding in
Ti–22Nb–XZr alloys
Fig. 47 Effect of Zr content on Ms in Ti–22Nb–XZr alloys
Fig. 48 Effect of the third element on Ms in solution-treated Ti–Nb
alloys
300 Shap. Mem. Superelasticity (2017) 3:279–314
123

Fig. 49 Effect of Nb content on the microstructure observed by the optical microscopy on the specimen surface in solution-treated Ti–Nb alloys
Fig. 50 Effect of Nb content on the microstructure observed by the transmission electron microscopy in solution-treated Ti–Nb alloys
Shap. Mem. Superelasticity (2017) 3:279–314 301
123

for the three principal axes: g1, g2, and g3. The first dis-
tortion g1 contracts, the second one g2 expands and the
third one g3 shows few change. The absolute values of g1
and g2 decrease with increasing Nb content, indicating that
the lattice distortion or shape change due to the martensitic
transformation decreases with increasing Nb content. The
shape change along [011] direction (eM[011]) calculated by
the above lattice distortions is potted as a function of Nb
content in Fig. 53, where eM[011] decreases with increas-
ing Nb content. The strain is more than 5% when the Nb
content is 18 at.%; however, the Ms is about 500 K which
is too high for applications. The Ms is around room tem-
perature for 26 at.%Nb specimen, which is good for
applications. But, in this case, the transformation strain is
only 2.5%, which is not attractive enough for applications.
The orientation dependence of transformation strain is
shown in Fig. 54, where the maximum strain is along the
[011] direction, while the minimum strain is along [001]
direction. There are two problems to be solved: one is
increasing the transformation strain by alloy design, while
another is controlling the texture in order to have a strong
[011] texture along the rolling direction in order to maxi-
mize the available strain. The alloy design for achieving
large strain is explained in a later section. Here, the texture
topic is described in some detail as follows.
Fig. 51 Microstructure consisting of b, a00, and x phases in a
solution-treated Ti–26 at.%Nb after tensile straining up to a strain of
2.5%
Fig. 52 Nb content dependence of the lattice distortion due to the
martensitic transformation in Ti–Nb alloys
Fig. 53 Nb content dependence of transformation strain along [011]
in Ti–Nb alloys
Fig. 54 Orientation dependence of the calculated transformation
strain in Ti–26 at.%Nb
Fig. 55 Inverse pole figures corresponding to RD, 45� from the
tensile axis and TD
302 Shap. Mem. Superelasticity (2017) 3:279–314
123
The Ti–22Nb–6Ta (at.%) alloy which was solution
treated at 1173 K for 1.8 ks was investigated to know the
texture. Figure 55 shows that the inverse pole figures cor-
responding to three directions on the rolling plane, i.e., the
rolling direction (RD), 45� from RD and the transverse
direction (TD) show high axis densities at [011], [012], and
[111], respectively [80, 95]. When the same alloy was heat
treated at 873 K, a different texture was observed, indi-
cating that heat treatment condition affects the texture.
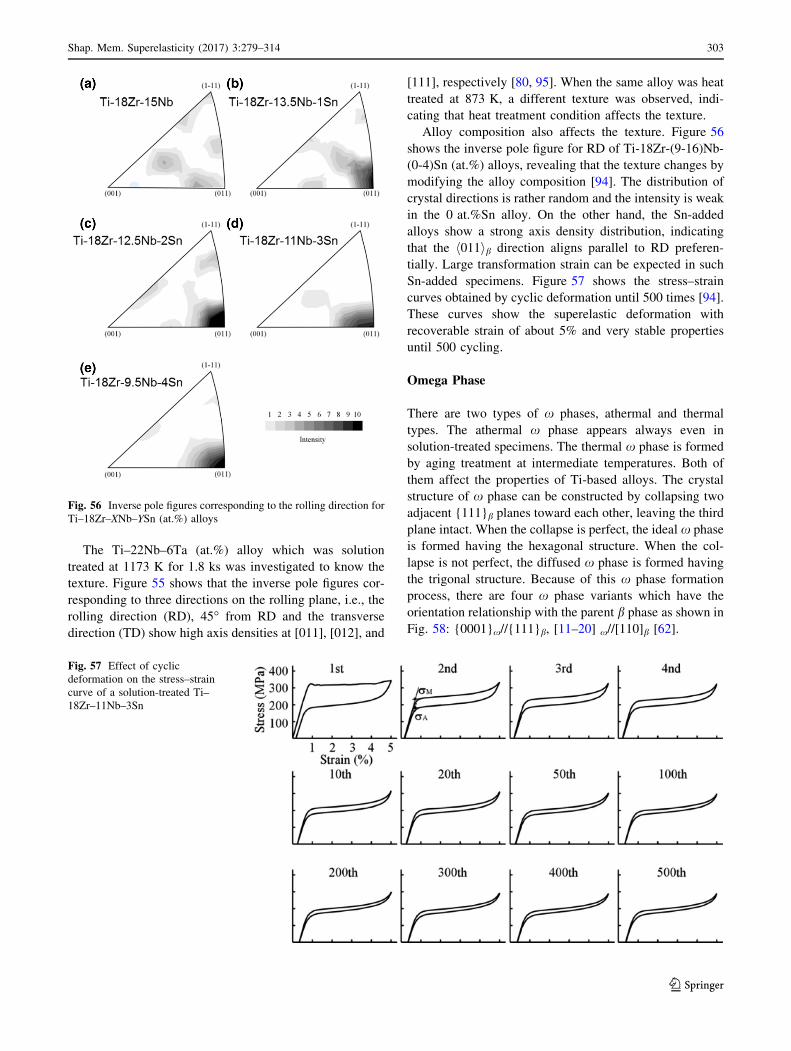
Alloy composition also affects the texture. Figure 56
shows the inverse pole figure for RD of Ti-18Zr-(9-16)Nb-
(0-4)Sn (at.%) alloys, revealing that the texture changes by
modifying the alloy composition [94]. The distribution of
crystal directions is rather random and the intensity is weak
in the 0 at.%Sn alloy. On the other hand, the Sn-added
alloys show a strong axis density distribution, indicating
that the h011ib direction aligns parallel to RD preferen-
tially. Large transformation strain can be expected in such
Sn-added specimens. Figure 57 shows the stress–strain
curves obtained by cyclic deformation until 500 times [94].
These curves show the superelastic deformation with
recoverable strain of about 5% and very stable properties
until 500 cycling.
Omega Phase
There are two types of x phases, athermal and thermal
types. The athermal x phase appears always even in
solution-treated specimens. The thermal x phase is formed
by aging treatment at intermediate temperatures. Both of
them affect the properties of Ti-based alloys. The crystal
structure of x phase can be constructed by collapsing two
adjacent {111}b planes toward each other, leaving the third
plane intact. When the collapse is perfect, the ideal x phase
is formed having the hexagonal structure. When the col-
lapse is not perfect, the diffused x phase is formed having
the trigonal structure. Because of this x phase formation
process, there are four x phase variants which have the
orientation relationship with the parent b phase as shown in
Fig. 58: {0001}x//{111}b, [11–20] x//[110]b [62].
Fig. 56 Inverse pole figures corresponding to the rolling direction for
Ti–18Zr–XNb–YSn (at.%) alloys
Fig. 57 Effect of cyclic
deformation on the stress–strain
curve of a solution-treated Ti–
18Zr–11Nb–3Sn
Shap. Mem. Superelasticity (2017) 3:279–314 303
123

Figure 59 shows the effect of aging time on the x phase
formation in solution-treated and aged Ti–26 at.%Nb
samples. The solution-treated sample reveals very fine
small athermal x phase particles, while the thermal xphase particle formed by aging increases the size and
density with increasing the aging temperature until 573 K,
then decreases with further increasing temperature until
873 K [62]. This indicates that 573 K is most effective
aging temperature for the formation of thermal x phase.
Aging time is also one of the important factors affecting
the x phase formation. Figure 60 shows the effect of aging
time at 573 K on the formation of x phase. The size and
density of x phase continuously increase with increasing
time until 36 ks.
Effects of Adding Elements and Large Shape
Recovery
Sn reveals another interesting effect on deformation
behavior other than increasing transformation strain as
shown in the above section. Figure 61 shows the effect of
adding Sn on the deformation behavior in Ti–15Nb–3Mo
(at.%) [78]. Sn addition is also effective to decrease the
size and density of x phase by comparing the photographs
of Ti–15Nb–3Mo and Ti–15Nb–3Mo–1Sn in the figure.
This indicates that Sn addition is effective to increase Ms
and decrease friction force against the movement of the
habit planes of martensites, because Sn suppresses the
formation of x phase. Therefore, the critical stress for
inducing the martensitic transformation (rM) decreases
with increasing Sn content until 1.0Sn addition, suggesting
that Ms increases. This is an opposite sense if considering
the intrinsic effect of Sn addition: Ms decreases with
increasing Sn content if not considering the x phase. This
can be understood when considering that the effect of xphase is more effective on Ms than the intrinsic effect of
adding Sn. Therefore, the rM starts to increase with further
increasing Sn from 1.0 at.% although the corresponding
stress–strain curves are omitted, because the density of xphase has become already low enough at 1.0 at.%Sn, so
that further decrease in x phase will not affect effectively,
then the intrinsic effect of adding Sn becomes prominent in
decreasing Ms. On the other hand, the critical stress for the
reverse martensitic transformation (rR) monotonically
increases with increasing Sn content. This can be
Fig. 58 A high-resolution electron micrograph showing the lattice
correspondence between the b parent phase and x phase
Fig. 59 Effect of aging
temperature on the formation of
x phase in Ti–26 at.%Nb aging
treated for 3.6 ks
304 Shap. Mem. Superelasticity (2017) 3:279–314
123

understood by considering that the x phase disappears after
the martensitic transformation, hence the x phase does not
affect rR or the reverse martensitic transformation
temperature.
The O addition also affects the properties of Ti-based
alloys. It is clearly shown that O addition increases rM and
the strength by comparing the stress–strain curves of Ti–
22Nb–XO (at.%) alloys in Fig. 62 [74].
Fig. 60 Effect of aging time on
the formation of x phase in Ti–
26 at.%Nb aged at 573 K
Fig. 61 Effect of Sn addition
on microstructure and
superelastic properties of Ti–
15Nb–3Mo
Shap. Mem. Superelasticity (2017) 3:279–314 305
123

The effect of Zr addition on the transformation strain is
shown in Fig. 63, where contour bands with darker color
show the higher transformation strain region, and alloy
composition regions revealing shape memory effect and
superelasticity are also shown by open circles and closed
circles, respectively [95, 102]. From these data, it is pos-
sible to pick up the alloy composition which shows the
superelasticity with a large recovery strain. In these ternary
alloys, Zr is substituted for Nb in order to increase the
transformation strain with keeping the transformation
temperature unchanged so as to reveal the superelasticity at
room temperature. The reason why this is possible is
explained below. In the Ti-Nb binary alloys, Nb addition is
effective to decrease Ms by about 43 K/ at.% and to
decrease the transformation strain by 0.34%/ at.%. Zr
addition to Ti-Nb alloys is also effective to decrease Ms
and the transformation strain by 36 K/ at.% and 0.13%/
at.%, respectively. It is clear that Zr addition has a weaker
effect on the transformation strain, while it decreases Ms
similarly to the Nb addition. As a result of this consider-
ation, the increase in Zr content as a substitute for Nb while
maintaining the same transformation temperature to keep
the superelasticity increases the transformation strain
[95, 102].
Figure 64 summarizes the effects of adding elements on
the deformation behavior of Ti–Nb alloys as follows: Zr
increases the transformation strain but accelerates the for-
mation of x phase. Sn or Al suppresses the formation of xphase and increases the transformation strain. O or N cre-
ates nano-domains and increases the critical stress for slip
deformation. Regarding the nano-domains, detailed
description is found in the next section. By considering the
above effects, Ti–Nb–Zr(Sn, Al)–(O, N) alloys have been
found to possess the superelasticity with a large recovery
strain of 6% [93, 94].
Fig. 62 Effect of oxygen addition on stress–strain curve in Ti–22Nb–
XO alloys
Fig. 63 Alloy composition dependence of the transformation strain
and deformation behavior in Ti–Nb–Zr alloys
Fig. 64 Effects of each element (Zr, Sn, Al, O, or N) on transfor-
mation strain, formation of x phase, strength, and superelastic
properties
Fig. 65 Comparison of the stress–strain curves of steel, Gum metal,
and Ti–Ni
306 Shap. Mem. Superelasticity (2017) 3:279–314
123

Nano-domain Transformation
Non-linear Elastic Deformation
Addition of interstitial elements such as O and N reveal
unique effects on the deformation behavior in Ti-based
alloys. Figure 65 shows the stress–strain curves of steel,
Gum metal (Ti-based alloy), and Ti–Ni. The Young’s
modulus of Gum metal is lower than that of steel which has
a similar strength as Gum metal. The Gum metal including
1.2%O is characterized by the low Young’s modulus and
non-linear large elasticity. If compared with the supere-
lasticity of Ti–Ni alloy which shows the apparent Young’s
modulus of only 10 GPa, which is much smaller than that
of the Gum metal 50 GPa. But, people feel the Young’s
modulus of the Gum metal is small if compared with
conventional metals and alloys. This unique non-linear
elasticity and the low Young’s modulus of the Gum metal
can be understood as follows.
Figure 66 shows the result of simple Ti–Nb–O alloys
[83]. Even in this simple alloy system, the non-linear
elasticity and the low Young’s modulus can be achieved by
adding 1%O. Without adding oxygen, this alloy shows
typical superelasticity induced by the martensitic trans-
formation upon loading and its reverse transformation upon
unloading as shown by the stress–strain curve of Ti–26Nb.
The Ti–26Nb binary alloy reveals typical first-order
martensitic transformation, because a X-ray diffraction
peak of the a00 martensite appears at a different position
apart from the parent b phase position once the transfor-
mation occurs upon loading, representing the characteris-
tics of the first-order transformation. However, in case of
1% oxygen added specimen, such a first-order martensitic
transformation does not occur. The b phase peak shifts
continuously to the higher angle position during the non-
linear elastic deformation upon loading. This suggests that
the non-linear elastic deformation appears due to the sec-
ond-order phase transformation.
Fig. 66 Effect of O addition on the stress–strain curve of Ti–26Nb–
(0–1.0)O and X-ray diffraction peak position variation upon loading
Fig. 67 A Nano-domain formed around an oxygen atom
Fig. 68 Micrographs showing dark field images of a, b annealed and
c, d as-rolled specimens, revealing two types of nano-domain variants
V5 and V6 among six nano-domain variants
Shap. Mem. Superelasticity (2017) 3:279–314 307
123

Figure 67 shows the lattice distortion elements for the
a’’ martensitic transformation [83]. From the b phase
structure to the a00 martensite, shuffling along ± [011]b(0-
11)b is necessary in addition to lattice contraction along
[100] and expansion along [011], which correspond to a
shear mode of (-211)b[111]b. The O locates at the center
of the octahedron, and hence the lattice of the parent bphase is distorted to generate strain energy. In order to
reduce the strain energy around the oxygen atom, the
shuffling is effective. This indicates that oxygen assists the
martensitic transformation, because the shuffling is neces-
sary to form the martensite structure. However, the perfect
lattice distortion to form the martensite is suppressed by the
surrounding oxygen-induced strain fields. This local lattice
distortion around O is named nano-domain which is an
intermediate phase between the b phase and the a00
martensite [83]. Thus, there are six nano-domain variants
similarly to the martensite variants [83].
Nano-domains can be observed by the transmission
electron microscopy as shown in Fig. 68. These micro-
graphs show dark field images of (a), (b) annealed and (c),
(d) as-rolled specimens, revealing two types of nano-do-
main variants V5 and V6 among six nano-domain variants.
The two nano-domains equally exist in the annealed
specimen as shown in Fig. 68a, b, while favorable nano-
Fig. 69 Invar effect of Gum metal
Fig. 70 Diffraction pattern and
nano-domains V5 and V6 at
room temperature in Gum metal
308 Shap. Mem. Superelasticity (2017) 3:279–314
123

domain V6 is grown due to the internal stress induced by
the cold-rolling as shown in Fig. 68d but the volume
fraction of nano-domain V5 is similar to that of the
annealed specimen as shown in Fig. 68c. This indicates
that the applied stress or internal stress grows the favorable
nano-domain variant V6 inducing specimen distortion,
causing for the non-linear elastic deformation or Invar
effect. It was also observed by the in situ transmission
electron microscopy that the intensity of the diffraction
spot of the most favorable nano-domain V6 increased by
applying stress to the specimen, indicating that the applied
stress grows the V6 nano-domain variant [83].
Invar Effect
Another unique property of Gum metal is Invar effect as
shown in Fig. 69 [84], where the thermal expansion of Cu
is shown as an example of normal metals. An annealed
plate specimen of Gum metal also reveals similar thermal
expansion along both rolling direction (RD) and transverse
direction (TD). However, an as-rolled specimen reveals
Invar effect along the RD, but normal thermal expansion
behavior appears along the TD even for the as-rolled
specimen.
In the annealed specimen, all nano-domain variants exist
equally and uniformly indicating no favorable variant,
Fig. 71 Diffraction pattern and
nano-domains V5 and V6 at
90 K in Gum metal
Fig. 72 The mechanism of Invar effect of Gum metal
Shap. Mem. Superelasticity (2017) 3:279–314 309
123

because there is no stress field in the annealed specimen.
However, in the as-rolled specimen, the growth of V6
nano-domain can be observed due to the internal stress
field as shown in Fig. 68d for oxygen-added Ti–Nb or
Fig. 70c for the Gum metal, suggesting that the specimen
expanded along the rolling direction due to the growth of
V6 nano-domain. The nano-domain can also further grow
by cooling under stress as shown in Fig. 71c [84]. Heating
up to room temperature shrinks the nano-domain V6 as
shown in Fig. 70c.
Now, the mechanism of Invar effect of Gum metals can
be understood as shown in Fig. 72 [84]. The as-rolled plate
has a strong texture of {001}b h110ib, thus the plate is
similar to a single crystal with this crystal orientation. In
such an as-rolled specimen, the possible nano-domains are
V5 and V6 considering the contraction along the normal
direction (ND), because the two nano-domain variants have
a0 axis of the nano-domain (or the a00 martensite) along the
normal direction. However, if the elongation along the
rolling direction is considered, only V6 nano-domain is the
favorable variant, because V6 nano-domain has the
extended b0 axis along the rolling direction. If the specimen
is cooled, V6 nano-domain grows resulting in further
elongation along the rolling direction. However, by cooling
the specimen shrinks by the normal thermal expansion
effect. Both the effects are cancelled by each other,
Fig. 73 Heating-induced forward martensitic transformation in Ti–
23Nb–1.0O
Fig. 74 Variation of strain and X-ray diffraction peak positions
during the heating-induced martensitic transformation upon heating in
Ti–23Nb–1.0O
Fig. 75 A schematic phase diagram showing a, b, and x phases for
Ti–Mo, Ti–Nb, and Ti–Ta systems
310 Shap. Mem. Superelasticity (2017) 3:279–314
123

resulting in no shape change during cooling and heating
only along the RD. This is the Invar effect of Gum metals.
Heating-Induced Martensitic Transformation
Now, another unique property was observed in oxygen
added Ti alloys. This is heating-induced forward marten-
sitic transformation. Usually, the martensitic transforma-
tion occurs during cooling. Thus, the heating-induced
martensitic transformation is unique behavior. Figure 73
shows the heating-induced martensitic transformation
observed in Ti–23Nb–1O [85]. Cooling down to 173 K,
then heating, cooling and heating were conducted as shown
in Fig. 73a. During this temperature variation, the speci-
men revealed shape change under load as shown in
Fig. 73b. During the first heating, the specimen shows
elongation after reaching temperature T1. This elongation
occurs due to the forward martensitic transformation. By
further heating, the reverse transformation occurs showing
shape recovery finishing at temperature T2. However,
during the following cooling, normal martensitic transfor-
mation takes place at Ms followed by elongation. This is
the intrinsic Ms of this specimen without the effect of O.
Next heating induces the normal reverse transformation
followed by shape recovery finishing at Af. This unique
behavior can be understood as follows: Nano-domains
suppress the growth of other nano-domains. So the
martensitic transformation does not occur even if the
temperature is below the intrinsic Ms of this specimen.
After reaching T1 temperature upon heating, oxygen atoms
become easy to move by enhanced diffusion condition at
high temperatures. Then, the martensitic transformation
starts at T1, because it is lower than Ms and the martensite
is stable at T1, and by further heating the martensite phase
becomes unstable so that the reverse transformation takes
place to induce shape recovery. After reaching at high
temperatures, oxygen atoms move easily, so that oxygens
do not suppress the lattice distortion for the martensitic
transformation and the reverse transformation anymore
above T1. The conventional martensitic transformation
occurs at Ms inducing normal elongation upon cooling as
shown by the dashed line. After cooling down to 173 K,
the specimen was again heated. The reverse martensitic
transformation occurs followed by shape recovery, show-
ing the normal shape memory effect.
Figure 74a shows the shape change A–J due to the
heating-induced martensitic transformation. Figure 74b
shows the corresponding X-ray diffraction peaks, revealing
the formation of martensite peak at 393 K, followed by the
growth of the peak until 433 K and the following shrinkage
of the peak until 493 K. This in situ observation clearly
reveals the heating-induced martensitic transformation.
More details about this transformation are explained in Ref.
[85].
High-Temperature SMAs
Ti-based high temperature shape memory alloys, Ti–Ta-
based alloys, were also developed by the present author’s
group. The Ti–Ta is a b Ti-based alloy, so that cold
workability exceeds 90%. There is no problem of cold
workability for these alloys, but functional stability is a
problem to be solved for practical applications. The shape
memory effect is generally deteriorated by the formation of
x phase at an intermediate temperature region. Figure 75
shows a schematic phase diagram of Ti-X systems, where
three types of alloys are compared, i.e., Ti–Mo, Ti–Nb, and
Ti–Ta. Each element of Mo, Nb, and Ta has a specific
effect on Ms, i.e., -80 K/at.%Mo, -40 K/at.%Nb, and
-30 K/at.%Ta, respectively. In order to have the same Ms
to reveal the superelasticity at room temperature, the nec-
essary elements are Ta, Nb, Mo in order of amount. This
means that Ta is most effective to reduce the amount of xphase, while Mo is least effective among the three ele-
ments. Therefore, Ta was considered as the most promising
element for developing the high-temperature shape mem-
ory alloy among Ti-based alloys [97].
In order to further reduce the formation of x phase to
increase functional stability, the candidates for the effec-
tive third elements were selected by conducting the
investigation as shown in Fig. 76 [98, 99], where the Ms
temperatures of a solution-treated specimen and a follow-
ing aging-treated specimen are compared for each third
element. Two elements, Sn and Al, were found to be
effective to minimize the decrease of Ms by aging treat-
ment. Thus, Ti–Ta–Sn and Ti–Ta–Al alloys had been
found as deformable high-temperature shape memory
alloys [98, 99].
Fig. 76 Ms temperatures of Ti–Ta–1X solution-treated specimens
and specimens aged at 573 K for 3.6 ks
Shap. Mem. Superelasticity (2017) 3:279–314 311
123

Concluding Remarks
The present author’s research results on shape memory
alloys are compactly summarized including Ti–Ni-based
alloys and Ni-free Ti-based alloys. If the readers need to
know more in detail about each topic on these alloys,
reference papers are available for this purpose. Review
papers on some of the above-mentioned topics on Ti–Ni-
based alloys are available for bulk Ti–Ni alloys [59],
sputter-deposited thin films [60], and high-temperature
shape memory alloys [38]. Review papers on some of the
above-mentioned topics on Ni-free Ti-based alloys are
available for Ti-based alloys [101], Ti-Nb-based alloys
[92, 102], and Ti–Nb–(Zr, Ta) alloys [95].
Acknowledgements It is a great pleasure for the present author that
this journal decided to publish this special issue in honor of him. The
present author is grateful to this journal editor, Prof. Huseyin Sehi-
toglu, for deciding the publication of this special issue and to Prof.
Yinong Liu and Prof. Hee Young Kim for leading and editing this
special issue. The present author also greatly thanks for many authors
contributing to this special issue. The most parts of the research
results on Ni-free Ti-based alloys presented in this paper were
achieved through the close collaboration with Prof. Hee Young Kim.
This work was partially supported by JSPS KAKENHI Kiban A Grant
Number 26249104.
References
1. Buehler WJ, Gilfrich JV, Wiley RC (1963) Effect of low-tem-
perature phase changes on the mechanical properties of alloys
near composition TiNi. J Appl Phys 34:1475–1477
2. Kauffmann GB, Mayo I (1997) The story of nitinol: the
serendipitous discovery of the memory metal and its applica-
tions. Chem Educ. doi:10.1333/s00897970111a
3. Miyazaki S, Otsuka K, Suzuki Y (1981) Transformation pseu-
doelasticity and deformation behavior in a Ti–50.6at%Ni alloy.
Scr Met 15:287–292
4. Miyazaki S, Ohmi Y, Otsuka K, Suzuki Y (1982) Characteristics
of deformation and transformation pseudoelasticity in Ti–Ni
alloys. J Phys 43(Suppl. 12):C4-255–C4-260
5. Miyazaki S, Imai T, Otsuka K, Suzuki Y (1981) Luders-like
deformation in the transformation pseudoelasticity of a Ti–Ni
alloy. Scr Met 15:853–856
6. Miyazaki S, No VH, Kitamura K, Anak K, Hosoda H (2000)
Texture of Ti–Ni rolled thin plates and sputter-deposited thin
films. Int J Plast 16:1135–1154
7. Kim JI, Liu Y, Miyazaki S (2004) Ageing-inducede two-stage
R-phase transformation in Ti–50.9at%Ni. Acta Mater
52:487–499
8. Liu Y, Kim JI, Miyazaki S (2004) Thermodynamic analysis of
ageing-induced multiple-stage transformation behavior of NiTi.
Phil Mag A 84:2083–2102
9. Kim JI, Miyazaki S (2005) Effect of nano-scaled precipitates on
shape memory behavior of Ti–50.9at%Ni alloy. Acta Mater
53:4545–4554
10. Kim JI, Miyazaki S (2005) Comparison of shape memory
characteristics of a Ti–50.9 At. Pct Ni alloy aged at 473 and
673 K. Metall Mater Trans A 36:3301–3310
11. Miyazaki S, Otsuka K (1986) Deformation and transformation
behavior associated with the R-phase in Ti–Ni alloys. Met Trans
A 17:53–63
12. Kudoh Y, Tokonami M, Miyazaki S, Otsuka K (1985) Crystal
structure of Ti–Ni martensite analyzed by the single crystal
X-ray diffraction method. Acta Met 33:2049–2056
13. Miyazaki S, Kimura S, Otsuka K, Suzuki Y (1984) The habit
plane and transformation strains associated with the martensitic
transformation in Ti–Ni single crystals. Scr Met 18:883–888
14. Matsumoto O, Miyazaki S, Otsuka K, Tamura H (1987) Crys-
tallography of martensitic transformation in Ti–Ni single crys-
tals. Acta Met 35:2137–2144
15. Takei F, Miura T, Miyazaki S, Kimura S, Otsuka K, Suzuki Y
(1983) Stress-induced martensitic transformation in a Ti–Ni
single crystal. Scr Met 17:987–992
16. Miyazaki S, Kimura S, Takei F, Miura T, Otsuka K, Suzuki Y
(1983) Shape memory effect and pseudoelasticity in a Ti–Ni
single crystal. Scr Met 17:1057–1062
17. Miyazaki S, Otsuka K, Wayman CM (1989) The shape memory
mechanism associated with the martensitic transformation in Ti–
Ni alloys: part I: self-accommodation. Acta Met 37:1873–1884
18. Miyazaki S, Otsuka K, Wayman CM (1989) The shape memory
mechanism associated with the martensitic transformation in Ti–
Ni alloys: part II: variants coalescence and shape recovery. Acta
Met 37:1885–1890
19. Miyazaki S, Wayman CM (1988) The R-phase transition and
associated shape memory mechanism in Ti–Ni single crystals.
Acta Met 36:181–192
20. Miyazaki S, Kimura S, Otsuka K (1988) Shape memory effect
and pseudoelasticity associated with the R-phase transition in
Ti–50.5at%Ni single crystals. Phil Mag A 57:467–478
21. Miyazaki S, Igo Y, Otsuka K (1986) Effect of thermal cycling
on the transformation temperatures of Ti–Ni alloys. Acta Met
34:23045–23051
22. Miyazaki S, Imai T, Igo Y, Otsuka K (1986) Effect of cyclic
deformation on the pseudoelasticity characteristics of Ti–Ni
alloys. Met Trans A 17:115–120
23. Miyazaki S, Mizukoshi K, Ueki T, Sakuma T (1999) Fatigue life
of Ti–50at%Ni and Ti–40Ni–10Cu (at%) shape memory wires.
Mater Sci Eng A 273–275:658–663
24. Miyazaki S, Sugaya Y, Otsuka K (1988) Effects of various
factors on fatigue life of Ti–Ni alloys. In: Proceedings of the
International Meeting on Advanced Materials, Tokyo,
pp. 251–256
25. Kim YS, Miyazaki S (1997) Fatigue properties of Ti–50.9at%Ni
shape memory alloy wire. In: Proceedings of International
Conference on Shape Memory and Superelastic Technologies
SMST-97 Pacific Grove, California, pp. 473–478
26. Miyazaki S, Sugaya Y, Otsuka K (1988) Mechanism of fatigue
crack nucleation in Ti–Ni alloys. Proc Int Meet Adv Mater,
Tokyo, pp 257–262
27. Miyazaki S, Suizu M, Otsuka K, Takashima T (1988) Effect of
various factors on fatigue crack propagation rate in Ti–Ni alloys.
Proc Int Meet Adv Mater, Tokyo, pp 263–268
28. Miyazaki S, Shiota I, Otsuka K, Tamura Y (1988) Effects of Cu
addition on mechanical behavior of Ti–Ni alloy. Proc Int Meet
Adv Mater, Tokyo, pp 153–158
29. Miyazaki S, Komatsubara K, Otsuka K, Horikawa H (1989)
Transformation temperatures and crystal structures of Ti–Ni–Cu
alloys. In: Annual fall meeting of the Japan Institute of Metals,
Hokkaido, Sept 29–Oct 1, p. 408
30. Miyazaki S, Komatsubara K, Otsuka K, Horikawa H (1989)
Effects of alloy composition and heat treatment on the defor-
mation behavior of Ti–Ni–Cu. In: Annual fall meeting of the
Japan Institute of Metals, Hokkaido, Sept 29–Oct 1, p. 409
312 Shap. Mem. Superelasticity (2017) 3:279–314
123

31. Tan SM, Miyazaki S (1997) Ti-content and annealing temperature
dependence of deformation characteristics of TixNi(92 - x)Cu8
shape memory alloys. Acta Mater 46:2729–2740
32. Piao M, Miyazaki S, Otsuka K, Nishida N (1992) Effects of Nb
addition on the microstructure of Ti–Ni alloys. Mater Trans JIM
33:337–345
33. Piao M, Miyazaki S, Otsuka K (1992) Characteristics of
deformation and transformation in Ti44Ni47Nb9 shape memory
alloy. Mater Trans JIM 33:346–353
34. Miyazaki S, Otsuka K (1984) Mechanical behavior associated
with the premartensitic rhombohedral-phase transition in a
Ti50–Ni47–Fe3 alloy. Phil Mag A 50:393–408
35. Kim HK, Jingu T, Nam TH, Miyazaki S (2011) Cold worka-
bility and shape memory properties of novel Ti–Ni–Hf–Nb high-
temperature shape memory alloys. Scr Mater 65:846–849
36. Khan MI, Kim HY, Nam TH, Miyazaki S (2012) Formation of
nanoscaled precipitates and their effects on the high-temperature
shape-memory characteristics of a Ti50Ni15Pd25Cu10 alloy. Acta
Mater 60:5900–5913
37. Khan MI, Kim HY, Namigata Y, Nam TH, Miyazaki S (2013)
Combined effects of work hardening and precipitation
strengthening on the cyclic stability of TiNiPdCu-based high
temperature shape memory alloys. Acta Mater 61:4797–4810
38. Khan MI, Kim HY, Miyazaki S (2015) A review of TiNiPdCu
alloy system for high temperature shape memory applications.
Shape Mem Superelasticity 1:85–106
39. Miyazaki S, Ishida A, Takei A (1992) Development and char-
acterization of Ti–Ni shape memory thin films. In: Proceedings
of international symposium on measurement and control in
robotics, Tsukuba, pp. 495–500
40. Ishida A, Takei A, Miyazaki S (1993) Thin shape memory film
of Ti–Ni formed by sputtering. Thin Solid Films 228:210–214
41. Miyazaki S, Ishida A (1994) Shape memory characteristics of
sputter-deposited Ti–Ni thin films. Mater Trans JIM 34:14–19
42. Kajiwara S, Ogawa K, Kikuchi T, Matsunaga T, Miyazaki S
(1996) Formation of nanocrystals with an identical orientation in
sputter-deposited Ti–Ni thin films. Phil Mag Lett 74:395–404
43. Kikuchi T, Ogawa K, Kajiwara S, Matsunaga T, Miyazaki S
(1998) High-resolution electron microscopy studies on coherent
precipitates and nanocrystals formed by low-temperature heat
treatments of amorphous Ti-rich Ti–Ni thin films. Phil Mag A
78:467–489
44. Ishida A, Sato M, Kimura T, Miyazaki S (2000) Stress-strain
curves of sputter-deposited Ti–Ni thin films. Phil Mag A
80:967–980
45. Hashinaga T, Miyazaki S, Ueki T, Horikawa H (1996) Trans-
formation and deformation behavior in sputter-deposited Ti–Ni–
Cu thin films. J Phys IV Coll C8(5):689–694
46. Miyazaki S, Hashinaga T, Ishida A (1996) Martensitic trans-
formations in sputter-deposited Ti–Ni and Ti–Ni–Cu shape
memory alloy thin films. Thin Solid Films 281(282):364–367
47. Matsunaga T, Kajiwara S, Ogawa K, Kikuchi T, Miyazaki S
(2001) Internal structures and shape memory properties of
sputter-deposited thin films of Ti–Ni–Cu alloy. Acta Mater
49:1921–1928
48. Tomozawa M, Kim HY, Miyazaki S (2009) Shape memory
behavior and internal structure of Ti–Ni–Cu shape memory
alloy thin films and their application for microactuators. Acta
Mater 57:441–452
49. Tomozawa M, Kim HY, Yamamoto A, Hiromoto S, Miyazaki S
(2010) Effect of heat-treatment temperature on microstructure
and actuation behavior of Ti–Ni–Cu thin film microactuator.
Acta Mater 58:6064–6071
50. Kim HY, Yuan Y, Nam TH, Miyazaki S (2011) Effect of Pd
content on crystallization and shape memory properties of Ti–
Ni–Pd thin films. Int J Smart Nano Mater 2:9–21
51. Kim HY, Mizutani M, Miyazaki S (2009) Crystallization pro-
cess and shape memory properties of Ti–Ni–Zr thin films. Acta
Mater 57:1920–1930
52. Tomozawa M, Kim HY, Miyazaki S (2006) Microactuators utilizing
R-phase transformation of sputter-deposited Ti-47.3Ni shape mem-
ory alloy thin films. J Intell Mater Syst Struct 17:1049–1058
53. Miyazaki S, Hirano M, No VH (2002) Dynamic characteristics of
diaphragm microactuators utilizing sputter-deposited TiNi shape
memory alloy thin films. Mater Sci Forum 394–395:467–474
54. Buenconsejo PJ, Ito K, Kim HY, Miyazaki S (2008) High-
strength superelastic Ti–Ni microtubes fabricated by sputter
deposition. Acta Mater 56:2063–2072
55. Cho H, Kim HY, Miyazaki S (2005) Fabrication and charac-
terization of Ti–Ni shape memory thin film using Ti/Ni multi-
layer technique. Sci Technol Adv Mater 6:678–683
56. Cho H, Kim HY, Miyazaki S (2006) Alloying process of sputter-
deposited Ti/Ni multilayer thin films. Mater Sci Eng A
438–440:699–702
57. Xing H, Kim HY, Miyazaki S (2007) Effect of rotation speed on
transformation behavior in Ti–48at.%Ni shape memory alloy
melt-spun ribbon. Mater Sci Forum 561–565:1481–1484
58. Inamura T, Takahashi Y, Hosoda H, Wakashima K, Nagase T,
Nakano T, Umakoshi Y, Miyazaki S (2006) Martensitic trans-
formation behavior and shape memory properties of Ti–Ni-Pt
melt-spun ribbons. Mater Trans 47:540–545
59. Miyazaki S, Otsuka K (1989) Development of shape memory
alloys. ISIJ Int 29:353–377
60. Miyazaki S, Ishida A (1999) Martensitic transformation and
shape memory behavior in TiNi-base thin films. Mater Sci Eng
A 273–275:106–133
61. Kim HY, Satoru H, Kim JI, Hosoda H, Miyazaki S (2004)
Mechanical properties and shape memory behavior of Ti-Nb
alloys. Mater Trans 45:2443–2448
62. Kim HY, Ikehara Y, Kim JI, Hosoda H, Miyazaki S (2006)
Martensitic transformation, shape memory effect and supere-
lasticity of Ti-Nb binary alloys. Acta Mater 54:2419–2429
63. Chai YW, Kim HY, Hosoda H, Miyazaki S (2008) Interfacial
defects in Ti–Nb shape memory alloys. Acta Mater 56:3088–3097
64. Tahara M, Kim HY, Hosoda H, Miyazaki S (2009) Cyclic
deformation behavior of a Ti–26at.%Nb alloy. Acta Mater
57:2461–2469
65. Chai YW, Kim HY, Hosoda H, Miyazaki S (2009) Self
accommodation in Ti–Nb shape memory alloys. Acta Mater
57:4054–4064
66. Fukui Y, Inamura T, Hosoda H, Wakashima K, Miyazaki S
(2004) Mechanical properties of a Ti–Nb–Al shape memory
alloy. Mater Trans 45:1077–1082
67. Horiuchi Y, Inamura T, Hosoda H, Wakashima K, Kim HY,
Miyazaki S (2006) Effect of boron addition on transformation
behavior and tensile properties of Ti–Nb–Al alloy. Mater Sci
Eng A 438–440:830–834
68. Inamura T, Kinoshita Y, Kim JI, Kim HY, Hosoda H, Waka-
shima K, Miyazaki S (2006) Effect of {001}h110i texture on
superelastic strain of Ti–Nb–Al biomedical shape memory
alloys. Mater Sci Eng A 438–440:865–869
69. Inamura T, Kim JI, Kim HY, Hosoda H, Wakashima K, Miya-
zaki S (2007) Composition dependent crystallography of a00-martensite in Ti-Nb-based b-titanium alloy. Phil Mag
87:3325–3350
70. Inamura T, Yamamoto Y, Hosoda H, Kim HY, Miyazaki S
(2010) Crystallographic orientation and stress-amplitude
dependence of damping in the martensite phase in textured Ti–
Nb–Al shape memory alloy. Acta Mater 58:2535–2544
71. Kim HY, Ohmatsu Y, Kim JI, Hosoda H, Miyazaki S (2004)
Mechanical properties and shape memory behavior of Ti–Mo–
Ga alloys. Mater Trans 45:1090–1095
Shap. Mem. Superelasticity (2017) 3:279–314 313
123

72. Kim HY, Ohmatsu Y, Kim JI, Inamura T, Hosoda H, Miyazaki
S (2006) Effect of Nb addition on shape memory behavior of
Ti–Mo–Ga alloys. Mater Trans 47:518–522
73. Fukui Y, Inamura T, Hosoda H, Wakshima K, Miyazaki S
(2004) Shape memory characteristics of Ti–Nb–Ge alloys. Trans
MRS Jpn 29:3017–3020
74. Kim JI, Kim HY, Hosoda H, Miyazaki S (2005) Shape memory
behavior of Ti–22Nb–(0.5–2.0)O(at%) biomedical alloys. Mater
Trans 46:852–857
75. Kim JI, Kim HY, Inamura T, Hosoda H, Miyazaki S (2005)
Shape memory characteristics of Ti–22Nb–(2–8)Zr(at.%)
biomedical alloys. Mater Sci Eng A 403:334–339
76. Kim JI, Kim HY, Inamura T, Hosoda H, Miyazaki S (2006)
Effect of annealing temperature on microstructure and shape
memory characteristics of Ti–22Nb–6Zr(at.%) biomedical alloy.
Mater Trans 47:505–512
77. Al-Zain Y, Kim HY, Hosoda H, Nam TH, Miyazaki S (2010)
Shape memory properties of Ti–Nb–Mo biomedical alloys. Acta
Mater 58:4212–4223
78. Al-Zain Y, Kim HY, Hosoda H, Nam TH, Miyazaki S (2011)
Anomalous temperature dependence of the superelastic behavior
of Ti–Nb–Mo alloys. Acta Mater 59:1464–1473
79. Kim HY, Hashimoto S, Kim JI, Inamura T, Hosoda H, Miyazaki
S (2006) Effect of Ta addition on shape memory behavior of Ti–
22Nb alloy. Mater Sci Eng A 417:120–128
80. Kim HY, Sasaki T, Okutsu K, Kim JI, Inamura T, Hosoda H,
Miyazaki S (2006) Texture and shape memory behavior of Ti–
22Nb–6Ta alloy. Acta Mater 54:423–433
81. Inamura T, Hosoda H, Miyazaki S (2013) Incompatibility and
preferred morphology in the self-accommodation microstructure
of b-titanium shape memory alloy. Phil Mag 93:618–634
82. Inamura T, Hosoda H, Kim HY, Miyazaki S (2010) Anti-phase
boundary-like stacking fault in a00-martensite of disordered
crystal structure in b-titanium shape memory alloy. Phil Mag
90:3475–3498
83. Tahara M, Kim HY, Inamura T, Hosoda H, Miyazaki S (2011)
Lattice modulation and superelasticity in oxygen-added b-Ti
alloys. Acta Mater 59:6208–6218
84. Kim HY, Wei LS, Kobayashi S, Tahara M, Miyazaki S (2013)
Nanodomain structure and its effect on abnormal thermal
expansion behavior of a Ti–23Nb–2Zr–0.7Ta–1.2O alloy. Acta
Mater 61:4874–4886
85. Tahara M, Kanaya T, Kim HY, Inamura T, Hosoda H, Miyazaki
S (2014) Heating-induced martensitic transformation and time-
dependent shape memory behavior of Ti–Nb–O alloy. Acta
Mater 80:317–326
86. Wei LS, Kim HY, Miyazaki S (2015) Effects of oxygen con-
centration and phase stability on nano-domain structure and
thermal expansion behavior of Ti–Nb–Zr–Ta–O alloys. Acta
Mater 100:313–322
87. Tahara M, Inamura T, Kim HY, Miyazaki S, Hosoda H (2016)
Role of oxygen atoms in a00 martensite of Ti–20at%Nb alloy. Scr
Mater 112:15–18
88. Wei LS, Kim HY, Koyano T, Miyazaki S (2016) Effects of
oxygen concentration and temperature on deformation behavior
of Ti–Nb–Zr–Ta–O alloys. Scr Mater 123:55–58
89. Tahara M, Kim HY, Miyazaki S (2008) Effect of N addition on
superelastic behavior of Ti–Zr–Nb alloys. J Jpn Inst Met
72:955–959
90. Tahara M, Kim HY, Hosoda H, Nam TH, Miyazaki S (2010)
Effect of nitrogen addition and annealing temperature on
superelastic properties of Ti–Nb–Zr–Ta alloys. Mater Sci Eng A
527:6844–6852
91. Al-Zain Y, Kim HY, Miyazaki S (2015) Effect of B addition on
the microstructure and superelastic properties of a Ti–26Nb
alloy. Mater Sci Eng A 644:85–89
92. Kim HY, Miyazaki S (2015) Martensitic transformation and
superelastic properties of Ti–Nb base alloys. Mater Trans
56:625–634
93. Pavon LL, Kim HY, Hosoda H, Miyazaki S (2015) Effect of Nb
content and heat treatment temperature on superelastic proper-
ties of Ti–24Zr–(8–12)Nb–2Sn alloys. Scr Mater 95:46–49
94. Fu J, Yamamoto A, Kim HY, Hosoda H, Miyazaki S (2015)
Novel Ti-base superelastic alloys with large recovery strain and
excellent biocompatibility. Acta Biomater 17:56–67
95. Kim HY, Fu J, Tobe H, Kim JI, Miyazaki S (2015) Crystal
structure, transformation strain, and superelastic property of Ti–
Nb–Zr and Ti–Nb–Ta alloys. Shape Mem Superelasticity
1:107–116
96. Tobe H, Kim HY, Inamura T, Hosoda H, Miyazaki S (2014)
Origin of 332 twinning in metastable -Ti alloys. Acta Mater
64:345–355
97. Buenconsejo PJ, Hosoda H, Kim HY, Miyazaki S (2009) Shape
memory behavior of Ti–Ta and its potential as high temperature
shape memory alloy. Acta Mater 57:1068–1077
98. Buenconsejo PJ, Kim HY, Miyazaki S (2009) Effect of ternary
alloying elements on the shape memory behavior of Ti–Ta
alloys. Acta Mater 57:2509–2515
99. Buenconsejo PJ, Kim HY, Miyazaki S (2011) Novel b-TiTaAl
alloys with excellent cold-workability and stable high temper-
ature shape memory effect. Scr Mater 64:1114–1117
100. Kim HY, Fukushima T, Buenconsejo PJ, Nam TH, Miyazaki S
(2011) Martensitic transformation and shape memory properties
of Ti–Ta–Sn high temperature shape memory alloys. Mater Sci
Eng A 528:7238–7246
101. Miyazaki S, Kim HY, Hosoda H (2006) Development and
characterization of Ni-free Ti-base shape memory and supere-
lastic alloys. Mater Sci Eng A 438–440:18–24
102. Kim HY, Miyazaki S (2016) Several issues in the development
of Ti-Nb-based shape memory alloys. Shape Mem Superelas-
ticity 2:380–390
103. Miyazaki S, Otsuka K, Manufacturing method of Ti–Ni-based
superelastic materials. Japanese patent filed in 1982 and paten-
ted in 1990. Patent No 1853326 Inventors
104. Yoneyama T, Miyazaki S (eds) (2009) Shape memory alloys for
biomedical applications. Elsevier. ISBN: 9781845693442.
https://www.elsevier.com/books/shape-memory-alloys-for-biom
edical-applications/yoneyama/978-1-84569-344-2
105. Yamauchi K, Ohkata I, Tsuchiya K, Miyazaki S (eds) (2011)
Shape memory and superelastic alloy: Applications and tech-
nologies. Elsevier. ISBN: 9781845697075. https://www.else
vier.com/books/shape-memory-and-superelastic-alloys/yamau
chi/978-1-84569-707-5
106. Miyazaki S, Fu YQ, Huang WM (eds) (2009) Thin film shape
memory alloys: Fundamentals and device applications. Cam-
bridge University Press. ISBN: 9780521885768. http://www.
cambridge.org/jp/academic/subjects/engineering/electronic-
optoelectronic-devices-and-nanotechnology/thin-film-shape-
memory-alloys-fundamentals-and-device-applications?format=HB
&isbn=9780521885768#4m5mh8GwY5TJQwuh.97
314 Shap. Mem. Superelasticity (2017) 3:279–314
123