myanmar climate report - meteorologisk institutt · old bagan, myanmar. photo: sven scheuermeier...
TRANSCRIPT
Myanmar Climate Report Dr Lai Lai Aung1, Mrs Ei Ei Zin1, Ms Pwint Theingi1, Ms Naw
Elvera1, Ms Phyu Phyu Aung1, Ms Thu Thu Han1, Ms Yamin Oo1, and Dr Reidun Gangstø Skaland2
1Department of Meteorology and Hydrology Myanmar, Ministry of Transport and Communications, Government of the Republic of the Union of Myanmar 2Norwegian Meteorological Institute, Norway
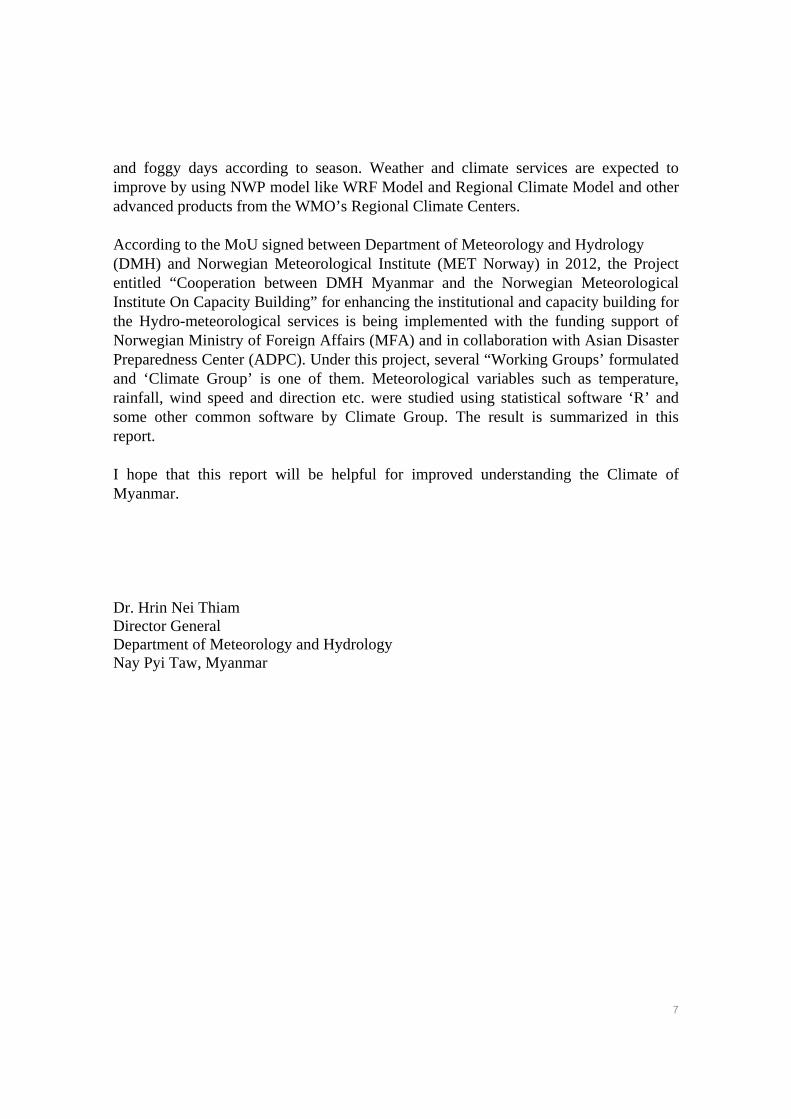
Old Bagan, Myanmar. Photo: Sven Scheuermeier
METreportNo. 9/2017
ISSN 2387-4201Climate

MET report
Title Myanmar Climate Report
Date 14.09.2017
Sections Climate, Record and Research Section, DMH (Yangon), Division for climate services (MET)
Report no. No. 9/2017
Author(s) Lai Lai Aung, Ei Ei Zin, Pwint Theingi, Naw Elvera, Phyu Phyu Aung, Thu Thu Han, Yamin Oo and Reidun Gangstø Skaland
Classification ● Free ○ Restricted
Abstract Myanmar is situated in the tropical climate region, a region that is highly vulnerable to impacts from climate change. Therefore, information about climate change in Myanmar is in high demand. In this report, changing of various observed climate parameters were estimated and analyzed. New normal values for minimum and maximum temperature and rainfall, as well as for monsoon onset and withdrawal dates, were calculated for the period 1981-2010. Normal monthly mean temperature and rainfall values for the whole country of Myanmar were calculated for the new normal period and compared to values of the previous normal period 1961-1990. Frequency of days for different ranges of temperature and rainfall were computed, in addition to frequency of 10 years wind direction and wind speed. Trends of minimum and maximum temperature were also calculated and analyzed. From 1961-1990 to 1981-2010, the maximum temperature has increased at almost every station of Myanmar, whereas the minimum temperature has decreased at most of the stations. The average normal maximum temperature for the whole country of Myanmar has increased for all months, except February and December. The normal annual mean maximum temperature increased by 0.5 °C from 1961-1990 to 1981-2010. The average normal minimum temperature of Myanmar has decreased for the months January-May and September-December, while it has not changed significantly for the months June-August. The normal rainfall pattern has decreased for the months May-August, for the other months it has not changed significantly. In the pre-monsoon and mid-monsoon seasons, the amount of rainfall has decreased over the whole country, while it has been unchanged in the months of winter and post-monsoon seasons over Myanmar, from 1961-1990 to 1981-2010. In the new normal period, the onset date of the monsoon is later and the withdrawal date is earlier than in the old normal period, which means that the duration of the rainy season has decreased. The normal duration of the monsoon period was 144 days in the period 1961-1990 and 121 days in the period of 1981-2010. Compared to the new normal (1981 to 2010) duration of monsoon period, trend studies indicate however a possible increase in the duration of the rainy season in the recent years, and more studies of long-term rainfall trends are needed.
Keywords Climate, Rainfall, Temperature, Monsoon, Normal values, Wind speed and direction.
Disiplinary signature Responsible signature

6
Forward Message
Myanmar is located between 9˚ 32' N and 28˚ 31' N latitude and 92˚ 10' E and 101˚ 11' E longitude. It has composes of (14) States and Regions, while it can be classified as meteorologically aspects by Coastal Mountainous Area, Deltaic Area, Central Dry Zone, Shan Plateau and Northern Highland Area. These areas have the different Climatic characters on Annual Rainfall and Temperature based on Location, Altitude and nature of Geography. Some of the station shows Double Peak in Annual rainfall while others show single Mode in Rainfall and/or Thundery activity. Moreover, Myanmar is situated at the NE parts of the Bay of Bengal and North of Andaman Sea, so there are some of the weather disturbances such as Cyclone, very destructive power to the Coastal areas of Landfall points, passage of Western disturbances from the NE India and Easterly Waves from Thailand and activity of Typhoon Remnants from the China Sea towards Myanmar; accentuate the aspect of Local Climate. Likewise, Myanmar has also clear evident of the Abnormal Climatic conditions mostly after 1980s such as abnormal cyclone landfall, late Monsoon Onset, early Monsoon withdrawal, variation in Monsoon strength and Monsoon Rainfall, increase of summer Temperature, winter Temperature. Moreover, Myanmar also links with the Regional Climatic teleconnection with some atmospheric oscillation like El Nino and La Nina linkage with modulation of warm and cool sea surface temperature abnormalities. Severity and duration of this abnormal regional climatic pattern strongly influence the Climate of Myanmar. Myanmar Department of Meteorology and Hydrology (DMH) under the supervision of Ministry of Transport and Communications, as a member of WMO since (1947) is mandated to observe, analyze, predict, and provide warning services for weather and climate related hazards including hazards of geologic and oceanic origins, to contribute to the safe and socio-economic benefit of welfare of communities through, among others, protection of lives and properties, reduction of the impacts of natural hazards, and sustainable resource management and development. Its main responsibility is to provide the timely, effective early warning of weather related hazards and other information to decision makers, Policy makers, Disaster Management related agencies and other various users by cooperation with the World Meteorological Organization. Forecast products comprise Bay of Bengal condition, Cyclone Frequency, Rainfall anomaly, Temperature anomaly, timing of Monsoon onset and withdrawal, rainy days
7
and foggy days according to season. Weather and climate services are expected to improve by using NWP model like WRF Model and Regional Climate Model and other advanced products from the WMO’s Regional Climate Centers. According to the MoU signed between Department of Meteorology and Hydrology (DMH) and Norwegian Meteorological Institute (MET Norway) in 2012, the Project entitled “Cooperation between DMH Myanmar and the Norwegian Meteorological Institute On Capacity Building” for enhancing the institutional and capacity building for the Hydro-meteorological services is being implemented with the funding support of Norwegian Ministry of Foreign Affairs (MFA) and in collaboration with Asian Disaster Preparedness Center (ADPC). Under this project, several “Working Groups’ formulated and ‘Climate Group’ is one of them. Meteorological variables such as temperature, rainfall, wind speed and direction etc. were studied using statistical software ‘R’ and some other common software by Climate Group. The result is summarized in this report. I hope that this report will be helpful for improved understanding the Climate of Myanmar. Dr. Hrin Nei Thiam Director General Department of Meteorology and Hydrology Nay Pyi Taw, Myanmar
8
Abstract
Myanmar is situated in the tropical climate region, a region that is highly vulnerable to impacts from climate change. Therefore, information about climate change in Myanmar is in high demand. In this report, changing of various observed climate parameters were estimated and analyzed. New normal values for minimum and maximum temperature and rainfall, as well as for monsoon onset and withdrawal dates, were calculated for the period 1981-2010. Normal monthly mean temperature and rainfall values for the whole country of Myanmar were calculated for the new normal period and compared to values of the previous normal period 1961-1990. Frequency of days for different ranges of temperature and rainfall were computed, in addition to frequency of 10 years wind direction and wind speed. Trends of minimum and maximum temperature were also calculated and analyzed. From 1961-1990 to 1981-2010, the maximum temperature has increased at almost every station of Myanmar, whereas the minimum temperature has decreased at most of the stations. The average normal maximum temperature for the whole country of Myanmar has increased for all months, except February and December. The normal annual mean maximum temperature increased by 0.5 °C from 1961-1990 to 1981-2010. The average normal minimum temperature of Myanmar has decreased for the months January-May and September-December, while it has not changed significantly for the months June-August. The normal rainfall pattern has decreased for the months May-August, for the other months it has not changed significantly. In the pre-monsoon and mid-monsoon seasons, the amount of rainfall has decreased over the whole country, while it has been unchanged in the months of winter and post-monsoon seasons over Myanmar, from 1961-1990 to 1981-2010. In the new normal period, the onset date of the monsoon is later and the withdrawal date is earlier than in the old normal period, which means that the duration of the rainy season has decreased. The normal duration of the monsoon period was 144 days in the period 1961-1990 and 121 days in the period of 1981-2010. Compared to the new normal (1981 to 2010) duration of monsoon period, trend studies indicate however a possible increase in the duration of the rainy season in the recent years, and more studies of long-term rainfall trends are needed.
9
Table of contents
1 Introduction 11
2 Geography 12
3 Climate of Myanmar 13
3.1 Climate Seasons 14
3.1.1 Winter or Northeast monsoon season (November - February) 14
3.1.2 Summer or Hot weather season (March - Mid May) 14
3.1.3 Rainy or Southwest monsoon season (Mid May - October) 15
4 Weather Observations in Myanmar 17
4.1 Department of Meteorology and Hydrology (DMH) 17
4.2 Observational stations at DMH 18
4.2.1 Basic Observation Network 18
5 Myanmar Climate Normals (1981-2010) 26
5.1 Temperature 26
5.1.1 Maximum Temperature 26
5.1.2 Minimum Temperature 29
5.2 Rainfall 33
6 Frequency of common weather in Myanmar 37
6.1 Temperature 37
6.1.1 Minimum Temperature 37
6.1.2 Maximum Temperature 41
6.2 Rainfall 44
7 Wind roses for different season in Myanmar 48
8 Detected changes in Myanmar Climate 54
8.1 Temperature Trends 54
10
8.2 Seasonal change of Rainfall and Temperature 57
8.2.1 Rainfall 57
8.2.2 Temperature 58
8.3 Monsoon 60
9 Conclusions 63
Acknowledgements 65
Appendix 66
List of figures 98
List of tables 102
References 105
11
1 Introduction
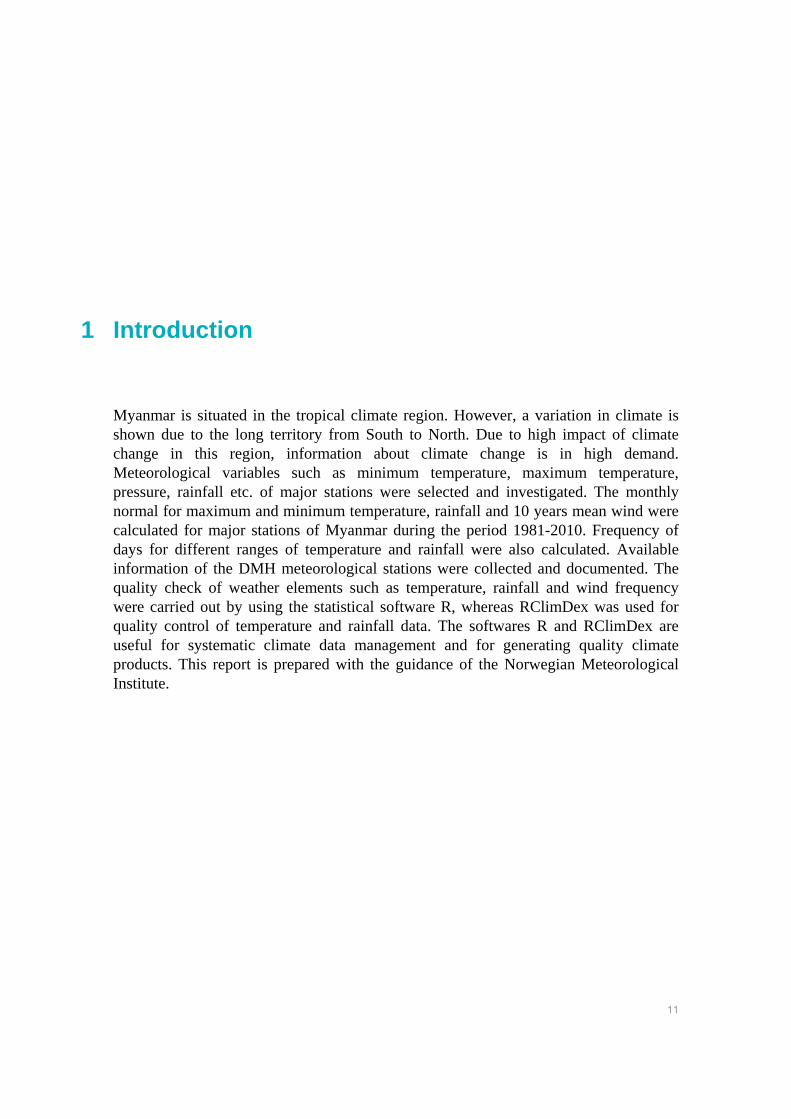
Myanmar is situated in the tropical climate region. However, a variation in climate is shown due to the long territory from South to North. Due to high impact of climate change in this region, information about climate change is in high demand. Meteorological variables such as minimum temperature, maximum temperature, pressure, rainfall etc. of major stations were selected and investigated. The monthly normal for maximum and minimum temperature, rainfall and 10 years mean wind were calculated for major stations of Myanmar during the period 1981-2010. Frequency of days for different ranges of temperature and rainfall were also calculated. Available information of the DMH meteorological stations were collected and documented. The quality check of weather elements such as temperature, rainfall and wind frequency were carried out by using the statistical software R, whereas RClimDex was used for quality control of temperature and rainfall data. The softwares R and RClimDex are useful for systematic climate data management and for generating quality climate products. This report is prepared with the guidance of the Norwegian Meteorological Institute.
12
2 Geography
Myanmar is roughly located between between 9˚ 32' N and 28˚ 31' N latitude and 92˚ 10' E and 101˚ 11' E longitude. It is bounded on the North by China, on the West by India and Bangladesh, on the East by Thailand and Laos PDR and in the South there is Bay of Bengal and Andaman Sea. There are about 60 rivers in Myanmar. Most of the rivers flow to the Bay of Bengal from North to South. The main rivers are Ayeyarwaddy, Chindwin, Sittaung and Thanlwin. The coastline of Myanmar is about 1470 km along the continental shelf which has a shallow bathymetry at the Deltaic. The entire area of Myanmar is about 676577 sq. km. The population is about 52 millions of which about 77% live in the rural areas.
13
3 Climate of Myanmar
The climate of Myanmar is determined mainly by its geographical position. It lies in the South of the great Asiatic continent and to the North of the Indian Ocean. Myanmar is separated from neighbouring countries by high mountain walls. In the extreme North lies the great Himalaya mountain and in the Northwest lies the jungle clad hills of the Pakistan, the Chin Hills and the Yomas with an average height or between 6000 ft to 12000 ft, separating Myanmar from India. Myanmar is one of the largest rice producing countries in the world. The country is composed of low-lying plain land, hilly area in the North, Northwest, West and East regions. The great Himalayan Range is to the North and the Indian Ocean and Bay of Bengal is to the South. Myanmar is one of the exemplifications of monsoon countries. Within Myanmar itself there are important features of relief which exert a dominant influence on its meteorology. The country is significantly made up of a great low land plain of Central Myanmar that formed by the valleys of the Ayeyarwaddy. The Rakhine Yoma runs from North to South parallel to the West coast of Myanmar and the BagoYoma runs along from North to South separating the Rakhine Yoma from the Central Myanmar valley area and Sittaung valley from the Shan plateau and Northern ranges of Tanintharyi mountains. Due to the diversity of relief, there are many striking contrasts of meteorological conditions in different parts of the country. In the Central part of the country lies an area with an annual average rainfall of 30 inches (762 mm) and certain parts of the coastal region receives an annual average rainfall of 200 inches (5080 mm). The mean maximum temperature of about 100°F (37.8°C) is found in Central Myanmar area during the months of March and April and the mean minimum temperature of 40°F (4.4°C) to 50°F (10.0°C) is found to occur in the Northern part of Myanmar during January and February. The country has experiences with meteorological, hydrological and seismic hazards. The Great Sittwe Cyclone of 1968, the Pathein Cyclone of 1975, the Gwa Cyclone 1982, the Maungdaw Cylone of 1994, the Cyclone Mala of 2006, the Cyclone Nargis of
14
May 2008, the effect of the Cyclone Koman (crossed Bangladesh coast) and the historical flood of year 2004, 2010 and 2015 were all extreme meteorological and hydrological events.
3.1 Climate Seasons
Myanmar is situated in the tropical monsoon climate region. Based on the analysis of pressure, rainfall and temperature, the climate of this country can be described under the following four seasons:
3.1.1 Winter or Northeast monsoon season (November - February)
Almost like a tap turning off, November sees a sudden cessation of the monsoon rains in Myanmar. Clear weather generally set in over the country in November. The cold season begins over Myanmar in Mid November. In this season low temperatures prevail over the whole country. Clear sky, fine weather, low humidity and temperature and a large diurnal variation of temperatures are the usual features of the weather. From about the middle of December the serenity of the weather in Northern Myanmar is broken at intervals by a series of disturbances which travel Eastwards across Northern Myanmar. The number and character of these disturbances vary, but on the average four to six disturbances may be expected in each of the months of January and February. The precipitation associated with them is small in amount but very important for the winter crops of Northern Myanmar area. Some of the disturbances give rain over the whole of the Northern Myanmar while others confine their activities to the extreme North.
3.1.2 Summer or Hot weather season (March - Mid May)
This is a period of continuous and rapid rise of temperature. In March and April the highest day temperature of 100° F (37.8°C) and above occur in Central and Lower Myanmar areas. During this period of rising temperatures, the winds are variable with much less steadiness and persistence. The whole Bay of Bengal is almost calm and relax totally insignificant in storm formation. There is no storm in the past which cross the Myanmar coast during these months. By April, important changes take place in the surface air movements over Myanmar. Along the coastal region the air circulation is characterized by increasing land and sea winds. The temperatures dramatically increase all over the country starting from the Deltaic to the North up to the Central Area. The hottest area is in the rain shadow area of Central Myanmar during April when maximum temperature commonly ranges between (95°F) 35°C and (104°F) 40°C. Violent local storms form in the region during May. These storms are often accompanied by violent winds, hail and torrential rain. Cyclonic storms and depressions also form during May in South Bay of Bengal and these usually head towards Rakhine and the East Bangladesh coasts during the final stages of their journey.
15
3.1.3 Rainy or Southwest monsoon season (Mid May - October)
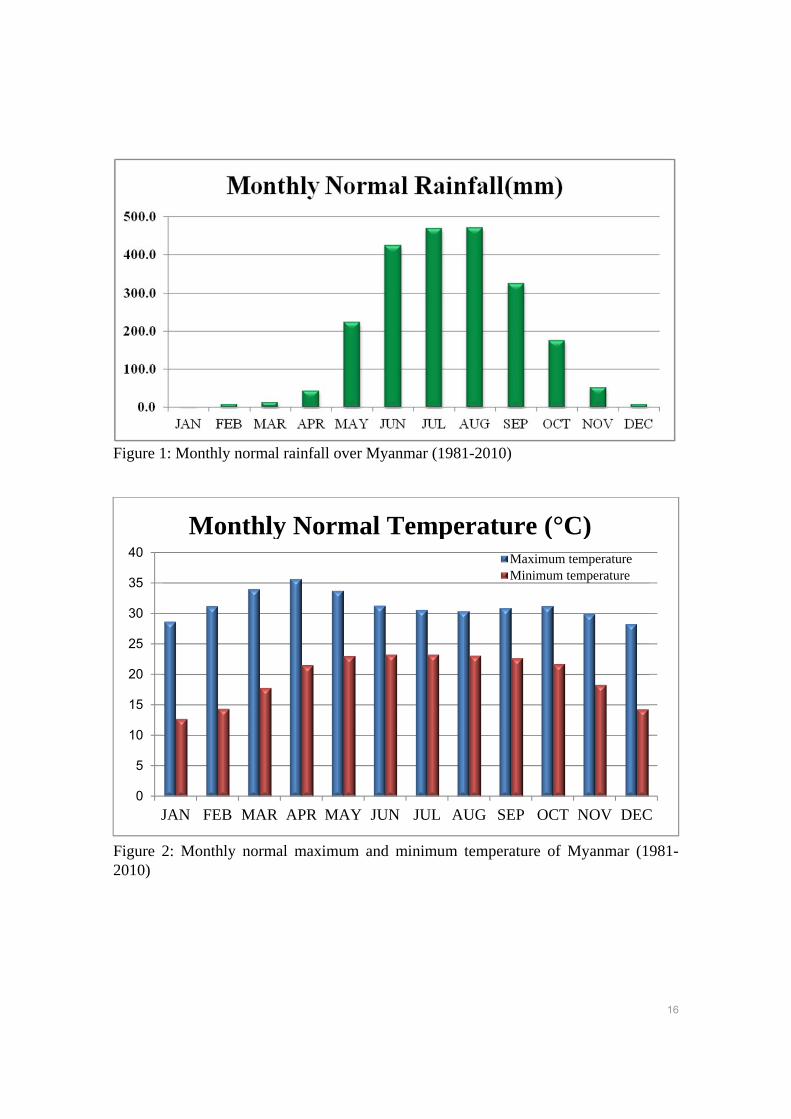
The Southwest Monsoon is divided into 4 parts, pre monsoon (Mid April to start onset date), early monsoon (June), mid or peak monsoon (July, August), late monsoon (September to withdrawal date) and post monsoon (October, November). Southwest monsoon makes its appearance in lower Myanmar about the third week of May. It gradually extends northwards and is usually established over the whole country by about the first week of June. It is the rain-bearing current for Myanmar. The mountain ranges over the West coast along Rakhine and Tanintharyi Regions give copious rain along the coastal area with an average annual rainfall of about 200 inches (5080 mm). The low land of Deltaic area receives somewhat less rain with an average annual rainfall of about 100 inches (2540 mm). However, the rain shadowing effect caused by the Yomas in Central Myanmar leaves the area with an annual amount of rainfalls as low as about 25 inches (635 mm). During the early monsoon period depressions form in succession confined in the North Bay of Bengal and cause widespread rains along the coastal area. In the mid monsoon period, the strength of the monsoon and the accompanying rainfall increases from June to August and rainfall decreases in late monsoon period, September in coastal areas. The Central Myanmar area has double maxima rainfall in May, September and October. The monsoon begins to retreat about the middle of September. The total rainfall of the monsoon season is about 200 inches (5080 mm) in the coastal area and decreases to about 25 inches (635mm) in Central Myanmar. The Southwest monsoon retreats from Myanmar about the end of September. During this season, the rainfall decreases appreciably in the whole country except the Central region where the rainfall is at its peak due to the passage of remnant of monsoon depressions from the Bay of Bengal after crossing the Rakhine and Bangladesh coasts. In the post monsoon period (October) and the early northeast monsoon season (November), the frequency of storms and depression is at a maximum during this season and these usually form in the South Bay and usually cross toward West or Northwest.
16
Figure 1: Monthly normal rainfall over Myanmar (1981-2010)
Figure 2: Monthly normal maximum and minimum temperature of Myanmar (1981-2010)
0
5
10
15
20
25
30
35
40
JAN FEB MAR APR MAY JUN JUL AUG SEP OCT NOV DEC
Maximum temperatureMinimum temperature
Monthly Normal Temperature (°C)
17
4 Weather Observations in Myanmar
4.1 Department of Meteorology and Hydrology (DMH)
The Department of Meteorology and Hydrology Myanmar (DMH) is a Government Organization under the administrative control of the Ministry of Transport and Communications. DMH was established at the 1st April 1937 in the Yangon Region first as the Burma Meteorological Department (BMD) and the 1st observatory was established at Kaba-Aye, Yangon. BMD was a member country of the World Meteorological Organization (WMO), when it organized 21st March 1951, and Director General of BMD was a Permanent Representative of Myanmar with WMO. At that time, the BMD served its duty with four officers and 22 staffs. After 1972, BMD reformed as the Department of Meteorology and Hydrology (DMH) and it supports the National project plan providing with meteorological, hydrological and seismological data. It also serves in the field of prevention on natural disaster, saving life and properties of public by issuing early warning. DMH is responsible for all tasks related to meteorological, hydrological and seismological fields in Myanmar. Main works performed by DMH are routine observation and analysis of meteorological and hydrological phenomena and providing weather information to the general public. Those tasks and services are performed real time and continuously for 24 hours every day. DMH’s main responsibility is to monitor and issue forecasts and warnings of all meteorological extreme events like tropical cyclones, severe thunderstorms/tornadoes, heavy rainfall events, droughts, cold and heat waves etc… along with daily routine forecasts round the clock. Therefore, more reliable and timely warnings are the main requirements of Myanmar. DMH held their diamond jubilee anniversary on the date of 23rd March 2012. Since 1992-1993, DMH cooperated and collaborated with Yangon and Dagon Universities for B. Sc. Meteorology and Hydrology (Honors) students in accordance with the supervision and advice of Secretary General of WMO. DMH has a milestone for establishing of mini studio and shooting for daily weather news.
18
4.2 Observational stations at DMH
4.2.1 Basic Observation Network
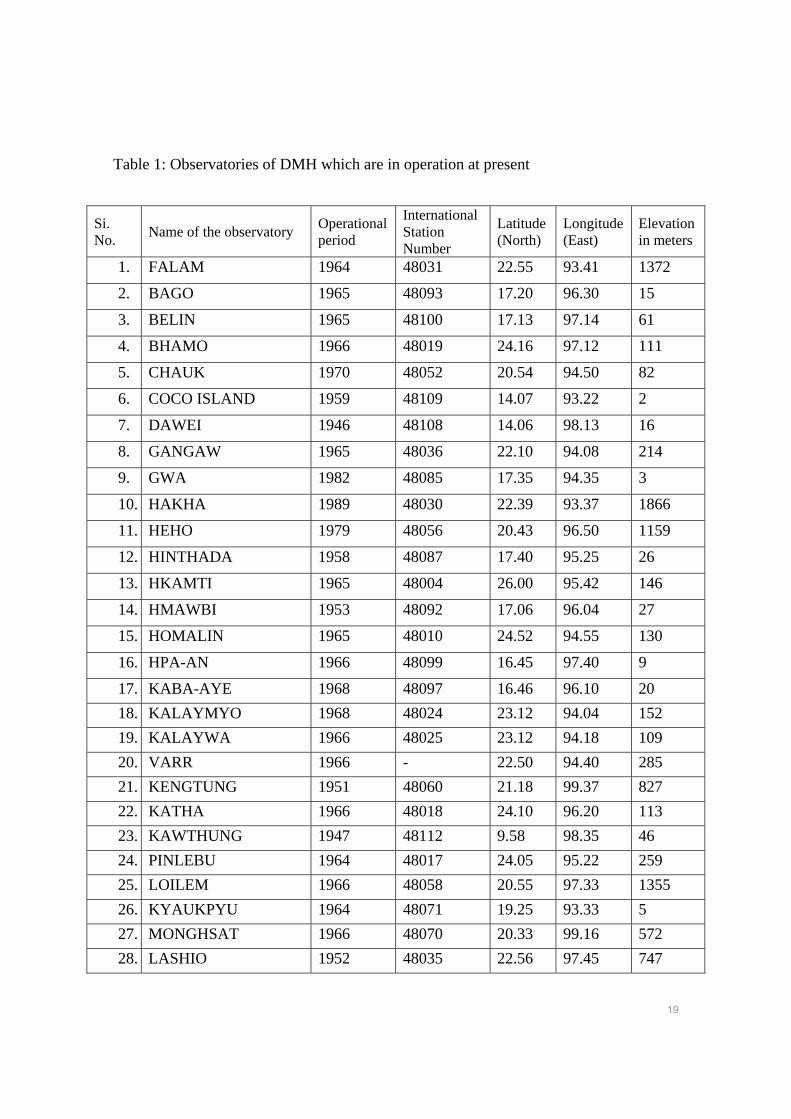
A total of 117 synoptic stations are in operation at DMH. There is 1 upper air (Radiosonde) station at Kaba-Aye, Yangon. According to the WMO guide line in 1947, there were 8 observatories for basic Meteorological data, also there were some part time observatories during that time. The number of observatories increased to 25 after 1960 and by gradual addition the total number of observatories was 77 in 1980. Later on, some observatories were established and at present the total number is 117. In this study, data of only 78 observatories were considered. The raw data were archived in CDs, DVDs and hard disks. The data before 1965 were not available at DMH. All observed data are received and gathered at the National Meteorological Communication Centre, Kaba-Aye and transmitted through GTS link to RSMC New Delhi (India), Bangkok (Thailand) and vice-versa. Some details of the DMH’s observatories are given below: Observatories established during 1947-1959: Lashio, Mandalay, Myeikhtila, Taunggyi, Kengtung, Sittwe, Thandwe, Hinthada, Tharrawady, Hmawbi, Pathein, Maubin, Mingalardon, Mawlamyine, Dawei, Co Co Island, Myeik, Kawthong Observatories established after 1964: Putao, Hkamti, Myitkyina, Homalin, Pinlebu, Katha, Bhamo, Mawlaik, Kalay, Kalaywa, Falam, Shwebo, Gangaw, Monywa, Sagaing, Thipaw, Mindat, Pakokku, Myingyan, NyaungOo (Met), Loilem, Yamethin, Pinlaung, Minghsat, Kyaukpyu, Pyinmana, Loikaw, Pyay, Taunggu (Met), Shwegyin, Hpa-an, Bago, Kaba-Aye, Belin, Yay, Var, Taunggu(Air), Theinzayat, Minbu. Observatories established after 1970: Mohmyin, Tamu, Minkin, Kanbalu, Hakha, Yay Oo, Moekok, Pyinoolwin, Paletwa, Moekaung, Kyauktaw, Chauk, Heho, Namsam, Maungdaw, Sinphyugyun, Magway, Taungdwingyi, Ann, Aunglan, Gyobinkauk, Phyu, Gwa, Ngathaingyaung, Thaton, Phyarpon, Kawkayeik, Kyeikkheme, Machanbaw, Ranthalo, Tedim, Kyaukme, Naungcho, Moemeik, Kyemon, Myinmu, Chebuda, Taungkok, Hpa-an (Agro), Lunkyaw, Hlaingtat, NyaungOo (Air), Yazin, Tatkong, Tadaoo, Pauk, Laytatpyin, Zaungtu, Khamon, Nyaunglaypin, Tagontaing, Myaungmya, Hmawbi(Agro), Khayan, Mudon, Launglon, Zalun, Kyaukse, Naypyitaw, Laputta. Global Transmission Stations: Putao, Hkamti, Myitkyina, Homalin, Katha, Bhamo, Mawlaik, Kalaywa, Hakha, Falam, Shwebo, Moekok, Lashio, Monywa, Sagaing, Mandalay, Pyinoolwin, Mindat, NyaungOo, Meikhtila, Namsam, Taunggyi, Kengtung, Pyinmana, Kyauktaw, Chauk, Sittwe, Minbu, Magway, Kyaukpyu, Manaung, Loikaw, Pyay, Taunggu, Thandwe, Gwa, Hinthada, Hmawbi, Bago, Pathein, Maubin, Mingalardon, Kaba-Aye, Hpa-an, Phyapon, Mawlamyine, Yay, Dawei, Co Co Island, Myeik, Kawthaung.
19
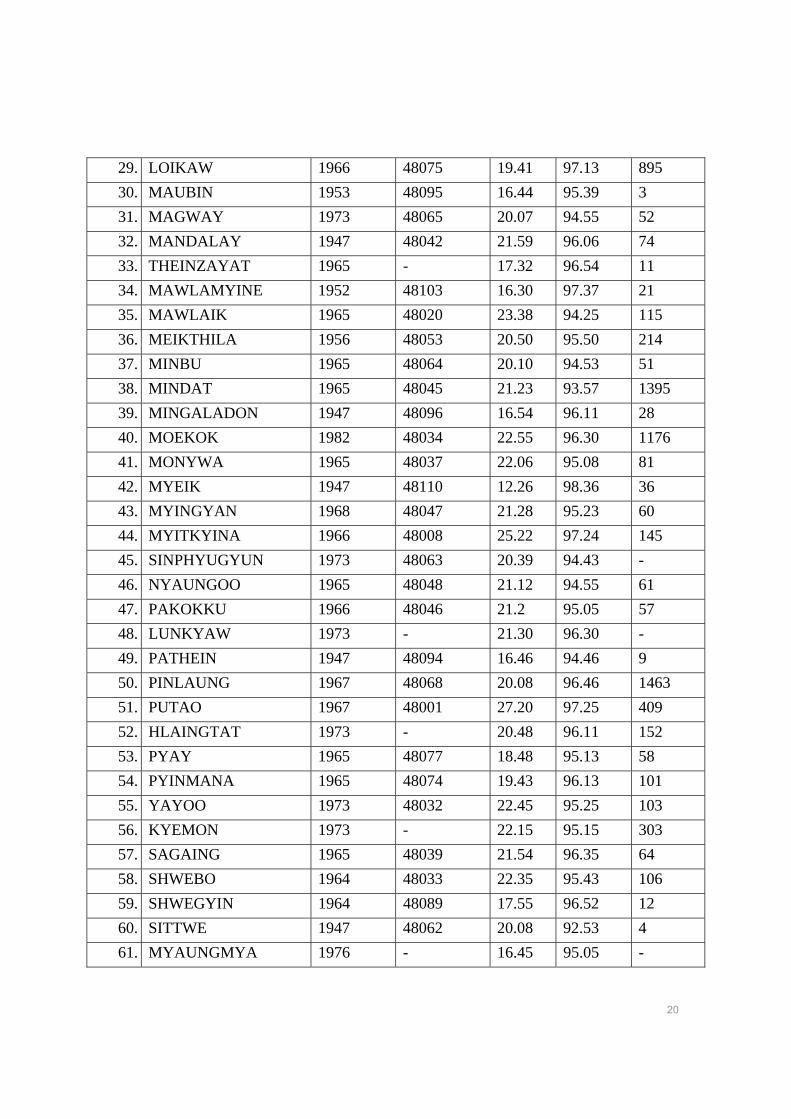
Table 1: Observatories of DMH which are in operation at present
Si. No.
Name of the observatory Operational period
International Station Number
Latitude (North)
Longitude (East)
Elevation in meters
1. FALAM 1964 48031 22.55 93.41 1372
2. BAGO 1965 48093 17.20 96.30 15
3. BELIN 1965 48100 17.13 97.14 61
4. BHAMO 1966 48019 24.16 97.12 111
5. CHAUK 1970 48052 20.54 94.50 82
6. COCO ISLAND 1959 48109 14.07 93.22 2
7. DAWEI 1946 48108 14.06 98.13 16
8. GANGAW 1965 48036 22.10 94.08 214
9. GWA 1982 48085 17.35 94.35 3
10. HAKHA 1989 48030 22.39 93.37 1866
11. HEHO 1979 48056 20.43 96.50 1159
12. HINTHADA 1958 48087 17.40 95.25 26
13. HKAMTI 1965 48004 26.00 95.42 146
14. HMAWBI 1953 48092 17.06 96.04 27
15. HOMALIN 1965 48010 24.52 94.55 130
16. HPA-AN 1966 48099 16.45 97.40 9
17. KABA-AYE 1968 48097 16.46 96.10 20
18. KALAYMYO 1968 48024 23.12 94.04 152
19. KALAYWA 1966 48025 23.12 94.18 109
20. VARR 1966 - 22.50 94.40 285
21. KENGTUNG 1951 48060 21.18 99.37 827
22. KATHA 1966 48018 24.10 96.20 113
23. KAWTHUNG 1947 48112 9.58 98.35 46
24. PINLEBU 1964 48017 24.05 95.22 259
25. LOILEM 1966 48058 20.55 97.33 1355
26. KYAUKPYU 1964 48071 19.25 93.33 5
27. MONGHSAT 1966 48070 20.33 99.16 572
28. LASHIO 1952 48035 22.56 97.45 747
20
29. LOIKAW 1966 48075 19.41 97.13 895
30. MAUBIN 1953 48095 16.44 95.39 3
31. MAGWAY 1973 48065 20.07 94.55 52
32. MANDALAY 1947 48042 21.59 96.06 74
33. THEINZAYAT 1965 - 17.32 96.54 11
34. MAWLAMYINE 1952 48103 16.30 97.37 21
35. MAWLAIK 1965 48020 23.38 94.25 115
36. MEIKTHILA 1956 48053 20.50 95.50 214
37. MINBU 1965 48064 20.10 94.53 51
38. MINDAT 1965 48045 21.23 93.57 1395
39. MINGALADON 1947 48096 16.54 96.11 28
40. MOEKOK 1982 48034 22.55 96.30 1176
41. MONYWA 1965 48037 22.06 95.08 81
42. MYEIK 1947 48110 12.26 98.36 36
43. MYINGYAN 1968 48047 21.28 95.23 60
44. MYITKYINA 1966 48008 25.22 97.24 145
45. SINPHYUGYUN 1973 48063 20.39 94.43 -
46. NYAUNGOO 1965 48048 21.12 94.55 61
47. PAKOKKU 1966 48046 21.2 95.05 57
48. LUNKYAW 1973 - 21.30 96.30 -
49. PATHEIN 1947 48094 16.46 94.46 9
50. PINLAUNG 1967 48068 20.08 96.46 1463
51. PUTAO 1967 48001 27.20 97.25 409
52. HLAINGTAT 1973 - 20.48 96.11 152
53. PYAY 1965 48077 18.48 95.13 58
54. PYINMANA 1965 48074 19.43 96.13 101
55. YAYOO 1973 48032 22.45 95.25 103
56. KYEMON 1973 - 22.15 95.15 303
57. SAGAING 1965 48039 21.54 96.35 64
58. SHWEBO 1964 48033 22.35 95.43 106
59. SHWEGYIN 1964 48089 17.55 96.52 12
60. SITTWE 1947 48062 20.08 92.53 4
61. MYAUNGMYA 1976 - 16.45 95.05 -
21
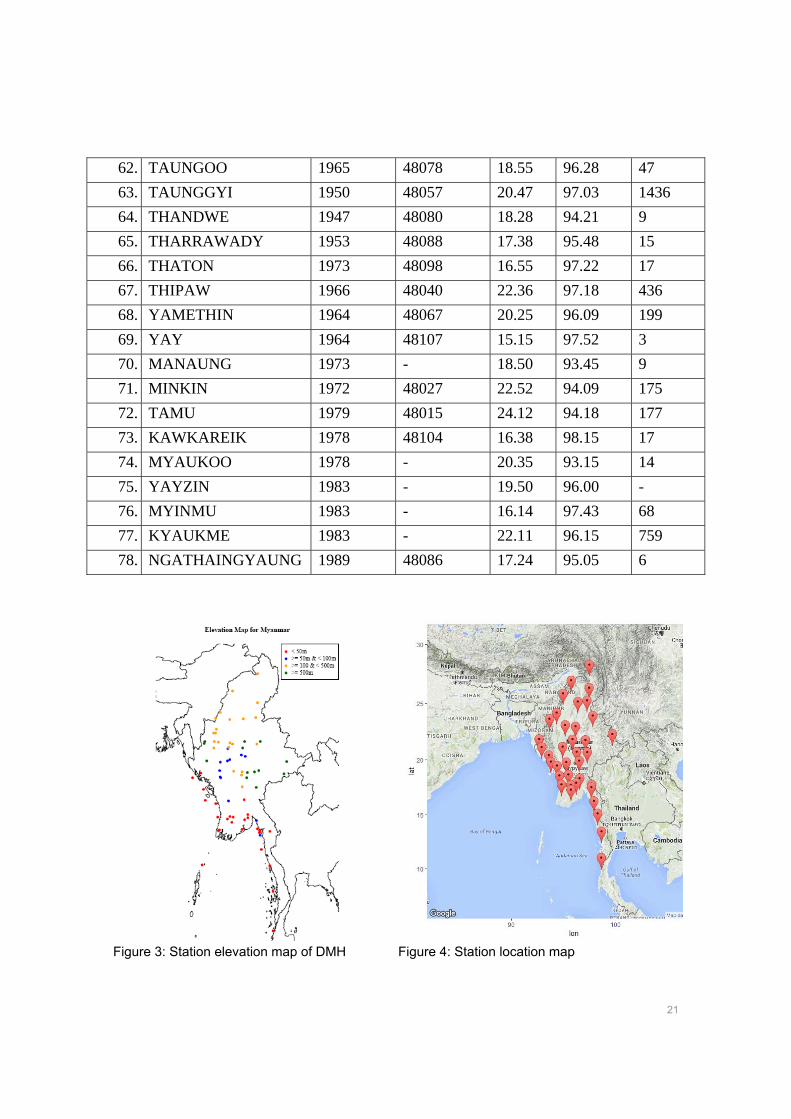
62. TAUNGOO 1965 48078 18.55 96.28 47
63. TAUNGGYI 1950 48057 20.47 97.03 1436
64. THANDWE 1947 48080 18.28 94.21 9
65. THARRAWADY 1953 48088 17.38 95.48 15
66. THATON 1973 48098 16.55 97.22 17
67. THIPAW 1966 48040 22.36 97.18 436
68. YAMETHIN 1964 48067 20.25 96.09 199
69. YAY 1964 48107 15.15 97.52 3
70. MANAUNG 1973 - 18.50 93.45 9
71. MINKIN 1972 48027 22.52 94.09 175
72. TAMU 1979 48015 24.12 94.18 177
73. KAWKAREIK 1978 48104 16.38 98.15 17
74. MYAUKOO 1978 - 20.35 93.15 14
75. YAYZIN 1983 - 19.50 96.00 -
76. MYINMU 1983 - 16.14 97.43 68
77. KYAUKME 1983 - 22.11 96.15 759
78. NGATHAINGYAUNG 1989 48086 17.24 95.05 6
Figure 3: Station elevation map of DMH Figure 4: Station location map
22
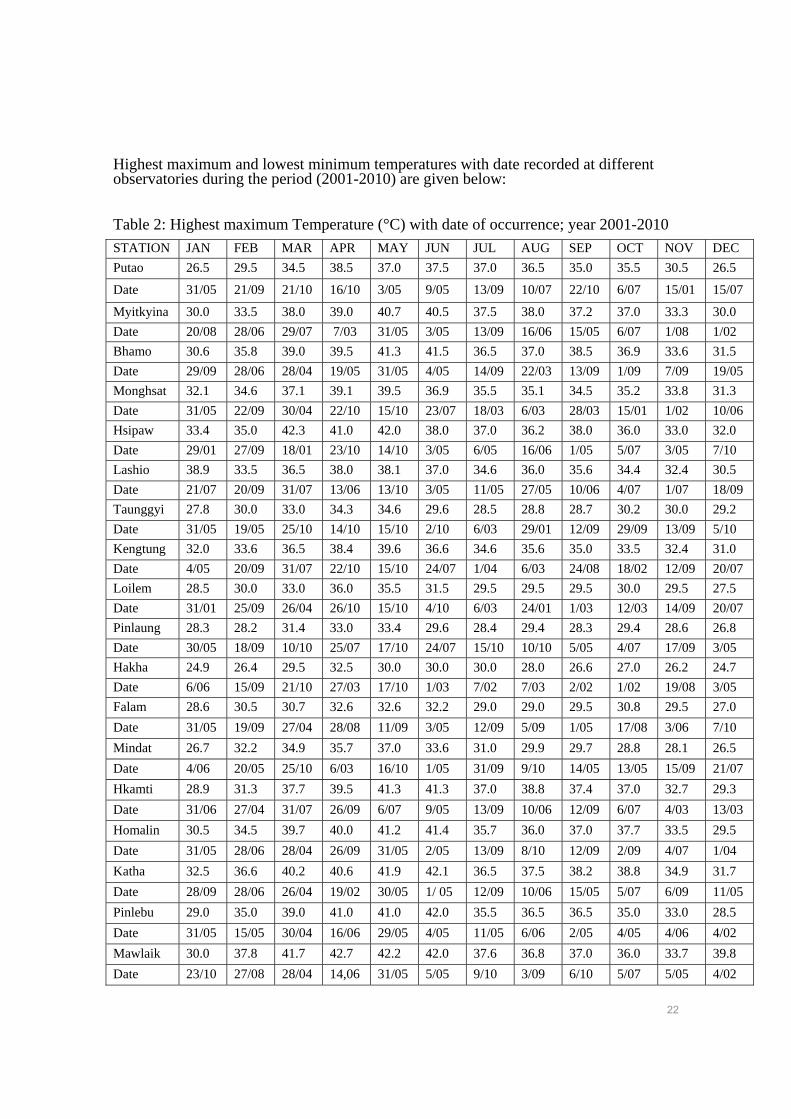
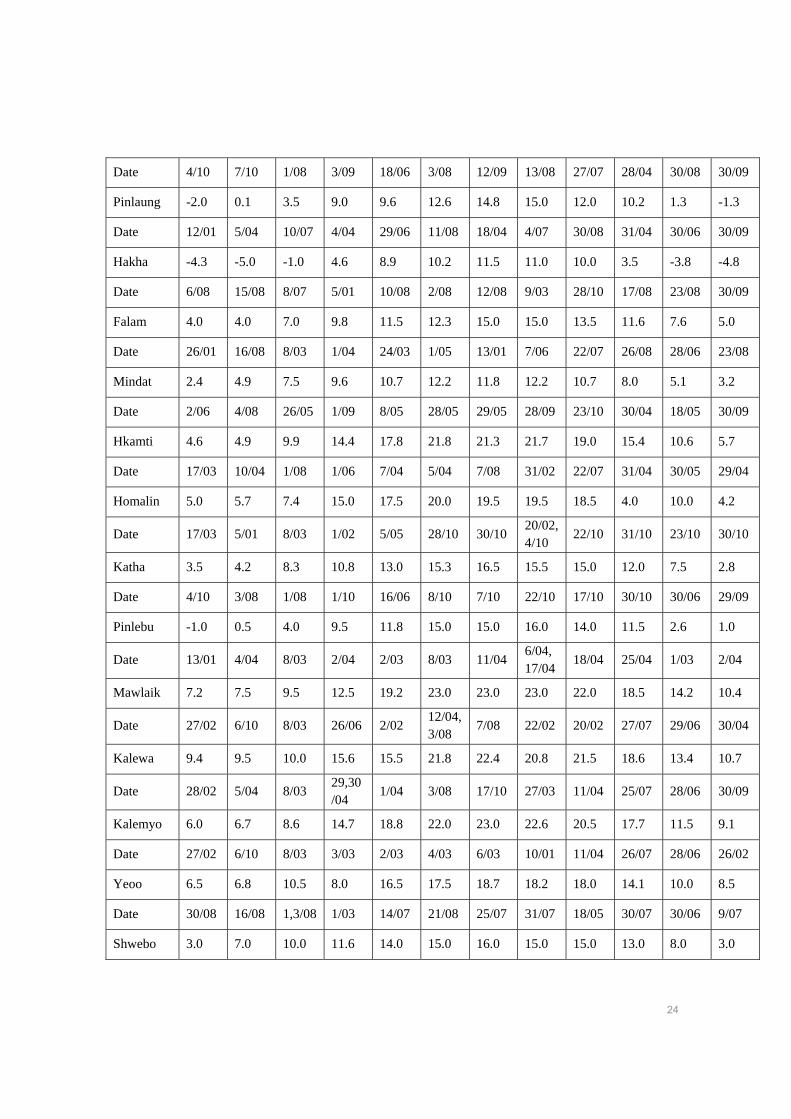
Highest maximum and lowest minimum temperatures with date recorded at different observatories during the period (2001-2010) are given below:
Table 2: Highest maximum Temperature (°C) with date of occurrence; year 2001-2010
STATION JAN FEB MAR APR MAY JUN JUL AUG SEP OCT NOV DEC
Putao 26.5 29.5 34.5 38.5 37.0 37.5 37.0 36.5 35.0 35.5 30.5 26.5
Date 31/05 21/09 21/10 16/10 3/05 9/05 13/09 10/07 22/10 6/07 15/01 15/07
Myitkyina 30.0 33.5 38.0 39.0 40.7 40.5 37.5 38.0 37.2 37.0 33.3 30.0
Date 20/08 28/06 29/07 7/03 31/05 3/05 13/09 16/06 15/05 6/07 1/08 1/02
Bhamo 30.6 35.8 39.0 39.5 41.3 41.5 36.5 37.0 38.5 36.9 33.6 31.5
Date 29/09 28/06 28/04 19/05 31/05 4/05 14/09 22/03 13/09 1/09 7/09 19/05
Monghsat 32.1 34.6 37.1 39.1 39.5 36.9 35.5 35.1 34.5 35.2 33.8 31.3
Date 31/05 22/09 30/04 22/10 15/10 23/07 18/03 6/03 28/03 15/01 1/02 10/06
Hsipaw 33.4 35.0 42.3 41.0 42.0 38.0 37.0 36.2 38.0 36.0 33.0 32.0
Date 29/01 27/09 18/01 23/10 14/10 3/05 6/05 16/06 1/05 5/07 3/05 7/10
Lashio 38.9 33.5 36.5 38.0 38.1 37.0 34.6 36.0 35.6 34.4 32.4 30.5
Date 21/07 20/09 31/07 13/06 13/10 3/05 11/05 27/05 10/06 4/07 1/07 18/09
Taunggyi 27.8 30.0 33.0 34.3 34.6 29.6 28.5 28.8 28.7 30.2 30.0 29.2
Date 31/05 19/05 25/10 14/10 15/10 2/10 6/03 29/01 12/09 29/09 13/09 5/10
Kengtung 32.0 33.6 36.5 38.4 39.6 36.6 34.6 35.6 35.0 33.5 32.4 31.0
Date 4/05 20/09 31/07 22/10 15/10 24/07 1/04 6/03 24/08 18/02 12/09 20/07
Loilem 28.5 30.0 33.0 36.0 35.5 31.5 29.5 29.5 29.5 30.0 29.5 27.5
Date 31/01 25/09 26/04 26/10 15/10 4/10 6/03 24/01 1/03 12/03 14/09 20/07
Pinlaung 28.3 28.2 31.4 33.0 33.4 29.6 28.4 29.4 28.3 29.4 28.6 26.8
Date 30/05 18/09 10/10 25/07 17/10 24/07 15/10 10/10 5/05 4/07 17/09 3/05
Hakha 24.9 26.4 29.5 32.5 30.0 30.0 30.0 28.0 26.6 27.0 26.2 24.7
Date 6/06 15/09 21/10 27/03 17/10 1/03 7/02 7/03 2/02 1/02 19/08 3/05
Falam 28.6 30.5 30.7 32.6 32.6 32.2 29.0 29.0 29.5 30.8 29.5 27.0
Date 31/05 19/09 27/04 28/08 11/09 3/05 12/09 5/09 1/05 17/08 3/06 7/10
Mindat 26.7 32.2 34.9 35.7 37.0 33.6 31.0 29.9 29.7 28.8 28.1 26.5
Date 4/06 20/05 25/10 6/03 16/10 1/05 31/09 9/10 14/05 13/05 15/09 21/07
Hkamti 28.9 31.3 37.7 39.5 41.3 41.3 37.0 38.8 37.4 37.0 32.7 29.3
Date 31/06 27/04 31/07 26/09 6/07 9/05 13/09 10/06 12/09 6/07 4/03 13/03
Homalin 30.5 34.5 39.7 40.0 41.2 41.4 35.7 36.0 37.0 37.7 33.5 29.5
Date 31/05 28/06 28/04 26/09 31/05 2/05 13/09 8/10 12/09 2/09 4/07 1/04
Katha 32.5 36.6 40.2 40.6 41.9 42.1 36.5 37.5 38.2 38.8 34.9 31.7
Date 28/09 28/06 26/04 19/02 30/05 1/ 05 12/09 10/06 15/05 5/07 6/09 11/05
Pinlebu 29.0 35.0 39.0 41.0 41.0 42.0 35.5 36.5 36.5 35.0 33.0 28.5
Date 31/05 15/05 30/04 16/06 29/05 4/05 11/05 6/06 2/05 4/05 4/06 4/02
Mawlaik 30.0 37.8 41.7 42.7 42.2 42.0 37.6 36.8 37.0 36.0 33.7 39.8
Date 23/10 27/08 28/04 14,06 31/05 5/05 9/10 3/09 6/10 5/07 5/05 4/02
23
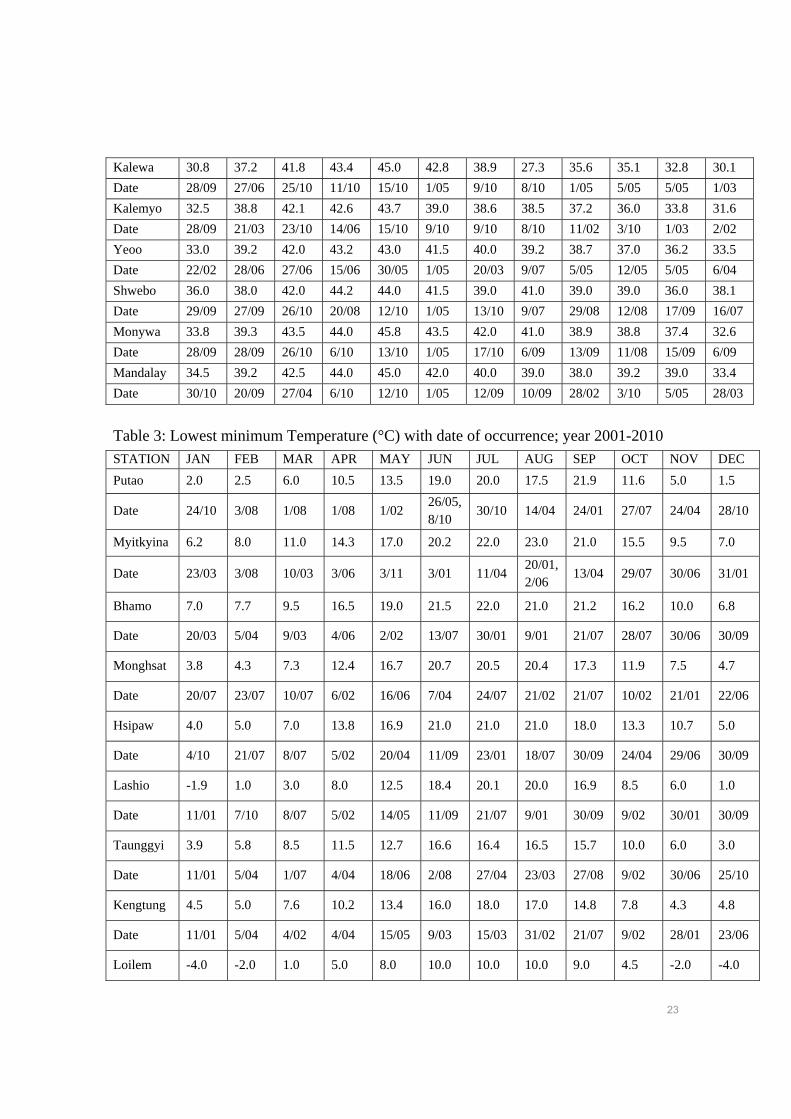
Kalewa 30.8 37.2 41.8 43.4 45.0 42.8 38.9 27.3 35.6 35.1 32.8 30.1
Date 28/09 27/06 25/10 11/10 15/10 1/05 9/10 8/10 1/05 5/05 5/05 1/03
Kalemyo 32.5 38.8 42.1 42.6 43.7 39.0 38.6 38.5 37.2 36.0 33.8 31.6
Date 28/09 21/03 23/10 14/06 15/10 9/10 9/10 8/10 11/02 3/10 1/03 2/02
Yeoo 33.0 39.2 42.0 43.2 43.0 41.5 40.0 39.2 38.7 37.0 36.2 33.5
Date 22/02 28/06 27/06 15/06 30/05 1/05 20/03 9/07 5/05 12/05 5/05 6/04
Shwebo 36.0 38.0 42.0 44.2 44.0 41.5 39.0 41.0 39.0 39.0 36.0 38.1
Date 29/09 27/09 26/10 20/08 12/10 1/05 13/10 9/07 29/08 12/08 17/09 16/07
Monywa 33.8 39.3 43.5 44.0 45.8 43.5 42.0 41.0 38.9 38.8 37.4 32.6
Date 28/09 28/09 26/10 6/10 13/10 1/05 17/10 6/09 13/09 11/08 15/09 6/09
Mandalay 34.5 39.2 42.5 44.0 45.0 42.0 40.0 39.0 38.0 39.2 39.0 33.4
Date 30/10 20/09 27/04 6/10 12/10 1/05 12/09 10/09 28/02 3/10 5/05 28/03
Table 3: Lowest minimum Temperature (°C) with date of occurrence; year 2001-2010
STATION JAN FEB MAR APR MAY JUN JUL AUG SEP OCT NOV DEC
Putao 2.0 2.5 6.0 10.5 13.5 19.0 20.0 17.5 21.9 11.6 5.0 1.5
Date 24/10 3/08 1/08 1/08 1/02 26/05,8/10
30/10 14/04 24/01 27/07 24/04 28/10
Myitkyina 6.2 8.0 11.0 14.3 17.0 20.2 22.0 23.0 21.0 15.5 9.5 7.0
Date 23/03 3/08 10/03 3/06 3/11 3/01 11/04 20/01, 2/06
13/04 29/07 30/06 31/01
Bhamo 7.0 7.7 9.5 16.5 19.0 21.5 22.0 21.0 21.2 16.2 10.0 6.8
Date 20/03 5/04 9/03 4/06 2/02 13/07 30/01 9/01 21/07 28/07 30/06 30/09
Monghsat 3.8 4.3 7.3 12.4 16.7 20.7 20.5 20.4 17.3 11.9 7.5 4.7
Date 20/07 23/07 10/07 6/02 16/06 7/04 24/07 21/02 21/07 10/02 21/01 22/06
Hsipaw 4.0 5.0 7.0 13.8 16.9 21.0 21.0 21.0 18.0 13.3 10.7 5.0
Date 4/10 21/07 8/07 5/02 20/04 11/09 23/01 18/07 30/09 24/04 29/06 30/09
Lashio -1.9 1.0 3.0 8.0 12.5 18.4 20.1 20.0 16.9 8.5 6.0 1.0
Date 11/01 7/10 8/07 5/02 14/05 11/09 21/07 9/01 30/09 9/02 30/01 30/09
Taunggyi 3.9 5.8 8.5 11.5 12.7 16.6 16.4 16.5 15.7 10.0 6.0 3.0
Date 11/01 5/04 1/07 4/04 18/06 2/08 27/04 23/03 27/08 9/02 30/06 25/10
Kengtung 4.5 5.0 7.6 10.2 13.4 16.0 18.0 17.0 14.8 7.8 4.3 4.8
Date 11/01 5/04 4/02 4/04 15/05 9/03 15/03 31/02 21/07 9/02 28/01 23/06
Loilem -4.0 -2.0 1.0 5.0 8.0 10.0 10.0 10.0 9.0 4.5 -2.0 -4.0
24
Date 4/10 7/10 1/08 3/09 18/06 3/08 12/09 13/08 27/07 28/04 30/08 30/09
Pinlaung -2.0 0.1 3.5 9.0 9.6 12.6 14.8 15.0 12.0 10.2 1.3 -1.3
Date 12/01 5/04 10/07 4/04 29/06 11/08 18/04 4/07 30/08 31/04 30/06 30/09
Hakha -4.3 -5.0 -1.0 4.6 8.9 10.2 11.5 11.0 10.0 3.5 -3.8 -4.8
Date 6/08 15/08 8/07 5/01 10/08 2/08 12/08 9/03 28/10 17/08 23/08 30/09
Falam 4.0 4.0 7.0 9.8 11.5 12.3 15.0 15.0 13.5 11.6 7.6 5.0
Date 26/01 16/08 8/03 1/04 24/03 1/05 13/01 7/06 22/07 26/08 28/06 23/08
Mindat 2.4 4.9 7.5 9.6 10.7 12.2 11.8 12.2 10.7 8.0 5.1 3.2
Date 2/06 4/08 26/05 1/09 8/05 28/05 29/05 28/09 23/10 30/04 18/05 30/09
Hkamti 4.6 4.9 9.9 14.4 17.8 21.8 21.3 21.7 19.0 15.4 10.6 5.7
Date 17/03 10/04 1/08 1/06 7/04 5/04 7/08 31/02 22/07 31/04 30/05 29/04
Homalin 5.0 5.7 7.4 15.0 17.5 20.0 19.5 19.5 18.5 4.0 10.0 4.2
Date 17/03 5/01 8/03 1/02 5/05 28/10 30/10 20/02,4/10
22/10 31/10 23/10 30/10
Katha 3.5 4.2 8.3 10.8 13.0 15.3 16.5 15.5 15.0 12.0 7.5 2.8
Date 4/10 3/08 1/08 1/10 16/06 8/10 7/10 22/10 17/10 30/10 30/06 29/09
Pinlebu -1.0 0.5 4.0 9.5 11.8 15.0 15.0 16.0 14.0 11.5 2.6 1.0
Date 13/01 4/04 8/03 2/04 2/03 8/03 11/04 6/04, 17/04
18/04 25/04 1/03 2/04
Mawlaik 7.2 7.5 9.5 12.5 19.2 23.0 23.0 23.0 22.0 18.5 14.2 10.4
Date 27/02 6/10 8/03 26/06 2/02 12/04, 3/08
7/08 22/02 20/02 27/07 29/06 30/04
Kalewa 9.4 9.5 10.0 15.6 15.5 21.8 22.4 20.8 21.5 18.6 13.4 10.7
Date 28/02 5/04 8/03 29,30 /04
1/04 3/08 17/10 27/03 11/04 25/07 28/06 30/09
Kalemyo 6.0 6.7 8.6 14.7 18.8 22.0 23.0 22.6 20.5 17.7 11.5 9.1
Date 27/02 6/10 8/03 3/03 2/03 4/03 6/03 10/01 11/04 26/07 28/06 26/02
Yeoo 6.5 6.8 10.5 8.0 16.5 17.5 18.7 18.2 18.0 14.1 10.0 8.5
Date 30/08 16/08 1,3/08 1/03 14/07 21/08 25/07 31/07 18/05 30/07 30/06 9/07
Shwebo 3.0 7.0 10.0 11.6 14.0 15.0 16.0 15.0 15.0 13.0 8.0 3.0
25
Date 3/10 2,4/09 3,4/09 3/09 19/07 1/09 7/08 18/09 8/09 27/08 29/09 28/09
Monywa 10.0 11.0 14.2 18.0 20.0 20.2 23.1 21.0 20.4 17.6 12.0 8.3
Date 3/10 6/10 9/03 2/04 3/05 13/06 16/09 18/09 23/09 26/08 30/09 28/09
Mandalay 9.8 11.6 14.5 18.0 20.4 23.0 23.0 23.0 22.5 19.0 12.5 11.0
Date 11/01 5/04 9/03 2/04 20/04 11/03, 9/09
21/07 1/01 11/04 9/02 29/01 28/09
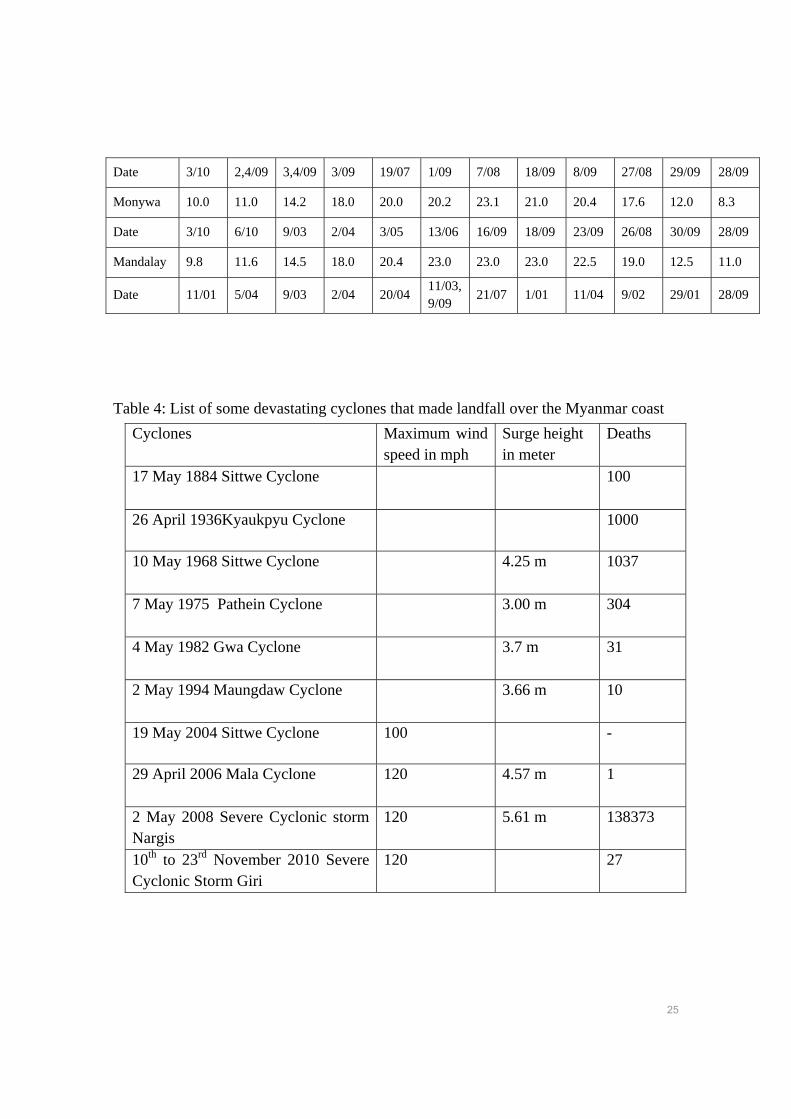
Table 4: List of some devastating cyclones that made landfall over the Myanmar coast
Cyclones Maximum wind speed in mph
Surge height in meter
Deaths
17 May 1884 Sittwe Cyclone 100
26 April 1936Kyaukpyu Cyclone 1000
10 May 1968 Sittwe Cyclone
4.25 m
1037
7 May 1975 Pathein Cyclone
3.00 m
304
4 May 1982 Gwa Cyclone
3.7 m 31
2 May 1994 Maungdaw Cyclone
3.66 m 10
19 May 2004 Sittwe Cyclone 100 -
29 April 2006 Mala Cyclone
120 4.57 m 1
2 May 2008 Severe Cyclonic storm Nargis
120 5.61 m 138373
10th to 23rd November 2010 Severe Cyclonic Storm Giri
120 27
26
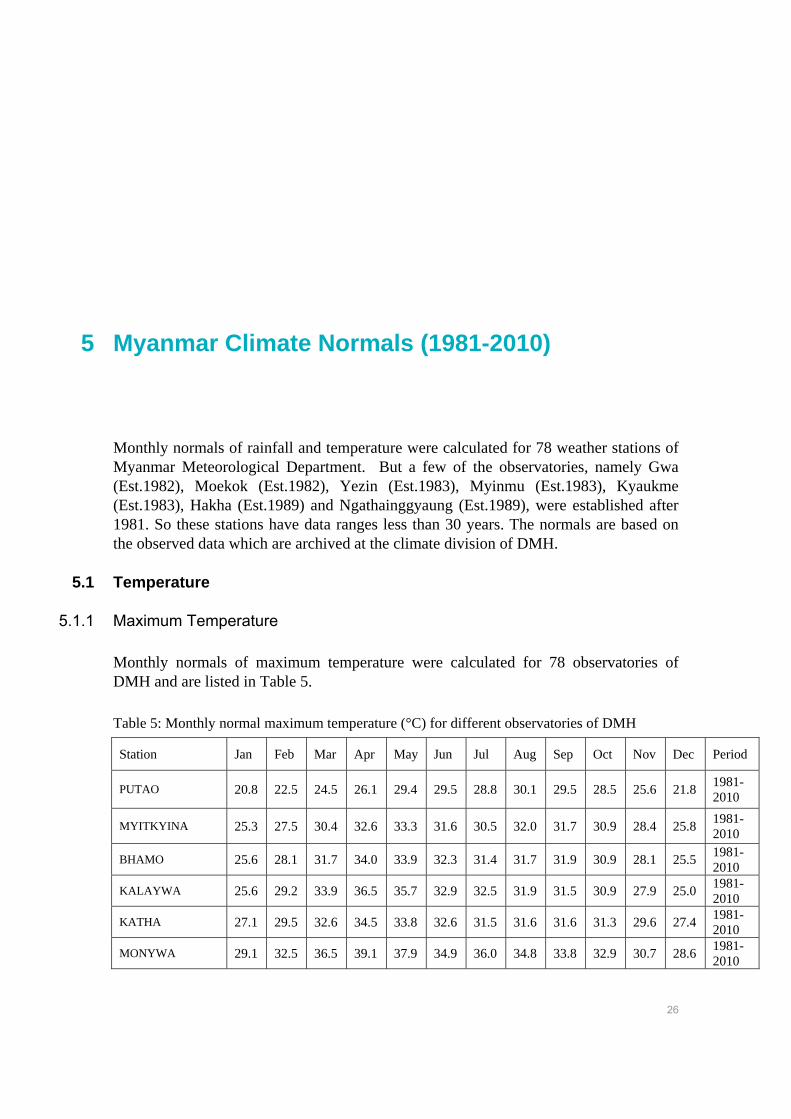
5 Myanmar Climate Normals (1981-2010)
Monthly normals of rainfall and temperature were calculated for 78 weather stations of Myanmar Meteorological Department. But a few of the observatories, namely Gwa (Est.1982), Moekok (Est.1982), Yezin (Est.1983), Myinmu (Est.1983), Kyaukme (Est.1983), Hakha (Est.1989) and Ngathainggyaung (Est.1989), were established after 1981. So these stations have data ranges less than 30 years. The normals are based on the observed data which are archived at the climate division of DMH.
5.1 Temperature
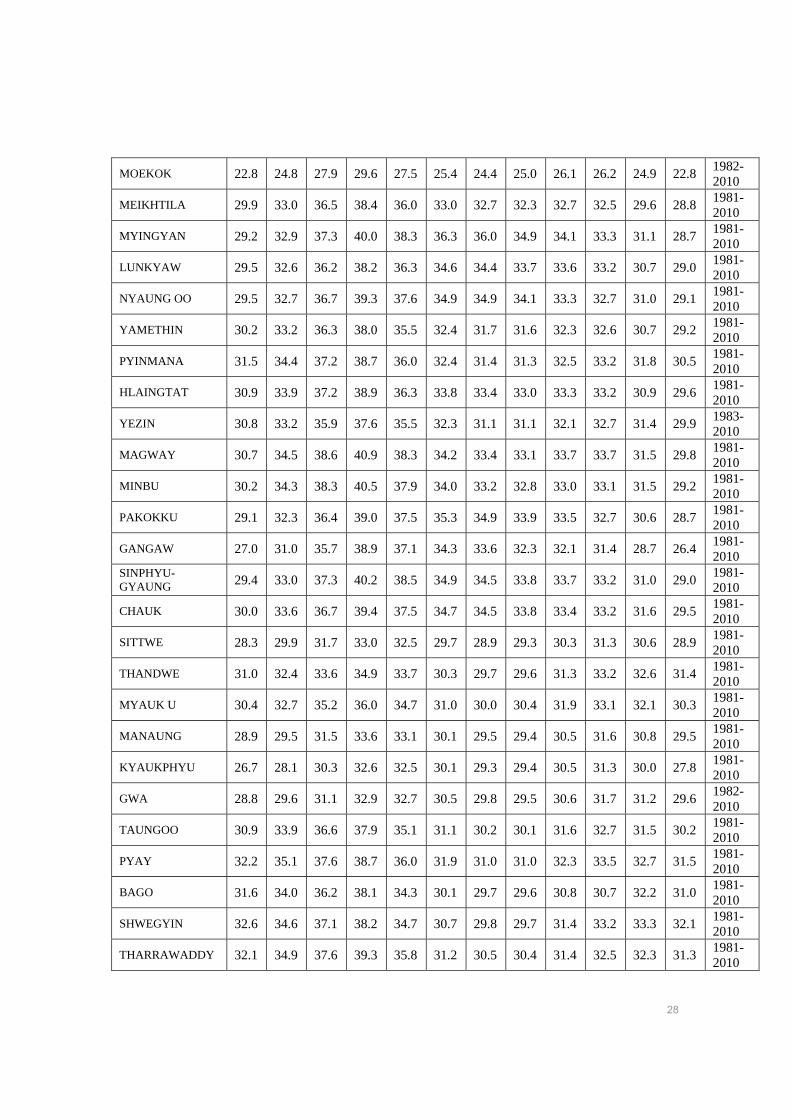
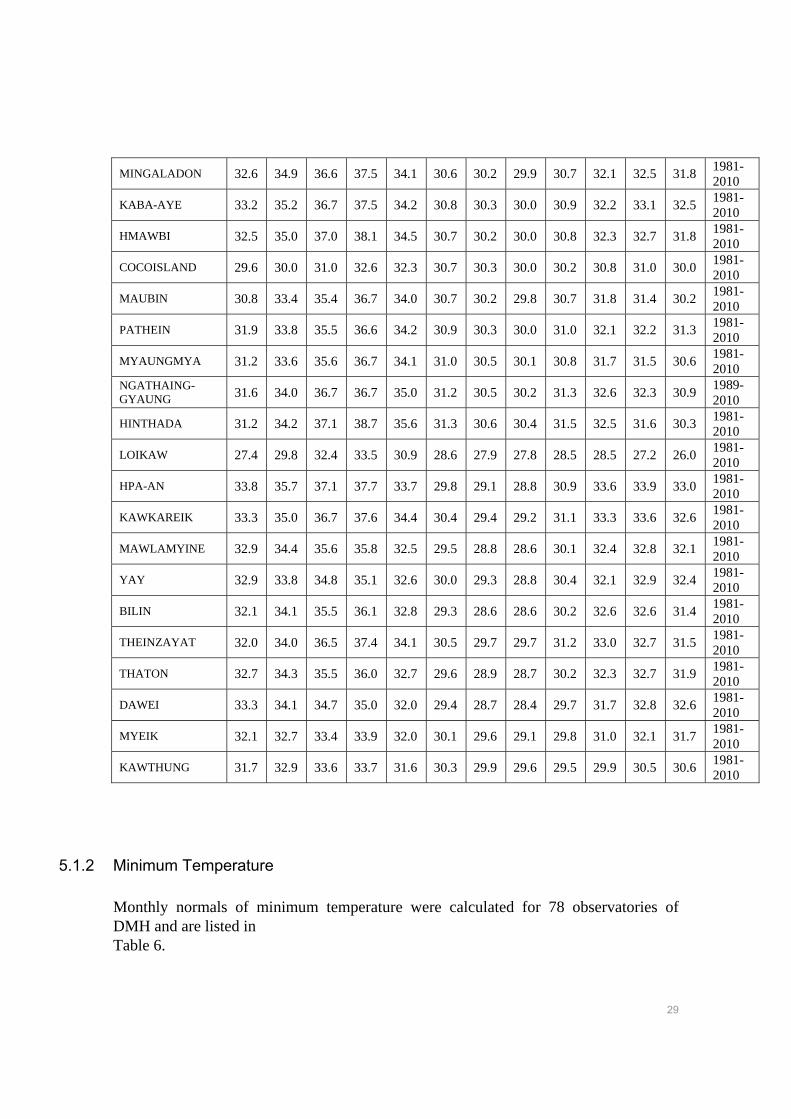
5.1.1 Maximum Temperature
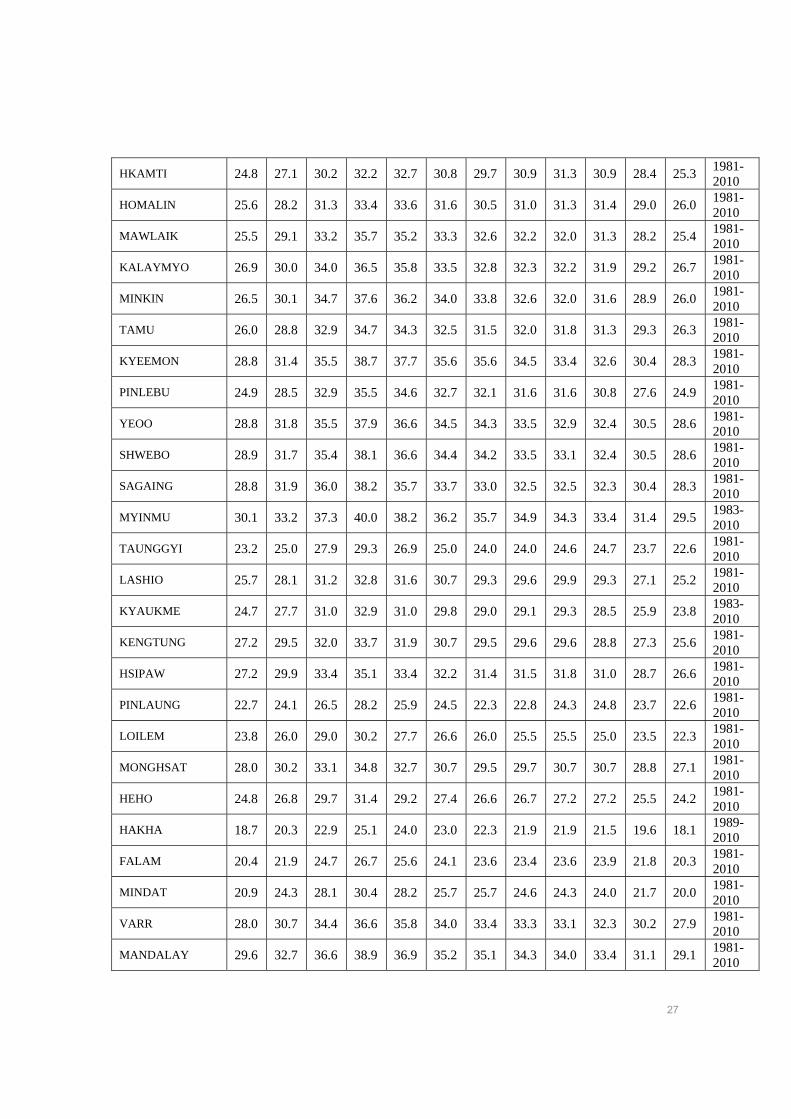
Monthly normals of maximum temperature were calculated for 78 observatories of DMH and are listed in Table 5.
Table 5: Monthly normal maximum temperature (°C) for different observatories of DMH
Station Jan Feb Mar Apr May Jun Jul Aug Sep Oct Nov Dec Period
PUTAO 20.8 22.5 24.5 26.1 29.4 29.5 28.8 30.1 29.5 28.5 25.6 21.8 1981-2010
MYITKYINA 25.3 27.5 30.4 32.6 33.3 31.6 30.5 32.0 31.7 30.9 28.4 25.8 1981-2010
BHAMO 25.6 28.1 31.7 34.0 33.9 32.3 31.4 31.7 31.9 30.9 28.1 25.5 1981-2010
KALAYWA 25.6 29.2 33.9 36.5 35.7 32.9 32.5 31.9 31.5 30.9 27.9 25.0 1981-2010
KATHA 27.1 29.5 32.6 34.5 33.8 32.6 31.5 31.6 31.6 31.3 29.6 27.4 1981-2010
MONYWA 29.1 32.5 36.5 39.1 37.9 34.9 36.0 34.8 33.8 32.9 30.7 28.6 1981-2010
27
HKAMTI 24.8 27.1 30.2 32.2 32.7 30.8 29.7 30.9 31.3 30.9 28.4 25.3 1981-2010
HOMALIN 25.6 28.2 31.3 33.4 33.6 31.6 30.5 31.0 31.3 31.4 29.0 26.0 1981-2010
MAWLAIK 25.5 29.1 33.2 35.7 35.2 33.3 32.6 32.2 32.0 31.3 28.2 25.4 1981-2010
KALAYMYO 26.9 30.0 34.0 36.5 35.8 33.5 32.8 32.3 32.2 31.9 29.2 26.7 1981-2010
MINKIN 26.5 30.1 34.7 37.6 36.2 34.0 33.8 32.6 32.0 31.6 28.9 26.0 1981-2010
TAMU 26.0 28.8 32.9 34.7 34.3 32.5 31.5 32.0 31.8 31.3 29.3 26.3 1981-2010
KYEEMON 28.8 31.4 35.5 38.7 37.7 35.6 35.6 34.5 33.4 32.6 30.4 28.3 1981-2010
PINLEBU 24.9 28.5 32.9 35.5 34.6 32.7 32.1 31.6 31.6 30.8 27.6 24.9 1981-2010
YEOO 28.8 31.8 35.5 37.9 36.6 34.5 34.3 33.5 32.9 32.4 30.5 28.6 1981-2010
SHWEBO 28.9 31.7 35.4 38.1 36.6 34.4 34.2 33.5 33.1 32.4 30.5 28.6 1981-2010
SAGAING 28.8 31.9 36.0 38.2 35.7 33.7 33.0 32.5 32.5 32.3 30.4 28.3 1981-2010
MYINMU 30.1 33.2 37.3 40.0 38.2 36.2 35.7 34.9 34.3 33.4 31.4 29.5 1983-2010
TAUNGGYI 23.2 25.0 27.9 29.3 26.9 25.0 24.0 24.0 24.6 24.7 23.7 22.6 1981-2010
LASHIO 25.7 28.1 31.2 32.8 31.6 30.7 29.3 29.6 29.9 29.3 27.1 25.2 1981-2010
KYAUKME 24.7 27.7 31.0 32.9 31.0 29.8 29.0 29.1 29.3 28.5 25.9 23.8 1983-2010
KENGTUNG 27.2 29.5 32.0 33.7 31.9 30.7 29.5 29.6 29.6 28.8 27.3 25.6 1981-2010
HSIPAW 27.2 29.9 33.4 35.1 33.4 32.2 31.4 31.5 31.8 31.0 28.7 26.6 1981-2010
PINLAUNG 22.7 24.1 26.5 28.2 25.9 24.5 22.3 22.8 24.3 24.8 23.7 22.6 1981-2010
LOILEM 23.8 26.0 29.0 30.2 27.7 26.6 26.0 25.5 25.5 25.0 23.5 22.3 1981-2010
MONGHSAT 28.0 30.2 33.1 34.8 32.7 30.7 29.5 29.7 30.7 30.7 28.8 27.1 1981-2010
HEHO 24.8 26.8 29.7 31.4 29.2 27.4 26.6 26.7 27.2 27.2 25.5 24.2 1981-2010
HAKHA 18.7 20.3 22.9 25.1 24.0 23.0 22.3 21.9 21.9 21.5 19.6 18.1 1989-2010
FALAM 20.4 21.9 24.7 26.7 25.6 24.1 23.6 23.4 23.6 23.9 21.8 20.3 1981-2010
MINDAT 20.9 24.3 28.1 30.4 28.2 25.7 25.7 24.6 24.3 24.0 21.7 20.0 1981-2010
VARR 28.0 30.7 34.4 36.6 35.8 34.0 33.4 33.3 33.1 32.3 30.2 27.9 1981-2010
MANDALAY 29.6 32.7 36.6 38.9 36.9 35.2 35.1 34.3 34.0 33.4 31.1 29.1 1981-2010
28
MOEKOK 22.8 24.8 27.9 29.6 27.5 25.4 24.4 25.0 26.1 26.2 24.9 22.8 1982-2010
MEIKHTILA 29.9 33.0 36.5 38.4 36.0 33.0 32.7 32.3 32.7 32.5 29.6 28.8 1981-2010
MYINGYAN 29.2 32.9 37.3 40.0 38.3 36.3 36.0 34.9 34.1 33.3 31.1 28.7 1981-2010
LUNKYAW 29.5 32.6 36.2 38.2 36.3 34.6 34.4 33.7 33.6 33.2 30.7 29.0 1981-2010
NYAUNG OO 29.5 32.7 36.7 39.3 37.6 34.9 34.9 34.1 33.3 32.7 31.0 29.1 1981-2010
YAMETHIN 30.2 33.2 36.3 38.0 35.5 32.4 31.7 31.6 32.3 32.6 30.7 29.2 1981-2010
PYINMANA 31.5 34.4 37.2 38.7 36.0 32.4 31.4 31.3 32.5 33.2 31.8 30.5 1981-2010
HLAINGTAT 30.9 33.9 37.2 38.9 36.3 33.8 33.4 33.0 33.3 33.2 30.9 29.6 1981-2010
YEZIN 30.8 33.2 35.9 37.6 35.5 32.3 31.1 31.1 32.1 32.7 31.4 29.9 1983-2010
MAGWAY 30.7 34.5 38.6 40.9 38.3 34.2 33.4 33.1 33.7 33.7 31.5 29.8 1981-2010
MINBU 30.2 34.3 38.3 40.5 37.9 34.0 33.2 32.8 33.0 33.1 31.5 29.2 1981-2010
PAKOKKU 29.1 32.3 36.4 39.0 37.5 35.3 34.9 33.9 33.5 32.7 30.6 28.7 1981-2010
GANGAW 27.0 31.0 35.7 38.9 37.1 34.3 33.6 32.3 32.1 31.4 28.7 26.4 1981-2010
SINPHYU-GYAUNG 29.4 33.0 37.3 40.2 38.5 34.9 34.5 33.8 33.7 33.2 31.0 29.0
1981-2010
CHAUK 30.0 33.6 36.7 39.4 37.5 34.7 34.5 33.8 33.4 33.2 31.6 29.5 1981-2010
SITTWE 28.3 29.9 31.7 33.0 32.5 29.7 28.9 29.3 30.3 31.3 30.6 28.9 1981-2010
THANDWE 31.0 32.4 33.6 34.9 33.7 30.3 29.7 29.6 31.3 33.2 32.6 31.4 1981-2010
MYAUK U 30.4 32.7 35.2 36.0 34.7 31.0 30.0 30.4 31.9 33.1 32.1 30.3 1981-2010
MANAUNG 28.9 29.5 31.5 33.6 33.1 30.1 29.5 29.4 30.5 31.6 30.8 29.5 1981-2010
KYAUKPHYU 26.7 28.1 30.3 32.6 32.5 30.1 29.3 29.4 30.5 31.3 30.0 27.8 1981-2010
GWA 28.8 29.6 31.1 32.9 32.7 30.5 29.8 29.5 30.6 31.7 31.2 29.6 1982-2010
TAUNGOO 30.9 33.9 36.6 37.9 35.1 31.1 30.2 30.1 31.6 32.7 31.5 30.2 1981-2010
PYAY 32.2 35.1 37.6 38.7 36.0 31.9 31.0 31.0 32.3 33.5 32.7 31.5 1981-2010
BAGO 31.6 34.0 36.2 38.1 34.3 30.1 29.7 29.6 30.8 30.7 32.2 31.0 1981-2010
SHWEGYIN 32.6 34.6 37.1 38.2 34.7 30.7 29.8 29.7 31.4 33.2 33.3 32.1 1981-2010
THARRAWADDY 32.1 34.9 37.6 39.3 35.8 31.2 30.5 30.4 31.4 32.5 32.3 31.3 1981-2010
29
MINGALADON 32.6 34.9 36.6 37.5 34.1 30.6 30.2 29.9 30.7 32.1 32.5 31.8 1981-2010
KABA-AYE 33.2 35.2 36.7 37.5 34.2 30.8 30.3 30.0 30.9 32.2 33.1 32.5 1981-2010
HMAWBI 32.5 35.0 37.0 38.1 34.5 30.7 30.2 30.0 30.8 32.3 32.7 31.8 1981-2010
COCOISLAND 29.6 30.0 31.0 32.6 32.3 30.7 30.3 30.0 30.2 30.8 31.0 30.0 1981-2010
MAUBIN 30.8 33.4 35.4 36.7 34.0 30.7 30.2 29.8 30.7 31.8 31.4 30.2 1981-2010
PATHEIN 31.9 33.8 35.5 36.6 34.2 30.9 30.3 30.0 31.0 32.1 32.2 31.3 1981-2010
MYAUNGMYA 31.2 33.6 35.6 36.7 34.1 31.0 30.5 30.1 30.8 31.7 31.5 30.6 1981-2010
NGATHAING-GYAUNG 31.6 34.0 36.7 36.7 35.0 31.2 30.5 30.2 31.3 32.6 32.3 30.9
1989-2010
HINTHADA 31.2 34.2 37.1 38.7 35.6 31.3 30.6 30.4 31.5 32.5 31.6 30.3 1981-2010
LOIKAW 27.4 29.8 32.4 33.5 30.9 28.6 27.9 27.8 28.5 28.5 27.2 26.0 1981-2010
HPA-AN 33.8 35.7 37.1 37.7 33.7 29.8 29.1 28.8 30.9 33.6 33.9 33.0 1981-2010
KAWKAREIK 33.3 35.0 36.7 37.6 34.4 30.4 29.4 29.2 31.1 33.3 33.6 32.6 1981-2010
MAWLAMYINE 32.9 34.4 35.6 35.8 32.5 29.5 28.8 28.6 30.1 32.4 32.8 32.1 1981-2010
YAY 32.9 33.8 34.8 35.1 32.6 30.0 29.3 28.8 30.4 32.1 32.9 32.4 1981-2010
BILIN 32.1 34.1 35.5 36.1 32.8 29.3 28.6 28.6 30.2 32.6 32.6 31.4 1981-2010
THEINZAYAT 32.0 34.0 36.5 37.4 34.1 30.5 29.7 29.7 31.2 33.0 32.7 31.5 1981-2010
THATON 32.7 34.3 35.5 36.0 32.7 29.6 28.9 28.7 30.2 32.3 32.7 31.9 1981-2010
DAWEI 33.3 34.1 34.7 35.0 32.0 29.4 28.7 28.4 29.7 31.7 32.8 32.6 1981-2010
MYEIK 32.1 32.7 33.4 33.9 32.0 30.1 29.6 29.1 29.8 31.0 32.1 31.7 1981-2010
KAWTHUNG 31.7 32.9 33.6 33.7 31.6 30.3 29.9 29.6 29.5 29.9 30.5 30.6 1981-2010
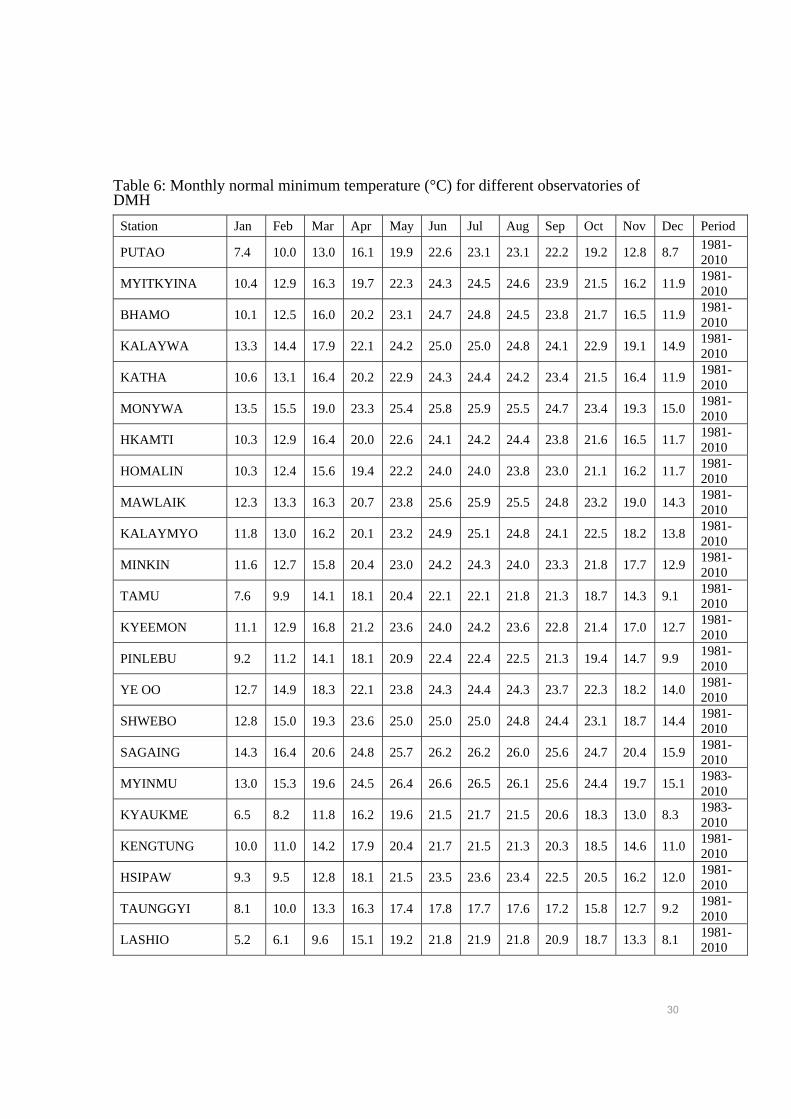
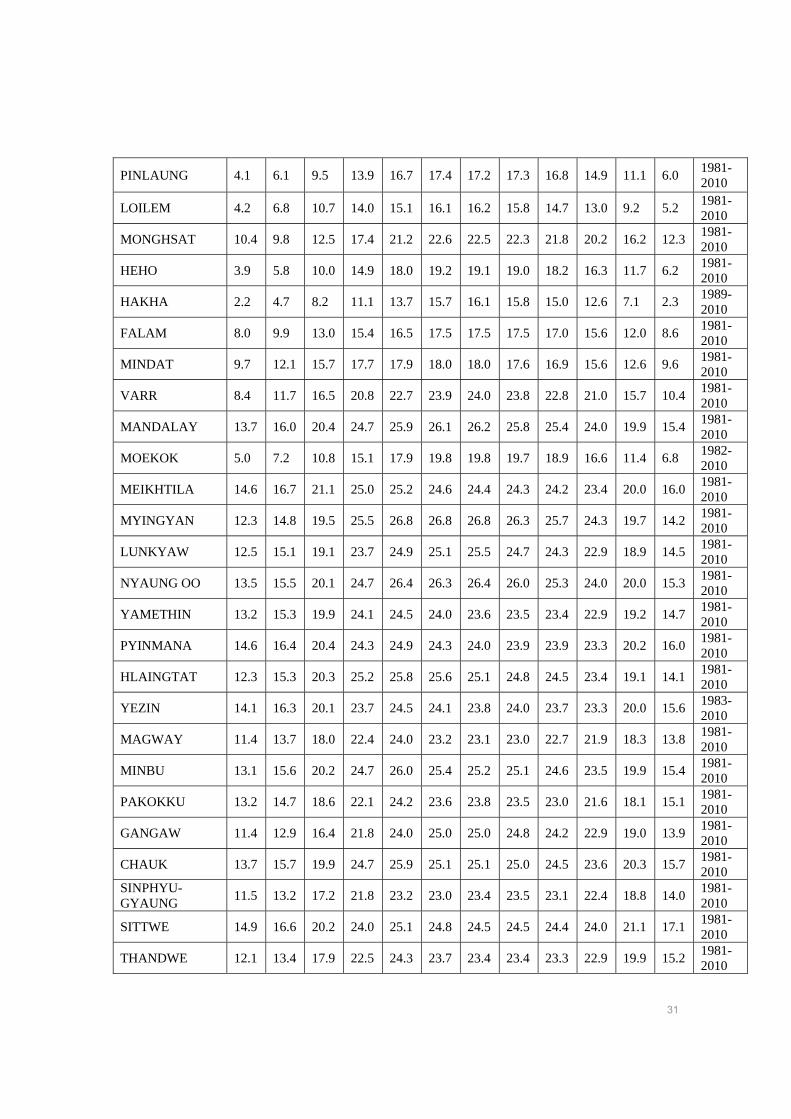
5.1.2 Minimum Temperature
Monthly normals of minimum temperature were calculated for 78 observatories of DMH and are listed in Table 6.
30
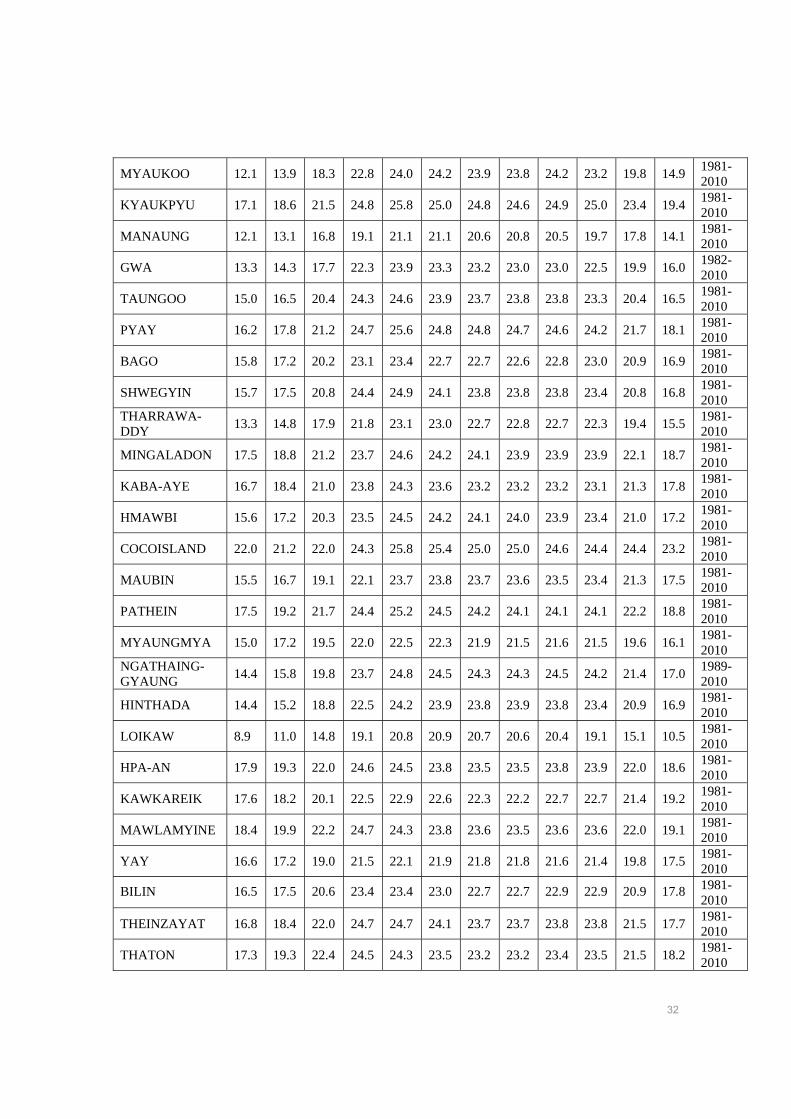
Table 6: Monthly normal minimum temperature (°C) for different observatories of DMH
Station Jan Feb Mar Apr May Jun Jul Aug Sep Oct Nov Dec Period
PUTAO 7.4 10.0 13.0 16.1 19.9 22.6 23.1 23.1 22.2 19.2 12.8 8.7 1981-2010
MYITKYINA 10.4 12.9 16.3 19.7 22.3 24.3 24.5 24.6 23.9 21.5 16.2 11.9 1981-2010
BHAMO 10.1 12.5 16.0 20.2 23.1 24.7 24.8 24.5 23.8 21.7 16.5 11.9 1981-2010
KALAYWA 13.3 14.4 17.9 22.1 24.2 25.0 25.0 24.8 24.1 22.9 19.1 14.9 1981-2010
KATHA 10.6 13.1 16.4 20.2 22.9 24.3 24.4 24.2 23.4 21.5 16.4 11.9 1981-2010
MONYWA 13.5 15.5 19.0 23.3 25.4 25.8 25.9 25.5 24.7 23.4 19.3 15.0 1981-2010
HKAMTI 10.3 12.9 16.4 20.0 22.6 24.1 24.2 24.4 23.8 21.6 16.5 11.7 1981-2010
HOMALIN 10.3 12.4 15.6 19.4 22.2 24.0 24.0 23.8 23.0 21.1 16.2 11.7 1981-2010
MAWLAIK 12.3 13.3 16.3 20.7 23.8 25.6 25.9 25.5 24.8 23.2 19.0 14.3 1981-2010
KALAYMYO 11.8 13.0 16.2 20.1 23.2 24.9 25.1 24.8 24.1 22.5 18.2 13.8 1981-2010
MINKIN 11.6 12.7 15.8 20.4 23.0 24.2 24.3 24.0 23.3 21.8 17.7 12.9 1981-2010
TAMU 7.6 9.9 14.1 18.1 20.4 22.1 22.1 21.8 21.3 18.7 14.3 9.1 1981-2010
KYEEMON 11.1 12.9 16.8 21.2 23.6 24.0 24.2 23.6 22.8 21.4 17.0 12.7 1981-2010
PINLEBU 9.2 11.2 14.1 18.1 20.9 22.4 22.4 22.5 21.3 19.4 14.7 9.9 1981-2010
YE OO 12.7 14.9 18.3 22.1 23.8 24.3 24.4 24.3 23.7 22.3 18.2 14.0 1981-2010
SHWEBO 12.8 15.0 19.3 23.6 25.0 25.0 25.0 24.8 24.4 23.1 18.7 14.4 1981-2010
SAGAING 14.3 16.4 20.6 24.8 25.7 26.2 26.2 26.0 25.6 24.7 20.4 15.9 1981-2010
MYINMU 13.0 15.3 19.6 24.5 26.4 26.6 26.5 26.1 25.6 24.4 19.7 15.1 1983-2010
KYAUKME 6.5 8.2 11.8 16.2 19.6 21.5 21.7 21.5 20.6 18.3 13.0 8.3 1983-2010
KENGTUNG 10.0 11.0 14.2 17.9 20.4 21.7 21.5 21.3 20.3 18.5 14.6 11.0 1981-2010
HSIPAW 9.3 9.5 12.8 18.1 21.5 23.5 23.6 23.4 22.5 20.5 16.2 12.0 1981-2010
TAUNGGYI 8.1 10.0 13.3 16.3 17.4 17.8 17.7 17.6 17.2 15.8 12.7 9.2 1981-2010
LASHIO 5.2 6.1 9.6 15.1 19.2 21.8 21.9 21.8 20.9 18.7 13.3 8.1 1981-2010
31
PINLAUNG 4.1 6.1 9.5 13.9 16.7 17.4 17.2 17.3 16.8 14.9 11.1 6.0 1981-2010
LOILEM 4.2 6.8 10.7 14.0 15.1 16.1 16.2 15.8 14.7 13.0 9.2 5.2 1981-2010
MONGHSAT 10.4 9.8 12.5 17.4 21.2 22.6 22.5 22.3 21.8 20.2 16.2 12.3 1981-2010
HEHO 3.9 5.8 10.0 14.9 18.0 19.2 19.1 19.0 18.2 16.3 11.7 6.2 1981-2010
HAKHA 2.2 4.7 8.2 11.1 13.7 15.7 16.1 15.8 15.0 12.6 7.1 2.3 1989-2010
FALAM 8.0 9.9 13.0 15.4 16.5 17.5 17.5 17.5 17.0 15.6 12.0 8.6 1981-2010
MINDAT 9.7 12.1 15.7 17.7 17.9 18.0 18.0 17.6 16.9 15.6 12.6 9.6 1981-2010
VARR 8.4 11.7 16.5 20.8 22.7 23.9 24.0 23.8 22.8 21.0 15.7 10.4 1981-2010
MANDALAY 13.7 16.0 20.4 24.7 25.9 26.1 26.2 25.8 25.4 24.0 19.9 15.4 1981-2010
MOEKOK 5.0 7.2 10.8 15.1 17.9 19.8 19.8 19.7 18.9 16.6 11.4 6.8 1982-2010
MEIKHTILA 14.6 16.7 21.1 25.0 25.2 24.6 24.4 24.3 24.2 23.4 20.0 16.0 1981-2010
MYINGYAN 12.3 14.8 19.5 25.5 26.8 26.8 26.8 26.3 25.7 24.3 19.7 14.2 1981-2010
LUNKYAW 12.5 15.1 19.1 23.7 24.9 25.1 25.5 24.7 24.3 22.9 18.9 14.5 1981-2010
NYAUNG OO 13.5 15.5 20.1 24.7 26.4 26.3 26.4 26.0 25.3 24.0 20.0 15.3 1981-2010
YAMETHIN 13.2 15.3 19.9 24.1 24.5 24.0 23.6 23.5 23.4 22.9 19.2 14.7 1981-2010
PYINMANA 14.6 16.4 20.4 24.3 24.9 24.3 24.0 23.9 23.9 23.3 20.2 16.0 1981-2010
HLAINGTAT 12.3 15.3 20.3 25.2 25.8 25.6 25.1 24.8 24.5 23.4 19.1 14.1 1981-2010
YEZIN 14.1 16.3 20.1 23.7 24.5 24.1 23.8 24.0 23.7 23.3 20.0 15.6 1983-2010
MAGWAY 11.4 13.7 18.0 22.4 24.0 23.2 23.1 23.0 22.7 21.9 18.3 13.8 1981-2010
MINBU 13.1 15.6 20.2 24.7 26.0 25.4 25.2 25.1 24.6 23.5 19.9 15.4 1981-2010
PAKOKKU 13.2 14.7 18.6 22.1 24.2 23.6 23.8 23.5 23.0 21.6 18.1 15.1 1981-2010
GANGAW 11.4 12.9 16.4 21.8 24.0 25.0 25.0 24.8 24.2 22.9 19.0 13.9 1981-2010
CHAUK 13.7 15.7 19.9 24.7 25.9 25.1 25.1 25.0 24.5 23.6 20.3 15.7 1981-2010
SINPHYU-GYAUNG
11.5 13.2 17.2 21.8 23.2 23.0 23.4 23.5 23.1 22.4 18.8 14.0 1981-2010
SITTWE 14.9 16.6 20.2 24.0 25.1 24.8 24.5 24.5 24.4 24.0 21.1 17.1 1981-2010
THANDWE 12.1 13.4 17.9 22.5 24.3 23.7 23.4 23.4 23.3 22.9 19.9 15.2 1981-2010
32
MYAUKOO 12.1 13.9 18.3 22.8 24.0 24.2 23.9 23.8 24.2 23.2 19.8 14.9 1981-2010
KYAUKPYU 17.1 18.6 21.5 24.8 25.8 25.0 24.8 24.6 24.9 25.0 23.4 19.4 1981-2010
MANAUNG 12.1 13.1 16.8 19.1 21.1 21.1 20.6 20.8 20.5 19.7 17.8 14.1 1981-2010
GWA 13.3 14.3 17.7 22.3 23.9 23.3 23.2 23.0 23.0 22.5 19.9 16.0 1982-2010
TAUNGOO 15.0 16.5 20.4 24.3 24.6 23.9 23.7 23.8 23.8 23.3 20.4 16.5 1981-2010
PYAY 16.2 17.8 21.2 24.7 25.6 24.8 24.8 24.7 24.6 24.2 21.7 18.1 1981-2010
BAGO 15.8 17.2 20.2 23.1 23.4 22.7 22.7 22.6 22.8 23.0 20.9 16.9 1981-2010
SHWEGYIN 15.7 17.5 20.8 24.4 24.9 24.1 23.8 23.8 23.8 23.4 20.8 16.8 1981-2010
THARRAWA- DDY
13.3 14.8 17.9 21.8 23.1 23.0 22.7 22.8 22.7 22.3 19.4 15.5 1981-2010
MINGALADON 17.5 18.8 21.2 23.7 24.6 24.2 24.1 23.9 23.9 23.9 22.1 18.7 1981-2010
KABA-AYE 16.7 18.4 21.0 23.8 24.3 23.6 23.2 23.2 23.2 23.1 21.3 17.8 1981-2010
HMAWBI 15.6 17.2 20.3 23.5 24.5 24.2 24.1 24.0 23.9 23.4 21.0 17.2 1981-2010
COCOISLAND 22.0 21.2 22.0 24.3 25.8 25.4 25.0 25.0 24.6 24.4 24.4 23.2 1981-2010
MAUBIN 15.5 16.7 19.1 22.1 23.7 23.8 23.7 23.6 23.5 23.4 21.3 17.5 1981-2010
PATHEIN 17.5 19.2 21.7 24.4 25.2 24.5 24.2 24.1 24.1 24.1 22.2 18.8 1981-2010
MYAUNGMYA 15.0 17.2 19.5 22.0 22.5 22.3 21.9 21.5 21.6 21.5 19.6 16.1 1981-2010
NGATHAING-GYAUNG
14.4 15.8 19.8 23.7 24.8 24.5 24.3 24.3 24.5 24.2 21.4 17.0 1989-2010
HINTHADA 14.4 15.2 18.8 22.5 24.2 23.9 23.8 23.9 23.8 23.4 20.9 16.9 1981-2010
LOIKAW 8.9 11.0 14.8 19.1 20.8 20.9 20.7 20.6 20.4 19.1 15.1 10.5 1981-2010
HPA-AN 17.9 19.3 22.0 24.6 24.5 23.8 23.5 23.5 23.8 23.9 22.0 18.6 1981-2010
KAWKAREIK 17.6 18.2 20.1 22.5 22.9 22.6 22.3 22.2 22.7 22.7 21.4 19.2 1981-2010
MAWLAMYINE 18.4 19.9 22.2 24.7 24.3 23.8 23.6 23.5 23.6 23.6 22.0 19.1 1981-2010
YAY 16.6 17.2 19.0 21.5 22.1 21.9 21.8 21.8 21.6 21.4 19.8 17.5 1981-2010
BILIN 16.5 17.5 20.6 23.4 23.4 23.0 22.7 22.7 22.9 22.9 20.9 17.8 1981-2010
THEINZAYAT 16.8 18.4 22.0 24.7 24.7 24.1 23.7 23.7 23.8 23.8 21.5 17.7 1981-2010
THATON 17.3 19.3 22.4 24.5 24.3 23.5 23.2 23.2 23.4 23.5 21.5 18.2 1981-2010
33
DAWEI 18.4 19.6 21.2 23.3 23.7 23.2 22.7 22.8 22.7 22.5 20.8 18.2 1981-2010
MYEIK 21.7 22.6 23.7 24.8 24.6 24.1 23.7 23.6 23.6 23.6 22.9 21.4 1981-2010
KAWTHUNG 22.4 23.0 23.8 24.6 24.1 23.6 23.2 23.1 22.7 22.6 22.7 22.2 1981-2010
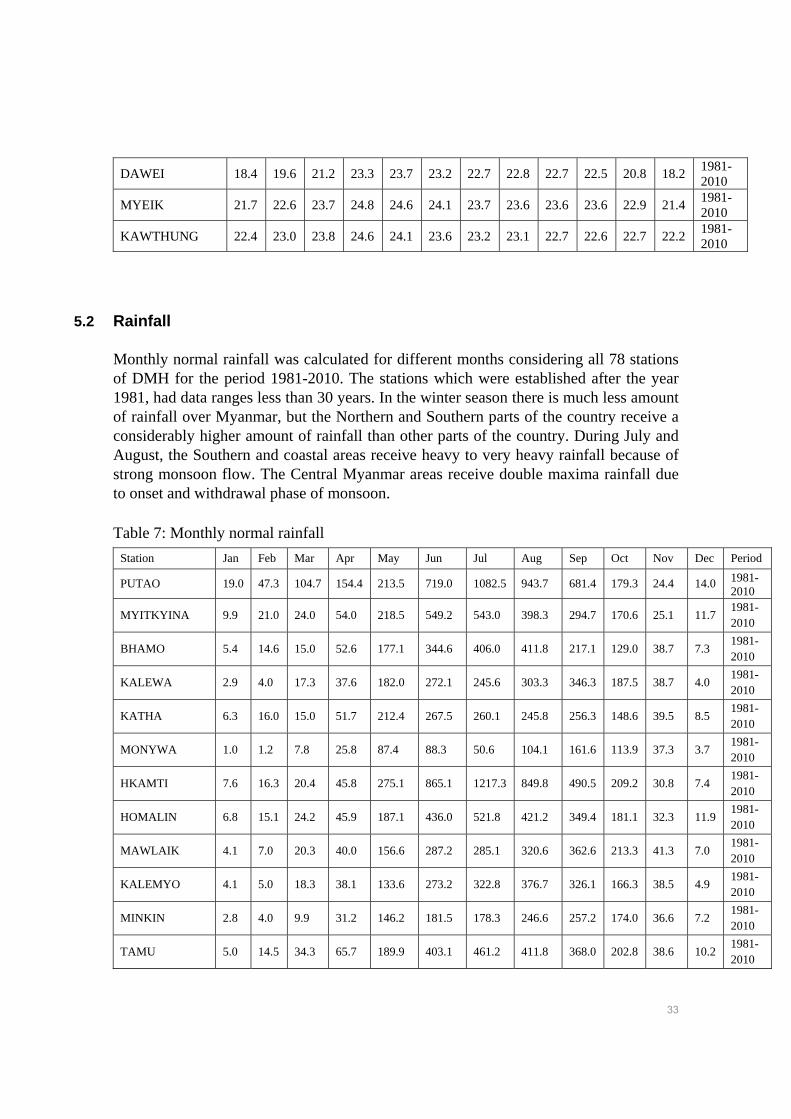
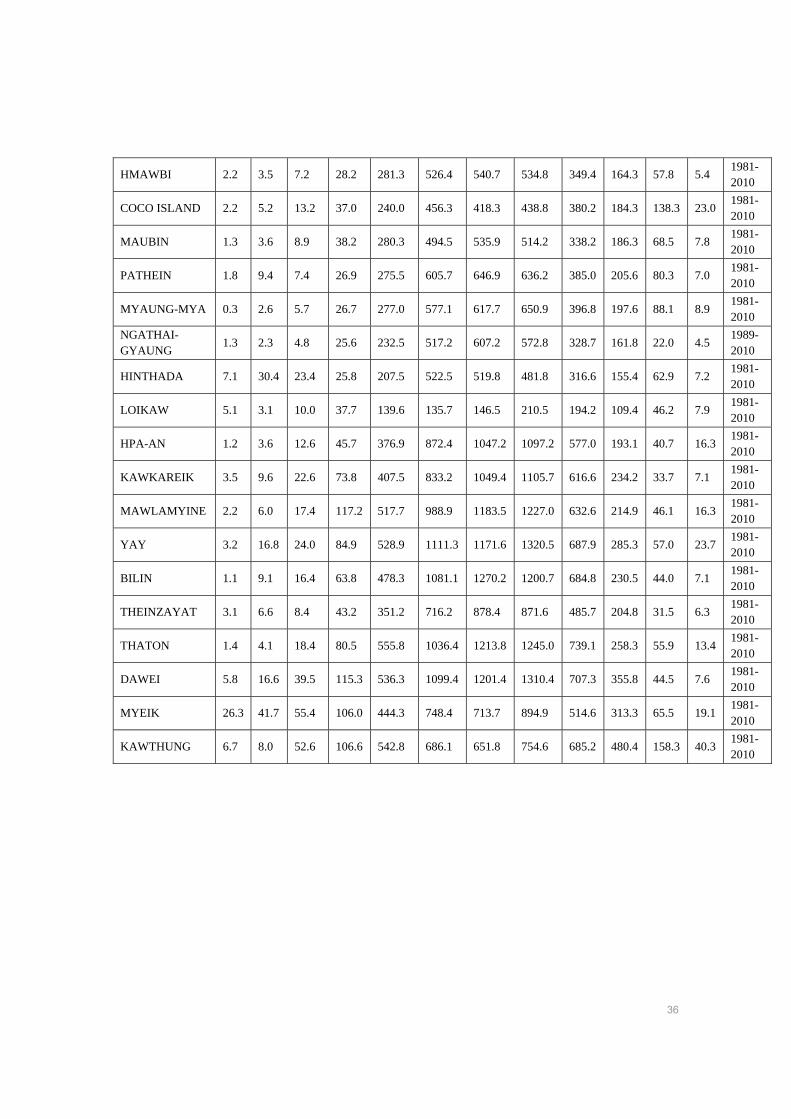
5.2 Rainfall
Monthly normal rainfall was calculated for different months considering all 78 stations of DMH for the period 1981-2010. The stations which were established after the year 1981, had data ranges less than 30 years. In the winter season there is much less amount of rainfall over Myanmar, but the Northern and Southern parts of the country receive a considerably higher amount of rainfall than other parts of the country. During July and August, the Southern and coastal areas receive heavy to very heavy rainfall because of strong monsoon flow. The Central Myanmar areas receive double maxima rainfall due to onset and withdrawal phase of monsoon.
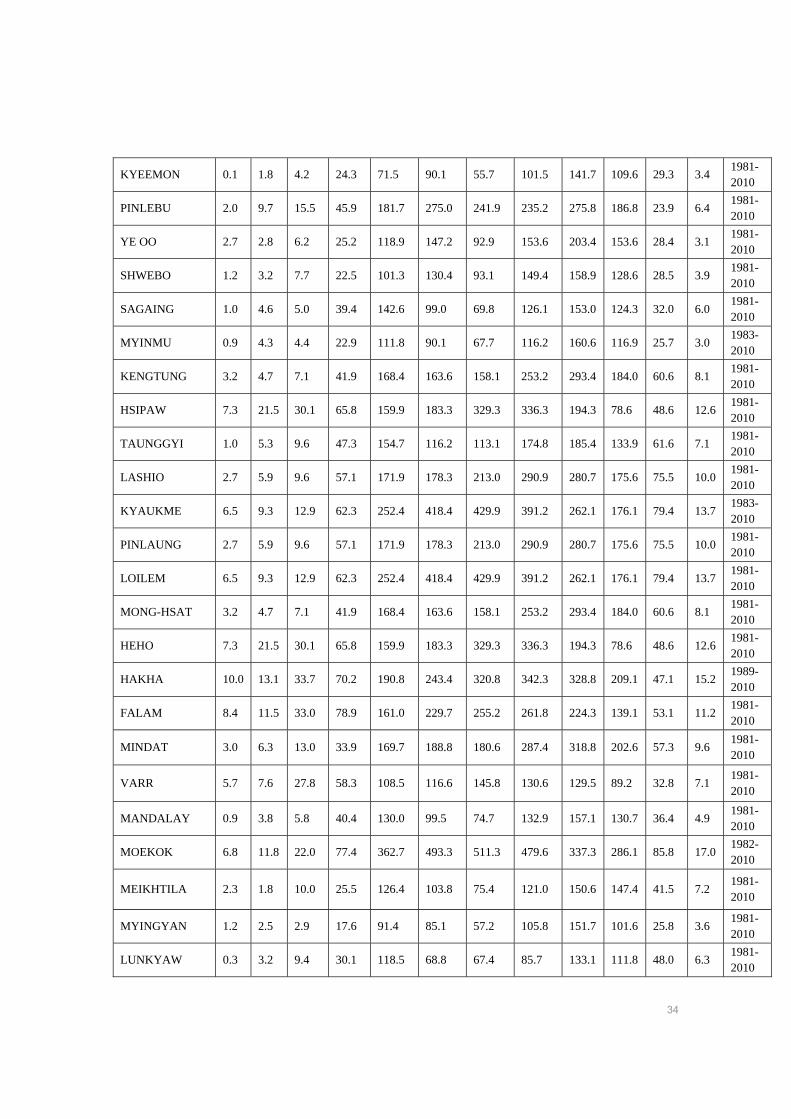
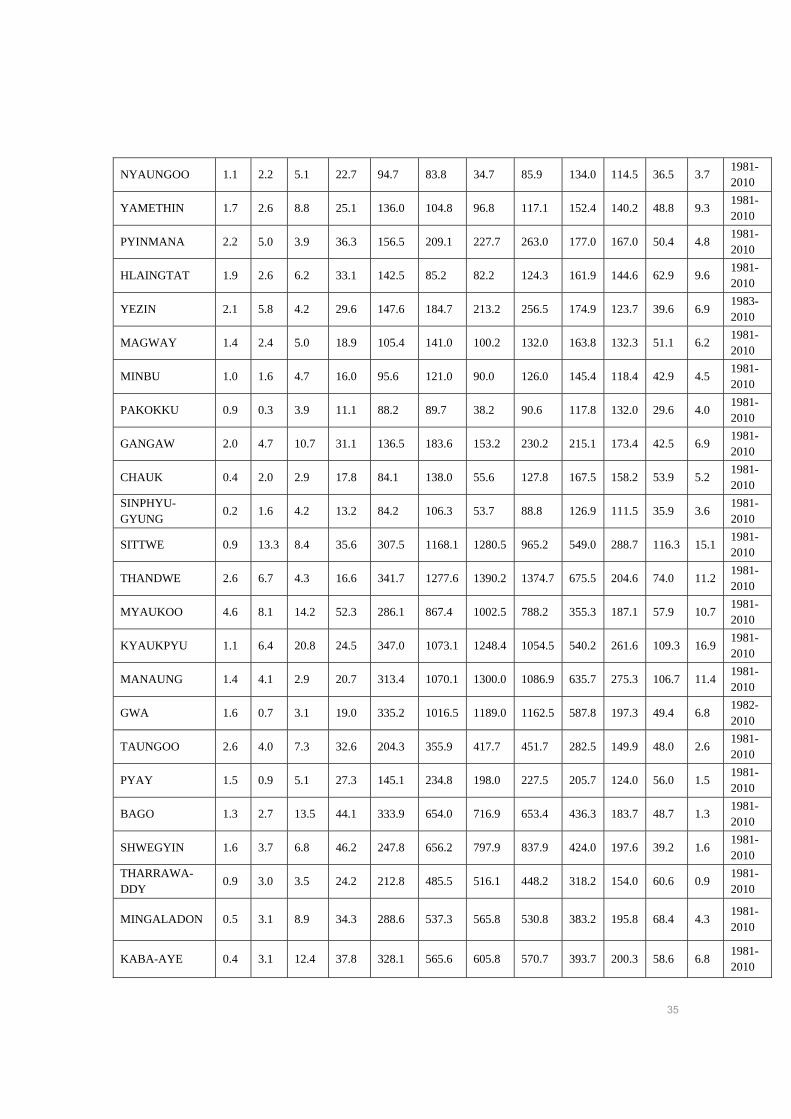
Table 7: Monthly normal rainfall
Station Jan Feb Mar Apr May Jun Jul Aug Sep Oct Nov Dec Period
PUTAO 19.0 47.3 104.7 154.4 213.5 719.0 1082.5 943.7 681.4 179.3 24.4 14.0 1981-2010
MYITKYINA 9.9 21.0 24.0 54.0 218.5 549.2 543.0 398.3 294.7 170.6 25.1 11.7 1981-2010
BHAMO 5.4 14.6 15.0 52.6 177.1 344.6 406.0 411.8 217.1 129.0 38.7 7.3 1981-2010
KALEWA 2.9 4.0 17.3 37.6 182.0 272.1 245.6 303.3 346.3 187.5 38.7 4.0 1981-2010
KATHA 6.3 16.0 15.0 51.7 212.4 267.5 260.1 245.8 256.3 148.6 39.5 8.5 1981-2010
MONYWA 1.0 1.2 7.8 25.8 87.4 88.3 50.6 104.1 161.6 113.9 37.3 3.7 1981-2010
HKAMTI 7.6 16.3 20.4 45.8 275.1 865.1 1217.3 849.8 490.5 209.2 30.8 7.4 1981-2010
HOMALIN 6.8 15.1 24.2 45.9 187.1 436.0 521.8 421.2 349.4 181.1 32.3 11.9 1981-2010
MAWLAIK 4.1 7.0 20.3 40.0 156.6 287.2 285.1 320.6 362.6 213.3 41.3 7.0 1981-2010
KALEMYO 4.1 5.0 18.3 38.1 133.6 273.2 322.8 376.7 326.1 166.3 38.5 4.9 1981-2010
MINKIN 2.8 4.0 9.9 31.2 146.2 181.5 178.3 246.6 257.2 174.0 36.6 7.2 1981-2010
TAMU 5.0 14.5 34.3 65.7 189.9 403.1 461.2 411.8 368.0 202.8 38.6 10.2 1981-2010
34
KYEEMON 0.1 1.8 4.2 24.3 71.5 90.1 55.7 101.5 141.7 109.6 29.3 3.4 1981-2010
PINLEBU 2.0 9.7 15.5 45.9 181.7 275.0 241.9 235.2 275.8 186.8 23.9 6.4 1981-2010
YE OO 2.7 2.8 6.2 25.2 118.9 147.2 92.9 153.6 203.4 153.6 28.4 3.1 1981-2010
SHWEBO 1.2 3.2 7.7 22.5 101.3 130.4 93.1 149.4 158.9 128.6 28.5 3.9 1981-2010
SAGAING 1.0 4.6 5.0 39.4 142.6 99.0 69.8 126.1 153.0 124.3 32.0 6.0 1981-2010
MYINMU 0.9 4.3 4.4 22.9 111.8 90.1 67.7 116.2 160.6 116.9 25.7 3.0 1983-2010
KENGTUNG 3.2 4.7 7.1 41.9 168.4 163.6 158.1 253.2 293.4 184.0 60.6 8.1 1981-2010
HSIPAW 7.3 21.5 30.1 65.8 159.9 183.3 329.3 336.3 194.3 78.6 48.6 12.6 1981-2010
TAUNGGYI 1.0 5.3 9.6 47.3 154.7 116.2 113.1 174.8 185.4 133.9 61.6 7.1 1981-2010
LASHIO 2.7 5.9 9.6 57.1 171.9 178.3 213.0 290.9 280.7 175.6 75.5 10.0 1981-2010
KYAUKME 6.5 9.3 12.9 62.3 252.4 418.4 429.9 391.2 262.1 176.1 79.4 13.7 1983-2010
PINLAUNG 2.7 5.9 9.6 57.1 171.9 178.3 213.0 290.9 280.7 175.6 75.5 10.0 1981-2010
LOILEM 6.5 9.3 12.9 62.3 252.4 418.4 429.9 391.2 262.1 176.1 79.4 13.7 1981-2010
MONG-HSAT 3.2 4.7 7.1 41.9 168.4 163.6 158.1 253.2 293.4 184.0 60.6 8.1 1981-2010
HEHO 7.3 21.5 30.1 65.8 159.9 183.3 329.3 336.3 194.3 78.6 48.6 12.6 1981-2010
HAKHA 10.0 13.1 33.7 70.2 190.8 243.4 320.8 342.3 328.8 209.1 47.1 15.2 1989-2010
FALAM 8.4 11.5 33.0 78.9 161.0 229.7 255.2 261.8 224.3 139.1 53.1 11.2 1981-2010
MINDAT 3.0 6.3 13.0 33.9 169.7 188.8 180.6 287.4 318.8 202.6 57.3 9.6 1981-2010
VARR 5.7 7.6 27.8 58.3 108.5 116.6 145.8 130.6 129.5 89.2 32.8 7.1 1981-2010
MANDALAY 0.9 3.8 5.8 40.4 130.0 99.5 74.7 132.9 157.1 130.7 36.4 4.9 1981-2010
MOEKOK 6.8 11.8 22.0 77.4 362.7 493.3 511.3 479.6 337.3 286.1 85.8 17.0 1982-2010
MEIKHTILA 2.3 1.8 10.0 25.5 126.4 103.8 75.4 121.0 150.6 147.4 41.5 7.2 1981-2010
MYINGYAN 1.2 2.5 2.9 17.6 91.4 85.1 57.2 105.8 151.7 101.6 25.8 3.6 1981-2010
LUNKYAW 0.3 3.2 9.4 30.1 118.5 68.8 67.4 85.7 133.1 111.8 48.0 6.3 1981-2010
35
NYAUNGOO 1.1 2.2 5.1 22.7 94.7 83.8 34.7 85.9 134.0 114.5 36.5 3.7 1981-2010
YAMETHIN 1.7 2.6 8.8 25.1 136.0 104.8 96.8 117.1 152.4 140.2 48.8 9.3 1981-2010
PYINMANA 2.2 5.0 3.9 36.3 156.5 209.1 227.7 263.0 177.0 167.0 50.4 4.8 1981-2010
HLAINGTAT 1.9 2.6 6.2 33.1 142.5 85.2 82.2 124.3 161.9 144.6 62.9 9.6 1981-2010
YEZIN 2.1 5.8 4.2 29.6 147.6 184.7 213.2 256.5 174.9 123.7 39.6 6.9 1983-2010
MAGWAY 1.4 2.4 5.0 18.9 105.4 141.0 100.2 132.0 163.8 132.3 51.1 6.2 1981-2010
MINBU 1.0 1.6 4.7 16.0 95.6 121.0 90.0 126.0 145.4 118.4 42.9 4.5 1981-2010
PAKOKKU 0.9 0.3 3.9 11.1 88.2 89.7 38.2 90.6 117.8 132.0 29.6 4.0 1981-2010
GANGAW 2.0 4.7 10.7 31.1 136.5 183.6 153.2 230.2 215.1 173.4 42.5 6.9 1981-2010
CHAUK 0.4 2.0 2.9 17.8 84.1 138.0 55.6 127.8 167.5 158.2 53.9 5.2 1981-2010
SINPHYU-GYUNG
0.2 1.6 4.2 13.2 84.2 106.3 53.7 88.8 126.9 111.5 35.9 3.6 1981-2010
SITTWE 0.9 13.3 8.4 35.6 307.5 1168.1 1280.5 965.2 549.0 288.7 116.3 15.1 1981-2010
THANDWE 2.6 6.7 4.3 16.6 341.7 1277.6 1390.2 1374.7 675.5 204.6 74.0 11.2 1981-2010
MYAUKOO 4.6 8.1 14.2 52.3 286.1 867.4 1002.5 788.2 355.3 187.1 57.9 10.7 1981-2010
KYAUKPYU 1.1 6.4 20.8 24.5 347.0 1073.1 1248.4 1054.5 540.2 261.6 109.3 16.9 1981-2010
MANAUNG 1.4 4.1 2.9 20.7 313.4 1070.1 1300.0 1086.9 635.7 275.3 106.7 11.4 1981-2010
GWA 1.6 0.7 3.1 19.0 335.2 1016.5 1189.0 1162.5 587.8 197.3 49.4 6.8 1982-2010
TAUNGOO 2.6 4.0 7.3 32.6 204.3 355.9 417.7 451.7 282.5 149.9 48.0 2.6 1981-2010
PYAY 1.5 0.9 5.1 27.3 145.1 234.8 198.0 227.5 205.7 124.0 56.0 1.5 1981-2010
BAGO 1.3 2.7 13.5 44.1 333.9 654.0 716.9 653.4 436.3 183.7 48.7 1.3 1981-2010
SHWEGYIN 1.6 3.7 6.8 46.2 247.8 656.2 797.9 837.9 424.0 197.6 39.2 1.6 1981-2010
THARRAWA-DDY
0.9 3.0 3.5 24.2 212.8 485.5 516.1 448.2 318.2 154.0 60.6 0.9 1981-2010
MINGALADON 0.5 3.1 8.9 34.3 288.6 537.3 565.8 530.8 383.2 195.8 68.4 4.3 1981-2010
KABA-AYE 0.4 3.1 12.4 37.8 328.1 565.6 605.8 570.7 393.7 200.3 58.6 6.8 1981-2010
36
HMAWBI 2.2 3.5 7.2 28.2 281.3 526.4 540.7 534.8 349.4 164.3 57.8 5.4 1981-2010
COCO ISLAND 2.2 5.2 13.2 37.0 240.0 456.3 418.3 438.8 380.2 184.3 138.3 23.0 1981-2010
MAUBIN 1.3 3.6 8.9 38.2 280.3 494.5 535.9 514.2 338.2 186.3 68.5 7.8 1981-2010
PATHEIN 1.8 9.4 7.4 26.9 275.5 605.7 646.9 636.2 385.0 205.6 80.3 7.0 1981-2010
MYAUNG-MYA 0.3 2.6 5.7 26.7 277.0 577.1 617.7 650.9 396.8 197.6 88.1 8.9 1981-2010
NGATHAI-GYAUNG
1.3 2.3 4.8 25.6 232.5 517.2 607.2 572.8 328.7 161.8 22.0 4.5 1989-2010
HINTHADA 7.1 30.4 23.4 25.8 207.5 522.5 519.8 481.8 316.6 155.4 62.9 7.2 1981-2010
LOIKAW 5.1 3.1 10.0 37.7 139.6 135.7 146.5 210.5 194.2 109.4 46.2 7.9 1981-2010
HPA-AN 1.2 3.6 12.6 45.7 376.9 872.4 1047.2 1097.2 577.0 193.1 40.7 16.3 1981-2010
KAWKAREIK 3.5 9.6 22.6 73.8 407.5 833.2 1049.4 1105.7 616.6 234.2 33.7 7.1 1981-2010
MAWLAMYINE 2.2 6.0 17.4 117.2 517.7 988.9 1183.5 1227.0 632.6 214.9 46.1 16.3 1981-2010
YAY 3.2 16.8 24.0 84.9 528.9 1111.3 1171.6 1320.5 687.9 285.3 57.0 23.7 1981-2010
BILIN 1.1 9.1 16.4 63.8 478.3 1081.1 1270.2 1200.7 684.8 230.5 44.0 7.1 1981-2010
THEINZAYAT 3.1 6.6 8.4 43.2 351.2 716.2 878.4 871.6 485.7 204.8 31.5 6.3 1981-2010
THATON 1.4 4.1 18.4 80.5 555.8 1036.4 1213.8 1245.0 739.1 258.3 55.9 13.4 1981-2010
DAWEI 5.8 16.6 39.5 115.3 536.3 1099.4 1201.4 1310.4 707.3 355.8 44.5 7.6 1981-2010
MYEIK 26.3 41.7 55.4 106.0 444.3 748.4 713.7 894.9 514.6 313.3 65.5 19.1 1981-2010
KAWTHUNG 6.7 8.0 52.6 106.6 542.8 686.1 651.8 754.6 685.2 480.4 158.3 40.3 1981-2010
37
6 Frequency of common weather in Myanmar
6.1 Temperature
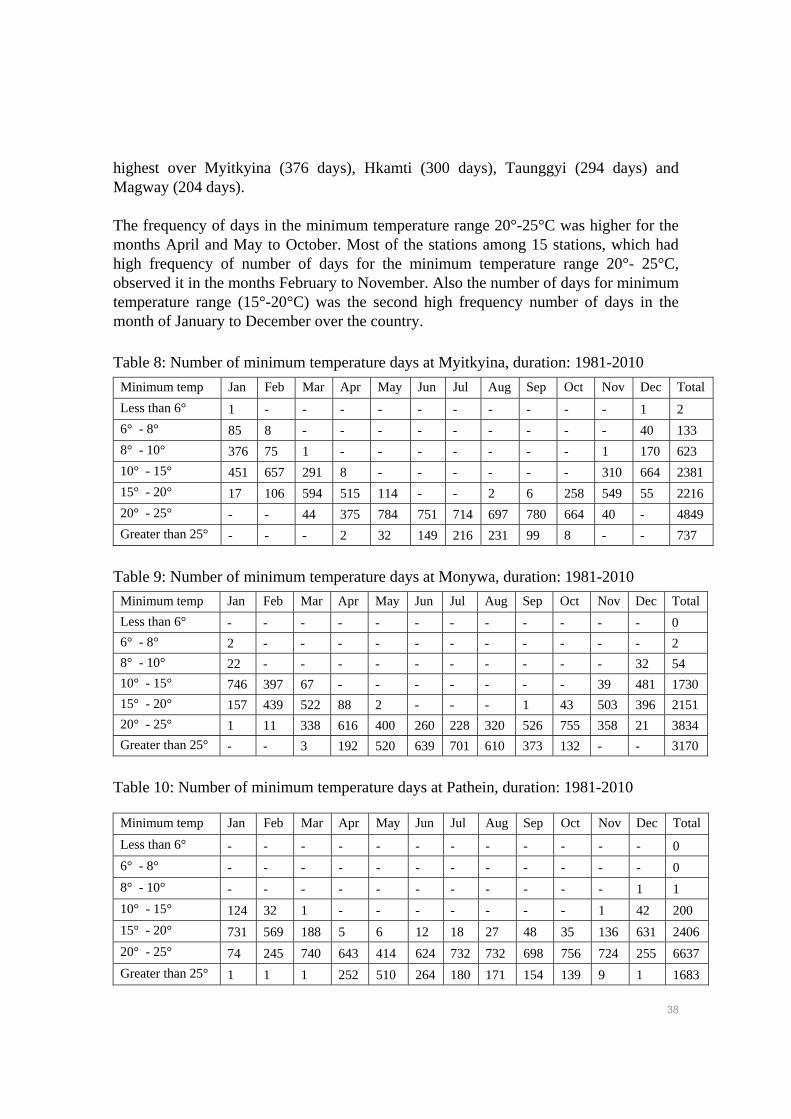
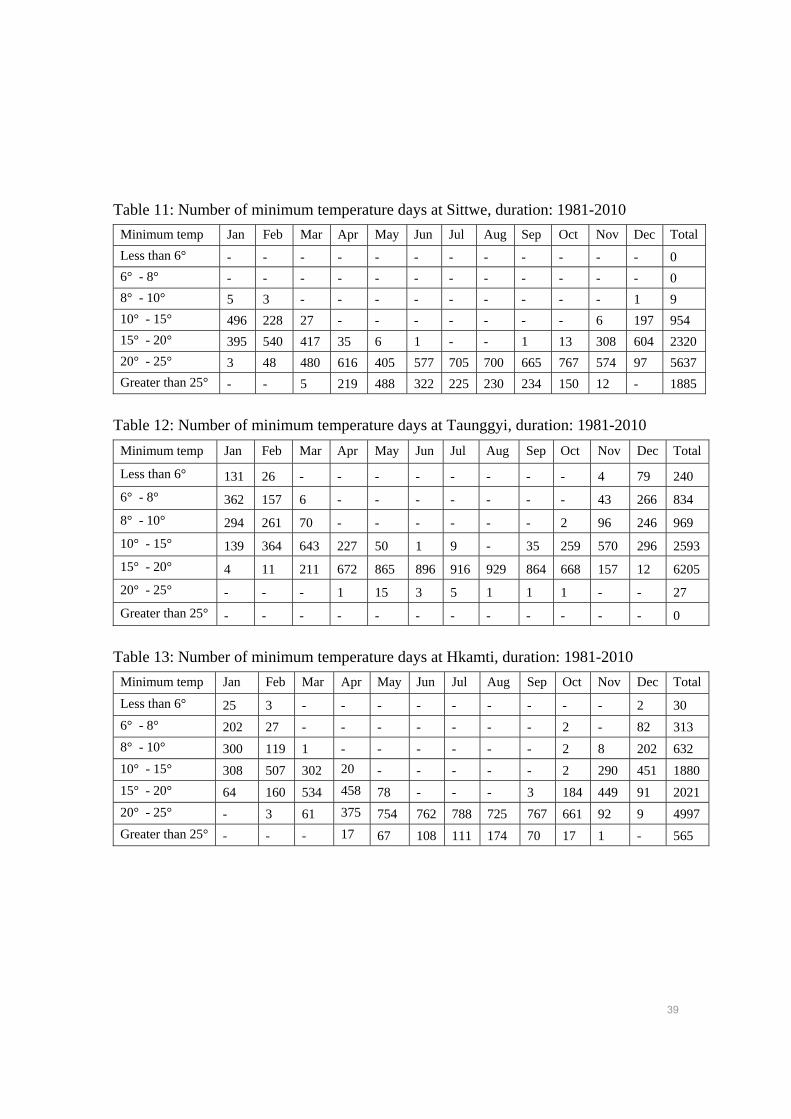
6.1.1 Minimum Temperature
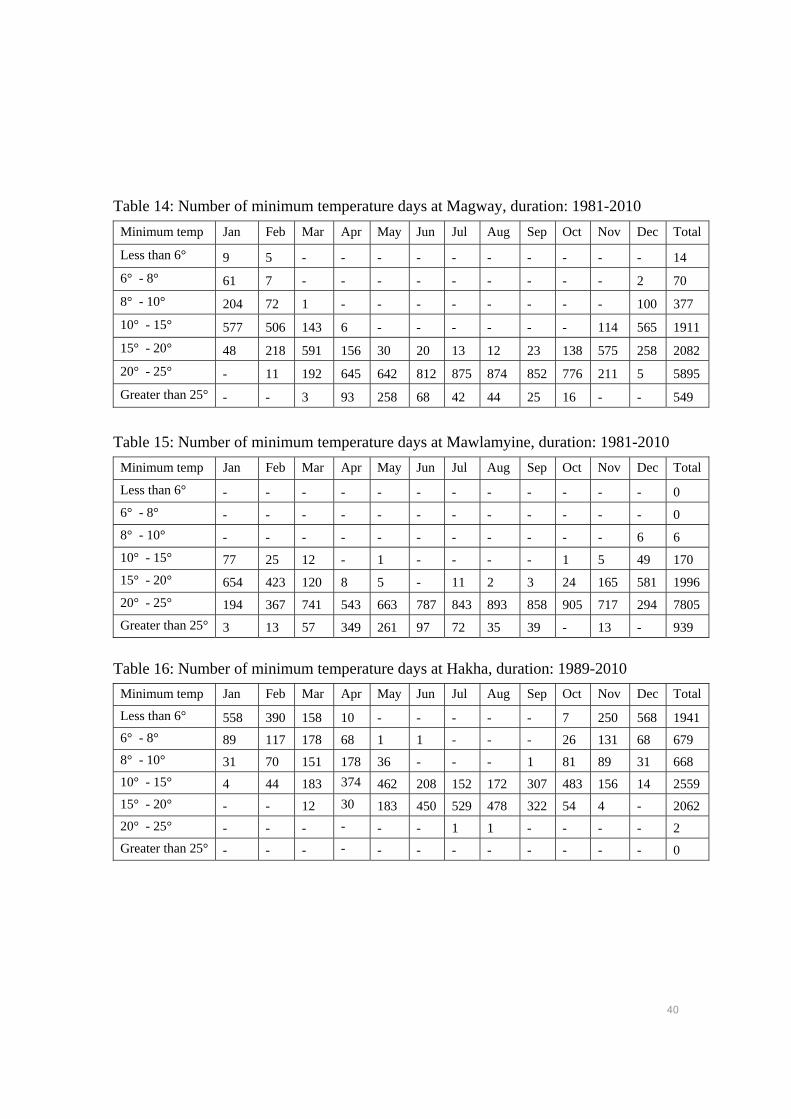
The number of days of minimum temperature for several temperature ranges i.e. less than 6°C, 6-8°C, 8-10°C, 10-15°C, 15-20°C, 20-25°C and greater than 25°C were calculated and this operation was carried out for all the stations and all months for the period of 1981-2010. Table 8 to Table 16 show the results for different cities representing the states and regions of Myanmar, namely Myitkyina, Monywa, Pathein, Sittwe, Taunggyi, Hkamti, Magway, Mawlamyine and Hakha. The results for the rest of the weather stations of Myanmar are presented in the Appendix. During the study period 1981-2010, some of the stations have missing data. The number of days of minimum temperature that range less than 6°C, i.e. severe cold days, were highest in the Northwestern, Eastern, Northern, Western and Central area of the country. This range of temperature mostly occur in the month of January and a very few days in February. The number of days in the range less than 6°C were Hakha (558 days), Taunggyi (131days), Hkamti (25 days), Magway (9 days), and Myitkyina (1 day) in the month of January and Hakha (390 days), Taunggyi (26 days), Magway (5 days), and Hkamti (3 days) in the month of February. In the month of January moderate cold days (6-8°C) had maximum frequency in the Northern, Northwestern, Western, Eastern, and Central area of the country and highest number of days occurred over Taunggyi (362 days), Loikaw (209 days), Hkamti (202 days) and Hakha (89 days), Myitkyina (85 days) and Magway (61 days). Cold days had maximum frequency in the month of January, as it is the coldest month over Myanmar. The number of days in the minimum temperature range 8-10 °C was
38
highest over Myitkyina (376 days), Hkamti (300 days), Taunggyi (294 days) and Magway (204 days). The frequency of days in the minimum temperature range 20°-25°C was higher for the months April and May to October. Most of the stations among 15 stations, which had high frequency of number of days for the minimum temperature range 20°- 25°C, observed it in the months February to November. Also the number of days for minimum temperature range (15°-20°C) was the second high frequency number of days in the month of January to December over the country.
Table 8: Number of minimum temperature days at Myitkyina, duration: 1981-2010
Minimum temp Jan Feb Mar Apr May Jun Jul Aug Sep Oct Nov Dec Total
Less than 6° 1 - - - - - - - - - - 1 2
6° - 8° 85 8 - - - - - - - - - 40 133
8° - 10° 376 75 1 - - - - - - - 1 170 623
10° - 15° 451 657 291 8 - - - - - - 310 664 2381
15° - 20° 17 106 594 515 114 - - 2 6 258 549 55 2216
20° - 25° - - 44 375 784 751 714 697 780 664 40 - 4849
Greater than 25° - - - 2 32 149 216 231 99 8 - - 737
Table 9: Number of minimum temperature days at Monywa, duration: 1981-2010
Minimum temp Jan Feb Mar Apr May Jun Jul Aug Sep Oct Nov Dec Total
Less than 6° - - - - - - - - - - - - 0
6° - 8° 2 - - - - - - - - - - - 2
8° - 10° 22 - - - - - - - - - - 32 54
10° - 15° 746 397 67 - - - - - - - 39 481 1730
15° - 20° 157 439 522 88 2 - - - 1 43 503 396 2151
20° - 25° 1 11 338 616 400 260 228 320 526 755 358 21 3834
Greater than 25° - - 3 192 520 639 701 610 373 132 - - 3170
Table 10: Number of minimum temperature days at Pathein, duration: 1981-2010
Minimum temp Jan Feb Mar Apr May Jun Jul Aug Sep Oct Nov Dec Total
Less than 6° - - - - - - - - - - - - 0
6° - 8° - - - - - - - - - - - - 0
8° - 10° - - - - - - - - - - - 1 1
10° - 15° 124 32 1 - - - - - - - 1 42 200
15° - 20° 731 569 188 5 6 12 18 27 48 35 136 631 2406
20° - 25° 74 245 740 643 414 624 732 732 698 756 724 255 6637
Greater than 25° 1 1 1 252 510 264 180 171 154 139 9 1 1683
39
Table 11: Number of minimum temperature days at Sittwe, duration: 1981-2010
Minimum temp Jan Feb Mar Apr May Jun Jul Aug Sep Oct Nov Dec Total
Less than 6° - - - - - - - - - - - - 0
6° - 8° - - - - - - - - - - - - 0
8° - 10° 5 3 - - - - - - - - - 1 9
10° - 15° 496 228 27 - - - - - - - 6 197 954
15° - 20° 395 540 417 35 6 1 - - 1 13 308 604 2320
20° - 25° 3 48 480 616 405 577 705 700 665 767 574 97 5637
Greater than 25° - - 5 219 488 322 225 230 234 150 12 - 1885
Table 12: Number of minimum temperature days at Taunggyi, duration: 1981-2010
Minimum temp Jan Feb Mar Apr May Jun Jul Aug Sep Oct Nov Dec Total
Less than 6° 131 26 - - - - - - - - 4 79 240
6° - 8° 362 157 6 - - - - - - - 43 266 834
8° - 10° 294 261 70 - - - - - - 2 96 246 969
10° - 15° 139 364 643 227 50 1 9 - 35 259 570 296 2593
15° - 20° 4 11 211 672 865 896 916 929 864 668 157 12 6205
20° - 25° - - - 1 15 3 5 1 1 1 - - 27
Greater than 25° - - - - - - - - - - - - 0
Table 13: Number of minimum temperature days at Hkamti, duration: 1981-2010
Minimum temp Jan Feb Mar Apr May Jun Jul Aug Sep Oct Nov Dec Total
Less than 6° 25 3 - - - - - - - - - 2 30
6° - 8° 202 27 - - - - - - - 2 - 82 313
8° - 10° 300 119 1 - - - - - - 2 8 202 632
10° - 15° 308 507 302 20 - - - - - 2 290 451 1880
15° - 20° 64 160 534 458 78 - - - 3 184 449 91 2021
20° - 25° - 3 61 375 754 762 788 725 767 661 92 9 4997
Greater than 25° - - - 17 67 108 111 174 70 17 1 - 565
40
Table 14: Number of minimum temperature days at Magway, duration: 1981-2010
Minimum temp Jan Feb Mar Apr May Jun Jul Aug Sep Oct Nov Dec Total
Less than 6° 9 5 - - - - - - - - - - 14
6° - 8° 61 7 - - - - - - - - - 2 70
8° - 10° 204 72 1 - - - - - - - - 100 377
10° - 15° 577 506 143 6 - - - - - - 114 565 1911
15° - 20° 48 218 591 156 30 20 13 12 23 138 575 258 2082
20° - 25° - 11 192 645 642 812 875 874 852 776 211 5 5895
Greater than 25° - - 3 93 258 68 42 44 25 16 - - 549
Table 15: Number of minimum temperature days at Mawlamyine, duration: 1981-2010
Minimum temp Jan Feb Mar Apr May Jun Jul Aug Sep Oct Nov Dec Total
Less than 6° - - - - - - - - - - - - 0
6° - 8° - - - - - - - - - - - - 0
8° - 10° - - - - - - - - - - - 6 6
10° - 15° 77 25 12 - 1 - - - - 1 5 49 170
15° - 20° 654 423 120 8 5 - 11 2 3 24 165 581 1996
20° - 25° 194 367 741 543 663 787 843 893 858 905 717 294 7805
Greater than 25° 3 13 57 349 261 97 72 35 39 - 13 - 939
Table 16: Number of minimum temperature days at Hakha, duration: 1989-2010
Minimum temp Jan Feb Mar Apr May Jun Jul Aug Sep Oct Nov Dec Total
Less than 6° 558 390 158 10 - - - - - 7 250 568 1941
6° - 8° 89 117 178 68 1 1 - - - 26 131 68 679
8° - 10° 31 70 151 178 36 - - - 1 81 89 31 668
10° - 15° 4 44 183 374 462 208 152 172 307 483 156 14 2559
15° - 20° - - 12 30 183 450 529 478 322 54 4 - 2062
20° - 25° - - - - - - 1 1 - - - - 2
Greater than 25° - - - - - - - - - - - - 0
41
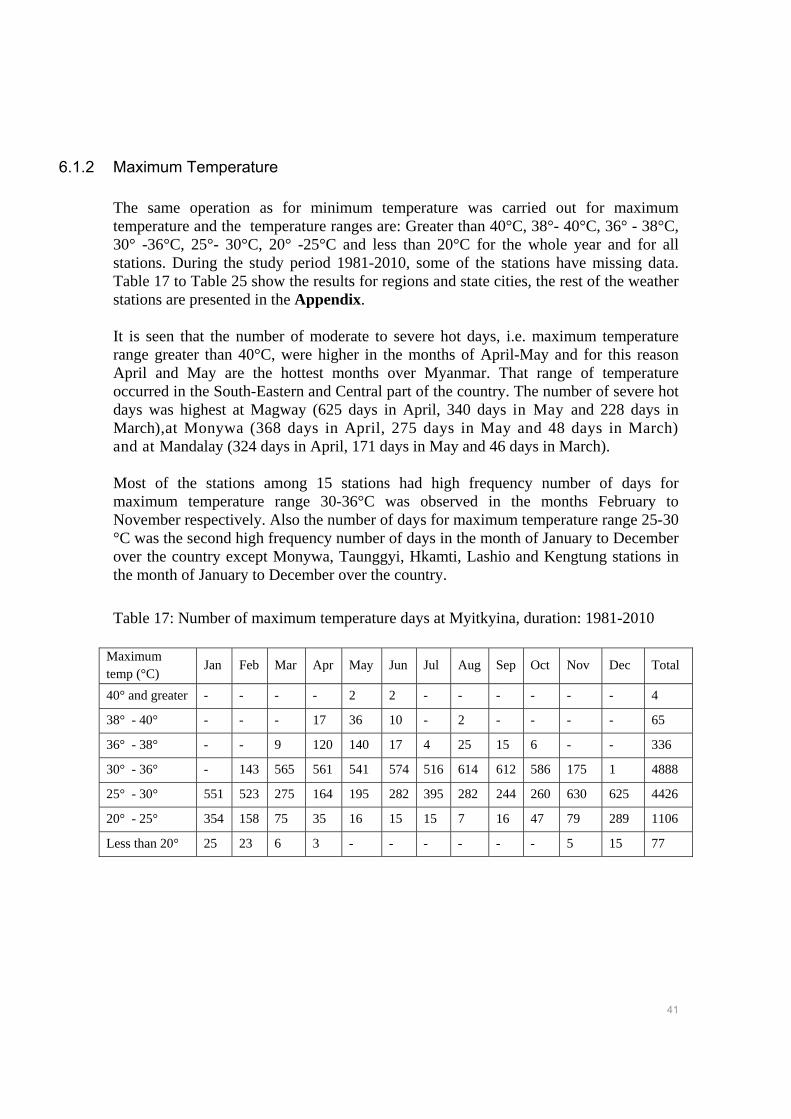
6.1.2 Maximum Temperature
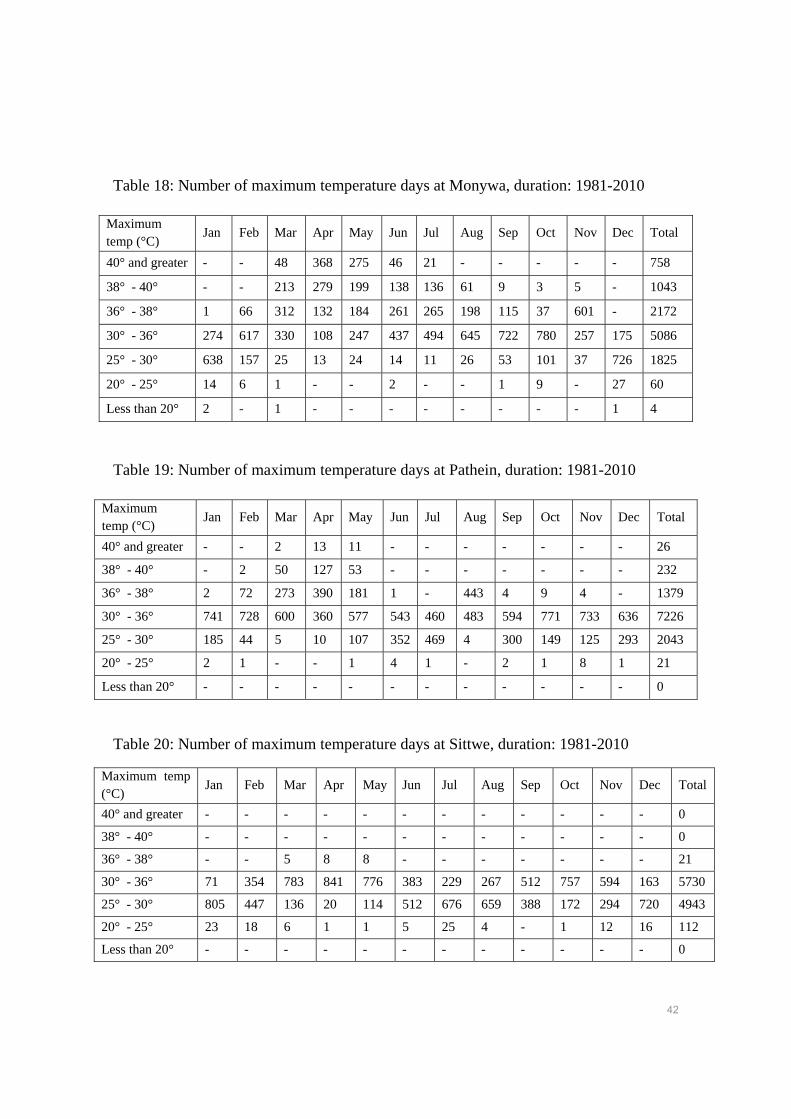
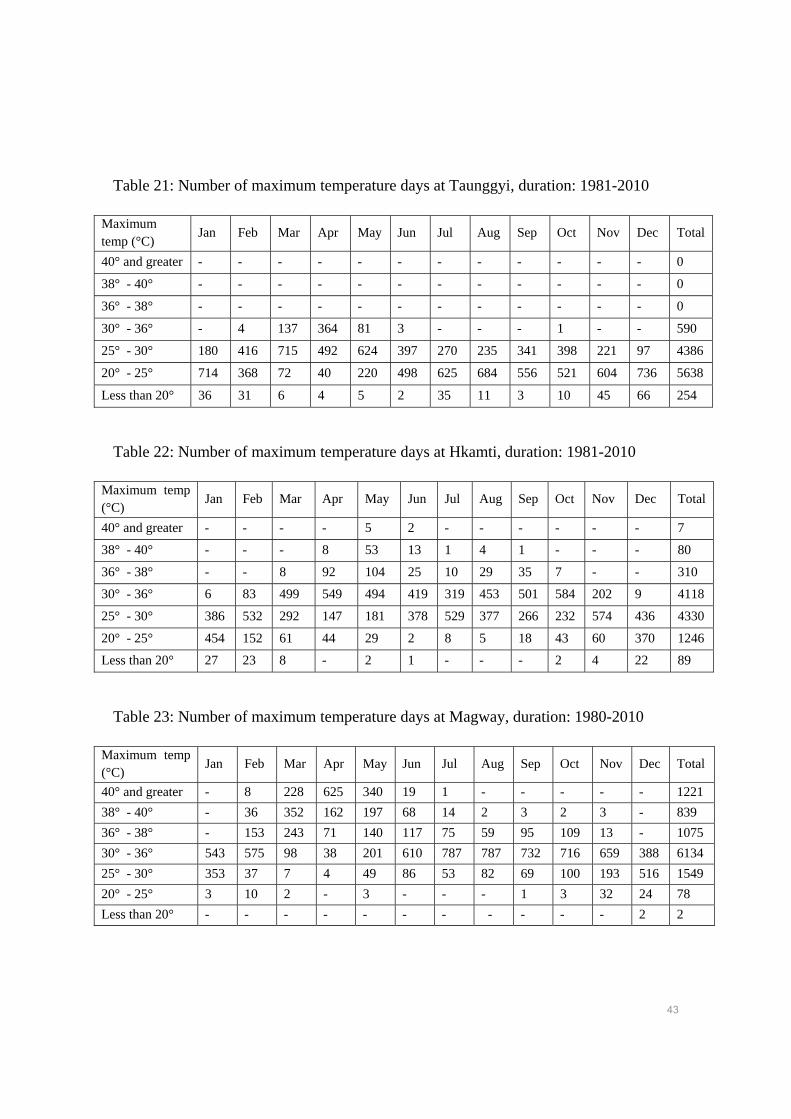
The same operation as for minimum temperature was carried out for maximum temperature and the temperature ranges are: Greater than 40°C, 38°- 40°C, 36° - 38°C, 30° -36°C, 25°- 30°C, 20° -25°C and less than 20°C for the whole year and for all stations. During the study period 1981-2010, some of the stations have missing data. Table 17 to Table 25 show the results for regions and state cities, the rest of the weather stations are presented in the Appendix. It is seen that the number of moderate to severe hot days, i.e. maximum temperature range greater than 40°C, were higher in the months of April-May and for this reason April and May are the hottest months over Myanmar. That range of temperature occurred in the South-Eastern and Central part of the country. The number of severe hot days was highest at Magway (625 days in April, 340 days in May and 228 days in March),at Monywa (368 days in April, 275 days in May and 48 days in March) and at Mandalay (324 days in April, 171 days in May and 46 days in March). Most of the stations among 15 stations had high frequency number of days for maximum temperature range 30-36°C was observed in the months February to November respectively. Also the number of days for maximum temperature range 25-30 °C was the second high frequency number of days in the month of January to December over the country except Monywa, Taunggyi, Hkamti, Lashio and Kengtung stations in the month of January to December over the country.
Table 17: Number of maximum temperature days at Myitkyina, duration: 1981-2010
Maximum temp (°C)
Jan Feb Mar Apr May Jun Jul Aug Sep Oct Nov Dec Total
40° and greater - - - - 2 2 - - - - - - 4
38° - 40° - - - 17 36 10 - 2 - - - - 65
36° - 38° - - 9 120 140 17 4 25 15 6 - - 336
30° - 36° - 143 565 561 541 574 516 614 612 586 175 1 4888
25° - 30° 551 523 275 164 195 282 395 282 244 260 630 625 4426
20° - 25° 354 158 75 35 16 15 15 7 16 47 79 289 1106
Less than 20° 25 23 6 3 - - - - - - 5 15 77
42
Table 18: Number of maximum temperature days at Monywa, duration: 1981-2010
Table 19: Number of maximum temperature days at Pathein, duration: 1981-2010
Table 20: Number of maximum temperature days at Sittwe, duration: 1981-2010
Maximum temp (°C)
Jan Feb Mar Apr May Jun Jul Aug Sep Oct Nov Dec Total
40° and greater - - 48 368 275 46 21 - - - - - 758
38° - 40° - - 213 279 199 138 136 61 9 3 5 - 1043
36° - 38° 1 66 312 132 184 261 265 198 115 37 601 - 2172
30° - 36° 274 617 330 108 247 437 494 645 722 780 257 175 5086
25° - 30° 638 157 25 13 24 14 11 26 53 101 37 726 1825
20° - 25° 14 6 1 - - 2 - - 1 9 - 27 60
Less than 20° 2 - 1 - - - - - - - - 1 4
Maximum temp (°C)
Jan Feb Mar Apr May Jun Jul Aug Sep Oct Nov Dec Total
40° and greater - - 2 13 11 - - - - - - - 26
38° - 40° - 2 50 127 53 - - - - - - - 232
36° - 38° 2 72 273 390 181 1 - 443 4 9 4 - 1379
30° - 36° 741 728 600 360 577 543 460 483 594 771 733 636 7226
25° - 30° 185 44 5 10 107 352 469 4 300 149 125 293 2043
20° - 25° 2 1 - - 1 4 1 - 2 1 8 1 21
Less than 20° - - - - - - - - - - - - 0
Maximum temp (°C)
Jan Feb Mar Apr May Jun Jul Aug Sep Oct Nov Dec Total
40° and greater - - - - - - - - - - - - 0
38° - 40° - - - - - - - - - - - - 0
36° - 38° - - 5 8 8 - - - - - - - 21
30° - 36° 71 354 783 841 776 383 229 267 512 757 594 163 5730
25° - 30° 805 447 136 20 114 512 676 659 388 172 294 720 4943
20° - 25° 23 18 6 1 1 5 25 4 - 1 12 16 112
Less than 20° - - - - - - - - - - - - 0
43
Table 21: Number of maximum temperature days at Taunggyi, duration: 1981-2010
Table 22: Number of maximum temperature days at Hkamti, duration: 1981-2010
Table 23: Number of maximum temperature days at Magway, duration: 1980-2010
Maximum temp (°C)
Jan Feb Mar Apr May Jun Jul Aug Sep Oct Nov Dec Total
40° and greater - - - - - - - - - - - - 0
38° - 40° - - - - - - - - - - - - 0
36° - 38° - - - - - - - - - - - - 0
30° - 36° - 4 137 364 81 3 - - - 1 - - 590
25° - 30° 180 416 715 492 624 397 270 235 341 398 221 97 4386
20° - 25° 714 368 72 40 220 498 625 684 556 521 604 736 5638
Less than 20° 36 31 6 4 5 2 35 11 3 10 45 66 254
Maximum temp (°C)
Jan Feb Mar Apr May Jun Jul Aug Sep Oct Nov Dec Total
40° and greater - - - - 5 2 - - - - - - 7
38° - 40° - - - 8 53 13 1 4 1 - - - 80
36° - 38° - - 8 92 104 25 10 29 35 7 - - 310
30° - 36° 6 83 499 549 494 419 319 453 501 584 202 9 4118
25° - 30° 386 532 292 147 181 378 529 377 266 232 574 436 4330
20° - 25° 454 152 61 44 29 2 8 5 18 43 60 370 1246
Less than 20° 27 23 8 - 2 1 - - - 2 4 22 89
Maximum temp (°C)
Jan Feb Mar Apr May Jun Jul Aug Sep Oct Nov Dec Total
40° and greater - 8 228 625 340 19 1 - - - - - 1221
38° - 40° - 36 352 162 197 68 14 2 3 2 3 - 839
36° - 38° - 153 243 71 140 117 75 59 95 109 13 - 1075
30° - 36° 543 575 98 38 201 610 787 787 732 716 659 388 6134
25° - 30° 353 37 7 4 49 86 53 82 69 100 193 516 1549
20° - 25° 3 10 2 - 3 - - - 1 3 32 24 78
Less than 20° - - - - - - - - - - - 2 2
44
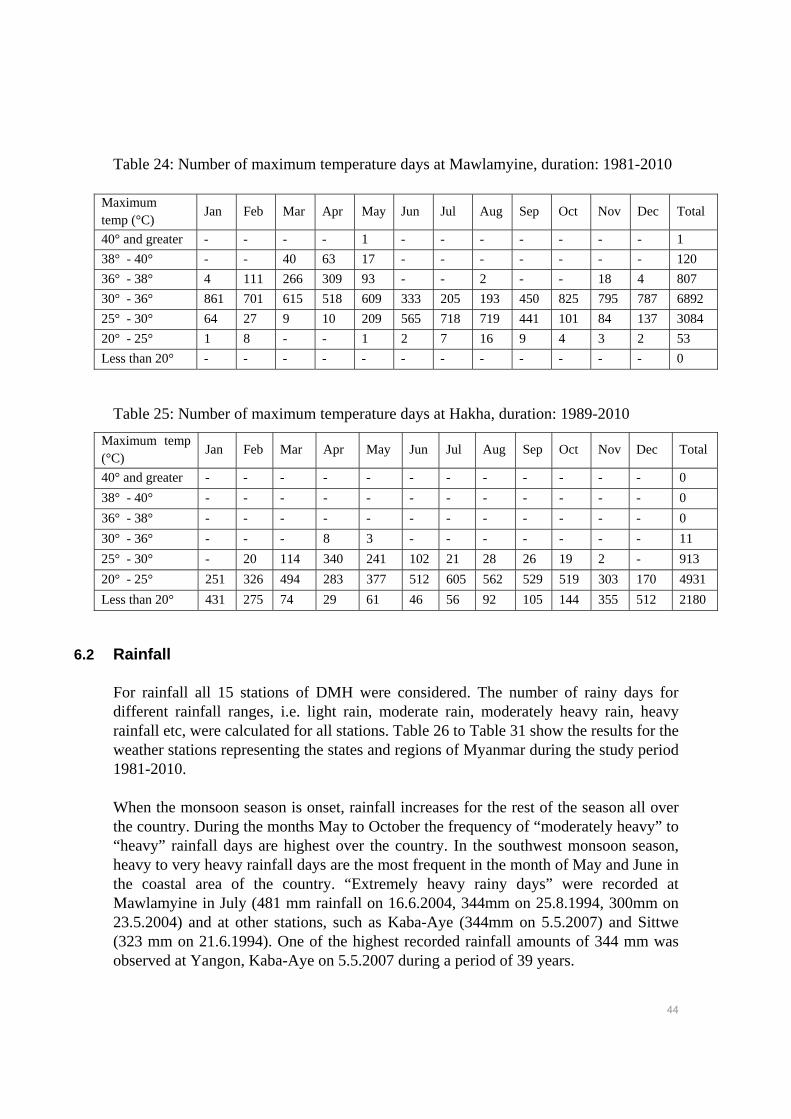
Table 24: Number of maximum temperature days at Mawlamyine, duration: 1981-2010
Table 25: Number of maximum temperature days at Hakha, duration: 1989-2010
6.2 Rainfall
For rainfall all 15 stations of DMH were considered. The number of rainy days for different rainfall ranges, i.e. light rain, moderate rain, moderately heavy rain, heavy rainfall etc, were calculated for all stations. Table 26 to Table 31 show the results for the weather stations representing the states and regions of Myanmar during the study period 1981-2010. When the monsoon season is onset, rainfall increases for the rest of the season all over the country. During the months May to October the frequency of “moderately heavy” to “heavy” rainfall days are highest over the country. In the southwest monsoon season, heavy to very heavy rainfall days are the most frequent in the month of May and June in the coastal area of the country. “Extremely heavy rainy days” were recorded at Mawlamyine in July (481 mm rainfall on 16.6.2004, 344mm on 25.8.1994, 300mm on 23.5.2004) and at other stations, such as Kaba-Aye (344mm on 5.5.2007) and Sittwe (323 mm on 21.6.1994). One of the highest recorded rainfall amounts of 344 mm was observed at Yangon, Kaba-Aye on 5.5.2007 during a period of 39 years.
Maximum temp (°C)
Jan Feb Mar Apr May Jun Jul Aug Sep Oct Nov Dec Total
40° and greater - - - - 1 - - - - - - - 1
38° - 40° - - 40 63 17 - - - - - - - 120
36° - 38° 4 111 266 309 93 - - 2 - - 18 4 807
30° - 36° 861 701 615 518 609 333 205 193 450 825 795 787 6892
25° - 30° 64 27 9 10 209 565 718 719 441 101 84 137 3084
20° - 25° 1 8 - - 1 2 7 16 9 4 3 2 53
Less than 20° - - - - - - - - - - - - 0
Maximum temp (°C)
Jan Feb Mar Apr May Jun Jul Aug Sep Oct Nov Dec Total
40° and greater - - - - - - - - - - - - 0
38° - 40° - - - - - - - - - - - - 0
36° - 38° - - - - - - - - - - - - 0
30° - 36° - - - 8 3 - - - - - - - 11
25° - 30° - 20 114 340 241 102 21 28 26 19 2 - 913
20° - 25° 251 326 494 283 377 512 605 562 529 519 303 170 4931
Less than 20° 431 275 74 29 61 46 56 92 105 144 355 512 2180
45
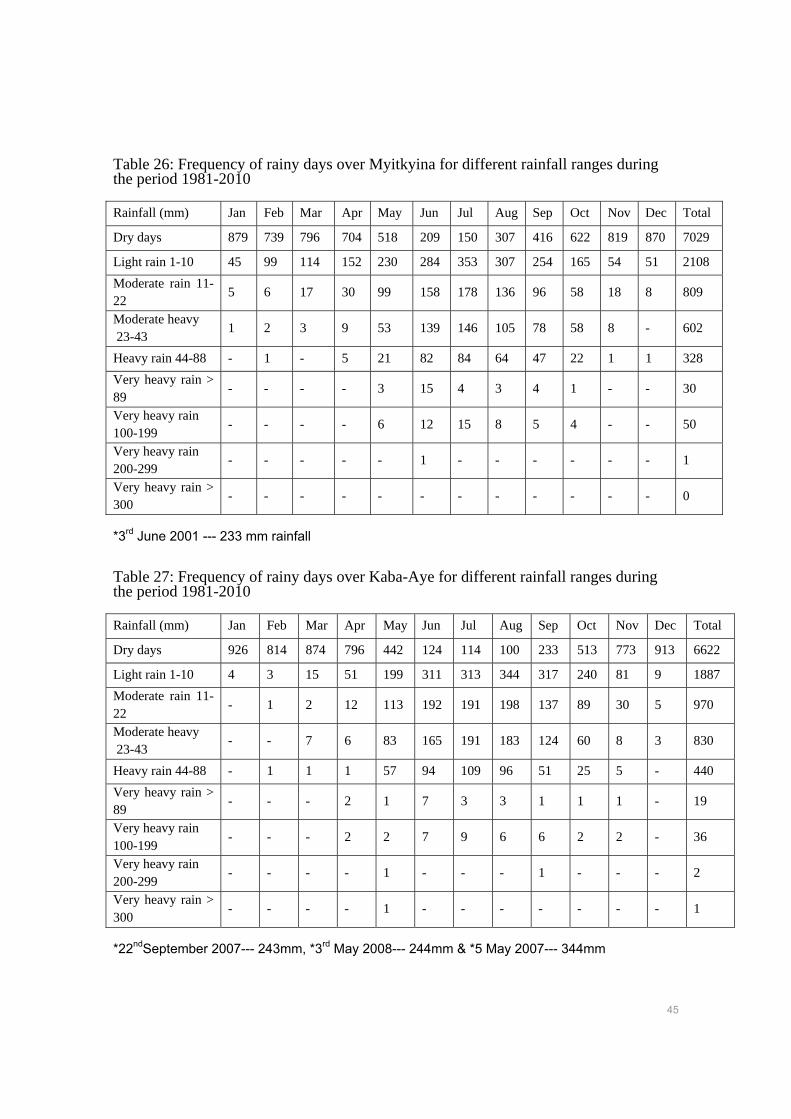
Table 26: Frequency of rainy days over Myitkyina for different rainfall ranges during the period 1981-2010
*3rd June 2001 --- 233 mm rainfall
Table 27: Frequency of rainy days over Kaba-Aye for different rainfall ranges during the period 1981-2010
*22ndSeptember 2007--- 243mm, *3rd May 2008--- 244mm & *5 May 2007--- 344mm
Rainfall (mm) Jan Feb Mar Apr May Jun Jul Aug Sep Oct Nov Dec Total
Dry days 879 739 796 704 518 209 150 307 416 622 819 870 7029
Light rain 1-10 45 99 114 152 230 284 353 307 254 165 54 51 2108
Moderate rain 11-22
5 6 17 30 99 158 178 136 96 58 18 8 809
Moderate heavy 23-43
1 2 3 9 53 139 146 105 78 58 8 - 602
Heavy rain 44-88 - 1 - 5 21 82 84 64 47 22 1 1 328
Very heavy rain > 89
- - - - 3 15 4 3 4 1 - - 30
Very heavy rain 100-199
- - - - 6 12 15 8 5 4 - - 50
Very heavy rain 200-299
- - - - - 1 - - - - - - 1
Very heavy rain > 300
- - - - - - - - - - - - 0
Rainfall (mm) Jan Feb Mar Apr May Jun Jul Aug Sep Oct Nov Dec Total
Dry days 926 814 874 796 442 124 114 100 233 513 773 913 6622
Light rain 1-10 4 3 15 51 199 311 313 344 317 240 81 9 1887
Moderate rain 11-22
- 1 2 12 113 192 191 198 137 89 30 5 970
Moderate heavy 23-43
- - 7 6 83 165 191 183 124 60 8 3 830
Heavy rain 44-88 - 1 1 1 57 94 109 96 51 25 5 - 440
Very heavy rain > 89
- - - 2 1 7 3 3 1 1 1 - 19
Very heavy rain 100-199
- - - 2 2 7 9 6 6 2 2 - 36
Very heavy rain 200-299
- - - - 1 - - - 1 - - - 2
Very heavy rain > 300
- - - - 1 - - - - - - - 1
46
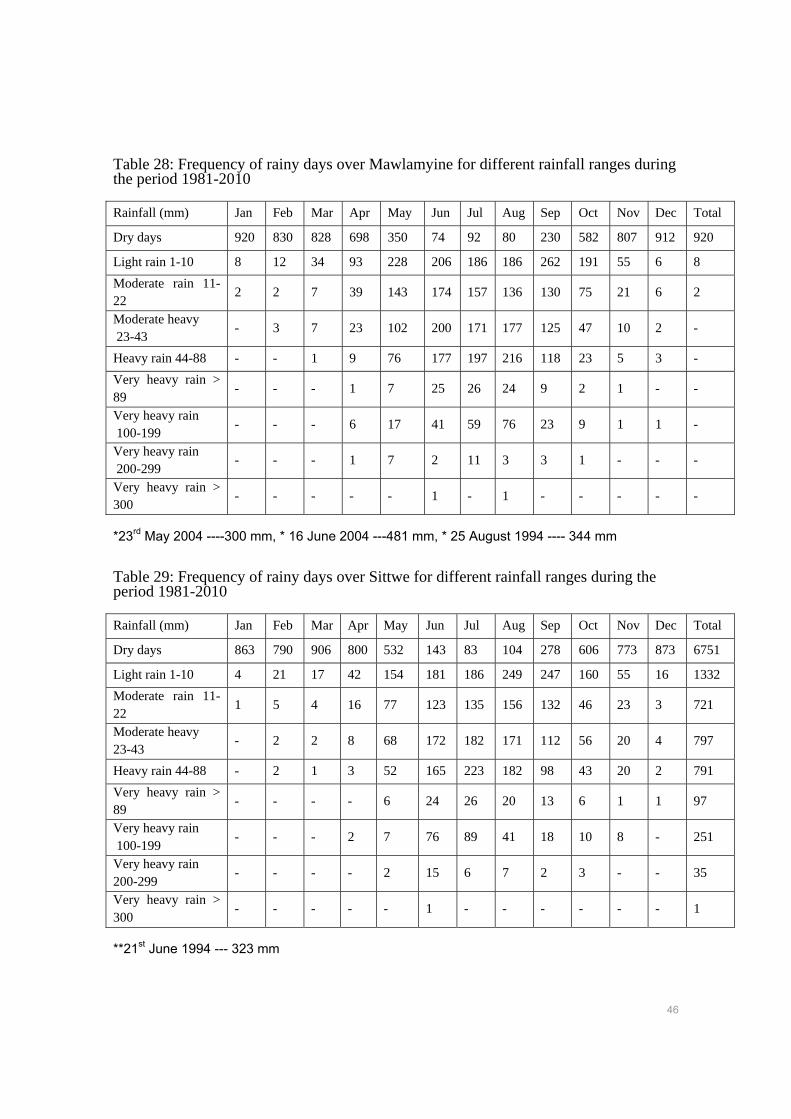
Table 28: Frequency of rainy days over Mawlamyine for different rainfall ranges during the period 1981-2010
*23rd May 2004 ----300 mm, * 16 June 2004 ---481 mm, * 25 August 1994 ---- 344 mm
Table 29: Frequency of rainy days over Sittwe for different rainfall ranges during the period 1981-2010
**21st June 1994 --- 323 mm
Rainfall (mm) Jan Feb Mar Apr May Jun Jul Aug Sep Oct Nov Dec Total
Dry days 920 830 828 698 350 74 92 80 230 582 807 912 920
Light rain 1-10 8 12 34 93 228 206 186 186 262 191 55 6 8
Moderate rain 11-22
2 2 7 39 143 174 157 136 130 75 21 6 2
Moderate heavy 23-43
- 3 7 23 102 200 171 177 125 47 10 2 -
Heavy rain 44-88 - - 1 9 76 177 197 216 118 23 5 3 -
Very heavy rain > 89
- - - 1 7 25 26 24 9 2 1 - -
Very heavy rain 100-199
- - - 6 17 41 59 76 23 9 1 1 -
Very heavy rain 200-299
- - - 1 7 2 11 3 3 1 - - -
Very heavy rain > 300
- - - - - 1 - 1 - - - - -
Rainfall (mm) Jan Feb Mar Apr May Jun Jul Aug Sep Oct Nov Dec Total
Dry days 863 790 906 800 532 143 83 104 278 606 773 873 6751
Light rain 1-10 4 21 17 42 154 181 186 249 247 160 55 16 1332
Moderate rain 11-22
1 5 4 16 77 123 135 156 132 46 23 3 721
Moderate heavy 23-43
- 2 2 8 68 172 182 171 112 56 20 4 797
Heavy rain 44-88 - 2 1 3 52 165 223 182 98 43 20 2 791
Very heavy rain > 89
- - - - 6 24 26 20 13 6 1 1 97
Very heavy rain 100-199
- - - 2 7 76 89 41 18 10 8 - 251
Very heavy rain 200-299
- - - - 2 15 6 7 2 3 - - 35
Very heavy rain > 300
- - - - - 1 - - - - - - 1
47
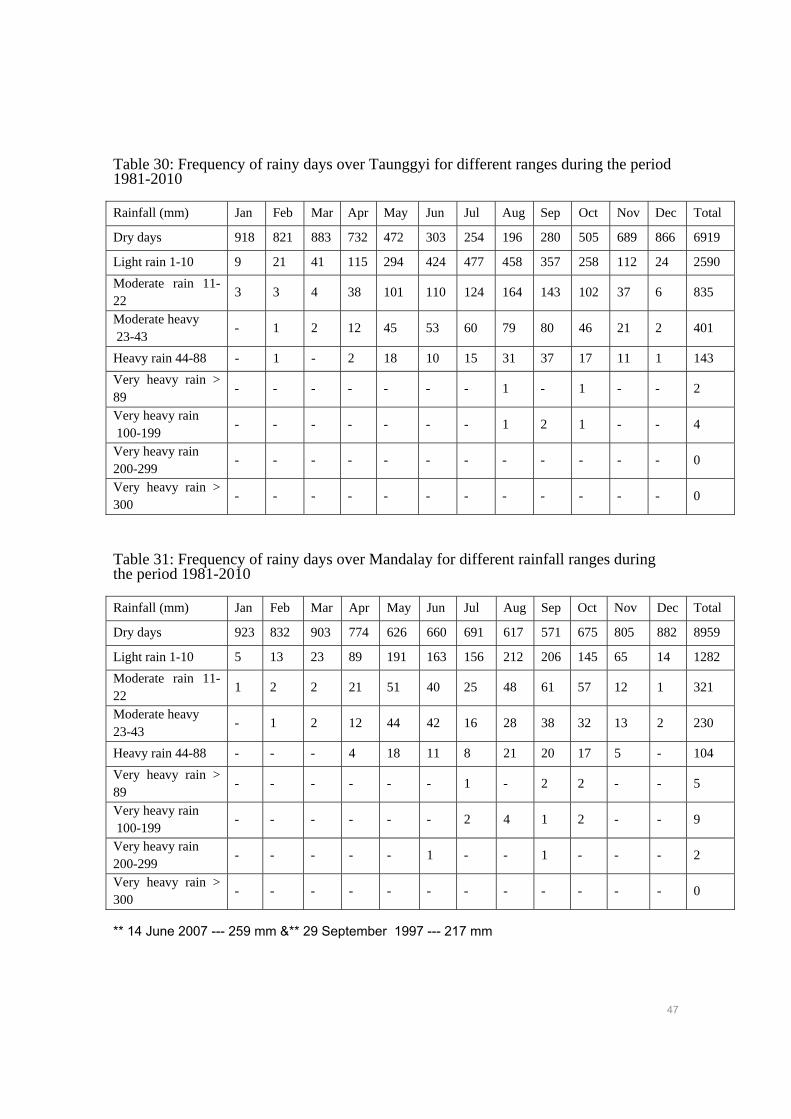
Table 30: Frequency of rainy days over Taunggyi for different ranges during the period 1981-2010
Table 31: Frequency of rainy days over Mandalay for different rainfall ranges during the period 1981-2010
** 14 June 2007 --- 259 mm &** 29 September 1997 --- 217 mm
Rainfall (mm) Jan Feb Mar Apr May Jun Jul Aug Sep Oct Nov Dec Total
Dry days 918 821 883 732 472 303 254 196 280 505 689 866 6919
Light rain 1-10 9 21 41 115 294 424 477 458 357 258 112 24 2590
Moderate rain 11-22
3 3 4 38 101 110 124 164 143 102 37 6 835
Moderate heavy 23-43
- 1 2 12 45 53 60 79 80 46 21 2 401
Heavy rain 44-88 - 1 - 2 18 10 15 31 37 17 11 1 143
Very heavy rain > 89
- - - - - - - 1 - 1 - - 2
Very heavy rain 100-199
- - - - - - - 1 2 1 - - 4
Very heavy rain 200-299
- - - - - - - - - - - - 0
Very heavy rain > 300
- - - - - - - - - - - - 0
Rainfall (mm) Jan Feb Mar Apr May Jun Jul Aug Sep Oct Nov Dec Total
Dry days 923 832 903 774 626 660 691 617 571 675 805 882 8959
Light rain 1-10 5 13 23 89 191 163 156 212 206 145 65 14 1282
Moderate rain 11-22
1 2 2 21 51 40 25 48 61 57 12 1 321
Moderate heavy 23-43
- 1 2 12 44 42 16 28 38 32 13 2 230
Heavy rain 44-88 - - - 4 18 11 8 21 20 17 5 - 104
Very heavy rain > 89
- - - - - - 1 - 2 2 - - 5
Very heavy rain 100-199
- - - - - - 2 4 1 2 - - 9
Very heavy rain 200-299
- - - - - 1 - - 1 - - - 2
Very heavy rain > 300
- - - - - - - - - - - - 0
48
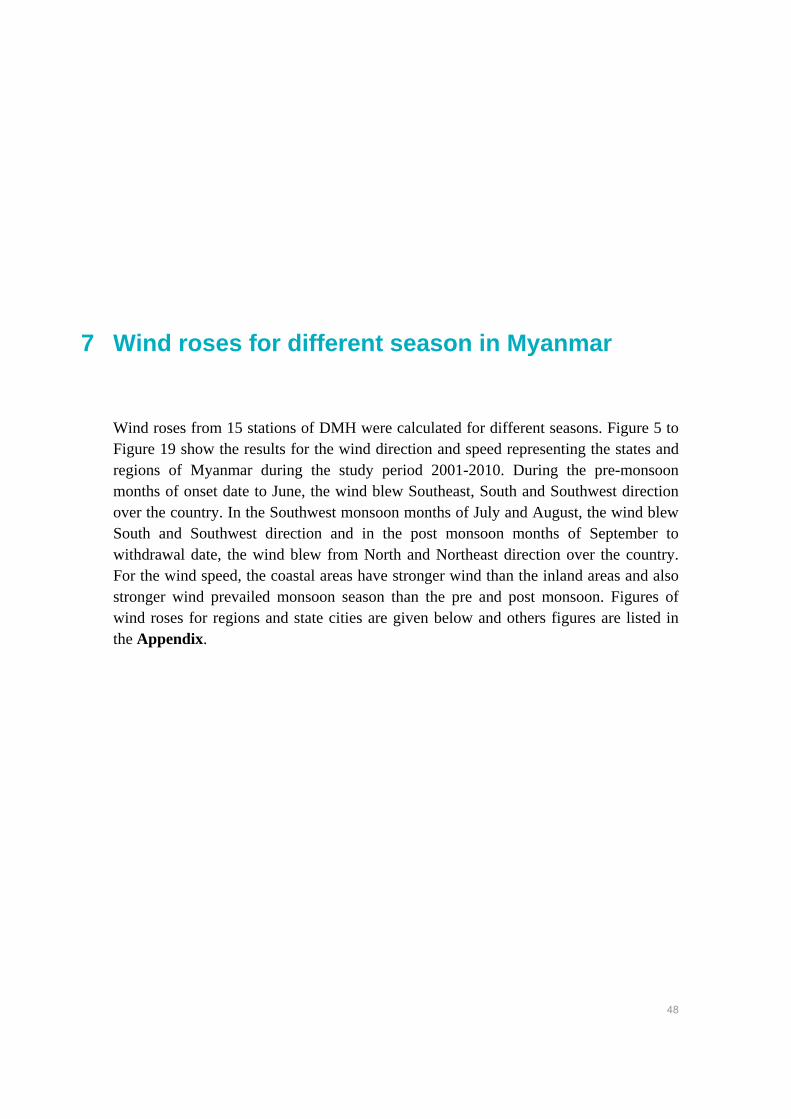
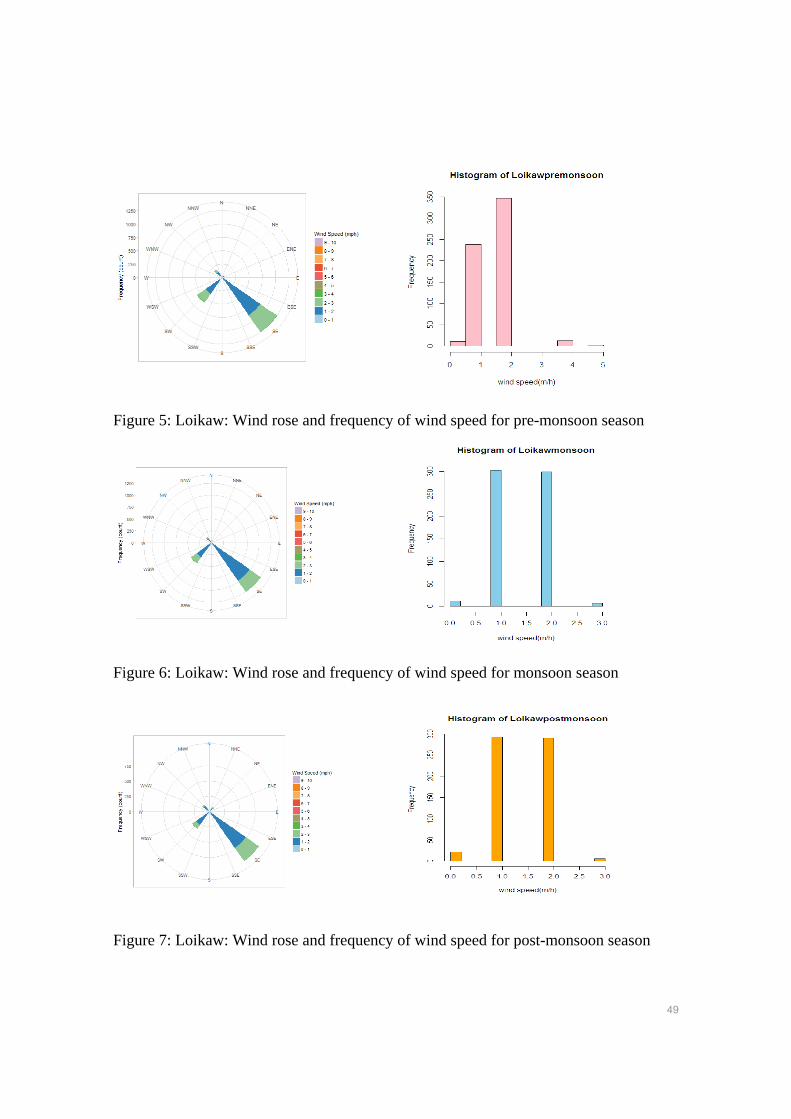
7 Wind roses for different season in Myanmar
Wind roses from 15 stations of DMH were calculated for different seasons. Figure 5 to Figure 19 show the results for the wind direction and speed representing the states and regions of Myanmar during the study period 2001-2010. During the pre-monsoon months of onset date to June, the wind blew Southeast, South and Southwest direction over the country. In the Southwest monsoon months of July and August, the wind blew South and Southwest direction and in the post monsoon months of September to withdrawal date, the wind blew from North and Northeast direction over the country. For the wind speed, the coastal areas have stronger wind than the inland areas and also stronger wind prevailed monsoon season than the pre and post monsoon. Figures of wind roses for regions and state cities are given below and others figures are listed in the Appendix.
49
Figure 5: Loikaw: Wind rose and frequency of wind speed for pre-monsoon season
Figure 6: Loikaw: Wind rose and frequency of wind speed for monsoon season
Figure 7: Loikaw: Wind rose and frequency of wind speed for post-monsoon season
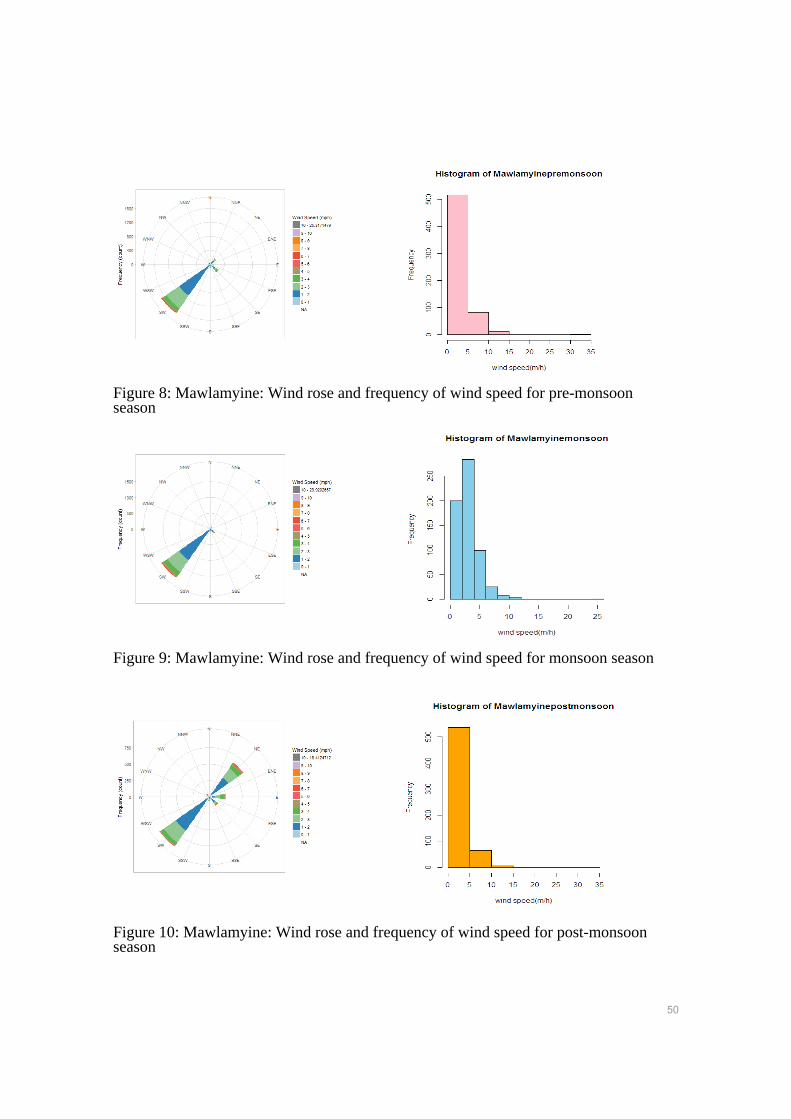
50
Figure 8: Mawlamyine: Wind rose and frequency of wind speed for pre-monsoon season
Figure 9: Mawlamyine: Wind rose and frequency of wind speed for monsoon season
Figure 10: Mawlamyine: Wind rose and frequency of wind speed for post-monsoon season
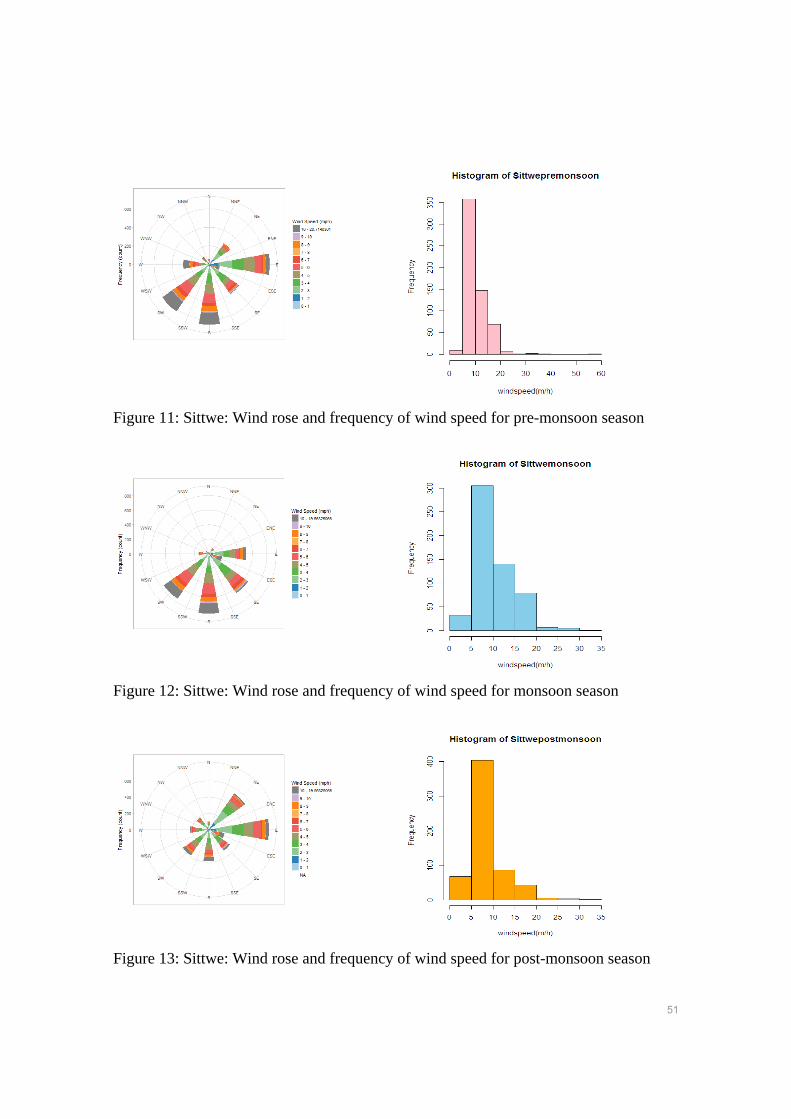
51
Figure 11: Sittwe: Wind rose and frequency of wind speed for pre-monsoon season
Figure 12: Sittwe: Wind rose and frequency of wind speed for monsoon season
Figure 13: Sittwe: Wind rose and frequency of wind speed for post-monsoon season
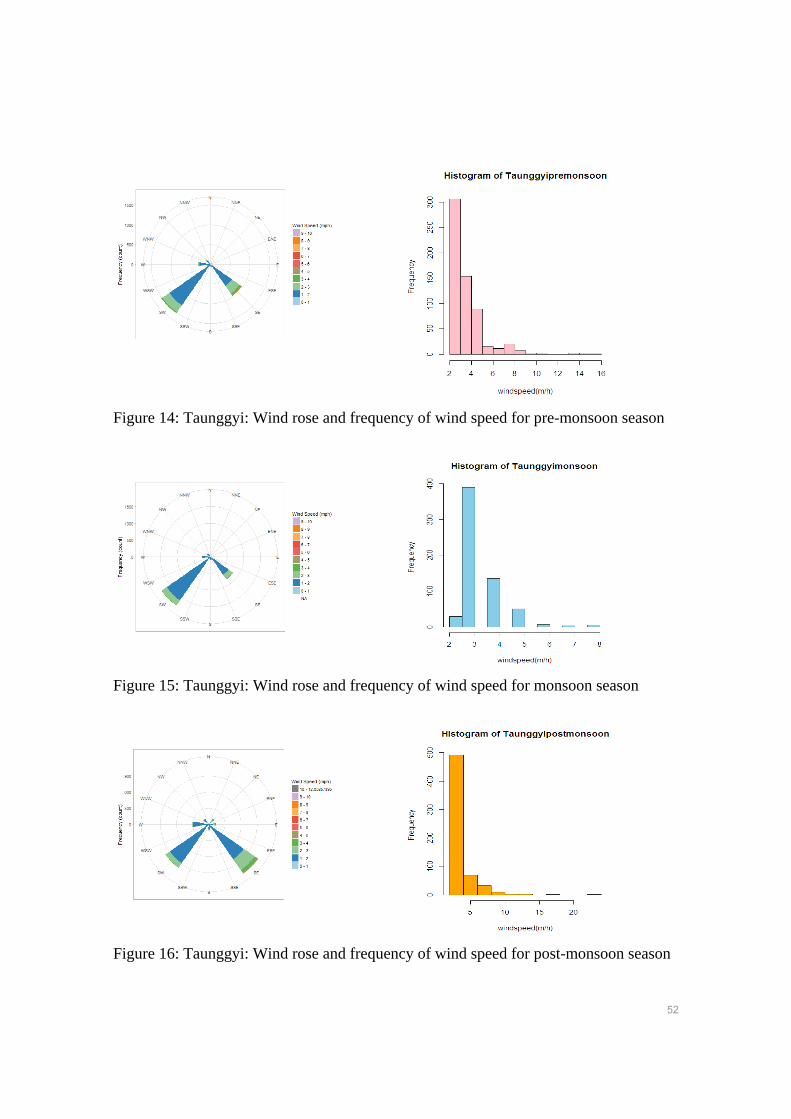
52
Figure 14: Taunggyi: Wind rose and frequency of wind speed for pre-monsoon season
Figure 15: Taunggyi: Wind rose and frequency of wind speed for monsoon season
Figure 16: Taunggyi: Wind rose and frequency of wind speed for post-monsoon season
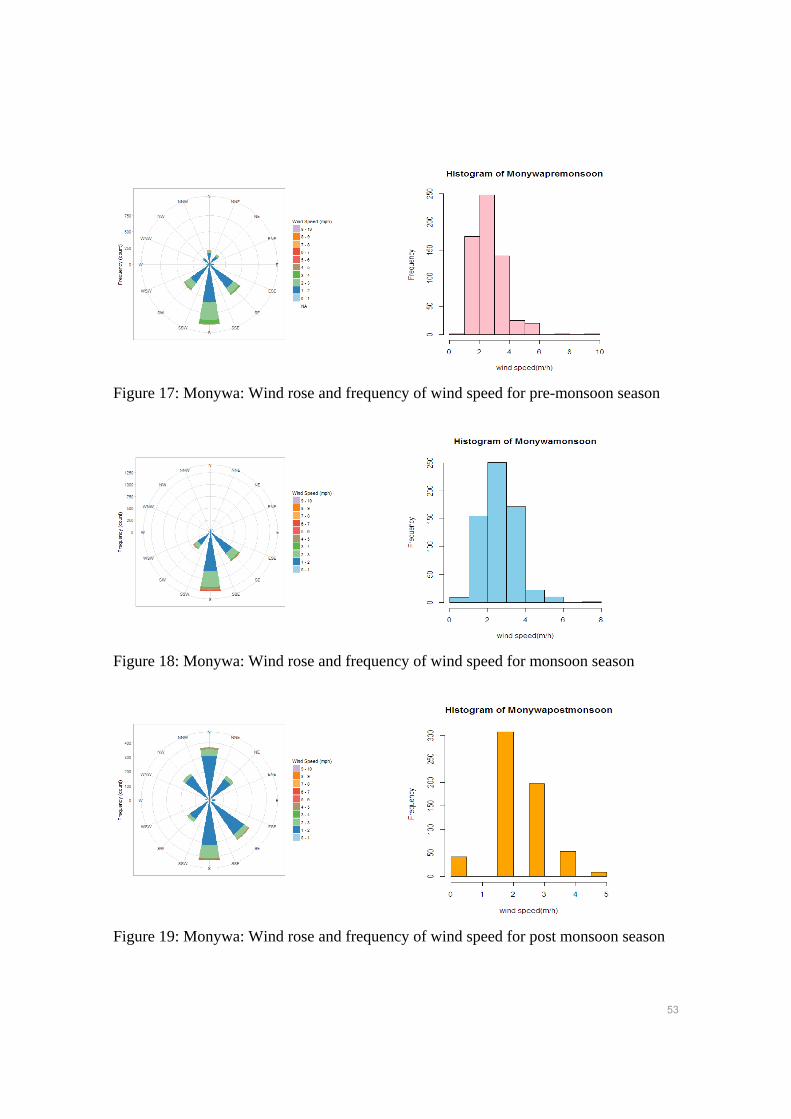
53
Figure 17: Monywa: Wind rose and frequency of wind speed for pre-monsoon season
Figure 18: Monywa: Wind rose and frequency of wind speed for monsoon season
Figure 19: Monywa: Wind rose and frequency of wind speed for post monsoon season
54
8 Detected changes in Myanmar Climate
8.1 Temperature Trends
It was very clear from temperature trend analysis that the both maximum and minimum temperature showed increasing trends for 9 stations, the other 7 stations as Sittwe, Pathein, Kaba-Aye, Dawei, Hpa-an, Hkamti and Hakha showed increasing trend for maximum temperature and decreasing trend for minimum temperature over all parts of the country. The trends from some stations were not statistically significant. The highest rate of decreasing minimum temperature trends over 35 years was 2.6°C at Kaba-Aye and 2.3°C at Hkamti. The highest rate of increasing maximum temperature trends over 35 years was 1.6°C at Monywa. The deviation for Tmax was calculated following the formula: Tmaxn – Tmaxnormal, and the deviation for Tmin was calculated by Tminn – Tminnormal, where “n” represents each year and “normal” is the Tmax or Tmin normals calculated for the period 1981-2010.
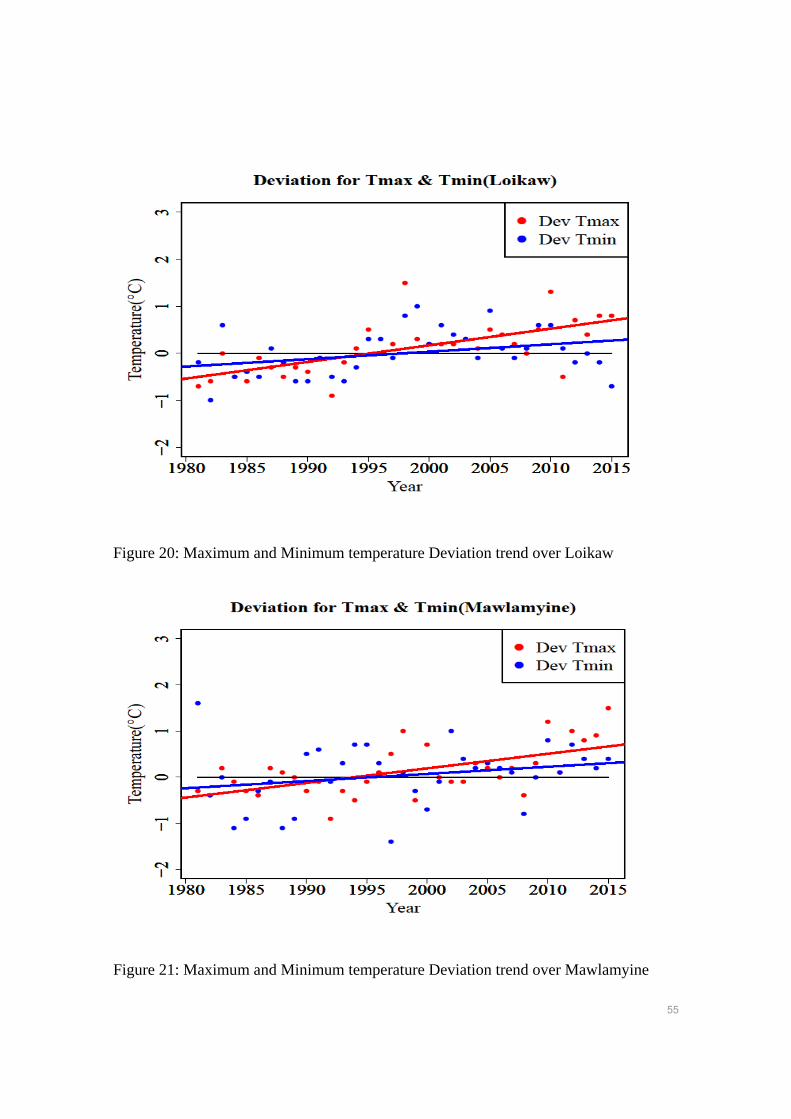
55
Figure 20: Maximum and Minimum temperature Deviation trend over Loikaw
Figure 21: Maximum and Minimum temperature Deviation trend over Mawlamyine
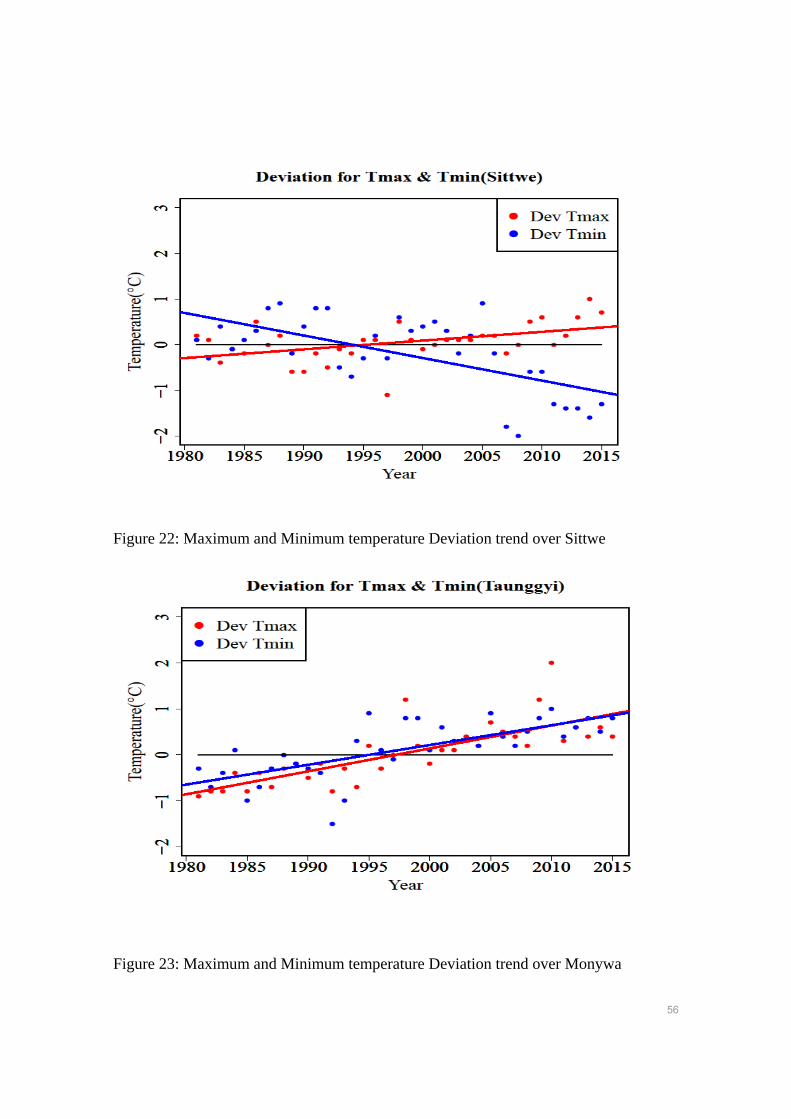
56
Figure 22: Maximum and Minimum temperature Deviation trend over Sittwe
Figure 23: Maximum and Minimum temperature Deviation trend over Monywa
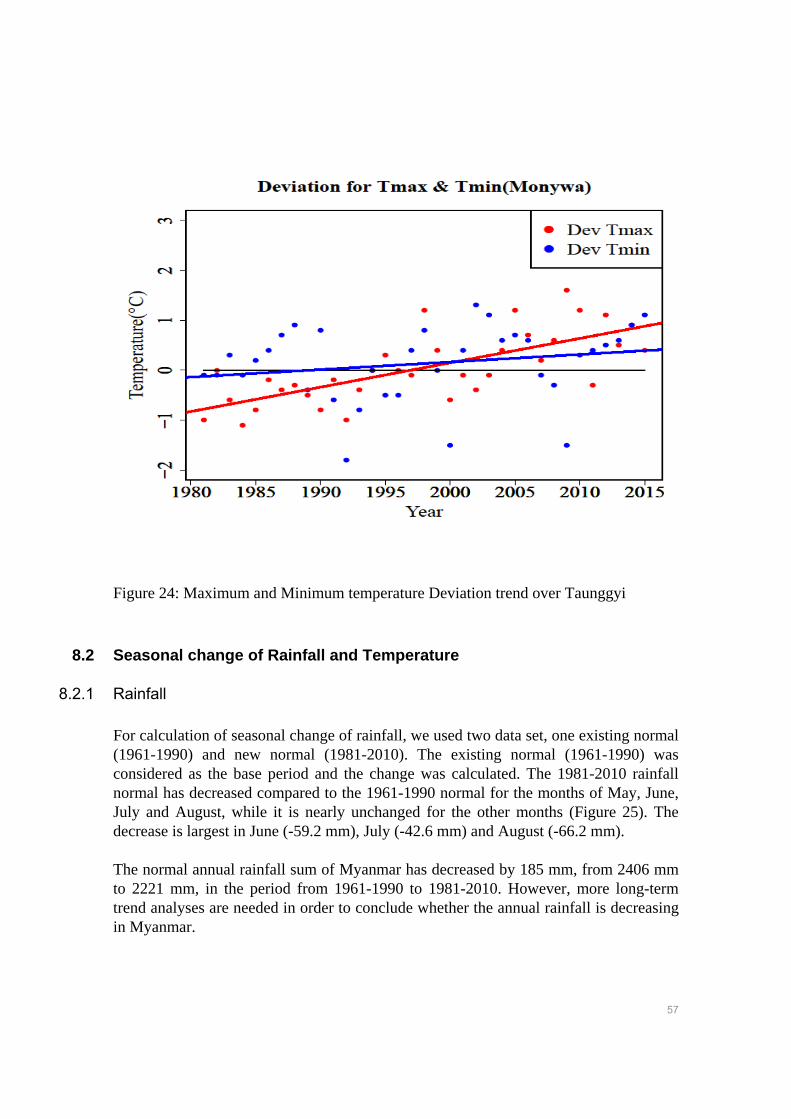
57
Figure 24: Maximum and Minimum temperature Deviation trend over Taunggyi
8.2 Seasonal change of Rainfall and Temperature
8.2.1 Rainfall
For calculation of seasonal change of rainfall, we used two data set, one existing normal (1961-1990) and new normal (1981-2010). The existing normal (1961-1990) was considered as the base period and the change was calculated. The 1981-2010 rainfall normal has decreased compared to the 1961-1990 normal for the months of May, June, July and August, while it is nearly unchanged for the other months (Figure 25). The decrease is largest in June (-59.2 mm), July (-42.6 mm) and August (-66.2 mm). The normal annual rainfall sum of Myanmar has decreased by 185 mm, from 2406 mm to 2221 mm, in the period from 1961-1990 to 1981-2010. However, more long-term trend analyses are needed in order to conclude whether the annual rainfall is decreasing in Myanmar.
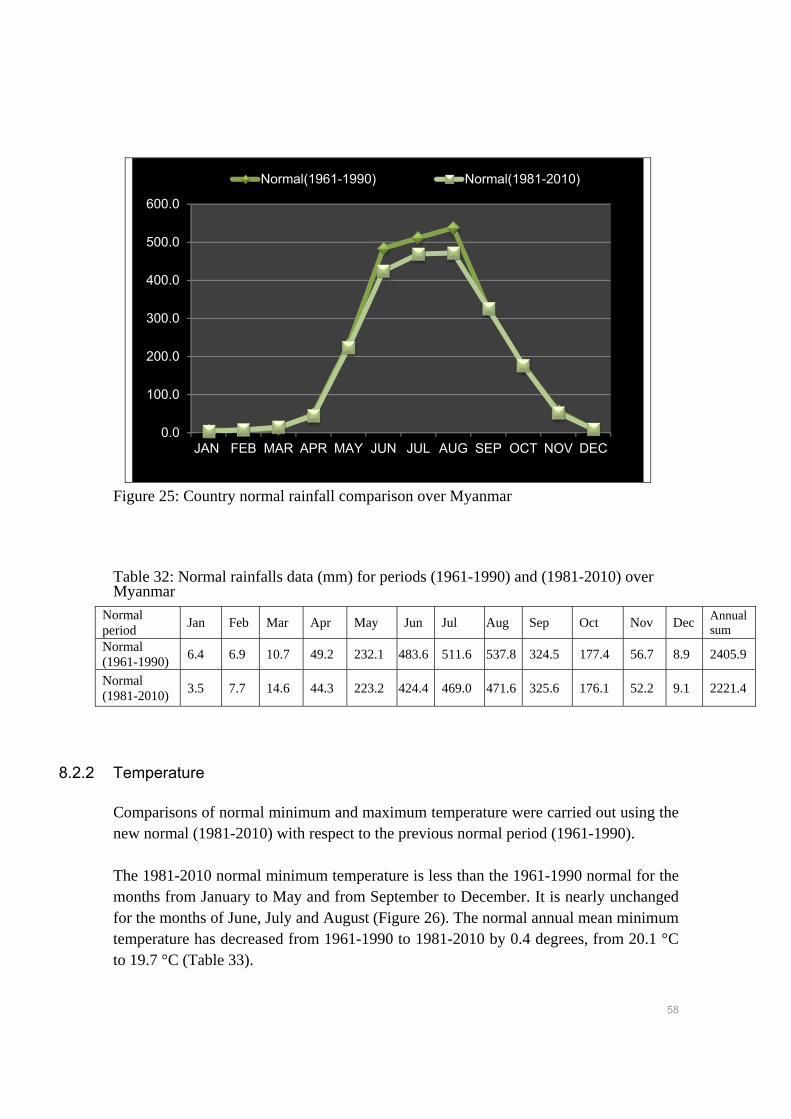
58
Figure 25: Country normal rainfall comparison over Myanmar
Table 32: Normal rainfalls data (mm) for periods (1961-1990) and (1981-2010) over Myanmar
Normal period
Jan Feb Mar Apr May Jun Jul Aug Sep Oct Nov Dec Annual sum
Normal (1961-1990)
6.4 6.9 10.7 49.2 232.1 483.6 511.6 537.8 324.5 177.4 56.7 8.9 2405.9
Normal (1981-2010)
3.5 7.7 14.6 44.3 223.2 424.4 469.0 471.6 325.6 176.1 52.2 9.1 2221.4
8.2.2 Temperature
Comparisons of normal minimum and maximum temperature were carried out using the new normal (1981-2010) with respect to the previous normal period (1961-1990). The 1981-2010 normal minimum temperature is less than the 1961-1990 normal for the months from January to May and from September to December. It is nearly unchanged for the months of June, July and August (Figure 26). The normal annual mean minimum temperature has decreased from 1961-1990 to 1981-2010 by 0.4 degrees, from 20.1 °C to 19.7 °C (Table 33).
0.0
100.0
200.0
300.0
400.0
500.0
600.0
JAN FEB MAR APR MAY JUN JUL AUG SEP OCT NOV DEC
Normal(1961-1990) Normal(1981-2010)
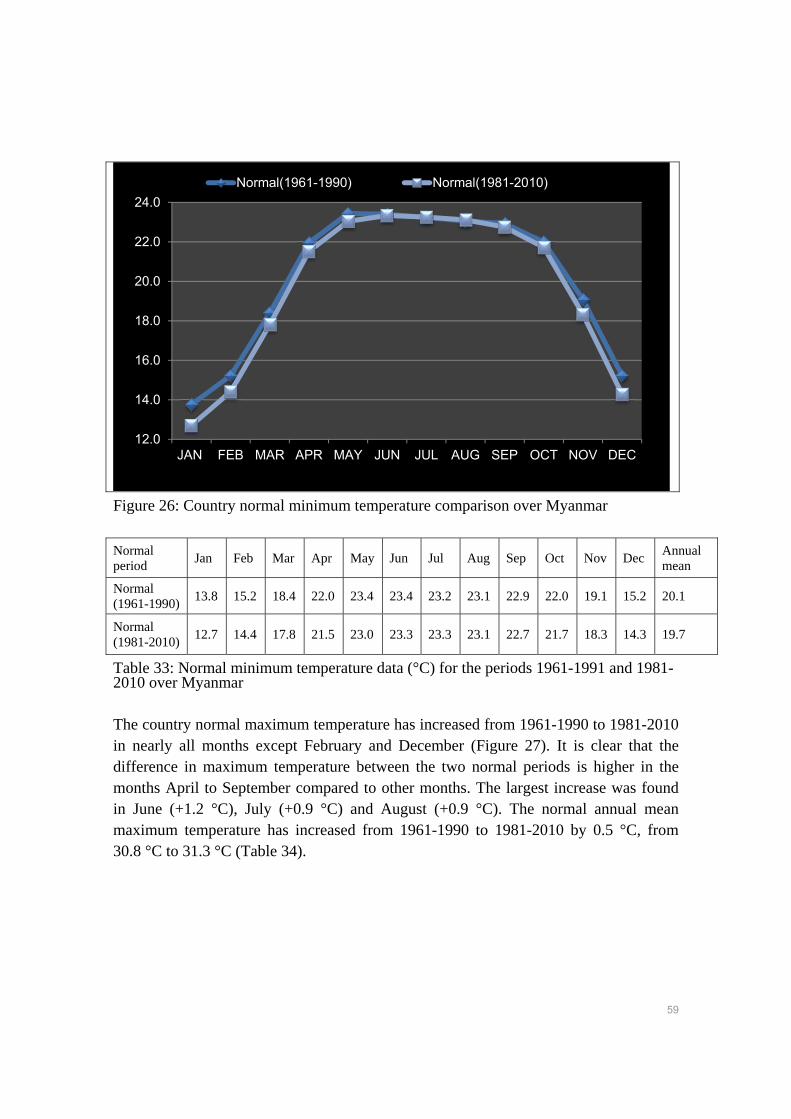
59
Figure 26: Country normal minimum temperature comparison over Myanmar
Normal period
Jan Feb Mar Apr May Jun Jul Aug Sep Oct Nov Dec Annual mean
Normal (1961-1990)
13.8 15.2 18.4 22.0 23.4 23.4 23.2 23.1 22.9 22.0 19.1 15.2 20.1
Normal (1981-2010)
12.7 14.4 17.8 21.5 23.0 23.3 23.3 23.1 22.7 21.7 18.3 14.3 19.7
Table 33: Normal minimum temperature data (°C) for the periods 1961-1991 and 1981-2010 over Myanmar
The country normal maximum temperature has increased from 1961-1990 to 1981-2010 in nearly all months except February and December (Figure 27). It is clear that the difference in maximum temperature between the two normal periods is higher in the months April to September compared to other months. The largest increase was found in June (+1.2 °C), July (+0.9 °C) and August (+0.9 °C). The normal annual mean maximum temperature has increased from 1961-1990 to 1981-2010 by 0.5 °C, from 30.8 °C to 31.3 °C (Table 34).
12.0
14.0
16.0
18.0
20.0
22.0
24.0
JAN FEB MAR APR MAY JUN JUL AUG SEP OCT NOV DEC
Normal(1961-1990) Normal(1981-2010)
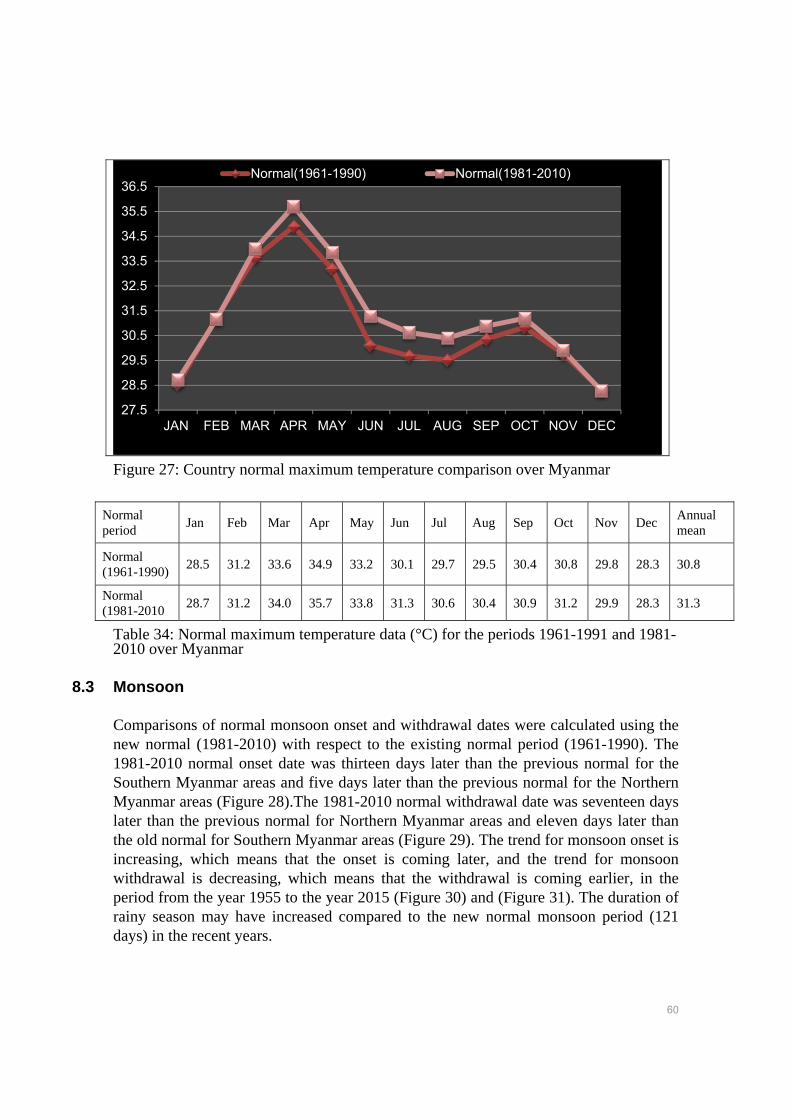
60
Figure 27: Country normal maximum temperature comparison over Myanmar
Normal period
Jan Feb Mar Apr May Jun Jul Aug Sep Oct Nov Dec Annual mean
Normal (1961-1990)
28.5 31.2 33.6 34.9 33.2 30.1 29.7 29.5 30.4 30.8 29.8 28.3 30.8
Normal (1981-2010
28.7 31.2 34.0 35.7 33.8 31.3 30.6 30.4 30.9 31.2 29.9 28.3 31.3
Table 34: Normal maximum temperature data (°C) for the periods 1961-1991 and 1981-2010 over Myanmar
8.3 Monsoon
Comparisons of normal monsoon onset and withdrawal dates were calculated using the new normal (1981-2010) with respect to the existing normal period (1961-1990). The 1981-2010 normal onset date was thirteen days later than the previous normal for the Southern Myanmar areas and five days later than the previous normal for the Northern Myanmar areas (Figure 28).The 1981-2010 normal withdrawal date was seventeen days later than the previous normal for Northern Myanmar areas and eleven days later than the old normal for Southern Myanmar areas (Figure 29). The trend for monsoon onset is increasing, which means that the onset is coming later, and the trend for monsoon withdrawal is decreasing, which means that the withdrawal is coming earlier, in the period from the year 1955 to the year 2015 (Figure 30) and (Figure 31). The duration of rainy season may have increased compared to the new normal monsoon period (121 days) in the recent years.
27.5
28.5
29.5
30.5
31.5
32.5
33.5
34.5
35.5
36.5
JAN FEB MAR APR MAY JUN JUL AUG SEP OCT NOV DEC
Normal(1961-1990) Normal(1981-2010)
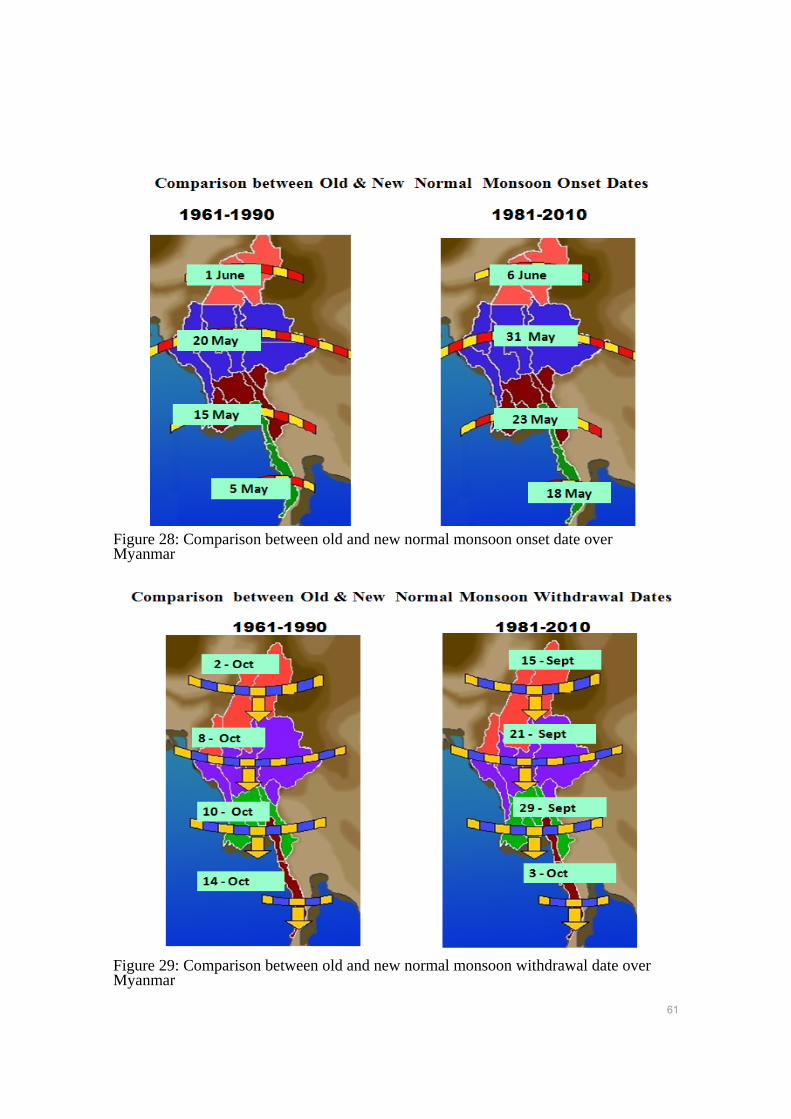
61
Figure 28: Comparison between old and new normal monsoon onset date over Myanmar
Figure 29: Comparison between old and new normal monsoon withdrawal date over Myanmar
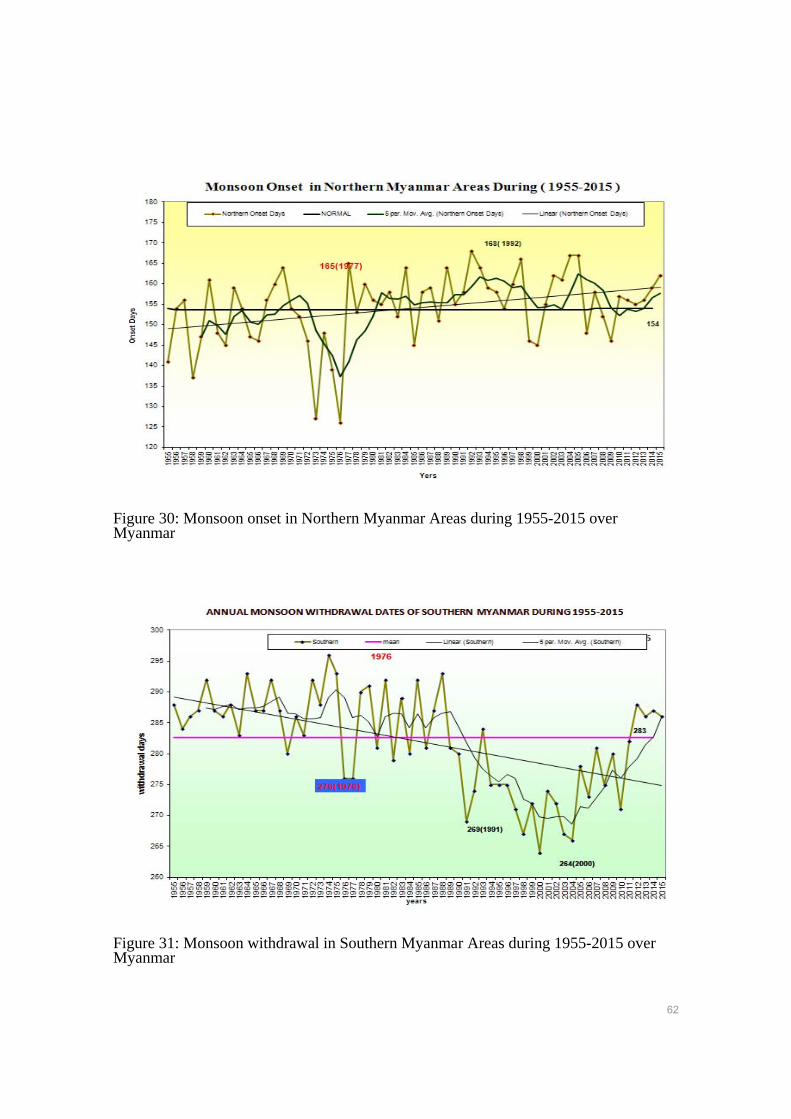
62
Figure 30: Monsoon onset in Northern Myanmar Areas during 1955-2015 over Myanmar
Figure 31: Monsoon withdrawal in Southern Myanmar Areas during 1955-2015 over Myanmar
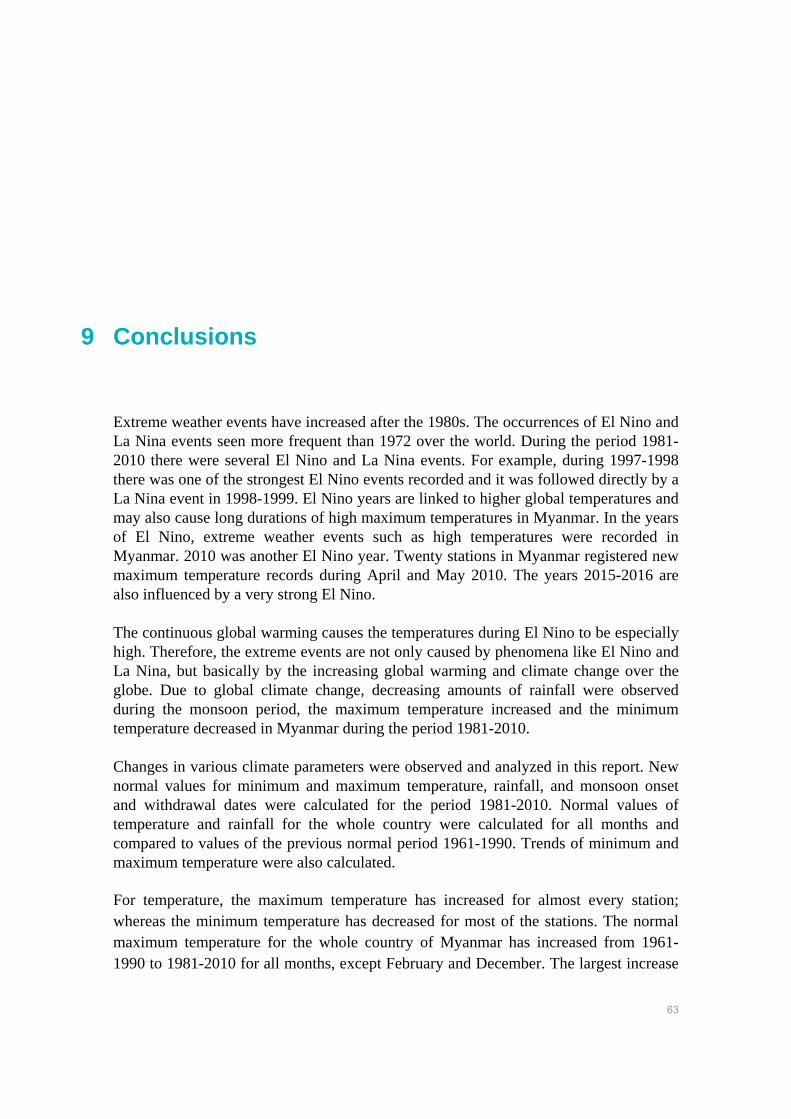
63
9 Conclusions
Extreme weather events have increased after the 1980s. The occurrences of El Nino and La Nina events seen more frequent than 1972 over the world. During the period 1981-2010 there were several El Nino and La Nina events. For example, during 1997-1998 there was one of the strongest El Nino events recorded and it was followed directly by a La Nina event in 1998-1999. El Nino years are linked to higher global temperatures and may also cause long durations of high maximum temperatures in Myanmar. In the years of El Nino, extreme weather events such as high temperatures were recorded in Myanmar. 2010 was another El Nino year. Twenty stations in Myanmar registered new maximum temperature records during April and May 2010. The years 2015-2016 are also influenced by a very strong El Nino. The continuous global warming causes the temperatures during El Nino to be especially high. Therefore, the extreme events are not only caused by phenomena like El Nino and La Nina, but basically by the increasing global warming and climate change over the globe. Due to global climate change, decreasing amounts of rainfall were observed during the monsoon period, the maximum temperature increased and the minimum temperature decreased in Myanmar during the period 1981-2010. Changes in various climate parameters were observed and analyzed in this report. New normal values for minimum and maximum temperature, rainfall, and monsoon onset and withdrawal dates were calculated for the period 1981-2010. Normal values of temperature and rainfall for the whole country were calculated for all months and compared to values of the previous normal period 1961-1990. Trends of minimum and maximum temperature were also calculated. For temperature, the maximum temperature has increased for almost every station; whereas the minimum temperature has decreased for most of the stations. The normal maximum temperature for the whole country of Myanmar has increased from 1961-1990 to 1981-2010 for all months, except February and December. The largest increase
64
was found in June, July and August. For the whole year, the normal annual mean maximum temperature increased by 0.5 °C from 1961-1990 to 1981-2010. The normal minimum temperature has decreased from January to May and from September to December, and remained unchanged from June to August. Here it is also seen that the increasing rate of maximum temperature is higher than the increasing rate of minimum temperature. The normal rainfall pattern has also shifted. It has decreased in the months from May to August and in the other months it has remained nearly unchanged. In the pre-monsoon and mid-monsoon seasons, rainfall has decreased over the whole country and it has been unchanged in the months of winter and post monsoon seasons over Myanmar. The decrease in rainfall was largest in June, July and August. For the whole year, the normal annual rainfall sum of Myanmar decreased by 185 mm in the period from 1961-1990 to 1981-2010. More studies are needed to conclude on the long-term rainfall trends in Myanmar. The onset date of monsoon is later and the withdrawal date is earlier in the new normal period, which means a shorter duration of the rainy season. The normal duration of monsoon period was 144 days in the period (1961-1990) and 121 days in the period of (1981-2010). During the period from the year 1955 to the year 2015, the trend for monsoon onset has increased, and the trend for monsoon withdrawal has decreased. However, in the last 10-15 years of the period, the trend for monsoon withdrawal has again increased. This indicates a possible increase in the duration of the rainy season compared to the new normal monsoon period. When we compare with the old normal, rainy season is shorter in the recent years.
65
Acknowledgements
We express our sincere thanks to Director General Dr. Hrin Nei Thiam, M.E (Hydrology) in Roorkee, India, Ph.D (Physics), Yangon University, Head of Department of Meteorology and Norwegian Ministry of Foreign Affairs for the support of the capacity building project and special thanks to the Norwegian Meteorological Institute for “Instruments and Technical Support for Capacity Building in Weather forecasting and Climate Services”. DMH are greatly indebted to Mr. Tor Ivar Mathisen and Dr. Reidun Gangstø Skaland from the Norwegian Meteorological Institute for their valuable technical guidance and advice for preparation of this climate report of Myanmar. We would also like to thank ADPC for their support with data digitizing, data base and data portal. We would like to express sincerely thanks to Deputy Director General, Director and Deputy Director of Met. Division and also special thanks to junior/staffs at the climate, record and research section for their hardworking in computing and compilation of the data for this report.
Record Section

66
Appendix
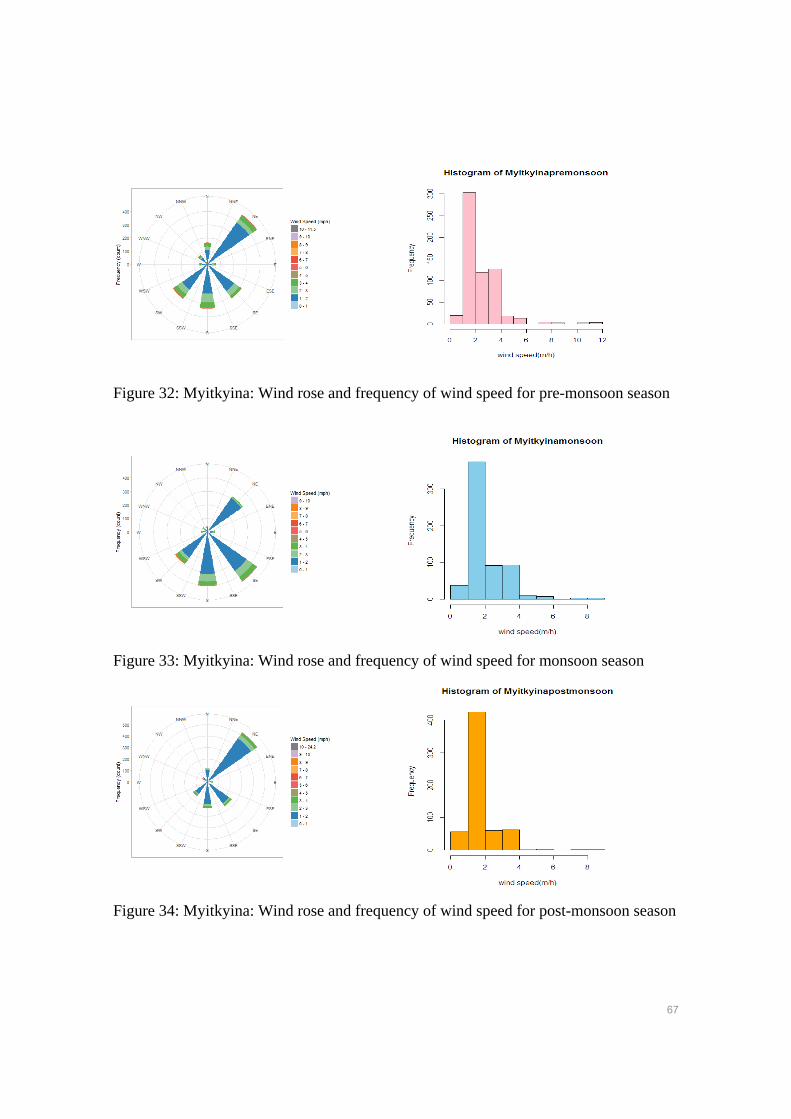
67
Figure 32: Myitkyina: Wind rose and frequency of wind speed for pre-monsoon season
Figure 33: Myitkyina: Wind rose and frequency of wind speed for monsoon season
Figure 34: Myitkyina: Wind rose and frequency of wind speed for post-monsoon season
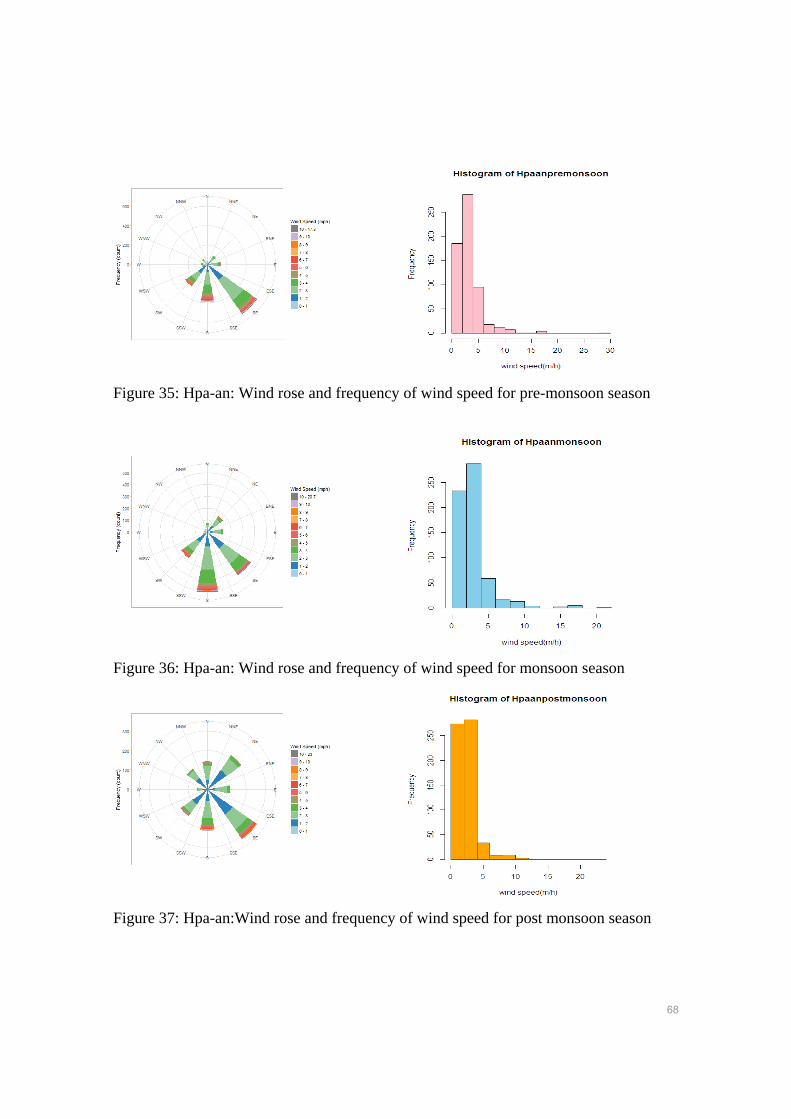
68
Figure 35: Hpa-an: Wind rose and frequency of wind speed for pre-monsoon season
Figure 36: Hpa-an: Wind rose and frequency of wind speed for monsoon season
Figure 37: Hpa-an:Wind rose and frequency of wind speed for post monsoon season
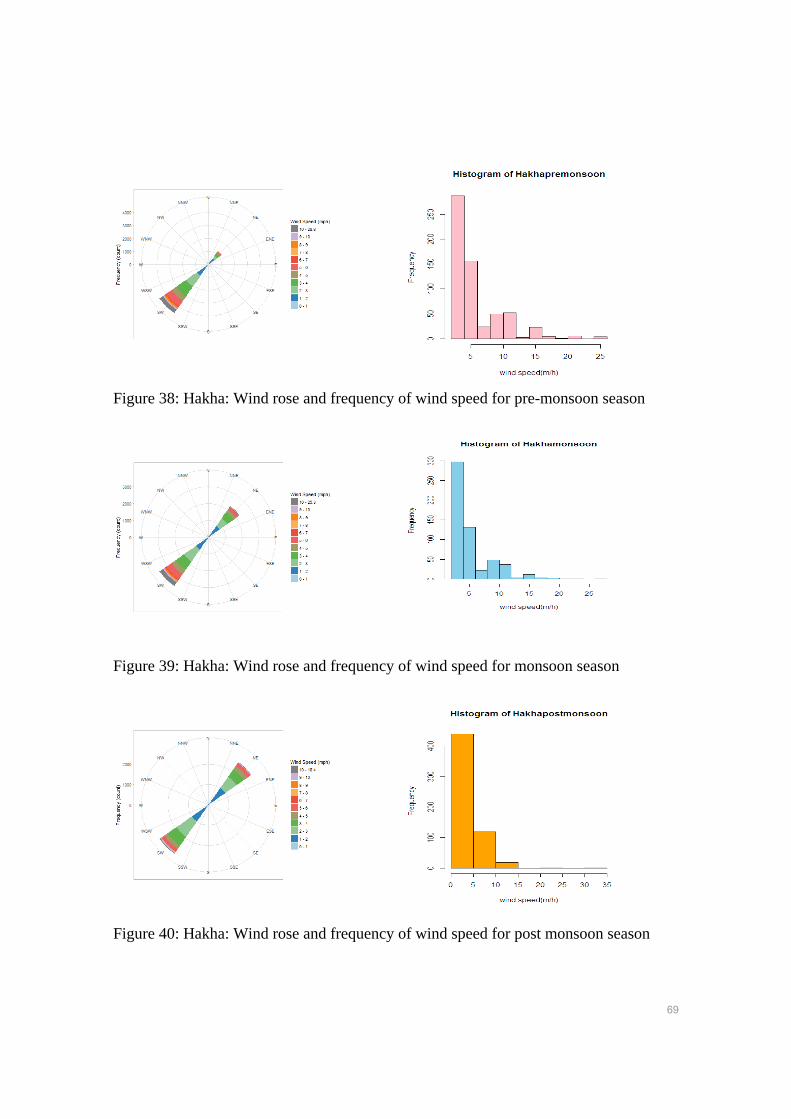
69
Figure 38: Hakha: Wind rose and frequency of wind speed for pre-monsoon season
Figure 39: Hakha: Wind rose and frequency of wind speed for monsoon season
Figure 40: Hakha: Wind rose and frequency of wind speed for post monsoon season
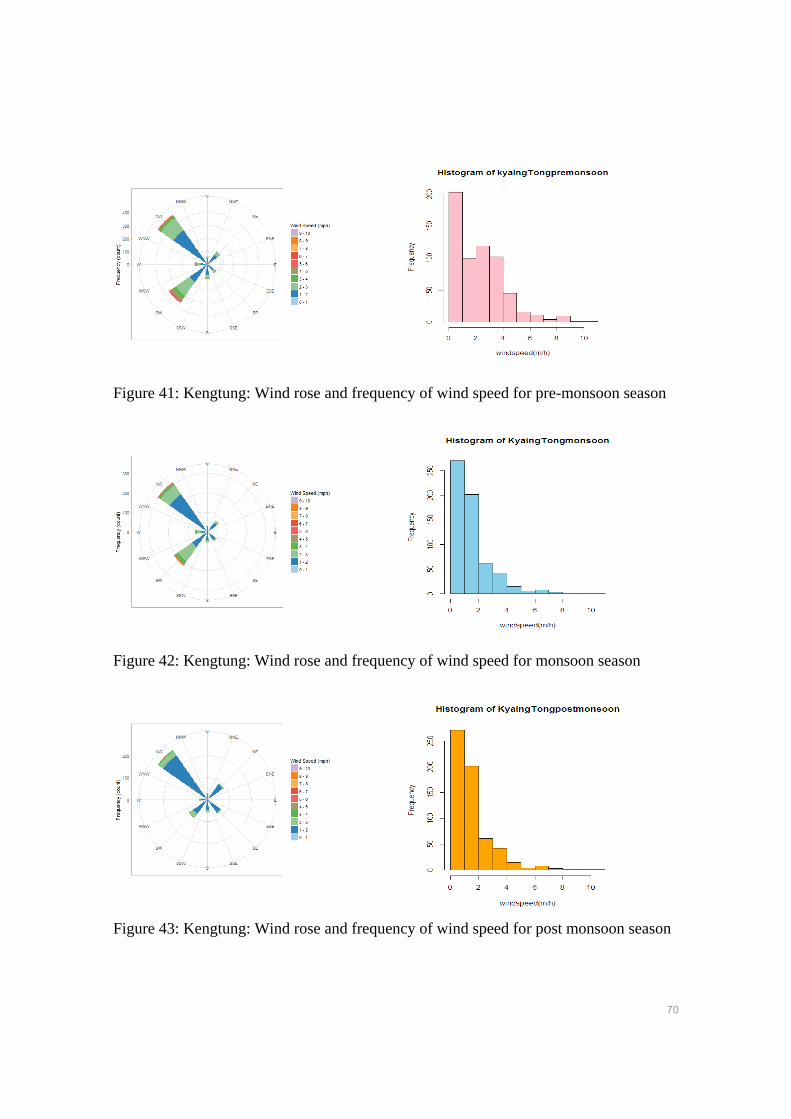
70
Figure 41: Kengtung: Wind rose and frequency of wind speed for pre-monsoon season
Figure 42: Kengtung: Wind rose and frequency of wind speed for monsoon season
Figure 43: Kengtung: Wind rose and frequency of wind speed for post monsoon season
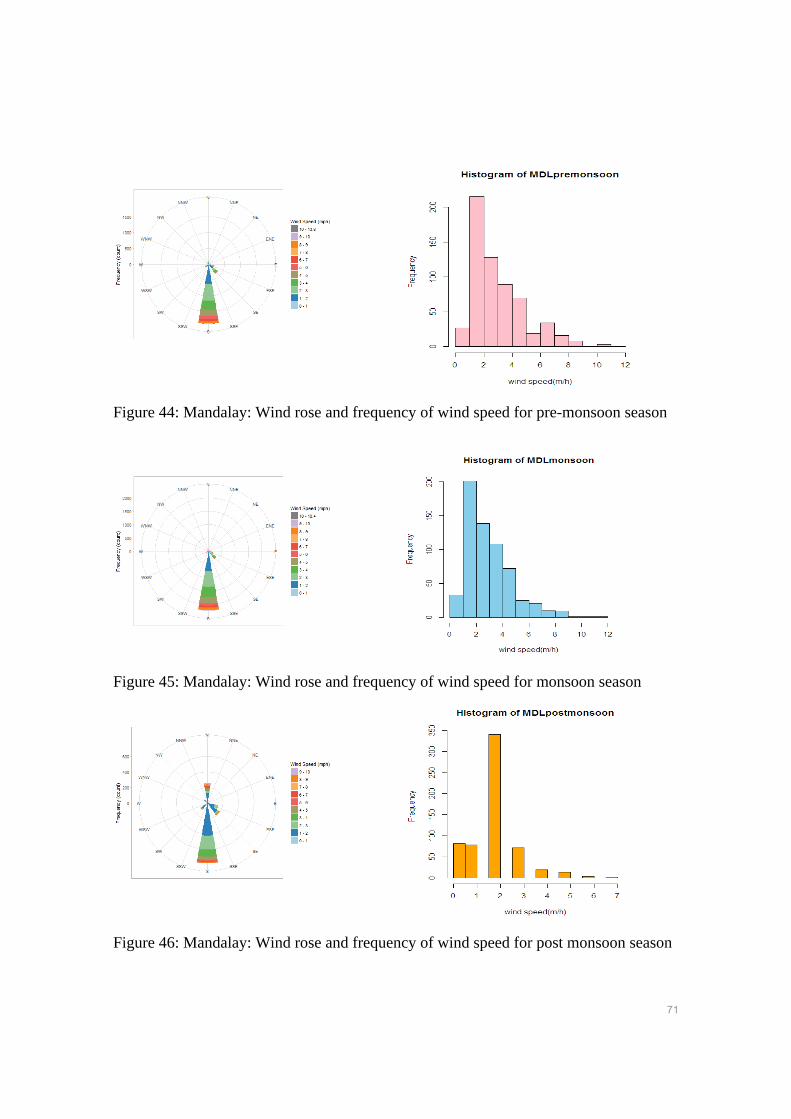
71
Figure 44: Mandalay: Wind rose and frequency of wind speed for pre-monsoon season
Figure 45: Mandalay: Wind rose and frequency of wind speed for monsoon season
Figure 46: Mandalay: Wind rose and frequency of wind speed for post monsoon season
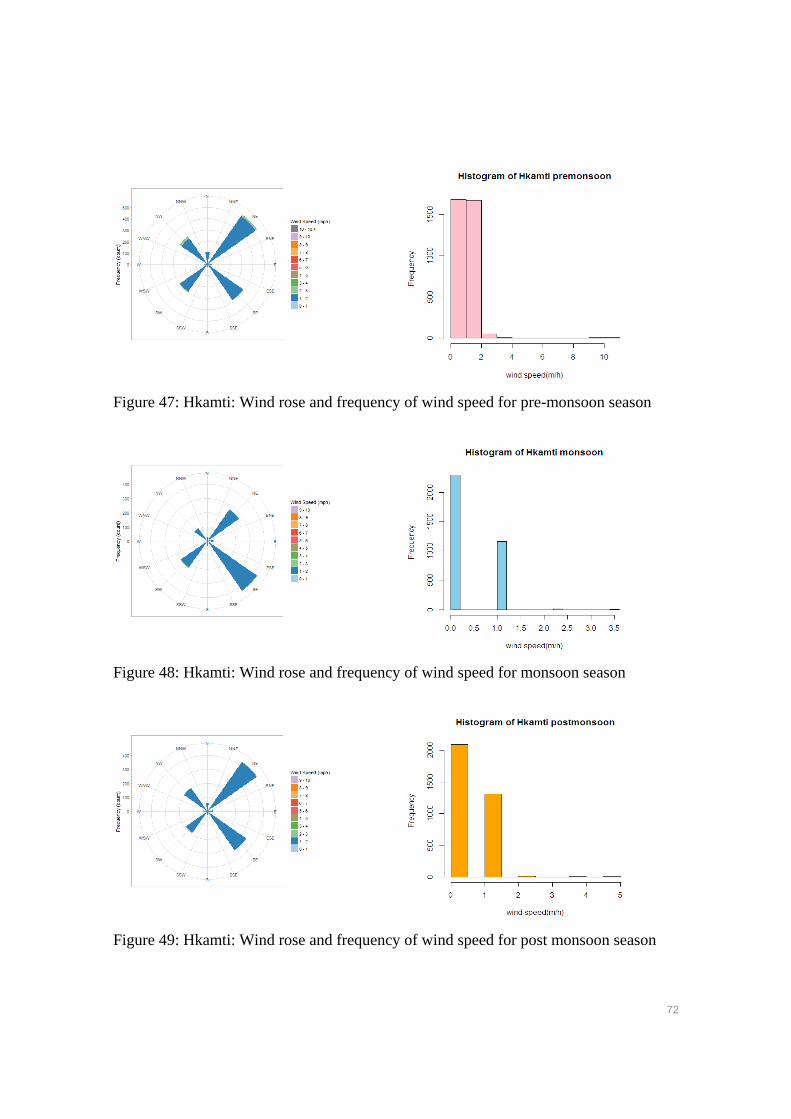
72
Figure 47: Hkamti: Wind rose and frequency of wind speed for pre-monsoon season
Figure 48: Hkamti: Wind rose and frequency of wind speed for monsoon season
Figure 49: Hkamti: Wind rose and frequency of wind speed for post monsoon season
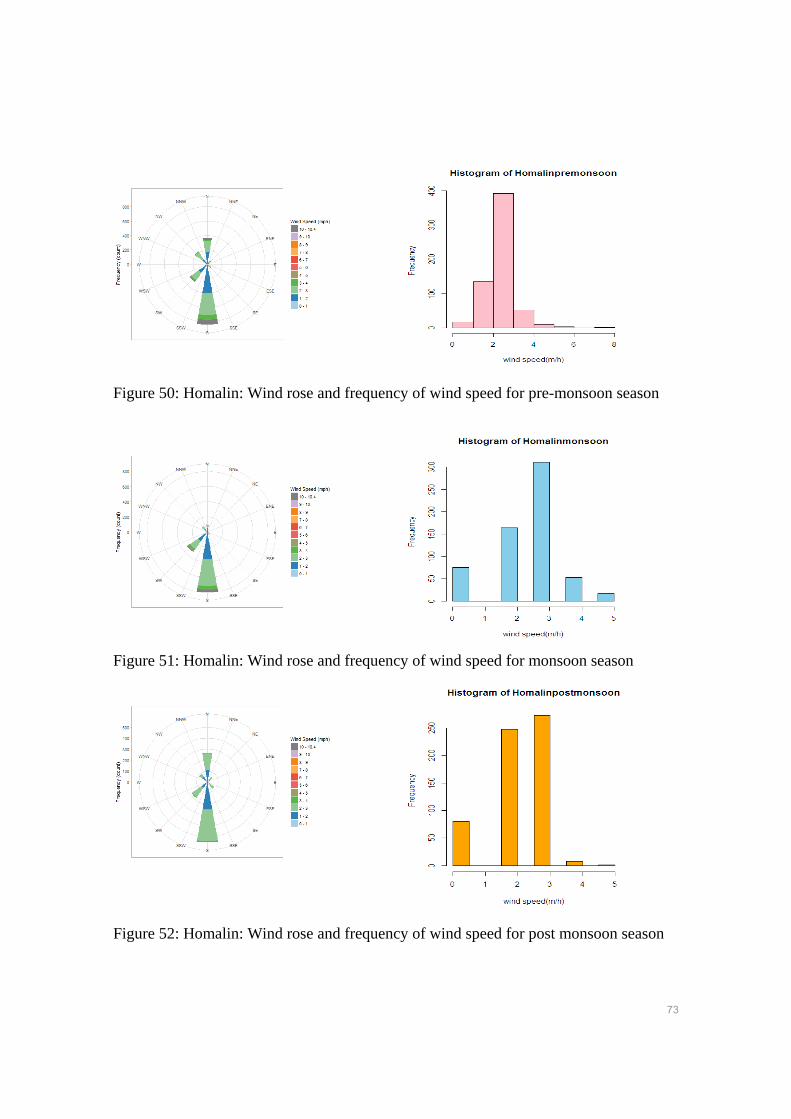
73
Figure 50: Homalin: Wind rose and frequency of wind speed for pre-monsoon season
Figure 51: Homalin: Wind rose and frequency of wind speed for monsoon season
Figure 52: Homalin: Wind rose and frequency of wind speed for post monsoon season
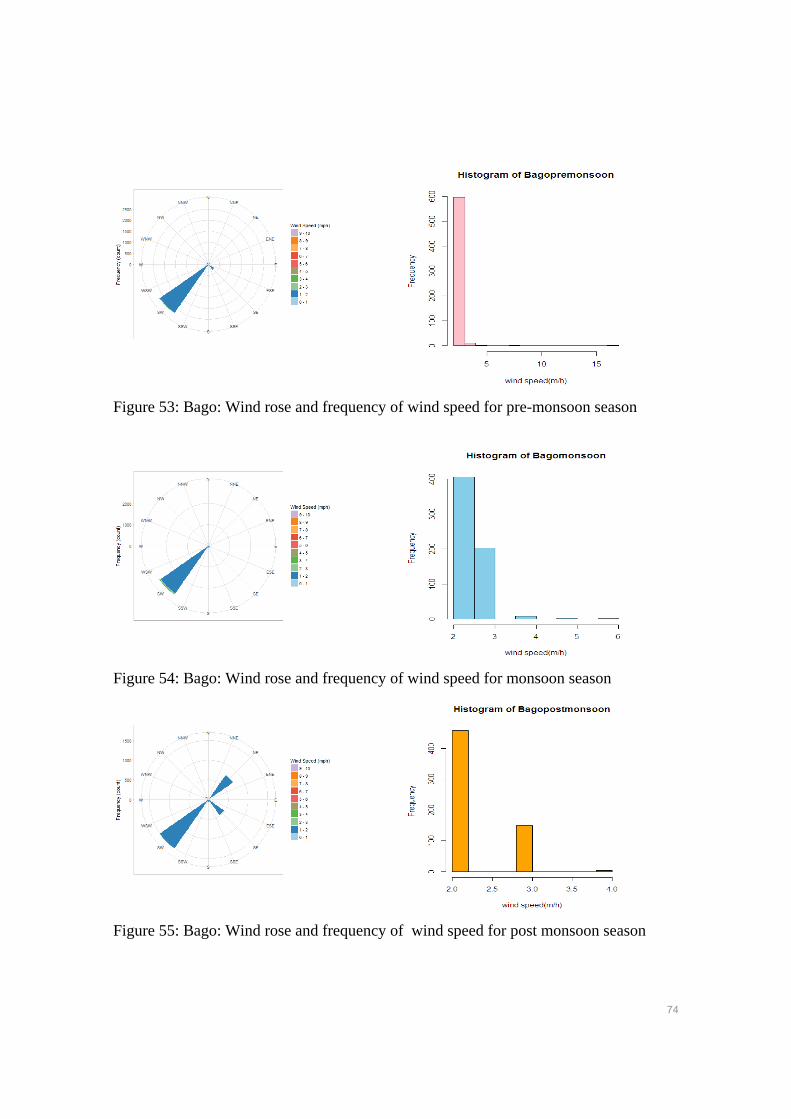
74
Figure 53: Bago: Wind rose and frequency of wind speed for pre-monsoon season
Figure 54: Bago: Wind rose and frequency of wind speed for monsoon season
Figure 55: Bago: Wind rose and frequency of wind speed for post monsoon season
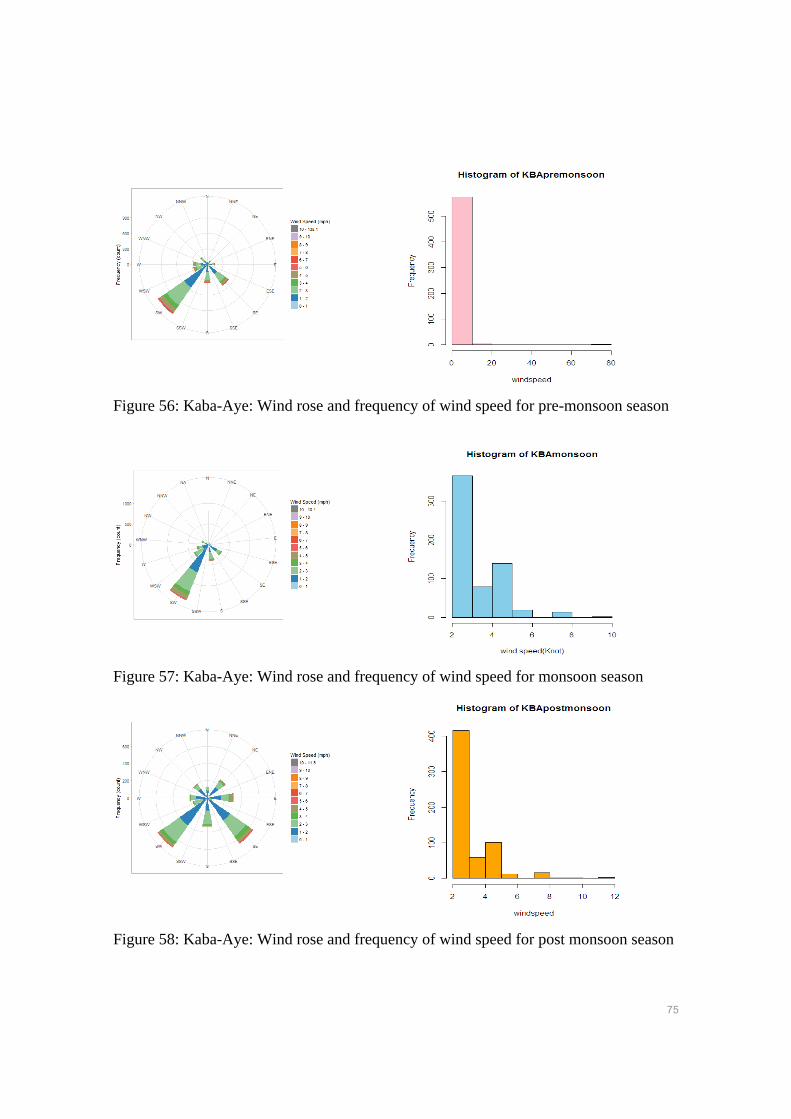
75
Figure 56: Kaba-Aye: Wind rose and frequency of wind speed for pre-monsoon season
Figure 57: Kaba-Aye: Wind rose and frequency of wind speed for monsoon season
Figure 58: Kaba-Aye: Wind rose and frequency of wind speed for post monsoon season
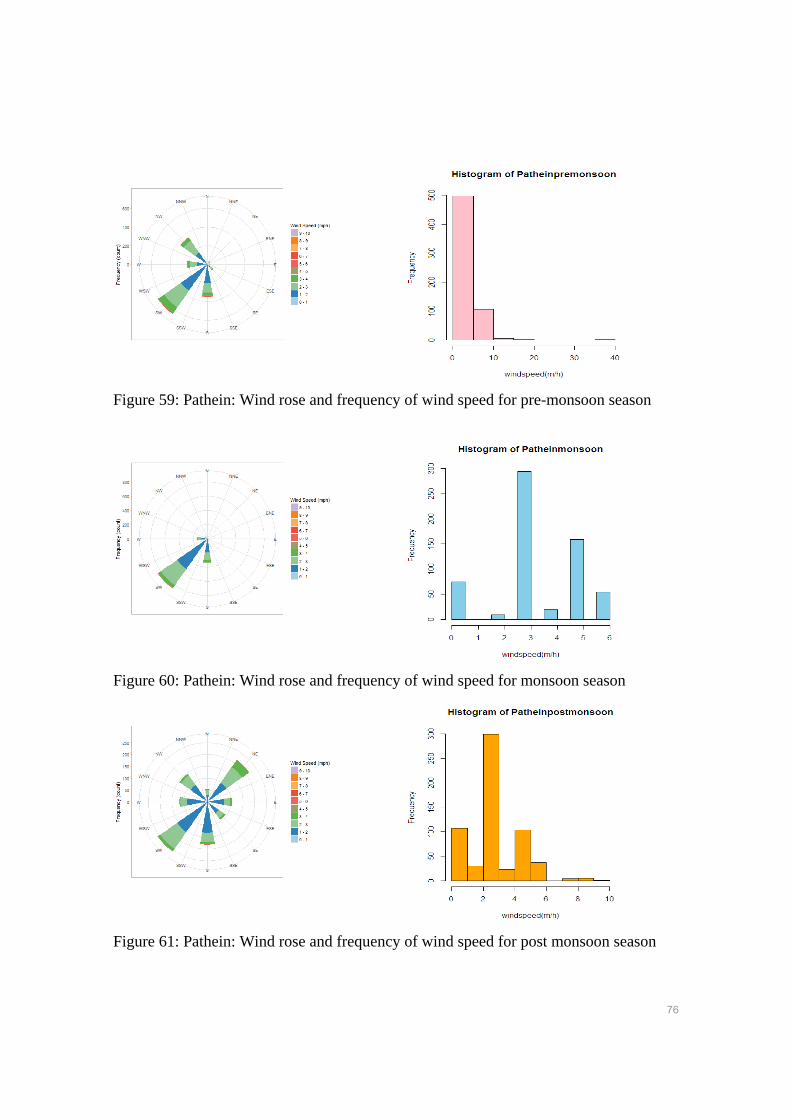
76
Figure 59: Pathein: Wind rose and frequency of wind speed for pre-monsoon season
Figure 60: Pathein: Wind rose and frequency of wind speed for monsoon season
Figure 61: Pathein: Wind rose and frequency of wind speed for post monsoon season
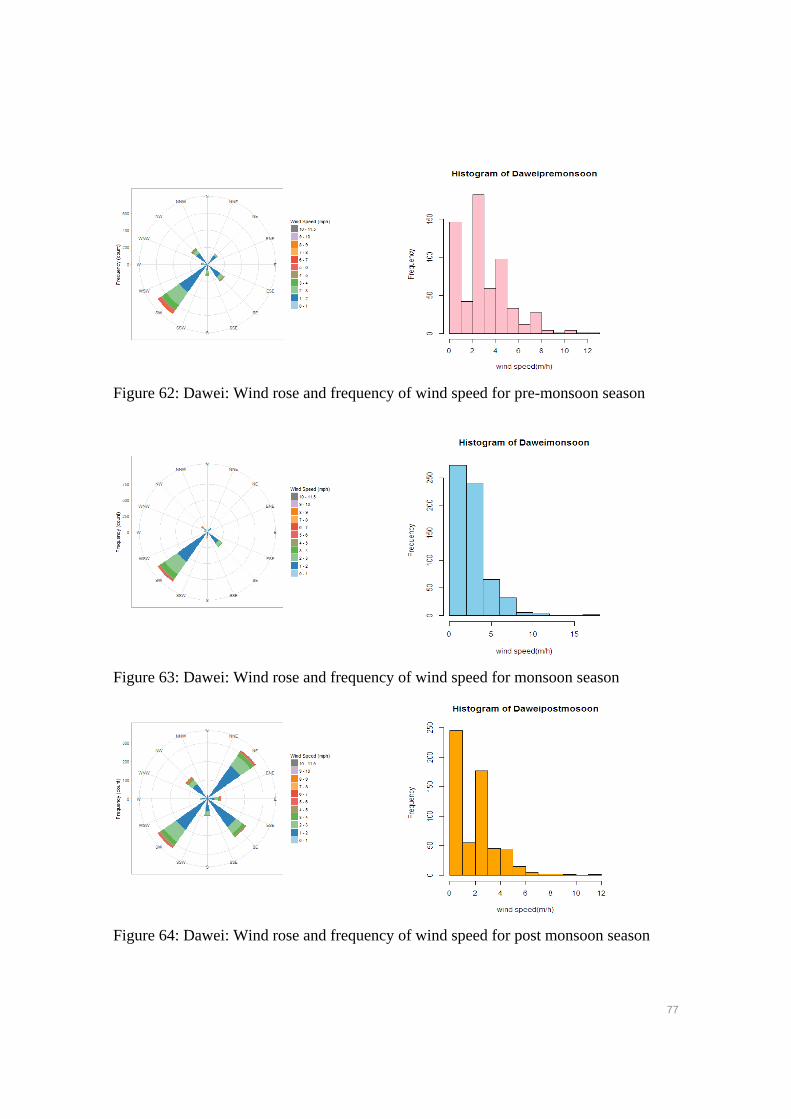
77
Figure 62: Dawei: Wind rose and frequency of wind speed for pre-monsoon season
Figure 63: Dawei: Wind rose and frequency of wind speed for monsoon season
Figure 64: Dawei: Wind rose and frequency of wind speed for post monsoon season
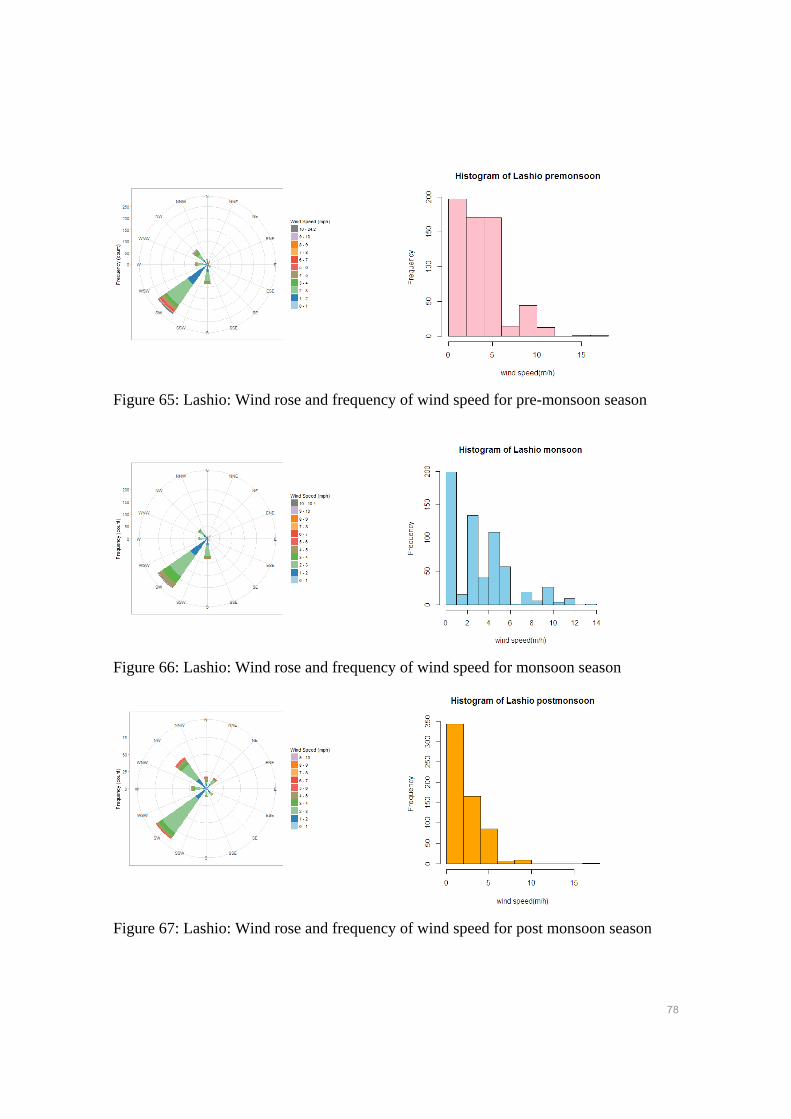
78
Figure 65: Lashio: Wind rose and frequency of wind speed for pre-monsoon season
Figure 66: Lashio: Wind rose and frequency of wind speed for monsoon season
Figure 67: Lashio: Wind rose and frequency of wind speed for post monsoon season
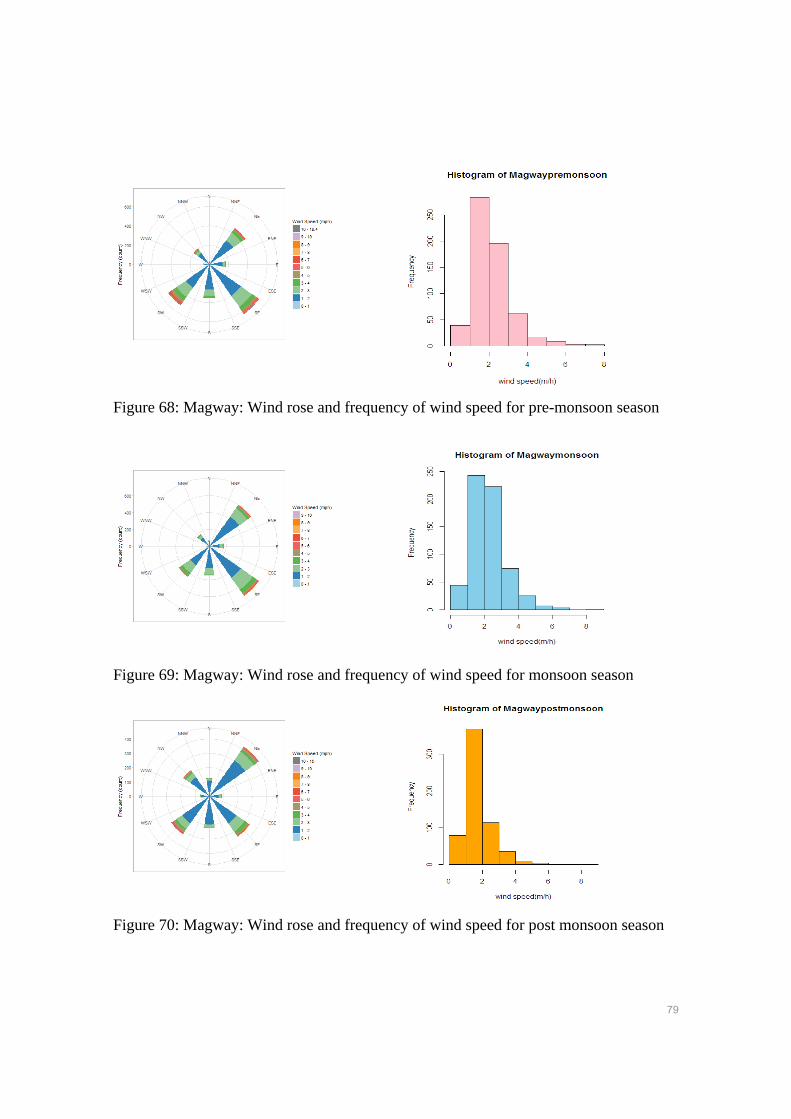
79
Figure 68: Magway: Wind rose and frequency of wind speed for pre-monsoon season
Figure 69: Magway: Wind rose and frequency of wind speed for monsoon season
Figure 70: Magway: Wind rose and frequency of wind speed for post monsoon season
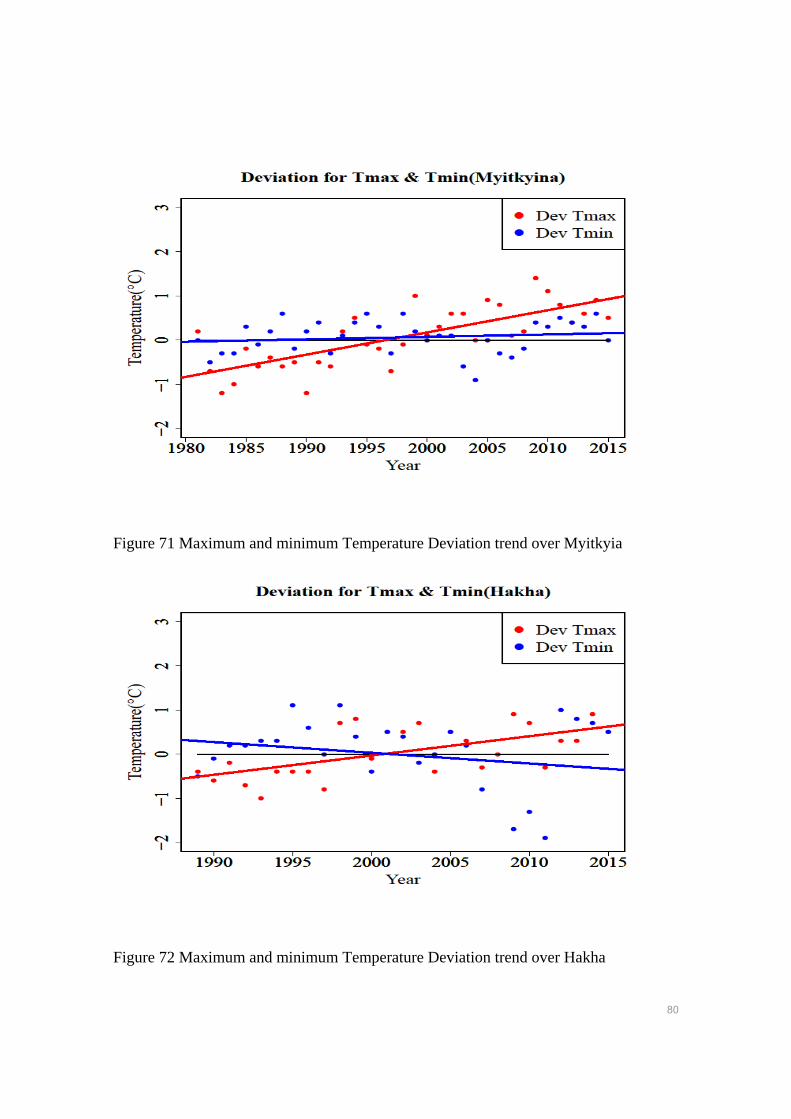
80
Figure 71 Maximum and minimum Temperature Deviation trend over Myitkyia
Figure 72 Maximum and minimum Temperature Deviation trend over Hakha
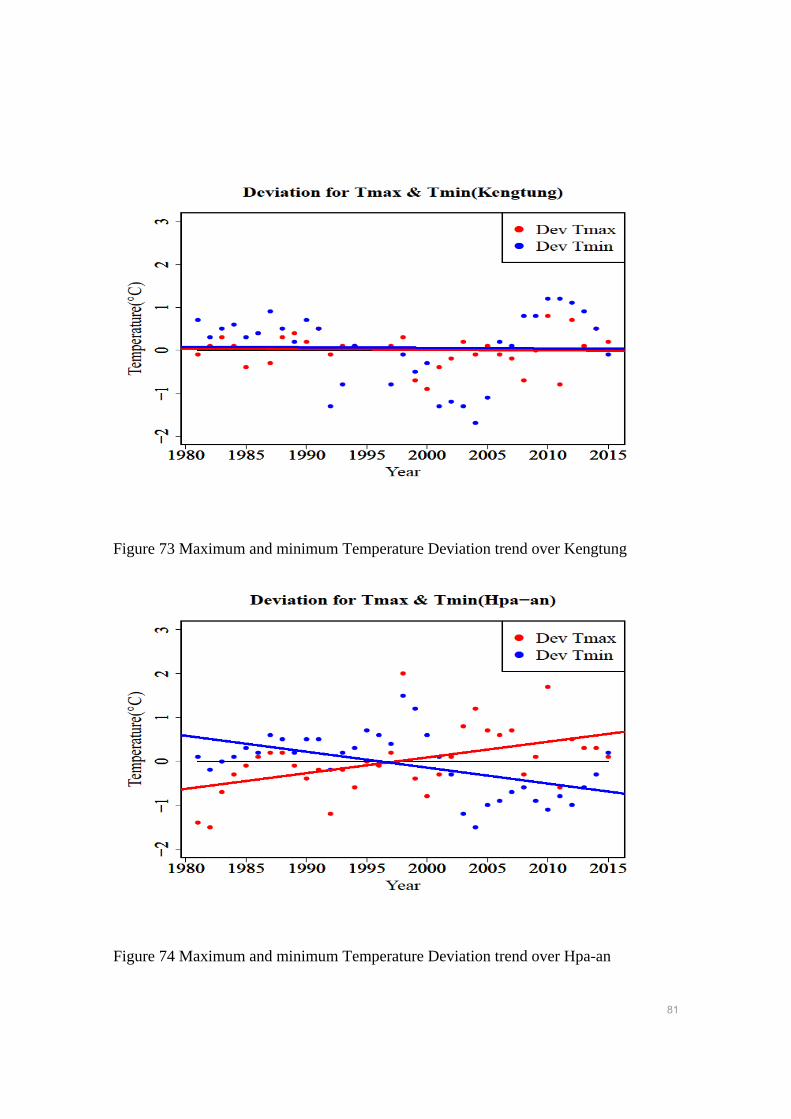
81
Figure 73 Maximum and minimum Temperature Deviation trend over Kengtung
Figure 74 Maximum and minimum Temperature Deviation trend over Hpa-an
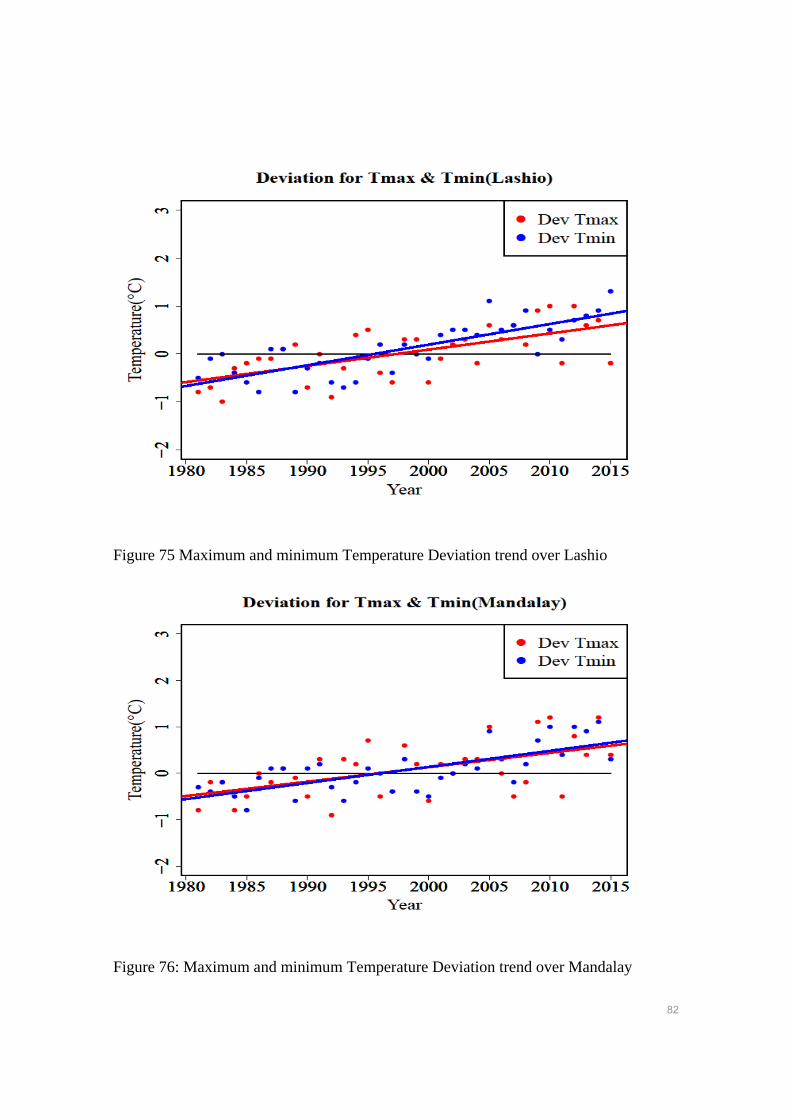
82
Figure 75 Maximum and minimum Temperature Deviation trend over Lashio
Figure 76: Maximum and minimum Temperature Deviation trend over Mandalay
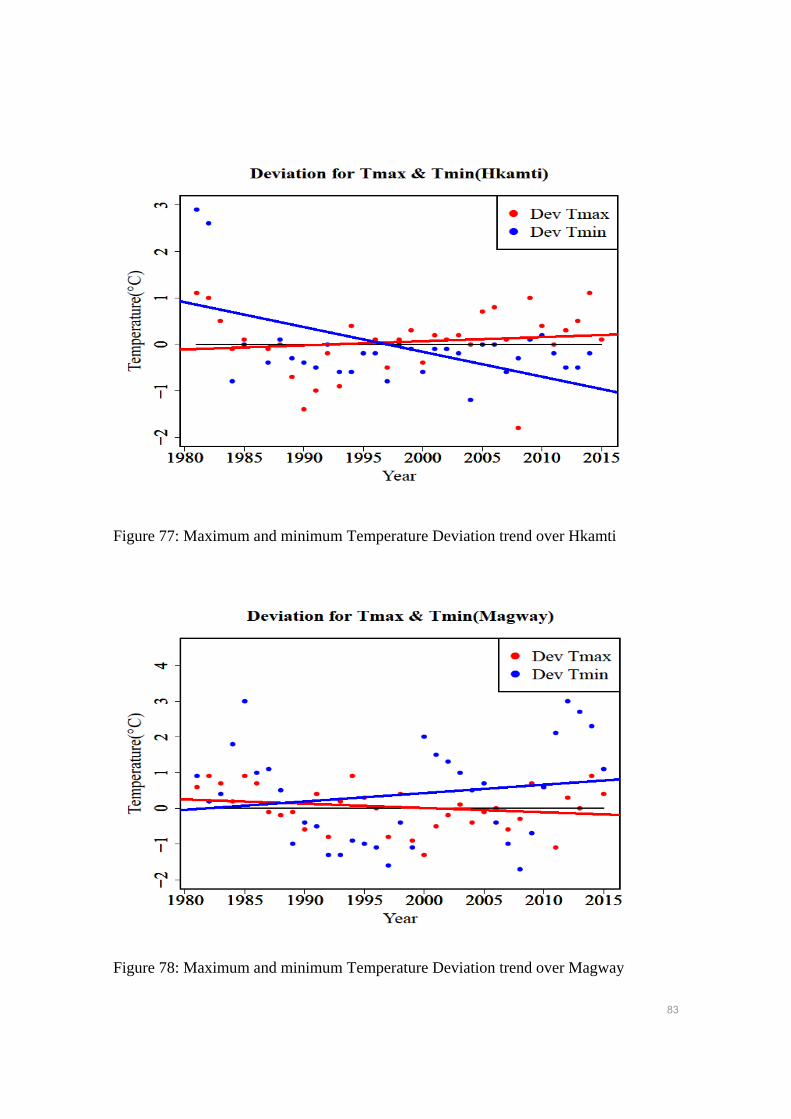
83
Figure 77: Maximum and minimum Temperature Deviation trend over Hkamti
Figure 78: Maximum and minimum Temperature Deviation trend over Magway
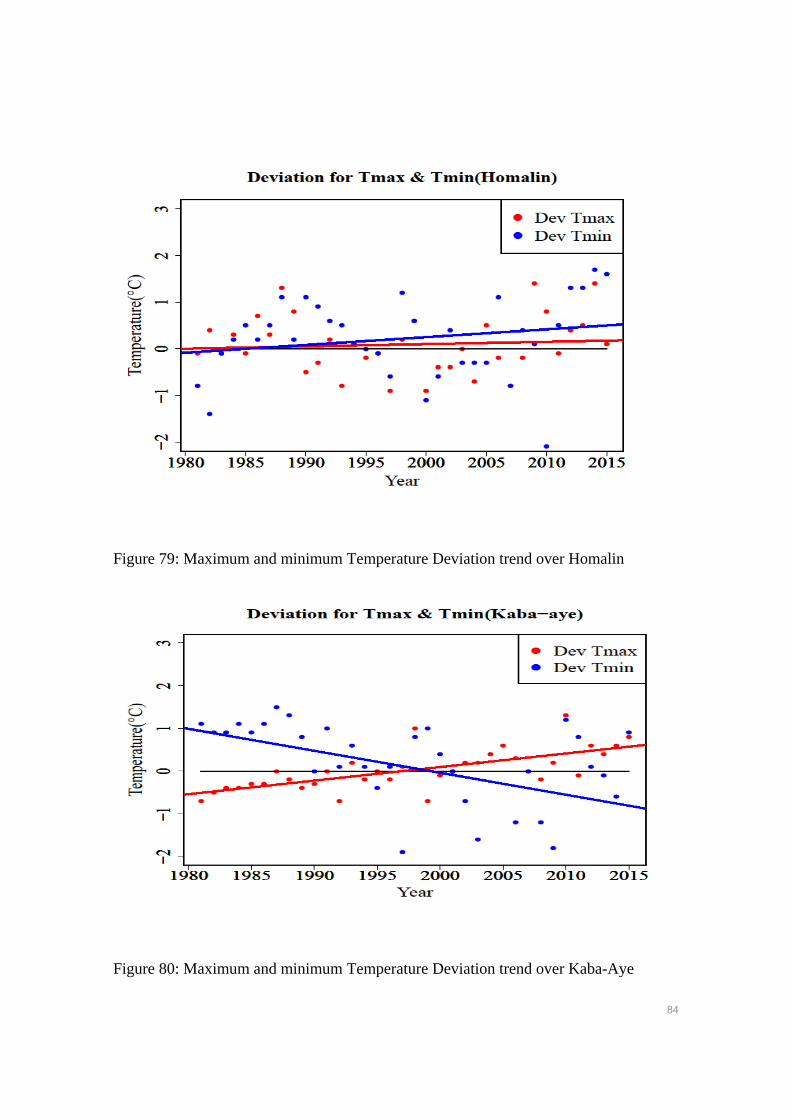
84
Figure 79: Maximum and minimum Temperature Deviation trend over Homalin
Figure 80: Maximum and minimum Temperature Deviation trend over Kaba-Aye
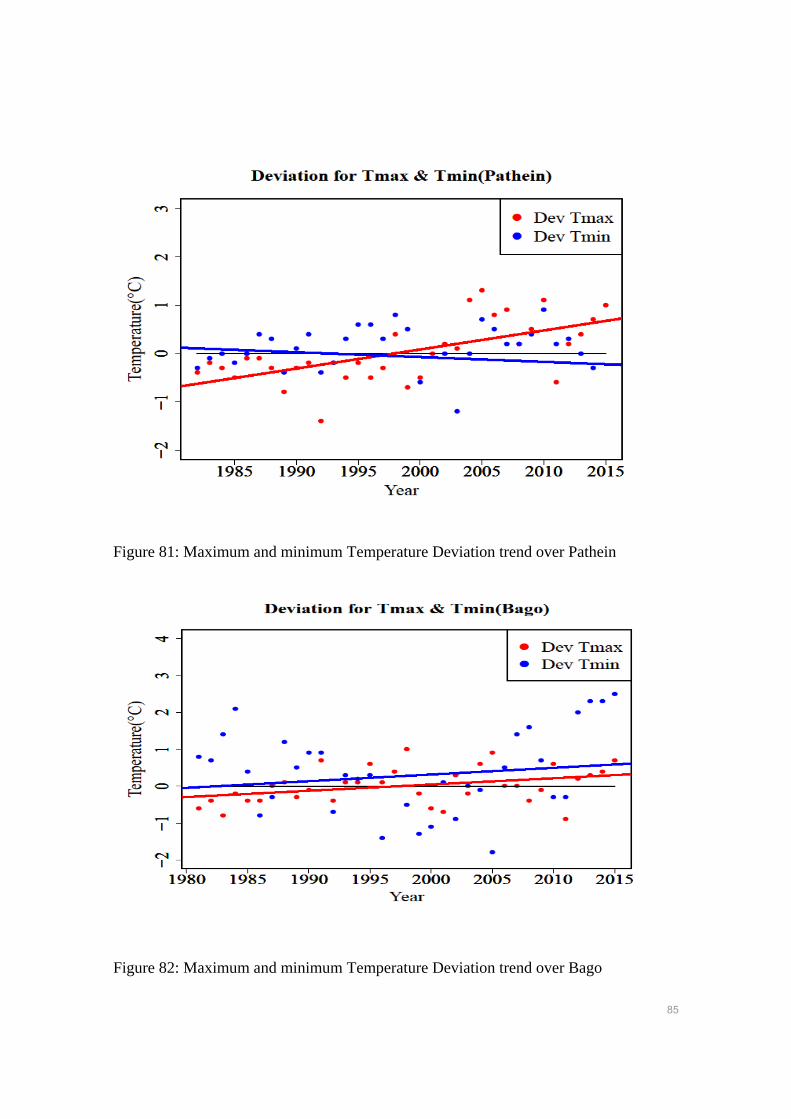
85
Figure 81: Maximum and minimum Temperature Deviation trend over Pathein
Figure 82: Maximum and minimum Temperature Deviation trend over Bago
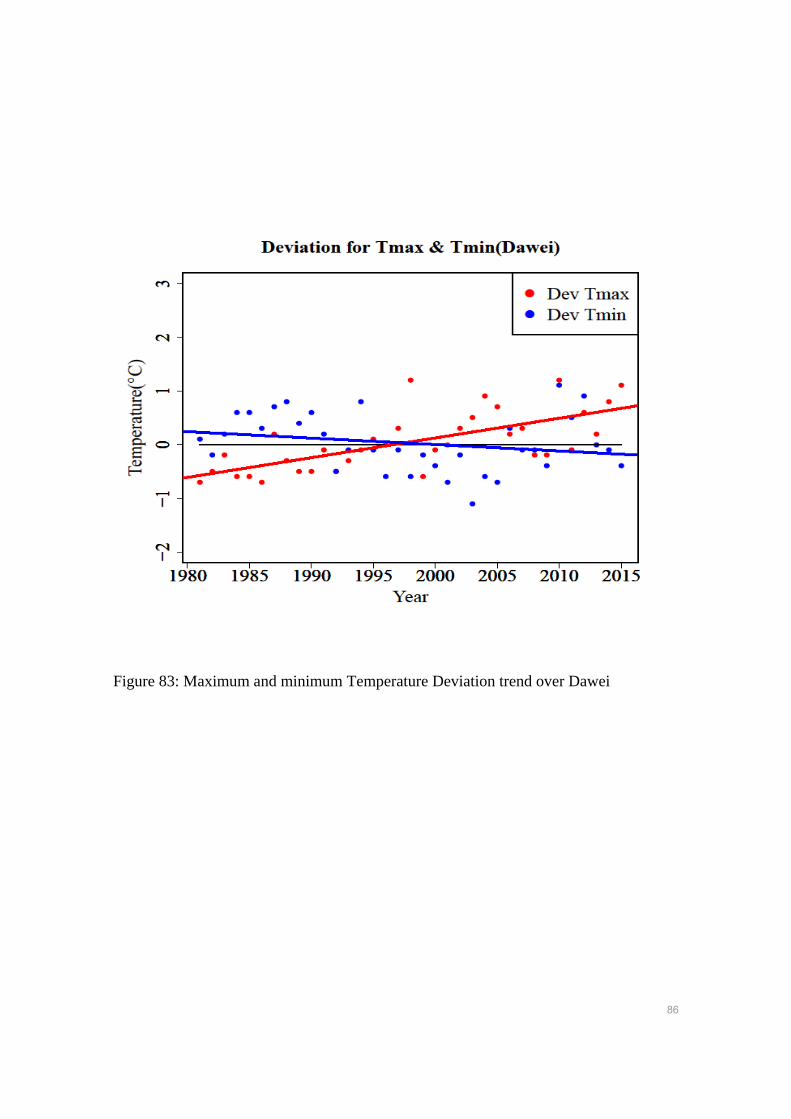
86
Figure 83: Maximum and minimum Temperature Deviation trend over Dawei
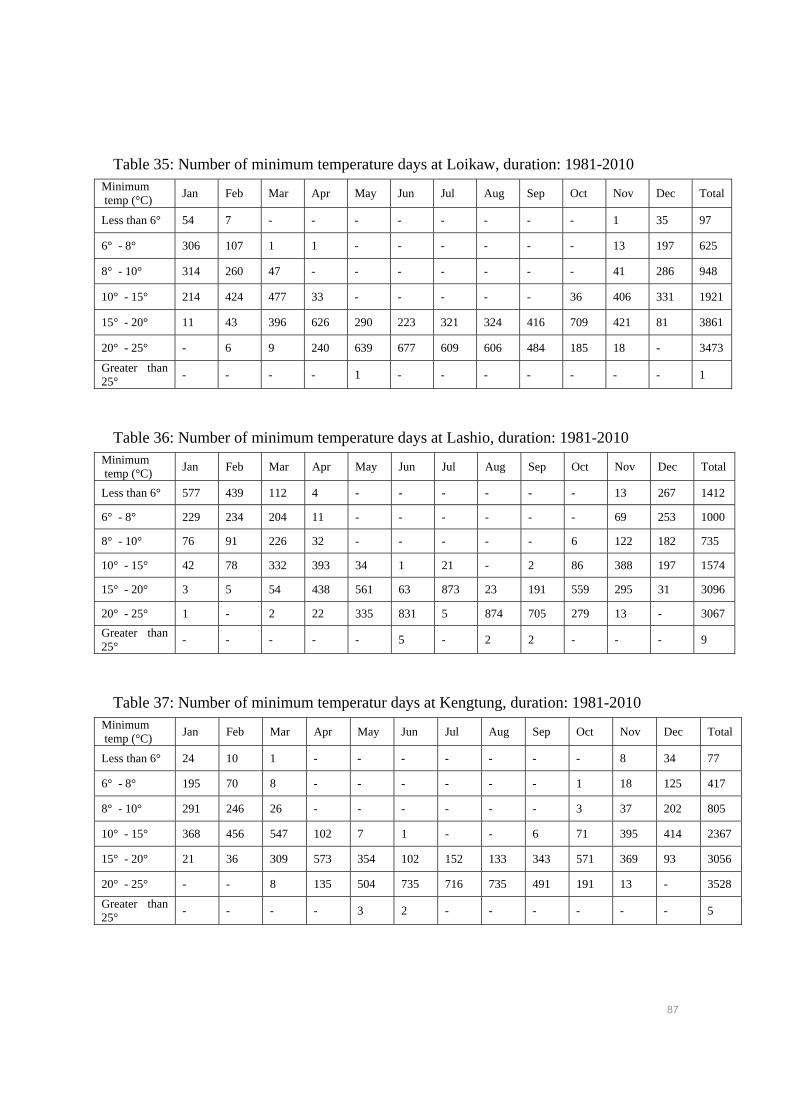
87
Table 35: Number of minimum temperature days at Loikaw, duration: 1981-2010 Minimum temp (°C)
Jan Feb Mar Apr May Jun Jul Aug Sep Oct Nov Dec Total
Less than 6° 54 7 - - - - - - - - 1 35 97
6° - 8° 306 107 1 1 - - - - - - 13 197 625
8° - 10° 314 260 47 - - - - - - - 41 286 948
10° - 15° 214 424 477 33 - - - - - 36 406 331 1921
15° - 20° 11 43 396 626 290 223 321 324 416 709 421 81 3861
20° - 25° - 6 9 240 639 677 609 606 484 185 18 - 3473
Greater than 25°
- - - - 1 - - - - - - - 1
Table 36: Number of minimum temperature days at Lashio, duration: 1981-2010 Minimum temp (°C)
Jan Feb Mar Apr May Jun Jul Aug Sep Oct Nov Dec Total
Less than 6° 577 439 112 4 - - - - - - 13 267 1412
6° - 8° 229 234 204 11 - - - - - - 69 253 1000
8° - 10° 76 91 226 32 - - - - - 6 122 182 735
10° - 15° 42 78 332 393 34 1 21 - 2 86 388 197 1574
15° - 20° 3 5 54 438 561 63 873 23 191 559 295 31 3096
20° - 25° 1 - 2 22 335 831 5 874 705 279 13 - 3067
Greater than 25°
- - - - - 5 - 2 2 - - - 9
Table 37: Number of minimum temperatur days at Kengtung, duration: 1981-2010 Minimum temp (°C)
Jan Feb Mar Apr May Jun Jul Aug Sep Oct Nov Dec Total
Less than 6° 24 10 1 - - - - - - - 8 34 77
6° - 8° 195 70 8 - - - - - - 1 18 125 417
8° - 10° 291 246 26 - - - - - - 3 37 202 805
10° - 15° 368 456 547 102 7 1 - - 6 71 395 414 2367
15° - 20° 21 36 309 573 354 102 152 133 343 571 369 93 3056
20° - 25° - - 8 135 504 735 716 735 491 191 13 - 3528
Greater than 25°
- - - - 3 2 - - - - - - 5
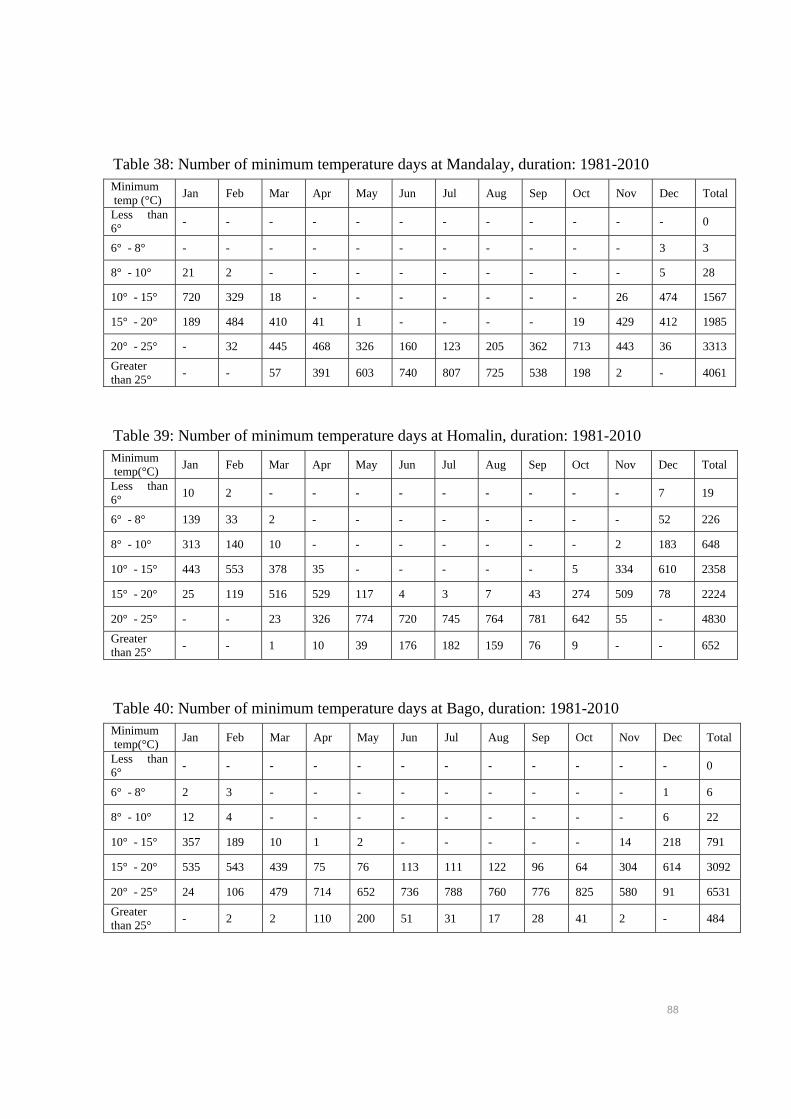
88
Table 38: Number of minimum temperature days at Mandalay, duration: 1981-2010 Minimum temp (°C)
Jan Feb Mar Apr May Jun Jul Aug Sep Oct Nov Dec Total
Less than 6°
- - - - - - - - - - - - 0
6° - 8° - - - - - - - - - - - 3 3
8° - 10° 21 2 - - - - - - - - - 5 28
10° - 15° 720 329 18 - - - - - - - 26 474 1567
15° - 20° 189 484 410 41 1 - - - - 19 429 412 1985
20° - 25° - 32 445 468 326 160 123 205 362 713 443 36 3313
Greater than 25°
- - 57 391 603 740 807 725 538 198 2 - 4061
Table 39: Number of minimum temperature days at Homalin, duration: 1981-2010 Minimum temp(°C)
Jan Feb Mar Apr May Jun Jul Aug Sep Oct Nov Dec Total
Less than 6°
10 2 - - - - - - - - - 7 19
6° - 8° 139 33 2 - - - - - - - - 52 226
8° - 10° 313 140 10 - - - - - - - 2 183 648
10° - 15° 443 553 378 35 - - - - - 5 334 610 2358
15° - 20° 25 119 516 529 117 4 3 7 43 274 509 78 2224
20° - 25° - - 23 326 774 720 745 764 781 642 55 - 4830
Greater than 25°
- - 1 10 39 176 182 159 76 9 - - 652
Table 40: Number of minimum temperature days at Bago, duration: 1981-2010 Minimum temp(°C)
Jan Feb Mar Apr May Jun Jul Aug Sep Oct Nov Dec Total
Less than 6°
- - - - - - - - - - - - 0
6° - 8° 2 3 - - - - - - - - - 1 6
8° - 10° 12 4 - - - - - - - - - 6 22
10° - 15° 357 189 10 1 2 - - - - - 14 218 791
15° - 20° 535 543 439 75 76 113 111 122 96 64 304 614 3092
20° - 25° 24 106 479 714 652 736 788 760 776 825 580 91 6531
Greater than 25°
- 2 2 110 200 51 31 17 28 41 2 - 484
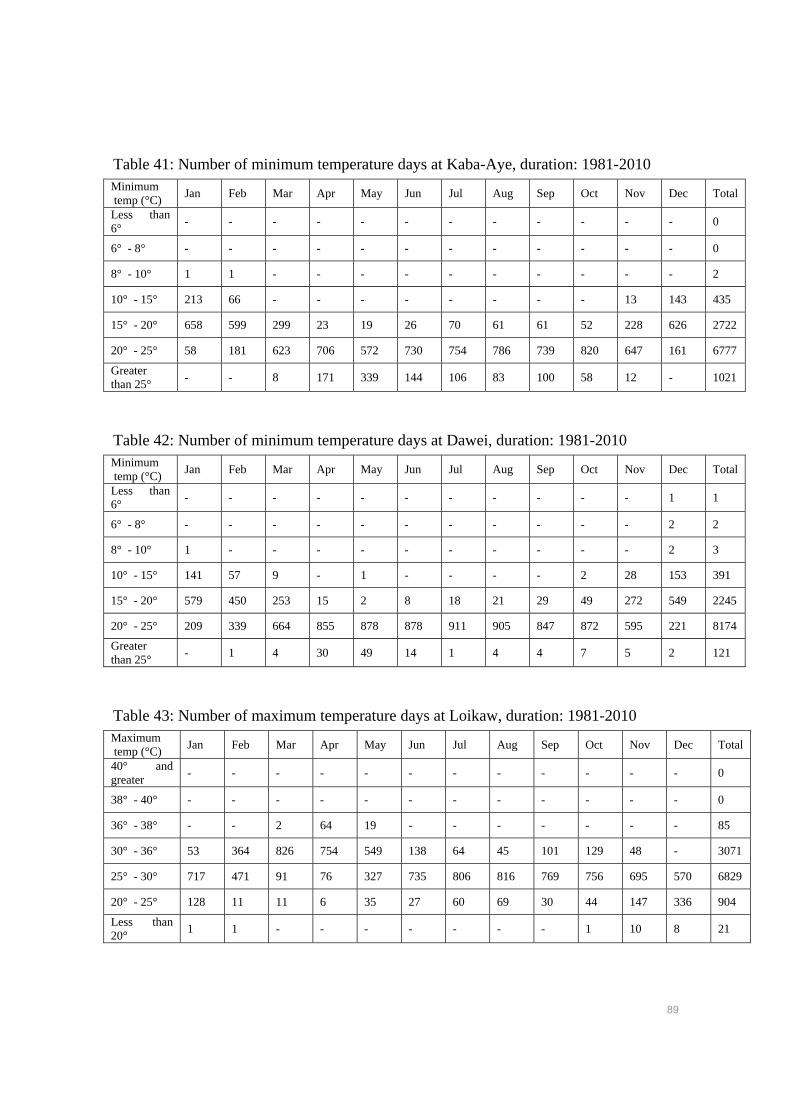
89
Table 41: Number of minimum temperature days at Kaba-Aye, duration: 1981-2010 Minimum temp (°C)
Jan Feb Mar Apr May Jun Jul Aug Sep Oct Nov Dec Total
Less than 6°
- - - - - - - - - - - - 0
6° - 8° - - - - - - - - - - - - 0
8° - 10° 1 1 - - - - - - - - - - 2
10° - 15° 213 66 - - - - - - - - 13 143 435
15° - 20° 658 599 299 23 19 26 70 61 61 52 228 626 2722
20° - 25° 58 181 623 706 572 730 754 786 739 820 647 161 6777
Greater than 25°
- - 8 171 339 144 106 83 100 58 12 - 1021
Table 42: Number of minimum temperature days at Dawei, duration: 1981-2010 Minimum temp (°C)
Jan Feb Mar Apr May Jun Jul Aug Sep Oct Nov Dec Total
Less than 6°
- - - - - - - - - - - 1 1
6° - 8° - - - - - - - - - - - 2 2
8° - 10° 1 - - - - - - - - - - 2 3
10° - 15° 141 57 9 - 1 - - - - 2 28 153 391
15° - 20° 579 450 253 15 2 8 18 21 29 49 272 549 2245
20° - 25° 209 339 664 855 878 878 911 905 847 872 595 221 8174
Greater than 25°
- 1 4 30 49 14 1 4 4 7 5 2 121
Table 43: Number of maximum temperature days at Loikaw, duration: 1981-2010 Maximum temp (°C)
Jan Feb Mar Apr May Jun Jul Aug Sep Oct Nov Dec Total
40° and greater
- - - - - - - - - - - - 0
38° - 40° - - - - - - - - - - - - 0
36° - 38° - - 2 64 19 - - - - - - - 85
30° - 36° 53 364 826 754 549 138 64 45 101 129 48 - 3071
25° - 30° 717 471 91 76 327 735 806 816 769 756 695 570 6829
20° - 25° 128 11 11 6 35 27 60 69 30 44 147 336 904
Less than 20°
1 1 - - - - - - - 1 10 8 21
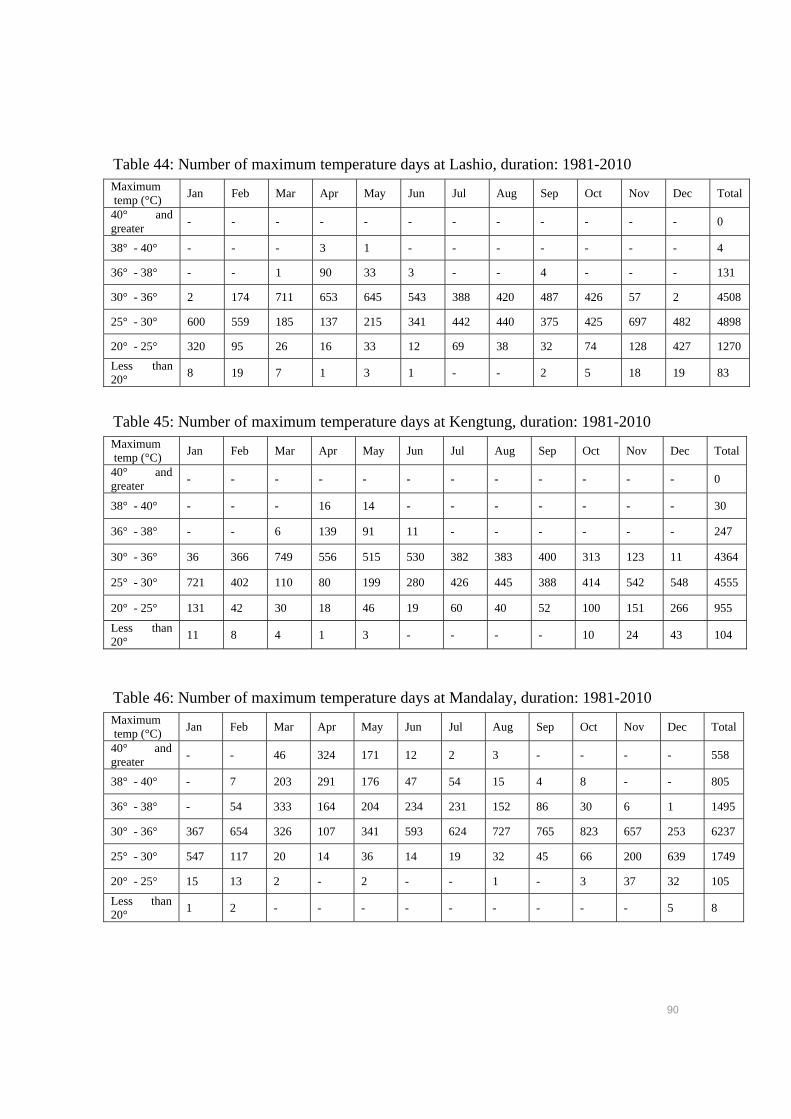
90
Table 44: Number of maximum temperature days at Lashio, duration: 1981-2010 Maximum temp (°C)
Jan Feb Mar Apr May Jun Jul Aug Sep Oct Nov Dec Total
40° and greater
- - - - - - - - - - - - 0
38° - 40° - - - 3 1 - - - - - - - 4
36° - 38° - - 1 90 33 3 - - 4 - - - 131
30° - 36° 2 174 711 653 645 543 388 420 487 426 57 2 4508
25° - 30° 600 559 185 137 215 341 442 440 375 425 697 482 4898
20° - 25° 320 95 26 16 33 12 69 38 32 74 128 427 1270
Less than 20°
8 19 7 1 3 1 - - 2 5 18 19 83
Table 45: Number of maximum temperature days at Kengtung, duration: 1981-2010 Maximum temp (°C)
Jan Feb Mar Apr May Jun Jul Aug Sep Oct Nov Dec Total
40° and greater
- - - - - - - - - - - - 0
38° - 40° - - - 16 14 - - - - - - - 30
36° - 38° - - 6 139 91 11 - - - - - - 247
30° - 36° 36 366 749 556 515 530 382 383 400 313 123 11 4364
25° - 30° 721 402 110 80 199 280 426 445 388 414 542 548 4555
20° - 25° 131 42 30 18 46 19 60 40 52 100 151 266 955
Less than 20°
11 8 4 1 3 - - - - 10 24 43 104
Table 46: Number of maximum temperature days at Mandalay, duration: 1981-2010 Maximum temp (°C)
Jan Feb Mar Apr May Jun Jul Aug Sep Oct Nov Dec Total
40° and greater
- - 46 324 171 12 2 3 - - - - 558
38° - 40° - 7 203 291 176 47 54 15 4 8 - - 805
36° - 38° - 54 333 164 204 234 231 152 86 30 6 1 1495
30° - 36° 367 654 326 107 341 593 624 727 765 823 657 253 6237
25° - 30° 547 117 20 14 36 14 19 32 45 66 200 639 1749
20° - 25° 15 13 2 - 2 - - 1 - 3 37 32 105
Less than 20°
1 2 - - - - - - - - - 5 8
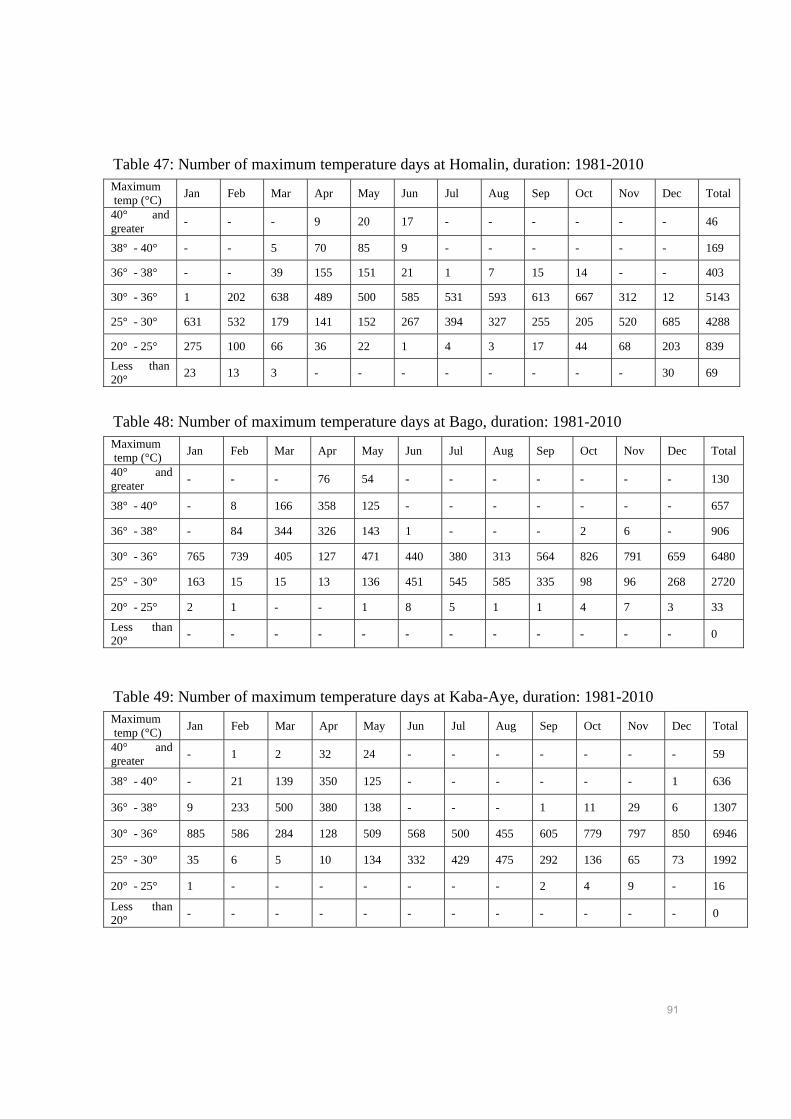
91
Table 47: Number of maximum temperature days at Homalin, duration: 1981-2010 Maximum temp (°C)
Jan Feb Mar Apr May Jun Jul Aug Sep Oct Nov Dec Total
40° and greater
- - - 9 20 17 - - - - - - 46
38° - 40° - - 5 70 85 9 - - - - - - 169
36° - 38° - - 39 155 151 21 1 7 15 14 - - 403
30° - 36° 1 202 638 489 500 585 531 593 613 667 312 12 5143
25° - 30° 631 532 179 141 152 267 394 327 255 205 520 685 4288
20° - 25° 275 100 66 36 22 1 4 3 17 44 68 203 839
Less than 20°
23 13 3 - - - - - - - - 30 69
Table 48: Number of maximum temperature days at Bago, duration: 1981-2010 Maximum temp (°C)
Jan Feb Mar Apr May Jun Jul Aug Sep Oct Nov Dec Total
40° and greater
- - - 76 54 - - - - - - - 130
38° - 40° - 8 166 358 125 - - - - - - - 657
36° - 38° - 84 344 326 143 1 - - - 2 6 - 906
30° - 36° 765 739 405 127 471 440 380 313 564 826 791 659 6480
25° - 30° 163 15 15 13 136 451 545 585 335 98 96 268 2720
20° - 25° 2 1 - - 1 8 5 1 1 4 7 3 33
Less than 20°
- - - - - - - - - - - - 0
Table 49: Number of maximum temperature days at Kaba-Aye, duration: 1981-2010 Maximum temp (°C)
Jan Feb Mar Apr May Jun Jul Aug Sep Oct Nov Dec Total
40° and greater
- 1 2 32 24 - - - - - - - 59
38° - 40° - 21 139 350 125 - - - - - - 1 636
36° - 38° 9 233 500 380 138 - - - 1 11 29 6 1307
30° - 36° 885 586 284 128 509 568 500 455 605 779 797 850 6946
25° - 30° 35 6 5 10 134 332 429 475 292 136 65 73 1992
20° - 25° 1 - - - - - - - 2 4 9 - 16
Less than 20°
- - - - - - - - - - - - 0
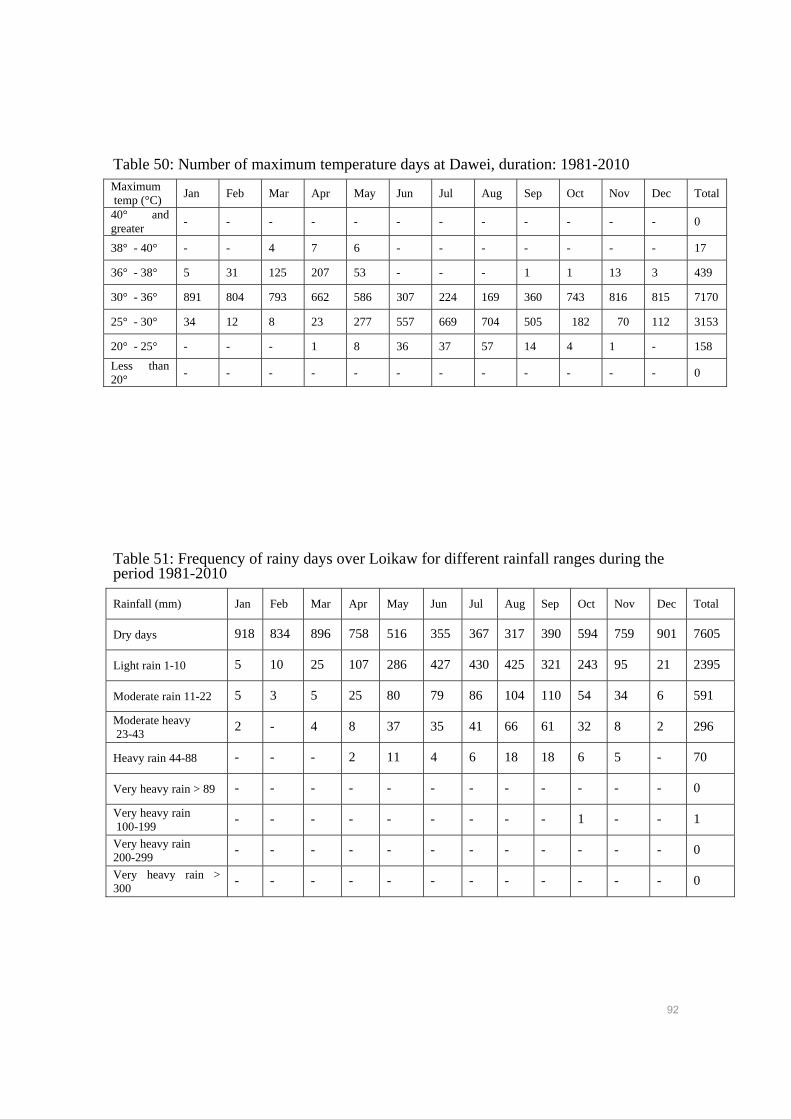
92
Table 50: Number of maximum temperature days at Dawei, duration: 1981-2010 Maximum temp (°C)
Jan Feb Mar Apr May Jun Jul Aug Sep Oct Nov Dec Total
40° and greater
- - - - - - - - - - - - 0
38° - 40° - - 4 7 6 - - - - - - - 17
36° - 38° 5 31 125 207 53 - - - 1 1 13 3 439
30° - 36° 891 804 793 662 586 307 224 169 360 743 816 815 7170
25° - 30° 34 12 8 23 277 557 669 704 505 182 70 112 3153
20° - 25° - - - 1 8 36 37 57 14 4 1 - 158
Less than 20°
- - - - - - - - - - - - 0
Table 51: Frequency of rainy days over Loikaw for different rainfall ranges during the period 1981-2010
Rainfall (mm) Jan Feb Mar Apr May Jun Jul Aug Sep Oct Nov Dec Total
Dry days 918 834 896 758 516 355 367 317 390 594 759 901 7605
Light rain 1-10 5 10 25 107 286 427 430 425 321 243 95 21 2395
Moderate rain 11-22 5 3 5 25 80 79 86 104 110 54 34 6 591
Moderate heavy 23-43
2 - 4 8 37 35 41 66 61 32 8 2 296
Heavy rain 44-88 - - - 2 11 4 6 18 18 6 5 - 70
Very heavy rain > 89 - - - - - - - - - - - - 0
Very heavy rain 100-199
- - - - - - - - - 1 - - 1
Very heavy rain 200-299
- - - - - - - - - - - - 0
Very heavy rain > 300
- - - - - - - - - - - - 0
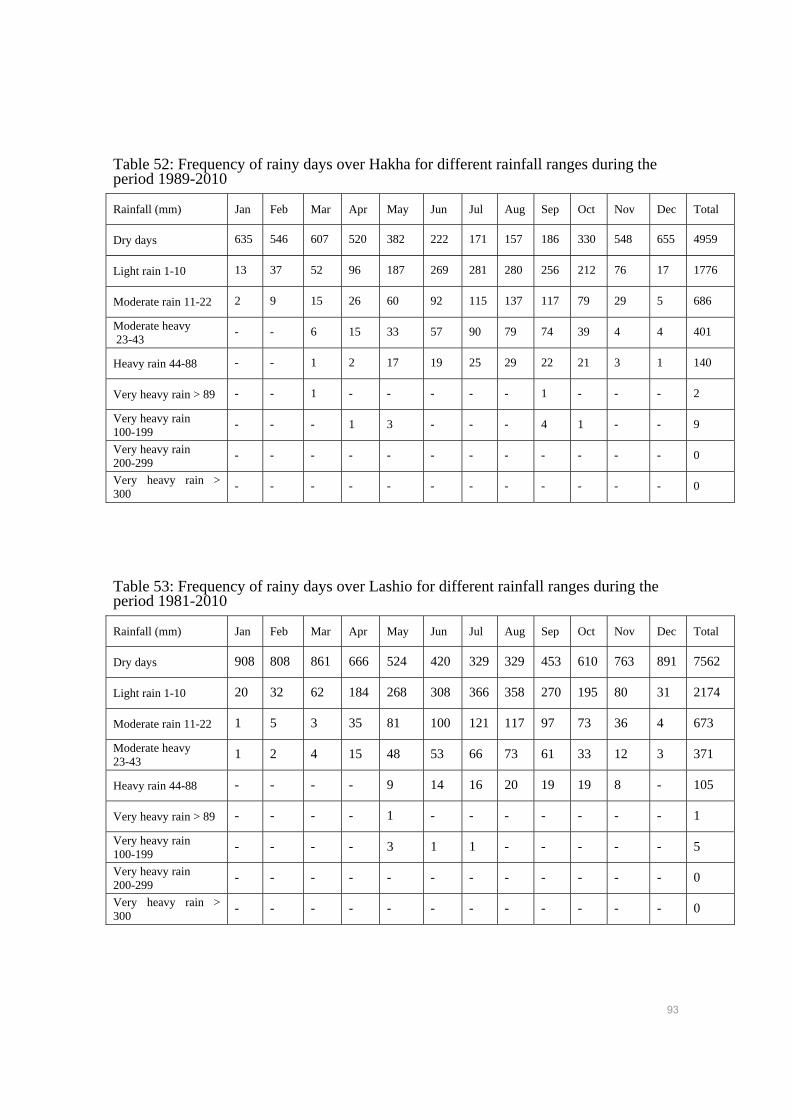
93
Table 52: Frequency of rainy days over Hakha for different rainfall ranges during the period 1989-2010
Rainfall (mm) Jan Feb Mar Apr May Jun Jul Aug Sep Oct Nov Dec Total
Dry days 635 546 607 520 382 222 171 157 186 330 548 655 4959
Light rain 1-10 13 37 52 96 187 269 281 280 256 212 76 17 1776
Moderate rain 11-22 2 9 15 26 60 92 115 137 117 79 29 5 686
Moderate heavy 23-43
- - 6 15 33 57 90 79 74 39 4 4 401
Heavy rain 44-88 - - 1 2 17 19 25 29 22 21 3 1 140
Very heavy rain > 89 - - 1 - - - - - 1 - - - 2
Very heavy rain 100-199
- - - 1 3 - - - 4 1 - - 9
Very heavy rain 200-299
- - - - - - - - - - - - 0
Very heavy rain > 300
- - - - - - - - - - - - 0
Table 53: Frequency of rainy days over Lashio for different rainfall ranges during the period 1981-2010
Rainfall (mm) Jan Feb Mar Apr May Jun Jul Aug Sep Oct Nov Dec Total
Dry days 908 808 861 666 524 420 329 329 453 610 763 891 7562
Light rain 1-10 20 32 62 184 268 308 366 358 270 195 80 31 2174
Moderate rain 11-22 1 5 3 35 81 100 121 117 97 73 36 4 673
Moderate heavy 23-43
1 2 4 15 48 53 66 73 61 33 12 3 371
Heavy rain 44-88 - - - - 9 14 16 20 19 19 8 - 105
Very heavy rain > 89 - - - - 1 - - - - - - - 1
Very heavy rain 100-199
- - - - 3 1 1 - - - - - 5
Very heavy rain 200-299
- - - - - - - - - - - - 0
Very heavy rain > 300
- - - - - - - - - - - - 0
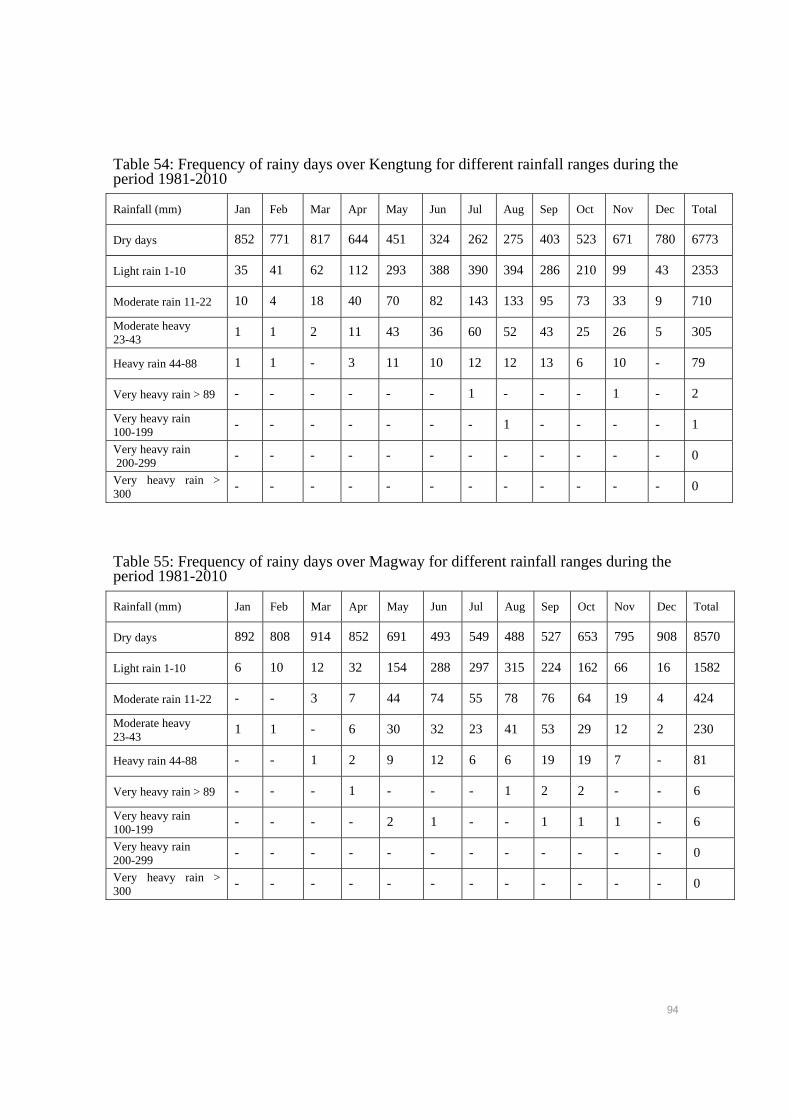
94
Table 54: Frequency of rainy days over Kengtung for different rainfall ranges during the period 1981-2010
Rainfall (mm) Jan Feb Mar Apr May Jun Jul Aug Sep Oct Nov Dec Total
Dry days 852 771 817 644 451 324 262 275 403 523 671 780 6773
Light rain 1-10 35 41 62 112 293 388 390 394 286 210 99 43 2353
Moderate rain 11-22 10 4 18 40 70 82 143 133 95 73 33 9 710
Moderate heavy 23-43
1 1 2 11 43 36 60 52 43 25 26 5 305
Heavy rain 44-88 1 1 - 3 11 10 12 12 13 6 10 - 79
Very heavy rain > 89 - - - - - - 1 - - - 1 - 2
Very heavy rain 100-199
- - - - - - - 1 - - - - 1
Very heavy rain 200-299
- - - - - - - - - - - - 0
Very heavy rain > 300
- - - - - - - - - - - - 0
Table 55: Frequency of rainy days over Magway for different rainfall ranges during the period 1981-2010
Rainfall (mm) Jan Feb Mar Apr May Jun Jul Aug Sep Oct Nov Dec Total
Dry days 892 808 914 852 691 493 549 488 527 653 795 908 8570
Light rain 1-10 6 10 12 32 154 288 297 315 224 162 66 16 1582
Moderate rain 11-22 - - 3 7 44 74 55 78 76 64 19 4 424
Moderate heavy 23-43
1 1 - 6 30 32 23 41 53 29 12 2 230
Heavy rain 44-88 - - 1 2 9 12 6 6 19 19 7 - 81
Very heavy rain > 89 - - - 1 - - - 1 2 2 - - 6
Very heavy rain 100-199
- - - - 2 1 - - 1 1 1 - 6
Very heavy rain 200-299
- - - - - - - - - - - - 0
Very heavy rain > 300
- - - - - - - - - - - - 0
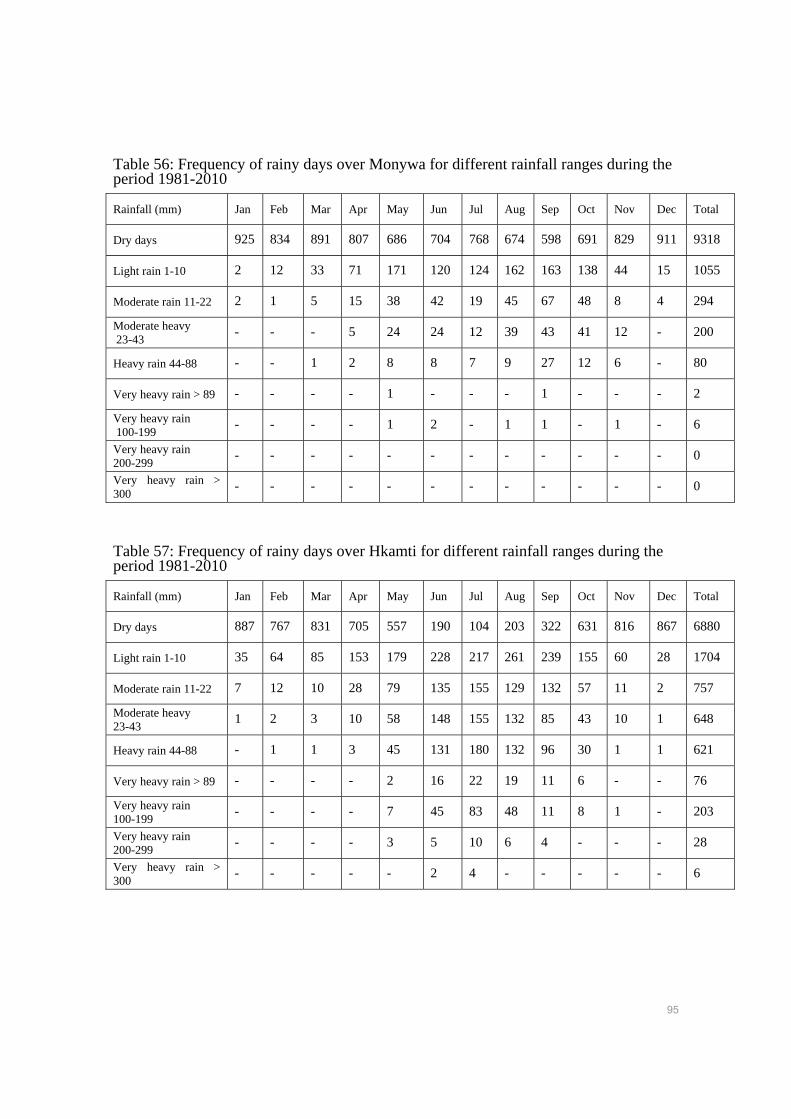
95
Table 56: Frequency of rainy days over Monywa for different rainfall ranges during the period 1981-2010
Rainfall (mm) Jan Feb Mar Apr May Jun Jul Aug Sep Oct Nov Dec Total
Dry days 925 834 891 807 686 704 768 674 598 691 829 911 9318
Light rain 1-10 2 12 33 71 171 120 124 162 163 138 44 15 1055
Moderate rain 11-22 2 1 5 15 38 42 19 45 67 48 8 4 294
Moderate heavy 23-43
- - - 5 24 24 12 39 43 41 12 - 200
Heavy rain 44-88 - - 1 2 8 8 7 9 27 12 6 - 80
Very heavy rain > 89 - - - - 1 - - - 1 - - - 2
Very heavy rain 100-199
- - - - 1 2 - 1 1 - 1 - 6
Very heavy rain 200-299
- - - - - - - - - - - - 0
Very heavy rain > 300
- - - - - - - - - - - - 0
Table 57: Frequency of rainy days over Hkamti for different rainfall ranges during the period 1981-2010
Rainfall (mm) Jan Feb Mar Apr May Jun Jul Aug Sep Oct Nov Dec Total
Dry days 887 767 831 705 557 190 104 203 322 631 816 867 6880
Light rain 1-10 35 64 85 153 179 228 217 261 239 155 60 28 1704
Moderate rain 11-22 7 12 10 28 79 135 155 129 132 57 11 2 757
Moderate heavy 23-43
1 2 3 10 58 148 155 132 85 43 10 1 648
Heavy rain 44-88 - 1 1 3 45 131 180 132 96 30 1 1 621
Very heavy rain > 89 - - - - 2 16 22 19 11 6 - - 76
Very heavy rain 100-199
- - - - 7 45 83 48 11 8 1 - 203
Very heavy rain 200-299
- - - - 3 5 10 6 4 - - - 28
Very heavy rain > 300
- - - - - 2 4 - - - - - 6
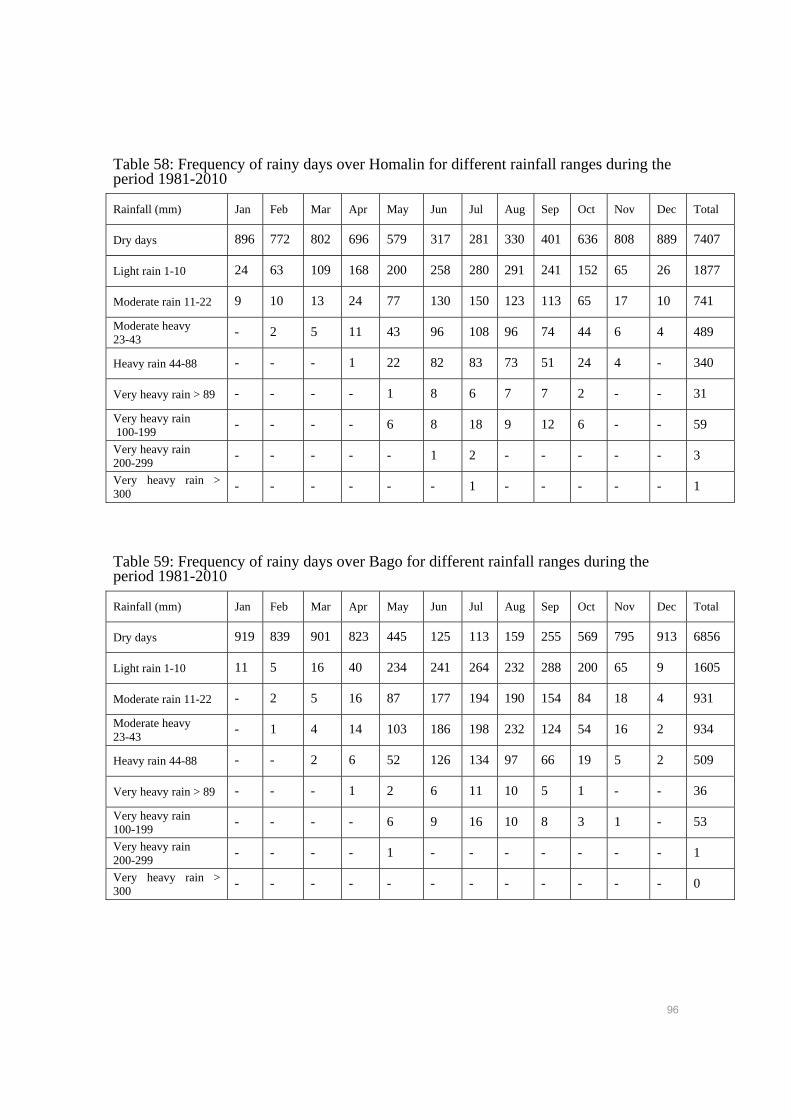
96
Table 58: Frequency of rainy days over Homalin for different rainfall ranges during the period 1981-2010
Rainfall (mm) Jan Feb Mar Apr May Jun Jul Aug Sep Oct Nov Dec Total
Dry days 896 772 802 696 579 317 281 330 401 636 808 889 7407
Light rain 1-10 24 63 109 168 200 258 280 291 241 152 65 26 1877
Moderate rain 11-22 9 10 13 24 77 130 150 123 113 65 17 10 741
Moderate heavy 23-43
- 2 5 11 43 96 108 96 74 44 6 4 489
Heavy rain 44-88 - - - 1 22 82 83 73 51 24 4 - 340
Very heavy rain > 89 - - - - 1 8 6 7 7 2 - - 31
Very heavy rain 100-199
- - - - 6 8 18 9 12 6 - - 59
Very heavy rain 200-299
- - - - - 1 2 - - - - - 3
Very heavy rain > 300
- - - - - - 1 - - - - - 1
Table 59: Frequency of rainy days over Bago for different rainfall ranges during the period 1981-2010
Rainfall (mm) Jan Feb Mar Apr May Jun Jul Aug Sep Oct Nov Dec Total
Dry days 919 839 901 823 445 125 113 159 255 569 795 913 6856
Light rain 1-10 11 5 16 40 234 241 264 232 288 200 65 9 1605
Moderate rain 11-22 - 2 5 16 87 177 194 190 154 84 18 4 931
Moderate heavy 23-43
- 1 4 14 103 186 198 232 124 54 16 2 934
Heavy rain 44-88 - - 2 6 52 126 134 97 66 19 5 2 509
Very heavy rain > 89 - - - 1 2 6 11 10 5 1 - - 36
Very heavy rain 100-199
- - - - 6 9 16 10 8 3 1 - 53
Very heavy rain 200-299
- - - - 1 - - - - - - - 1
Very heavy rain > 300
- - - - - - - - - - - - 0
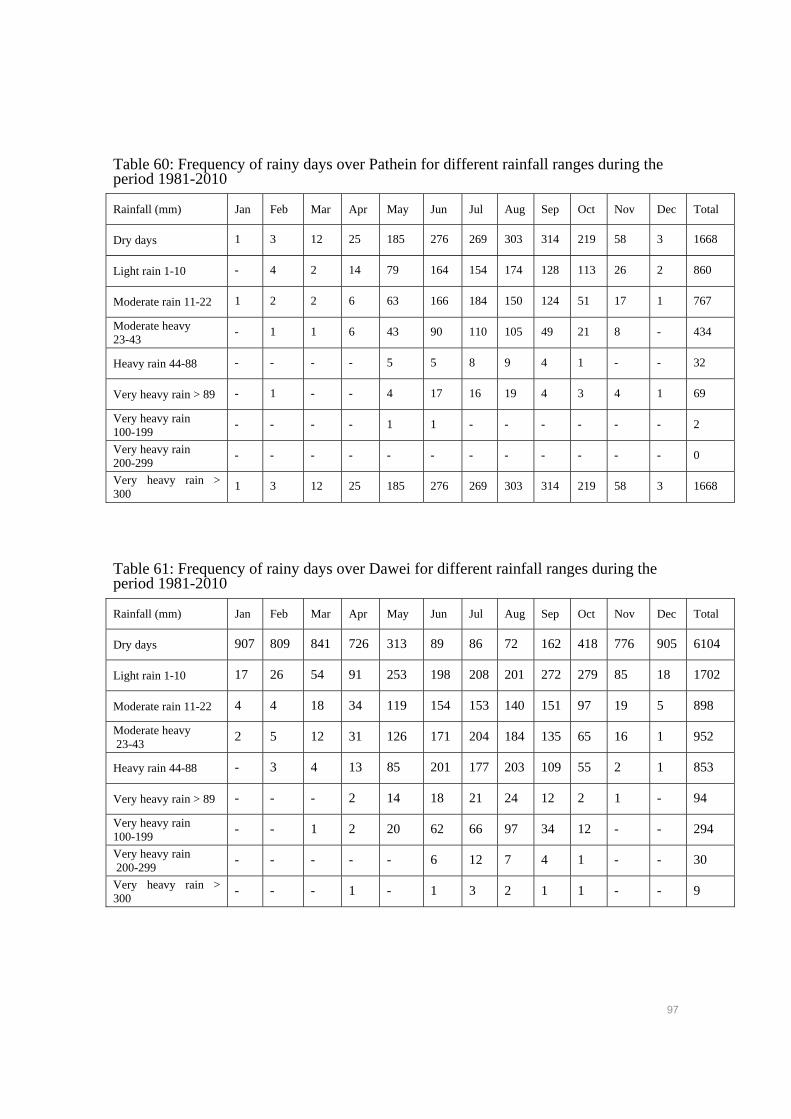
97
Table 60: Frequency of rainy days over Pathein for different rainfall ranges during the period 1981-2010
Rainfall (mm) Jan Feb Mar Apr May Jun Jul Aug Sep Oct Nov Dec Total
Dry days 1 3 12 25 185 276 269 303 314 219 58 3 1668
Light rain 1-10 - 4 2 14 79 164 154 174 128 113 26 2 860
Moderate rain 11-22 1 2 2 6 63 166 184 150 124 51 17 1 767
Moderate heavy 23-43
- 1 1 6 43 90 110 105 49 21 8 - 434
Heavy rain 44-88 - - - - 5 5 8 9 4 1 - - 32
Very heavy rain > 89 - 1 - - 4 17 16 19 4 3 4 1 69
Very heavy rain 100-199
- - - - 1 1 - - - - - - 2
Very heavy rain 200-299
- - - - - - - - - - - - 0
Very heavy rain > 300
1 3 12 25 185 276 269 303 314 219 58 3 1668
Table 61: Frequency of rainy days over Dawei for different rainfall ranges during the period 1981-2010
Rainfall (mm) Jan Feb Mar Apr May Jun Jul Aug Sep Oct Nov Dec Total
Dry days 907 809 841 726 313 89 86 72 162 418 776 905 6104
Light rain 1-10 17 26 54 91 253 198 208 201 272 279 85 18 1702
Moderate rain 11-22 4 4 18 34 119 154 153 140 151 97 19 5 898
Moderate heavy 23-43
2 5 12 31 126 171 204 184 135 65 16 1 952
Heavy rain 44-88 - 3 4 13 85 201 177 203 109 55 2 1 853
Very heavy rain > 89 - - - 2 14 18 21 24 12 2 1 - 94
Very heavy rain 100-199
- - 1 2 20 62 66 97 34 12 - - 294
Very heavy rain 200-299
- - - - - 6 12 7 4 1 - - 30
Very heavy rain > 300
- - - 1 - 1 3 2 1 1 - - 9
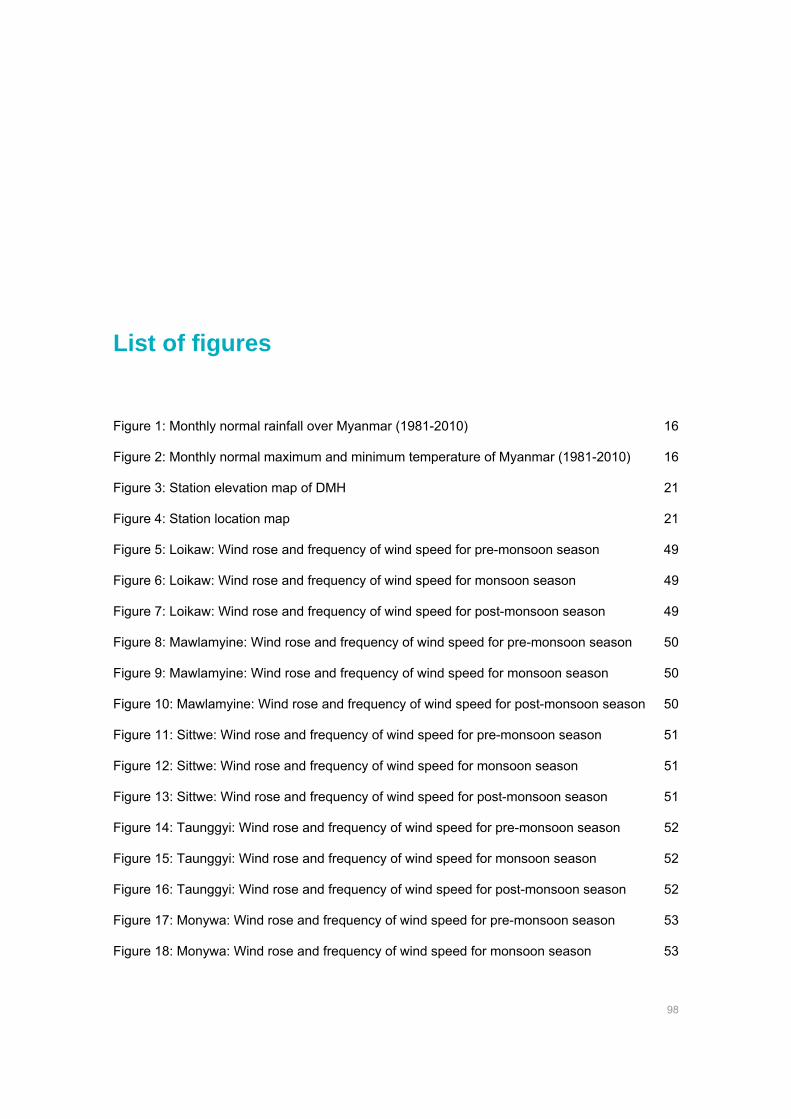
98
List of figures
Figure 1: Monthly normal rainfall over Myanmar (1981-2010) 16
Figure 2: Monthly normal maximum and minimum temperature of Myanmar (1981-2010) 16
Figure 3: Station elevation map of DMH 21
Figure 4: Station location map 21
Figure 5: Loikaw: Wind rose and frequency of wind speed for pre-monsoon season 49
Figure 6: Loikaw: Wind rose and frequency of wind speed for monsoon season 49
Figure 7: Loikaw: Wind rose and frequency of wind speed for post-monsoon season 49
Figure 8: Mawlamyine: Wind rose and frequency of wind speed for pre-monsoon season 50
Figure 9: Mawlamyine: Wind rose and frequency of wind speed for monsoon season 50
Figure 10: Mawlamyine: Wind rose and frequency of wind speed for post-monsoon season 50
Figure 11: Sittwe: Wind rose and frequency of wind speed for pre-monsoon season 51
Figure 12: Sittwe: Wind rose and frequency of wind speed for monsoon season 51
Figure 13: Sittwe: Wind rose and frequency of wind speed for post-monsoon season 51
Figure 14: Taunggyi: Wind rose and frequency of wind speed for pre-monsoon season 52
Figure 15: Taunggyi: Wind rose and frequency of wind speed for monsoon season 52
Figure 16: Taunggyi: Wind rose and frequency of wind speed for post-monsoon season 52
Figure 17: Monywa: Wind rose and frequency of wind speed for pre-monsoon season 53
Figure 18: Monywa: Wind rose and frequency of wind speed for monsoon season 53
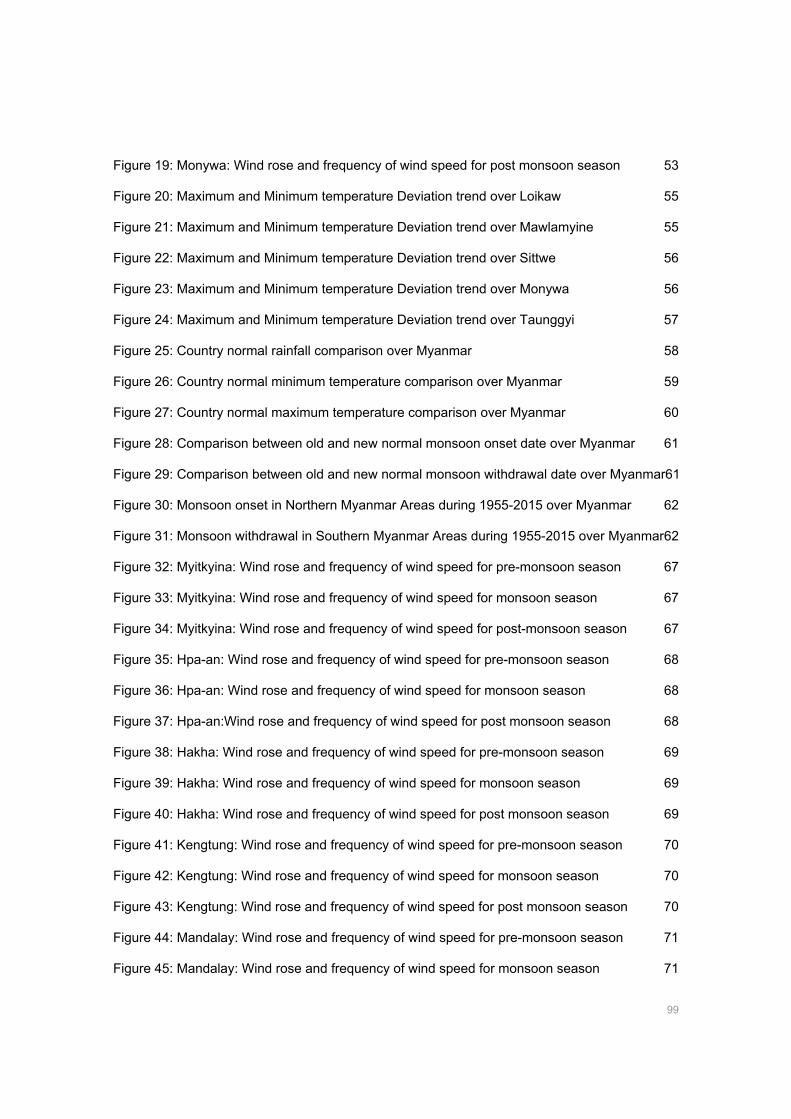
99
Figure 19: Monywa: Wind rose and frequency of wind speed for post monsoon season 53
Figure 20: Maximum and Minimum temperature Deviation trend over Loikaw 55
Figure 21: Maximum and Minimum temperature Deviation trend over Mawlamyine 55
Figure 22: Maximum and Minimum temperature Deviation trend over Sittwe 56
Figure 23: Maximum and Minimum temperature Deviation trend over Monywa 56
Figure 24: Maximum and Minimum temperature Deviation trend over Taunggyi 57
Figure 25: Country normal rainfall comparison over Myanmar 58
Figure 26: Country normal minimum temperature comparison over Myanmar 59
Figure 27: Country normal maximum temperature comparison over Myanmar 60
Figure 28: Comparison between old and new normal monsoon onset date over Myanmar 61
Figure 29: Comparison between old and new normal monsoon withdrawal date over Myanmar61
Figure 30: Monsoon onset in Northern Myanmar Areas during 1955-2015 over Myanmar 62
Figure 31: Monsoon withdrawal in Southern Myanmar Areas during 1955-2015 over Myanmar 62
Figure 32: Myitkyina: Wind rose and frequency of wind speed for pre-monsoon season 67
Figure 33: Myitkyina: Wind rose and frequency of wind speed for monsoon season 67
Figure 34: Myitkyina: Wind rose and frequency of wind speed for post-monsoon season 67
Figure 35: Hpa-an: Wind rose and frequency of wind speed for pre-monsoon season 68
Figure 36: Hpa-an: Wind rose and frequency of wind speed for monsoon season 68
Figure 37: Hpa-an:Wind rose and frequency of wind speed for post monsoon season 68
Figure 38: Hakha: Wind rose and frequency of wind speed for pre-monsoon season 69
Figure 39: Hakha: Wind rose and frequency of wind speed for monsoon season 69
Figure 40: Hakha: Wind rose and frequency of wind speed for post monsoon season 69
Figure 41: Kengtung: Wind rose and frequency of wind speed for pre-monsoon season 70
Figure 42: Kengtung: Wind rose and frequency of wind speed for monsoon season 70
Figure 43: Kengtung: Wind rose and frequency of wind speed for post monsoon season 70
Figure 44: Mandalay: Wind rose and frequency of wind speed for pre-monsoon season 71
Figure 45: Mandalay: Wind rose and frequency of wind speed for monsoon season 71
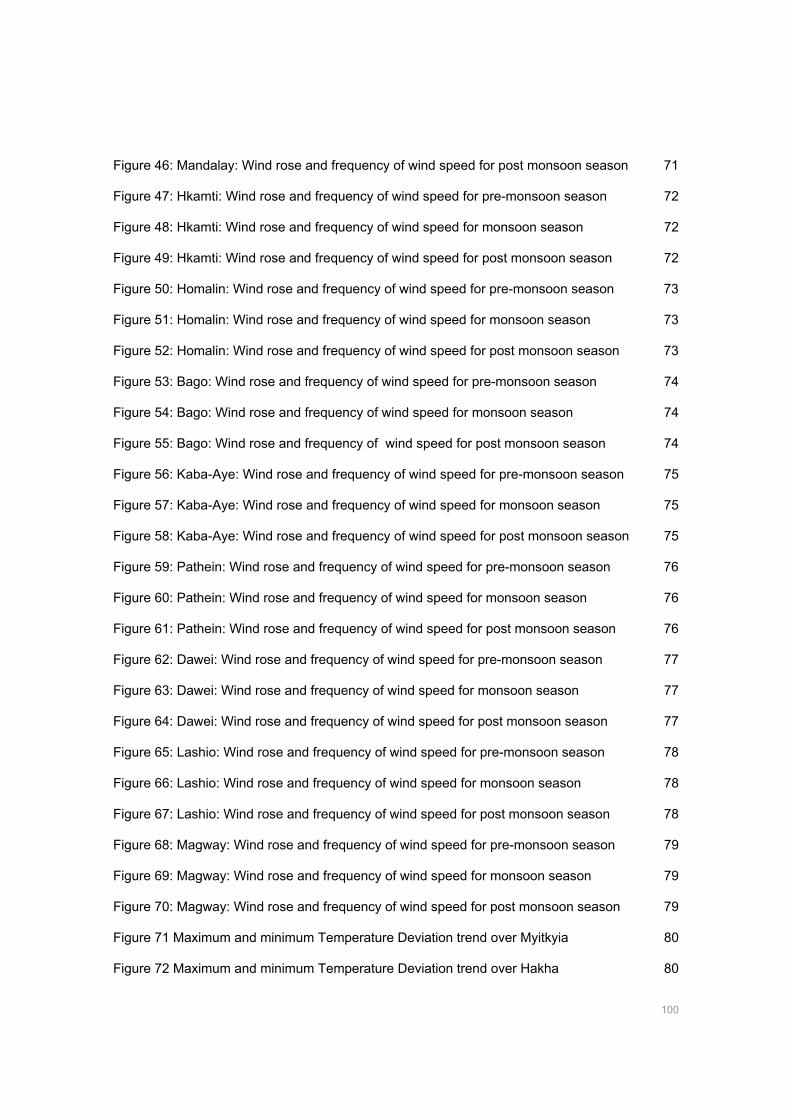
100
Figure 46: Mandalay: Wind rose and frequency of wind speed for post monsoon season 71
Figure 47: Hkamti: Wind rose and frequency of wind speed for pre-monsoon season 72
Figure 48: Hkamti: Wind rose and frequency of wind speed for monsoon season 72
Figure 49: Hkamti: Wind rose and frequency of wind speed for post monsoon season 72
Figure 50: Homalin: Wind rose and frequency of wind speed for pre-monsoon season 73
Figure 51: Homalin: Wind rose and frequency of wind speed for monsoon season 73
Figure 52: Homalin: Wind rose and frequency of wind speed for post monsoon season 73
Figure 53: Bago: Wind rose and frequency of wind speed for pre-monsoon season 74
Figure 54: Bago: Wind rose and frequency of wind speed for monsoon season 74
Figure 55: Bago: Wind rose and frequency of wind speed for post monsoon season 74
Figure 56: Kaba-Aye: Wind rose and frequency of wind speed for pre-monsoon season 75
Figure 57: Kaba-Aye: Wind rose and frequency of wind speed for monsoon season 75
Figure 58: Kaba-Aye: Wind rose and frequency of wind speed for post monsoon season 75
Figure 59: Pathein: Wind rose and frequency of wind speed for pre-monsoon season 76
Figure 60: Pathein: Wind rose and frequency of wind speed for monsoon season 76
Figure 61: Pathein: Wind rose and frequency of wind speed for post monsoon season 76
Figure 62: Dawei: Wind rose and frequency of wind speed for pre-monsoon season 77
Figure 63: Dawei: Wind rose and frequency of wind speed for monsoon season 77
Figure 64: Dawei: Wind rose and frequency of wind speed for post monsoon season 77
Figure 65: Lashio: Wind rose and frequency of wind speed for pre-monsoon season 78
Figure 66: Lashio: Wind rose and frequency of wind speed for monsoon season 78
Figure 67: Lashio: Wind rose and frequency of wind speed for post monsoon season 78
Figure 68: Magway: Wind rose and frequency of wind speed for pre-monsoon season 79
Figure 69: Magway: Wind rose and frequency of wind speed for monsoon season 79
Figure 70: Magway: Wind rose and frequency of wind speed for post monsoon season 79
Figure 71 Maximum and minimum Temperature Deviation trend over Myitkyia 80
Figure 72 Maximum and minimum Temperature Deviation trend over Hakha 80
101
Figure 73 Maximum and minimum Temperature Deviation trend over Kengtung 81
Figure 74 Maximum and minimum Temperature Deviation trend over Hpa-an 81
Figure 75 Maximum and minimum Temperature Deviation trend over Lashio 82
Figure 76: Maximum and minimum Temperature Deviation trend over Mandalay 82
Figure 77: Maximum and minimum Temperature Deviation trend over Hkamti 83
Figure 78: Maximum and minimum Temperature Deviation trend over Magway 83
Figure 79: Maximum and minimum Temperature Deviation trend over Homalin 84
Figure 80: Maximum and minimum Temperature Deviation trend over Kaba-Aye 84
Figure 81: Maximum and minimum Temperature Deviation trend over Pathein 85
Figure 82: Maximum and minimum Temperature Deviation trend over Bago 85
Figure 83: Maximum and minimum Temperature Deviation trend over Dawei 86
102
List of tables
Table 1: Observatories of DMH which are in operation at present 19
Table 2: Highest maximum Temperature (°C) with date of occurrence; year 2001-2010 22
Table 3: Lowest minimum Temperature (°C) with date of occurrence; year 2001-2010 23
Table 4: List of some devastating cyclones that made landfall over the Myanmar coast 25
Table 5: Monthly normal maximum temperature (°C) for different observatories of DMH 26
Table 6: Monthly normal minimum temperature (°C) for different observatories of DMH 30
Table 7: Monthly normal rainfall 33
Table 8: Number of minimum temperature days at Myitkyina, duration: 1981-2010 38
Table 9: Number of minimum temperature days at Monywa, duration: 1981-2010 38
Table 10: Number of minimum temperature days at Pathein, duration: 1981-2010 38
Table 11: Number of minimum temperature days at Sittwe, duration: 1981-2010 39
Table 12: Number of minimum temperature days at Taunggyi, duration: 1981-2010 39
Table 13: Number of minimum temperature days at Hkamti, duration: 1981-2010 39
Table 14: Number of minimum temperature days at Magway, duration: 1981-2010 40
Table 15: Number of minimum temperature days at Mawlamyine, duration: 1981-2010 40
Table 16: Number of minimum temperature days at Hakha, duration: 1989-2010 40
Table 17: Number of maximum temperature days at Myitkyina, duration: 1981-2010 41
Table 18: Number of maximum temperature days at Monywa, duration: 1981-2010 42
Table 19: Number of maximum temperature days at Pathein, duration: 1981-2010 42
103
Table 20: Number of maximum temperature days at Sittwe, duration: 1981-2010 42
Table 21: Number of maximum temperature days at Taunggyi, duration: 1981-2010 43
Table 22: Number of maximum temperature days at Hkamti, duration: 1981-2010 43
Table 23: Number of maximum temperature days at Magway, duration: 1980-2010 43
Table 24: Number of maximum temperature days at Mawlamyine, duration: 1981-2010 44
Table 25: Number of maximum temperature days at Hakha, duration: 1989-2010 44
Table 26: Frequency of rainy days over Myitkyina for different rainfall ranges during the period 1981-2010 45
Table 27: Frequency of rainy days over Kaba-Aye for different rainfall ranges during the period 1981-2010 45
Table 28: Frequency of rainy days over Mawlamyine for different rainfall ranges during the period 1981-2010 46
Table 29: Frequency of rainy days over Sittwe for different rainfall ranges during the period 1981-2010 46
Table 30: Frequency of rainy days over Taunggyi for different ranges during the period 1981-2010 47
Table 31: Frequency of rainy days over Mandalay for different rainfall ranges during the period 1981-2010 47
Table 32: Normal rainfalls data (mm) for periods (1961-1990) and (1981-2010) over Myanmar 58
Table 33: Normal minimum temperature data (°C) for the periods 1961-1991 and 1981-2010 over Myanmar 59
Table 34: Normal maximum temperature data (°C) for the periods 1961-1991 and 1981-2010 over Myanmar 60
Table 35: Number of minimum temperature days at Loikaw, duration: 1981-2010 87
Table 36: Number of minimum temperature days at Lashio, duration: 1981-2010 87
Table 37: Number of minimum temperatur days at Kengtung, duration: 1981-2010 87
Table 38: Number of minimum temperature days at Mandalay, duration: 1981-2010 88
Table 39: Number of minimum temperature days at Homalin, duration: 1981-2010 88
Table 40: Number of minimum temperature days at Bago, duration: 1981-2010 88
Table 41: Number of minimum temperature days at Kaba-Aye, duration: 1981-2010 89
104
Table 42: Number of minimum temperature days at Dawei, duration: 1981-2010 89
Table 43: Number of maximum temperature days at Loikaw, duration: 1981-2010 89
Table 44: Number of maximum temperature days at Lashio, duration: 1981-2010 90
Table 45: Number of maximum temperature days at Kengtung, duration: 1981-2010 90
Table 46: Number of maximum temperature days at Mandalay, duration: 1981-2010 90
Table 47: Number of maximum temperature days at Homalin, duration: 1981-2010 91
Table 48: Number of maximum temperature days at Bago, duration: 1981-2010 91
Table 49: Number of maximum temperature days at Kaba-Aye, duration: 1981-2010 91
Table 50: Number of maximum temperature days at Dawei, duration: 1981-2010 92
Table 51: Frequency of rainy days over Loikaw for different rainfall ranges during the period 1981-2010 92
Table 52: Frequency of rainy days over Hakha for different rainfall ranges during the period 1989-2010 93
Table 53: Frequency of rainy days over Lashio for different rainfall ranges during the period 1981-2010 93
Table 54: Frequency of rainy days over Kengtung for different rainfall ranges during the period 1981-2010 94
Table 55: Frequency of rainy days over Magway for different rainfall ranges during the period 1981-2010 94
Table 56: Frequency of rainy days over Monywa for different rainfall ranges during the period 1981-2010 95
Table 57: Frequency of rainy days over Hkamti for different rainfall ranges during the period 1981-2010 95
Table 58: Frequency of rainy days over Homalin for different rainfall ranges during the period 1981-2010 96
Table 59: Frequency of rainy days over Bago for different rainfall ranges during the period 1981-2010 96
Table 60: Frequency of rainy days over Pathein for different rainfall ranges during the period 1981-2010 97
Table 61: Frequency of rainy days over Dawei for different rainfall ranges during the period 1981-2010 97
105
References
[1] Lwin 1995 “Climate of Myanmar” (Director General (Rtd): Department of Meteorology and Hydrology, DMH) [2] Climate of Bangladesh, 2016, Bangladesh Meteorological Department [3] DMH 2000 “National Course in Agricultural Meteorology” (Yangon: DMH) [4] DMH “Historical storms Reports” (Yangon: DMH) [5] DMH “Daily observations” (Myanmar's Stations, Yangon: DMH) [6] An Introduction to R 2015 “A Programming Environment for Data Analysis and Graphics” Version 3.2.2, W. N. Venables, D. M. Smith and the R Core Team