myanmar national electrification program (nep) roadmap … · myanmar national electrification...
TRANSCRIPT

Myanmar National Electrification Program (NEP)
Roadmap and Investment Prospectus
Final Road Map and Investment Prospectus
September
2014

Table of Contents
1 Introduction 1
2 Financing for the Least-Cost Roll-out for the Period FY2015-2019 4
2.1 Least-cost Roll-out 5
2.2 The Financing Need 8
2.3 Development Rationale for Donor Financing 10
3 Target Number of Connections 12
3.1 Grid Connections Ramp Up 12
3.2 Permanent Mini-grid and Off-grid Connections Ramp Up 13
3.3 Pre-electrification Connections Ramp Up 14
4 Costs of the Roll-out 16
4.1 Capital Costs 18
4.2 Operating Costs 19
4.3 Demand Assumptions 20
4.4 Key Sensitivies 21
4.4.1 Proportional Connections Roll-out Scenario 21
4.4.2 Targeted Connections Roll-out Scenario 22
4.4.3 Sensitivity to Generation Cost 23
5 Funding (Cost Recovery) 28
5.1 International Tariff Comparisons 29
5.2 The Reference Case 31
5.3 Key Sensitivities 33
5.3.1 Tariffs Remain Constant in Real Terms 33
5.3.2 Zero Funding Gap Tariff 35
6 Implementation Road Map 37
6.1 Diagnostic of Institutional Barriers to Implementing the NEP 39
6.1.1 Program-level Management and Coordination 40
6.1.2 Efficient Operation of Utilities and their Ability to Scale-up 42
6.1.3 Need for Coordinated Implementation of Mini-grids 43

6.1.4 Sustainability and Efficiency of Individual Household Solutions 43
6.2 Program Coordination 44
6.3 Grid Connections in YESB Franchise Area 45
6.4 Grid Connections in the ESE Franchise Area 45
6.4.1 ESE 48
6.4.2 Sub-Franchise Concessions 48
6.5 Mini-Grid Connections 50
6.6 Household Electrification 52
7 Technical Assistance for Myanmar National Electrification Plan (NEP) 54
8 Conclusions: Milestones and Accountability 64
Tables
Table 1.1: Annual Capital Expenditure (Capex) by Connection Type (US$ Million) ii
Table 2.1: Annual Capital Expenditure (Capex) by Connection Type (US$ Million) 9
Table 3.1: Total Target Connections by State and Type over the Entire Program 12
Table 3.2: Ramp Up in Annual Grid Connections (2015- 2019) 13
Table 4.1: Assumed Loan Terms for Donor Finance 16
Table 4.2: Capital Costs for Grid Electrification (US$ Million) 18
Table 4.3: Mini-grid, Pre-electrification and Off-grid Capex (US$ Million) 19
Table 4.4: Cost per MWh (Grid based Connections) 20
Table 4.5: Annual Electricity Demand per Grid and Mini-Grid Connection (2015-2030) 20
Table 4.6: Proportional Connections Roll-out (FY2015-2019) 22
Table 4.7: Current Electrification Rates and National Average 22
Table 4.8: Hypothetical Least-cost Generation Mix 25
Table 4.9: Least Cost Dispatch from our Analysis of Levelized Costs of Generation 26
Table 5.1: Required Real Growth in Average Tariff to Ensure Current Network is Cash Neutral 32

Table 5.2: Tariff and Connection Charges 33
Table 5.3: PV of Funding Gap 2015-2070, National Least Cost Connections 34
Table 5.4: PV of Funding Gap 2015-2070, Proportional Connections 34
Table 5.5: PV of Funding Gap 2015-2070, Targeted Connections 35
Table 5.6: Tariffs when New System is Cash Neutral Every Year (In US$) 36
Table 6.1: Decentralized Mini-grid Support Model Adapted to Myanmar 50
Table 7.1: Technical Assistance Costs 54
Table 7.2: Technical Assistance Tasks and Level of Effort 55
The table below presents the various cost components for each connection technology and related assumptions. These costs are estimated based on (i) Earth Institute’s and Castalia’s international experience of conducting similar assignments, with adjustments for the local context in Myanmar, (ii) data provided by ESE and YESB. Table B.1:Grid-based Cost Components 70
Table B.2: Mini grid-based Cost Components 71
Table B.3: Off grid-based Cost Components 71
Table B.4: Assets that need to be Replaced 72
Table B.5: Partial Snapshot of EI Roll out Sequence Algorithm Output 72
Table B.6: Annual Baseline Demand Growth Profile (Base Case) 73
Table B.7: Customer Connection Charges and Tariffs (Base Case) 73
Figures
Figure 1.1: Roadmap to 100 percent Electrification in Myanmar ii
Figure 1.2: Annual Grid Capex Least Cost Roll Out iii
Figure 1.3: Funding Gap Sensitivity to Tariff Levels v
Figure 2.1: Roadmap to 100 percent Electrification in Myanmar 4
Figure 2.2: Recommended Electrification Solutions 6
Figure 2.3: Relative Connection Contributions by Each State and Region from FY2015-2019 7
Figure 2.4: Relative Connection Contributions by Each State and Region from FY2015-2019 8
Figure 4.1: Annual Generation Costs and Load Factors 24

Figure 4.2: Annual Generation Costs and Load Factors 25
Figure 5.1: Funding Gap Sensitivity to Tariff Levels 29
Figure 5.2: GDP Per Capita and Residential Electricity Prices 30
Figure 5.3: Business electricity prices: 2013 comparison 30
Figure 5.4: Electrification Ratios 31
Figure 5.5: Funding Gap When Existing System is Cash Neutral: National Least Cost Roll out Scenario 32
Figure 5.6: Annual Government Support Needed under National Least-Cost Roll-out 33
Figure 6.1: Summary of Barriers to Achieving Electrification Objectives 40
Figure 6.2: Private and Community Operators on the ESE Franchise 48
Figure 8.1: Snapshot of Financing Input Assumptions 75
Boxes
Box 1.1: The Difference Between Funding (Cost Recovery) and Financing 2
Box 6.1: Programmatic Sector-Wide Approach: Case of Rwanda 38
Appendices
Appendix A : Successful Electrification Case Studies 65
Appendix B : Financial Model Assumptions and Methodology 70

Acronyms and Abbreviations
ARR Annual Revenue Requirement
ADB Asian Development Bank
Capex Capital Expenditure
DRD Department of Rural Development
EI Earth Institute (Columbia University)
ESE Electricity Supply Enterprise
GoM Government of Myanmar
IDA International Development Association
JICA Japan International Cooperation Agency
kV Kilo volts
kWh Kilo Watt Hour
LV Low Voltage
LRMC Long Run Marginal Cost
MEB Myanmar Economic Bank
MEPE Myanmar Electric Power Enterprise
MOEP Ministry of Electric Power
MICB Myanmar Investment and Commercial Bank
MLFRD Ministry of Livestock, Fisheries and Rural Development
MV Medium Voltage
NEMC National Energy Management Committee
NEP National Electrification Program
O&M Operations and Maintenance
Opex Operating Expenditure
PLN Perusahaan Listrik Negara (Indonesia)
PPP Public Private Partnership
PV Present Value
PSO Public Service Obligation
RDB Rural Development Bank
REPWC Rural Electrification and Potable Water Committee
SHS Solar Home System
VEC Village Electrification Committee
YESB Yangon Electricity Supply Board

i
Executive Summary
The Myanmar National Electrification Plan (NEP) aims to electrify 100% of Myanmar’s households by 2030. According to the Earth Institute’s (EI) geospatial planning results, this means connecting more than 7.2 million households over the next 16 years.
Strong Government commitment to institutional strengthening and reform, and collective contribution of resources from consumers, and the Government of Myanmar and its development partners as well as the private sector are key factors in achieving the NEP’s ambitious goals.
The Roadmap to 100 percent Electrification
At present, Myanmar has about 2.3 million residential electricity connections. Depending on assumptions on household size, this implies that less than 30 percent of the population has access to electricity. Schools, clinics, and business in rural areas also have limited access.
At present, approximately 190,000 additional households gain access to electricity every year. At this rate, it would take almost 40 years to achieve full electrification. Such a slow rate of progress is not acceptable to the Government and the people of Myanmar. The Government is committed to achieve 100 percent electrification by 2030.
An initial comprehensive geospatial plan for the roll-out of electrification estimates that around 98 percent of the total new connections will be grid-based. While the electrification program will evolve dynamically, the initial plan envisages the least cost roll-out of the grid, alongside the development of mini-grid and off-grid solar home solutions. Additionally, approximately 250,000 connections using “pre-electrification” solutions such as temporary mini grids or off grid solar home systems will be viable for households who can expect to be connected to the grid at the very end of the roll-out program.
In all, approximately 7.2 million household connections will be required in the next 16 years to fulfill the vision of universal electrification by 2030. This means that the number of household connections needs to increase from the current 189,000 a year, to an average of 450,000 a year over the next 16 years—a more than two fold rise. Given the time required for ramp-up, the sustained number of connections once the program reaches maturity will be even higher: in excess of 510,000 per year.
The chart below describes the expected roadmap for the number of additional connections. The analysis of technical and institutional capabilities shows that it will take about two years to train sufficient technical and commercial personnel to become able to manage around 517,000 connections a year. The initial ramp-up means that during the first 5 years of the program (FY2015-2019), a total of close to 1.7 million new connections can be made. This represents 12.3 percent of all new connections under the roll-out program. This means that once the program reaches maturity, it will be expected to implement about 8 percent of all new connections in each subsequent year.
Subject to the successful implementation of this plan, Myanmar can be expected to achieve approximately 47 percent electrification by 2020, 76 percent electrification by 2025, and 100 percent by 2030.

ii
Figure 1.1: Roadmap to 100 percent Electrification in Myanmar
Source: Castalia and EI estimates
Investment Prospectus
The total capital cost of the electrification roll-out over 16 years is estimated to be $5.9 billion. Efficient implementation of the program will require that all capital expenditure is financed (so that, as much as possible, repayments can be spread over the economic life of the assets). Further investment will be needed in Myanmar’s generation and transmission systems in addition to investment in the medium and low voltage networks required for the roll-out (as well as investment in off-grid solutions). Additional demand from newly connected customers will require approximately 2,600 MW of additional generation capacity to be built over the next 16 years. While this Investment Prospectus does not cover the financing requirement of the generation and transmission program, the analysis ensures that sufficient funding will be available to cover the incremental costs of generation and transmission (including the cost of finance).
With close to 1.7 million new connections slated for FY2015-2019, the total financing need for the period will be $843million. This amount will cover fixed investment in long-lived capital assets ($819.2 million) plus Technical Assistance of $23.8 million.
Table 1.1: Annual Capital Expenditure (Capex) by Connection Type (US$ Million)
2015 2016 2017 2018 2019
Grid Capex $72.5 $80.6 $79.8 $139.9 $232.2
Planned Mini-grid Capex $0.6 $0.6 $0.6 $0.6 $0.6
Pre-electrification Capex $16.2 $22.6 $32.3 $45.1 $58.2
Off-grid Capex $2.2 $2.2 $2.2 $3.2 $3.2
Total Capex $91.5 $106.0 $114.9 $188.8 $294.2
Technical Assistance $10.3 $6.8 $2.2 $3.1 $1.4

iii
Total $101.8 $112.8 $117.1 $191.9 $295.6 Note: Includes 10% capex contingency, and that there is no capital replacement for pre-electrification connections
The figure below puts the financing need for FY2015-2019 within the context of the overall financing requirement for the electrification roll-out.
Figure 1.2: Annual Grid Capex Least Cost Roll Out
There is a strong development rationale for donors providing all, or most of the financing need during this initial roll-out phase. Meeting the financing need through concessional donor finance will make a significant development contribution as:
It will reliably enable Myanmar to achieve the targeted 1.7 million connections in the next 5 years. This will not only make significant contribution to the country’s development by giving those households access to electricity, it will underwrite the ramp-up in both technical and institutional capability required to achieve 100 percent electrification by 2030.
It will keep tariffs affordable, which is critical in ensuring that access to electricity translates into greater welfare and faster economic growth. Moreover, the long tenor of the concessional finance makes sure that the future users of electricity—who can expect to be substantially better off than the current users—pick up a fair share of the burden. In other words, it will ensure that the burden is consistent and commensurate with one’s ability to pay among Myanmar consumers and on the Government of Myanmar.
It will support the roll-out program over the period of economic reforms. Over time, as Myanmar economy becomes more integrated with the global financial system and as the local banking system matures, commercial finance will increasingly become available on tenors and other terms that can replace concessional finance without a material shock to tariffs.
The Government of Myanmar is already receiving important assistance from the ADB, IFC and others, including the framework for competitive tendering for rural electrification and
$0
$100
$200
$300
$400
$500
$600
2015 2016 2017 2018 2019 2020 2021 2022 2023 2024 2025 2026 2027 2028 2029 2030
Gri
d C
apex
($
mill
ion
)

iv
the development of a regulatory framework for mini-grids. The implementation of the Institutional Roadmap will require further Technical Assistance over the next 5 years of $23.8 million. The TA program will add to the existing work streams and support the setup of the Executive Secretariat (discussed below), as well as the up-skilling required for ESE, YESB, government agencies and domestic banks that could become conduits for donor finance to the private sector.
This report considered the feasibility of the roll-out under different tariff scenarios and tested sensitivities to different cost assumptions, including the cost of generation. The roll-out is feasible if future tariff revenues and subsidies committed by the Government are sufficient to cover all costs, including payment of interest and repayment of loans. The long-term financial model developed for this study confirms that under reasonable assumptions, viable combinations of affordable tariff revenues and fiscally sustainable Union Budget subsidies exist, which will ensure the full funding of the program—allowing loans to be repaid when due.
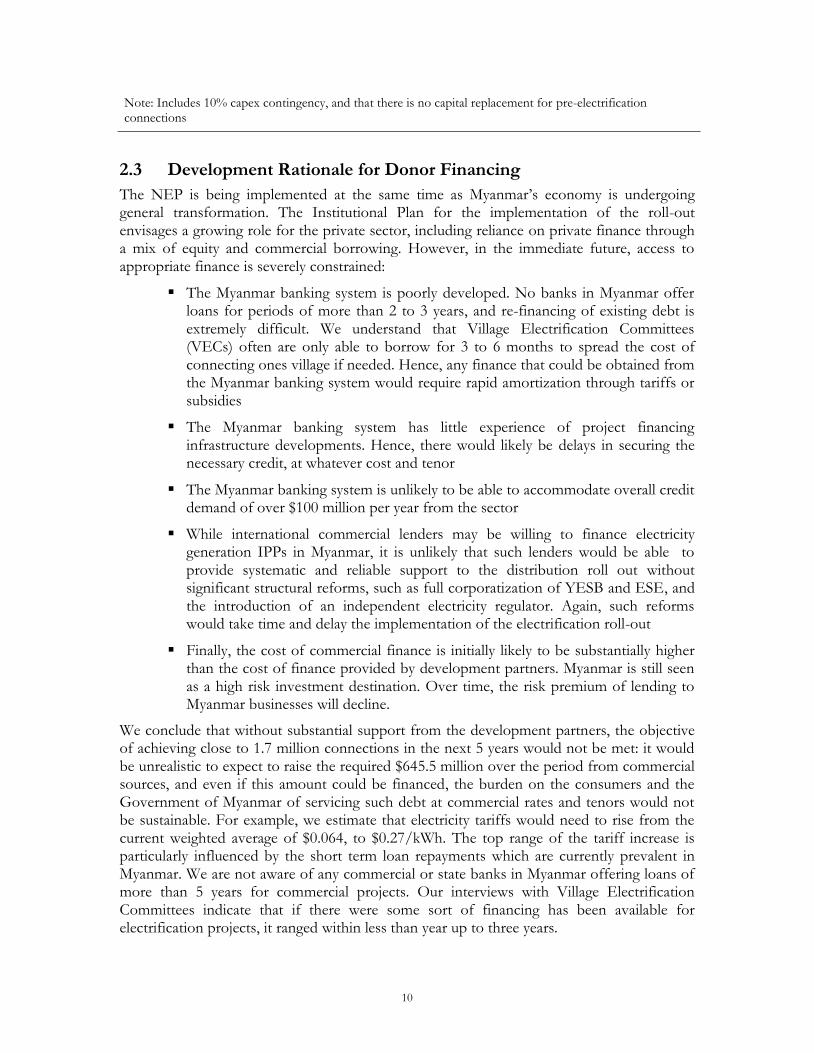
The figure below summarizes the relationship between tariff levels and the funding gap. The funding gap is the difference between total revenues and total cost of the electricity roll-out (including operating costs and the costs of incremental generation and transmission) which needs to be covered by Government subsidy.
The largest contributing factor of the funding gap results from keeping the current tariff constant in real terms—in other words, the nominal tariff is adjusted each year in line with inflation. This tariff produces the funding gap with the present value of approximately $2.17 billion.
On the other hand, it is possible to set a tariff path that would fully cover the costs of the electricity system over the next 40 years, so that no government subsidy would be required (and hence, there would be no funding gap). Given the existing structure of tariffs, this would require the weighted average tariff of $0.084 per kWh or an average weighted residential tariff of approximately $0.05 per kWh over the period.
The Government’s current strategy is to adjust the tariff to ensure that the revenues on the existing system cover all cash costs. Even if no roll-out happens, the cash costs of the existing system will grow as the already connected customers increase their demand, and new generation has to be added at full costs (including return on and of capital) to meet that demand. The average tariff that would be required to keep the current system cash neutral is $0.076 per kWh. This translates into a weighted average residential tariff of $0.043. In other words, the weighted average real residential tariff in any case would be expected to increase from $0.037 to $0.043—a real rise of 17% on average over the period—under the Government’s present policy.

v
Figure 1.3: Funding Gap Sensitivity to Tariff Levels
Note: Points on the horizontal axis represent the weighted average residential tariff
Overall, the tariff strategy needs to ensure that access to electricity is affordable to every household in the country: in this way, electrification will make a critical contribution to the Government’s poverty reduction objectives. To ensure that the subsidy commitment is fiscally sustainable and efficient, the tariff structure will need to be reviewed to align more closely with different households’ varying ability to pay.
Implementation Road Map
The report sets out the steps the Government of Myanmar will need to take to implement the roll-out program. Financing is not the only challenge Myanmar possesses. Limited institutional capability will remain a significant constraint even if financing becomes available, tariffs are increased, and if the Government commits to future subsidies. Moreover, the Government will need to strengthen its capability to assess and implement predictable tariff and subsidy policies.
To meet the institutional challenges, the Government will need to ensure high quality sector wide coordination, and strengthened implementation capacity within each area of responsibility.
Coordination: There is an urgent need to establish a well-resourced Executive Secretariat reporting to the Vice President. The Executive Secretariat should perform a number of roles:
It would maintain and update the geospatial and financial plans for the NEP, and monitor the achievement of the electrification targets
$-
$0.500
$1.000
$1.500
$2.000
$2.500
$0.037 $0.038 $0.040 $0.041 $0.042 $0.043 $0.045 $0.046 $0.047 $0.049
Fun
din
g G
ap $
bill
ion
Average Residential Tariff $/kwh
Myanmar current tariff
Vietnam
Existing system cash neutral tariff

vi
It would serve as the main point of contact for Myanmar’s development partners and would advise the Government on managing a coherent financing program for the sector-wide plan
It would provide advice and support to the Ministries involved in implementing the aspects of the NEP they will be responsible for.
Electrification on YESB franchise: YESB needs certainty to access financing for investment, and should be the Government’s immediate objective (within a year). Although YESB electrification needs are relatively small, these steps are needed both to make the YESB itself more sustainable (as well as to improve the quality of its service), and to ensure that electricity consumers in Yangon are able to make a financial contribution to the overall roll-out program. Given that the cost of service in Yangon is substantially lower than in the rest of the country (due to higher population density and a significant proportion of industry being concentrated in Yangon), a single national tariff would likely result in a cross-subsidy from consumers in Yangon to consumers in the rest of the country. A stable financial environment for the YESB can be achieved by:
Calculating an appropriate cost of service for the YESB, including the cost of power purchases and the return on and of capital employed in the distribution network
Determining a tariff that would cover such costs, and
Creating a mechanism for using any profits from the YESB to contribute to the subsidies required for the electrification roll-out.
In the medium term, it will be the role of the regulator to set the Annual Revenue Requirement (ARR) for the distribution enterprises. In the short term, this function can be performed by the Executive Secretariat.
Electrification on ESE franchise: 96 percent new connections in Myanmar will occur in ESE franchise area. For ESE, the Government should follow the same reform path as for YESB, focusing in the short term on enabling ESE to access finance for investment.
In addition, it is likely that many connections under the responsibility of ESE will be managed by private and community enterprises that will receive a concession for a sub-franchise (covering lines below 11kV and household connections). Given the scale of the electrification challenge in Myanmar, a multitude of solutions and initiatives should be welcomed. However, to ensure orderly process of establishing and implementing such sub-franchises, it will be necessary to:
Make arrangements for a clear delineation of service areas and responsibilities. Where private parties or community organizations wish to provide service, they should operate below 11kV network, provide a clear geographic description of the area in which they will provide the LV and household connection service and take on an explicit obligation to serve all customers within that area. In order to obtain a sub-franchise, a private or community service provider should be required to file a detailed roll-out plan showing how 100 percent electrification within the proposed area will be achieved

vii
Ensure that the ESE receives wheeling payments for its MV investments that serve such sub-franchises. This will require a determination of wheeling tariff for connections below the 11kV level
Create a mechanism to enable operators of such sub-franchises (whether private or community-owned) to access appropriate financing. This should focus on enabling a selected Myanmar bank to serve as an effective channel for concessional finance
Create a mechanism for delivering subsidies to these operators where such subsidies are required. Such subsidies may be either an initial capital subsidy, or the payment of a “shadow” tariff by the Government.
For sub-franchises to be viable, it will be necessary for a proportion of concessional finance be channeled via the Myanmar banking system to private operators seeking to establish sub-franchise operations.
Mini-Grids: From the perspective of the implementation of the NEP, the issues around the development of mini-grids (whether temporary or permanent) are similar to the sub-franchising of the ESE areas. DRD should take responsibility for:
Providing standard processes and standard documentation which sets out the obligations of the operator
Developing a competitive (minimum subsidy) process in response to a local initiative, against predictable tariff rules
Ensuring timely delivery of the subsidy
Working together with the Executive Secretariat to implement a program of two-step loans via a selected Myanmar bank to enable the operator to access concessional finance.
Given the similarities in the issues, the solutions should also be similar. In fact, we would recommend that a single set of rules be applied to sub-franchising of grid connections and to mini-grids, since the main factor differentiating the two is likely to be the timing of when the grid connection occurs.
Household electrification: the Government needs to move the household electrification program (whether temporary or permanent) from the relatively unsustainable give-away of solar systems without the users taking ownership and maintenance responsibilities of the systems, to an arrangement where customers are provided with energy supply by firms that maintain and operate household and village systems. Customers would pay for the energy they receive. Private providers would use revenue to cover the costs of maintenance. The Government would provide subsidies to ensure that tariff revenues were sufficient to cover the costs of the private operator.
Implementation milestones
Looking back a year or two from now, how will we know that the Roadmap has been a success? The following are the key milestones for the implementation of the Roadmap in the next 12 months:
Milestone 1: the Government of Myanmar formally adopts the Roadmap, including the institutional implementation plan via a Government Decree

viii
Milestone 2: The Government appoints an Executive Secretariat tasked with coordinating the roll-out program and responsible directly to the Vice-President. The Executive Secretariat should be empowered by Decree to act as the single window for cooperation with Myanmar’s development partners in relation to the roll-out program. While various agencies involved in the roll-out (such as the Myanmar International Cooperation Agency being set up by MLFRD as the implementation enterprise) will have direct engagement with donors, the Executive Secretariat should coordinate the overall financing program, helping aligning donor preferences with the responsibilities of particular agencies
Milestone 3: the Government of Myanmar commences a donor pledging process, and continue working with donors to secure the full financing package needed for the implementation of the program
Milestone 4: the Government of Myanmar formally and publically instructs the Executive Secretariat to conduct a tariff study (with appropriate technical assistance) and to conducts public consultation to improve public understanding of the costs of the electricity service and of the required tariff decisions. The new tariff should be both affordable and consistent with the Government’s fiscal constraints
Milestone 5: the Government of Myanmar appoints advisors to develop a sub-franchising mechanism and standard documentation to facilitate private sector participation in the roll-out program
Milestone 6: the Government of Myanmar makes short-term changes to the budgeting process for the YESB and the ESE to facilitate more independent commercial decision-making and to encourage and enable both to borrow on their balance sheet.
The Office of the Vice-President should hold the overall accountability for the implementation of the NEP, with each Minister being provided with clear delegations of responsibility and corresponding accountability.

1
1 Introduction
National electrification is a top priority of the Government of Myanmar (GoM). The Myanmar National Electrification Plan (NEP) aims to achieve 100 percent electrification by 2030. The scale of the electrification challenge in Myanmar is immense. Currently, the electrification rate in the country stands at a mere 28.9%.1 This means that approximately 43 million out of close to 60 million people in the county do not have access to electricity.2 To fulfill the vision of universal electrification by 2030, the number of household connections needs to increase from the current 189,000 a year to approximately 450,000 a year3 to be sustained over the next 16 years—a more than two fold rise. Given the time required for a ramp-up, we estimate that the sustained number of connections once the program reaches maturity will be even higher: in excess of 517,000 per year.
In order to achieve national electrification efficiently and effectively, the NEP needs to be backed by (i) a sound least cost roll-out plan, (ii) sufficient funding and financing to build out the network and (iii) capable and robust institutions to coordinate and direct the program.
This report presents intermediate targets and milestones to achieve universal access by 2030, which is the financing and funding requirements along with the institutional roadmap for Myanmar’s NEP for the period of 5 financial years, 1 April 2015 to 31 March 2020 (from April to March follows the cycle of the fiscal year in Myanmar). As a short-hand, we refer to this as the 5 year period from 2015 to 2019, indicating the commencement of the financial year. This initial period of the NEP is a time during which technical and institutional capability will be ramped up to create the platform for achieving the overall target by 2030. However, to ensure the sustainability of the overall program, the financial analysis is based on a 55-year financial model, which covers the period during which debt has to be repaid.
This report is structured as follows:
In Section 2 we describe the least cost roll-out plan and the financing need for the period FY2015-2019. This is the Investment Prospectus part of the report: we summarize the total amount of finance that is required for the roll-out, and consider sources
In Section 3 we explain how we derived the total connections target for the period FY2015-2019
In Section 4 we explain our analysis of the costs of roll-out, and consider the sensitivities to various assumptions
In Section 5 we consider the funding of the roll out: we confirm whether the roll-out can be funded through a combination of affordable tariffs and Government subsidies
1 MOEP Presentation by Mr. Kyaw Myat Htoo, “Framework for Power Development Plan,” 23rd September 2013
2 Castalia calculation, based on MOEP Presentation by Mr. Kyaw Myat Htoo, “Framework for Power Development Plan,” 23rd September 2013
3 Myanmar Power System Development Scheme Presentation, 2-7-2013, MEPE, and Castalia calculations, based on ESE and YESB 2012 Statistics Book

2
In Section 6 we present our conclusions about the institutional reforms required to implement the NEP
In Section 7 we consider the technical assistance needs of NEP implementation
We set out key conclusions in Section 8.
Throughout this report we draw a clear distinction between the financing and the funding of the roll out. This distinction is crucial to the analysis of financial viability of the NEP, and to understanding how the burden will be allocated between consumers, the Government of Myanmar, and development partners. In essence, financing is the money that has to be returned over time, while funding is the money that does not require return. These terms are explained fully in the box below.
Box 1.1: The Difference Between Funding (Cost Recovery) and Financing
It is important not to confuse the need for financing with the need for subsidies. Subsidies address the cost recovery problem, while financing problems may exist even if total costs are fully funded through a combination of tariffs and subsidies.
Figure 1 shows the situation of an infrastructure service provider with a need for financing. The service provider needs to make a major initial investment, such as an electricity distribution system extension. In the future, during the operational phase of the project, the service will be able to sell electricity at a tariff which recovers the full cost of service. If the present value of the cash flows during the operational phase exceeds the present value of the negative cash flow during the investment phase, the provider will have recovered the full costs of service. In this case, the project is fully funded, and providers should be able to get financing, for example by borrowing to pay for the initial investment, and repaying the debt from the positive cash flow during the operational phase.
Figure 2 shows the situation of an infrastructure service provider with a cost recovery problem. Total revenues from all sources (tariffs and subsidies) are lower than total costs, including capital costs.4 The provider whose situation is illustrated in this figure has a cost recovery problem. The project is not fully funded: that is, there is not enough income (tariffs and subsidies) being generated to cover total costs (operating and capital) for the foreseeable future. No amount of financial engineering would enable the service provider to access finance.
4 Capital costs are meant to include both the cost of capital assets being used up and needed to be replaced, usually
measured by depreciation, and the need to provide a return on capital invested, for example by making interest payments on a loan or allowing an equity investor to earn dividends.

3
Figure 1 : Financing Need
Figure 2: Cost Recovery Problem
Source: Castalia
Time
$
Financing Need
Initial Capital
Investment Phase
Operations Phase
Capital Required
Cash Inflow
Cash Outflow
Operating Cash Surplus
NB: PV of Operating Cash Surplus > PV of Capital Required
Time
$
Cost Recovery Need
Losses
Total Cost (including capital costs)
Total Income (tariffs and subsidies)

4
2 Financing for the Least-Cost Roll-out for the Period FY2015-2019
In this section we explain the approach to planning the least-cost electrification rollout for the next 5 years, and the implication of this plan for the need to raise finance. We also explain why meeting this financing need through concessional donor finance would have high development impact.
The least-cost electrification plan targets to achieve 100 percent electrification by 2030. Current estimates suggest that this will require 7,216,638 new residential connections over the next 16 years. This estimate includes projected population growth between now and 2030. Of course, the electrification program will evolve dynamically, both as more information becomes available and as on-the-ground conditions change over time.
The program will need to start with a steady ramp up from the current rate of 189,000 connections per year, to a steady state of around 517,000 connections per year. The details are further explained later in this report. The chart below describes the expected roadmap for the number of connections achieved.
If the Government of Myanmar implements this plan, Myanmar can be expected to achieve approximately 47 percent electrification by 2020, 76 percent electrification by 2025, and 100 percent by 2030. Of course, we recognize that the last 10 to 20 percent of the electrification program will be particularly difficult, both from the engineering and financial perspective. The medium term financial plan incorporates the expected funding and financing requirements for full electrification, but the focus of this report is on the funding and financing needs over the next 10 years. Future needs will become confirmed as geospatial information required for planning continues to be updated and improved.
Figure 2.1: Roadmap to 100 percent Electrification in Myanmar
Source: Castalia and EI estimates

5
2.1 Least-cost Roll-out
This Prospectus is based on the detailed geospatial planning undertaken by Earth Institute (EI) in cooperation with the Government of Myanmar. This planning work underscores the fact that this Prospectus is not a hypothetical request for funds from development partners, but rather a concrete analysis of a least-cost expansion which incorporates technical and economic aspects.
The geospatial plan identifies the best way to achieve full electrification by 2030 (with a particular focus on the next five years), based on the physical characteristics of different locations within the country. The roll-out plan is conducted at a programmatic level, and further detailed design and planning work will be completed as the program is implemented.
The EI analysis combines geospatial information (covering the location of population clusters, load centres, the existing medium voltage (MV) lines, as well as the existing and planned transmission lines) with the cost information of MV and LV grid lines, transformers, and mini-grid generation options. The technical model further incorporates population growth and electricity demand forecasts.
EI then applies a planning algorithm which identifies the least cost electrification solution for each location. This algorithm identifies which settlements would best be served through connection to the national grid, and which would be best through mini-grid and off-grid solutions (individual household level solar home systems).
For connection to the national grid, the algorithm develops an optimal connection sequence roll-out plan. Initial phases of grid construction reach areas that are closest to the existing grid, where less extension of the MV lines is needed per household. Later phases reach the next closest areas, toward rural remote communities where more MV lines are required. Overall, under a least-cost roll-out, grid connections are prioritized in areas that meet higher electricity demand with the shortest MV line extension.
The key conclusion from this geospatial modelling is that the least-cost way to extend electrification to 98 per cent of the population in Myanmar is through connection to the national grid. Approximately 98 percent of the population of the country live within 50km of an existing or planned transmission line, with 92 percent living within 25km.
The overall plan is illustrated in the figure below.

6
Figure 2.2: Recommended Electrification Solutions
Source: Earth Institute
For the national least-cost plan, the level of focus is the country as a whole. This means that in states where the cost of grid connection is relatively high, no connection may be made until the average cost of new connection in other states reaches that level. As we discuss later in the report, it is possible to change the priority accorded to each state, while preserving the least-cost sequence within each state. However, the national least-cost plan shows the greatest value for money that is possible over the next five years. For the given amount of

7
resources, it identifies the greatest number of connections that can be made. Conversely, for a given connection target, it shows the least amount of resources that would be required.
Our analysis based on EI research shows that under the national least-cost plan, during the five year period of FY2015-2019, zero new connections will be made in Kayah State, and only few will be made in the Yangon Region. In practice—given YESB’s recent performance—it is likely that Yangon Region will achieve close to 100 percent electrification during the period of FY 2015-2019.
The national least-cost rollout by state and region for the first five years is shown in the table below.
Figure 2.3: Relative Connection Contributions by Each State and Region from FY2015-2019
State/ Region Total Connections to be done in FY 2015-2019 Period by State
Year 1 Year 2 Year 3 Year 4 Year 5
2015 2016 2017 2018 2019
Ayerawady 41,808 - - 4,593 23,070 14,145
Bago 79,477 - - - 39,161 40,316
Chin 16,296 - - 13,589 2,707 -
Kachin 70,956 - 59,741 - 5,223 5,992
Kayah - - - - - -
Kayin 75,070 - 28,013 - 43,591 3,466
Magway 164,969 - 29,419 71,083 29,221 35,246
Mandalay 214,699 - 37,021 7,834 28,140 141,704
Mon 91,267 - - - 16,566 74,701
Naypitaw 14,463 - - - 1,846 12,617
Rankhine 385,693 205,000 - 71,095 38,214 71,384
Sagaing 135,701 - 32,315 2,733 3,360 97,293
Shan 169,197 - 37,648 29,206 98,728 3,615
Thaninthayri 25,025 - 24,284 401 340
Yangon 28,341 - 3,595 583 7,272 16,891
Total 1,512,962 205,000 227,752 225,000 337,500 517,710
Figure 2.4 below shows the relative contribution of each state or region in the first five years of the roll out.

8
Figure 2.4: Relative Connection Contributions by Each State and Region from FY2015-2019
The national least cost plan provides the key benchmark for the electrification roll-out. The Government of Myanmar may legitimately change the sequence of the roll-out for social, economic, or political reasons. However, while it would be appropriate for the development partners to support the financing needs of the least-cost program, the burden of additional costs incurred due to policy decisions made by the Government may more appropriately fall on the Government.
In addition to the national least-cost grid roll-out, we assume most of the areas that are slated to be electrified through off-grid solutions in the first five years. While there is no specific efficient sequence for off-grid projects, prioritizing such projects would contribute to the overall social cohesion by enabling people in remote communities to be among early beneficiaries of electrification. We also incorporate a provision for a “pre-electrification” program: an out of sequence off-grid electrification of areas that will eventually—but possibly only in the late 2020s—be connected to the grid. As we discuss later in the report, there are likely to be numerous situations where such off-grid or household solar solutions would be efficient in providing electricity to these households, prior to grid connection which will only be possible in the later phase.
2.2 The Financing Need
The purpose of this Investment Prospectus is to identify the financing that needs to be raised for the electrification targets for the 5-year period to be met. In principle, there are three possible constraints on the pace of electrification:
The existence of sufficient technical and institutional capability to implement the roll-out

9
The availability of financing
The ability and willingness to pay for electricity by the households and businesses that will be connected.
For the purposes of estimating the financing need for the five year period, we start with the assumption that the binding constraint over the period is the limited technical and institutional capability. In other words, we assume that sufficient financing will be found to under-write the maximum technically possible number of connections. We then separately confirm that it is viable to fund the additional electrification fully through a combination of concessional financing, affordable tariffs, and government subsidies.
To achieve 100 percent electrification by 2030, approximately 7.2 million currently un-served households will need to be connected over the 16 year period. From the technical and institutional point of view, we estimate that it will be feasible to connect approximately 1.7 million households in the five year period from FY2015 to 2019. By 2020, the annual capacity to make connections will be ramped up to the level that would enable the remaining un-served households to be connected over the following 10 years.
We use the geospatial planning results provided by EI to derive the technical solution for each household, (i.e. on-grid or off-grid, and the type of off-grid solution), and the cost of that solution.
The costs of an electrification roll-out include gross capital expenditures of the program, as well as operating costs. The capital invested in the roll-out—the poles, wires, transformers, and generation units—will have long asset lives. Since such assets provide services over a period of time, it is efficient to finance their cost, so that payment (paying both for the return on, and of capital) is spread over the expected economic life. By contrast, operating costs incurred in any year should usually be covered by revenues and subsidies provided in that year. Spreading the cost of capital assets over time through financing ensures that todays and future users share the burden fairly. By contrast, financing to cover the costs of recurrent operating costs defers the burden to future users.
For this reason, we assume that in order to connect approximately 1.7 million households over the next five years, financing will be needed to cover the program’s gross capital expenditures.
Overall, we estimate that approximately $819.2 million of financing will be required over 5 years. We note that this financing need relates only to the electrification distribution roll-out, which includes MV and LV distribution networks, mini-grids, and household electrification. Further financing will be required for generation and transmission investment programs.
The table below shows the annual financing need over the next five years.
Table 2.1: Annual Capital Expenditure (Capex) by Connection Type (US$ Million)
2015 2016 2017 2018 2019
Grid Capex $72.5 $80.6 $79.8 $139.9 $232.2
Planned Mini-grid Capex $0.6 $0.6 $0.6 $0.6 $0.6
Pre-electrification Capex $16.2 $22.6 $32.3 $45.1 $58.2
Off-grid Capex $2.2 $2.2 $2.2 $3.2 $3.2
Total Capex $91.5 $106.0 $114.9 $188.8 $294.2
10
Note: Includes 10% capex contingency, and that there is no capital replacement for pre-electrification connections
2.3 Development Rationale for Donor Financing
The NEP is being implemented at the same time as Myanmar’s economy is undergoing general transformation. The Institutional Plan for the implementation of the roll-out envisages a growing role for the private sector, including reliance on private finance through a mix of equity and commercial borrowing. However, in the immediate future, access to appropriate finance is severely constrained:
The Myanmar banking system is poorly developed. No banks in Myanmar offer loans for periods of more than 2 to 3 years, and re-financing of existing debt is extremely difficult. We understand that Village Electrification Committees (VECs) often are only able to borrow for 3 to 6 months to spread the cost of connecting ones village if needed. Hence, any finance that could be obtained from the Myanmar banking system would require rapid amortization through tariffs or subsidies
The Myanmar banking system has little experience of project financing infrastructure developments. Hence, there would likely be delays in securing the necessary credit, at whatever cost and tenor
The Myanmar banking system is unlikely to be able to accommodate overall credit demand of over $100 million per year from the sector
While international commercial lenders may be willing to finance electricity generation IPPs in Myanmar, it is unlikely that such lenders would be able to provide systematic and reliable support to the distribution roll out without significant structural reforms, such as full corporatization of YESB and ESE, and the introduction of an independent electricity regulator. Again, such reforms would take time and delay the implementation of the electrification roll-out
Finally, the cost of commercial finance is initially likely to be substantially higher than the cost of finance provided by development partners. Myanmar is still seen as a high risk investment destination. Over time, the risk premium of lending to Myanmar businesses will decline.
We conclude that without substantial support from the development partners, the objective of achieving close to 1.7 million connections in the next 5 years would not be met: it would be unrealistic to expect to raise the required $645.5 million over the period from commercial sources, and even if this amount could be financed, the burden on the consumers and the Government of Myanmar of servicing such debt at commercial rates and tenors would not be sustainable. For example, we estimate that electricity tariffs would need to rise from the current weighted average of $0.064, to $0.27/kWh. The top range of the tariff increase is particularly influenced by the short term loan repayments which are currently prevalent in Myanmar. We are not aware of any commercial or state banks in Myanmar offering loans of more than 5 years for commercial projects. Our interviews with Village Electrification Committees indicate that if there were some sort of financing has been available for electrification projects, it ranged within less than year up to three years.

11
In effect, to keep tariffs affordable and to achieve the 100 percent access without access to concessional finance, the Government would have to substantially increase its current funding commitment to the sector. This does not appear possible, given the existing fiscal constraints. Even if it were possible, such fiscal commitment would undermine the Government’s other national development objectives, deter private sector participation in the sector, and likely lead to less efficient implementation.
Given the existing financing constraints, meeting the financing need through concessional donor finance will make a significant development contribution:
It will reliably enable Myanmar to achieve the targeted 1.7 million connections in the next 5 years. Not only will this make a significant contribution to the country’s development by giving those households access to electricity, it will underwrite the ramp-up in both technical and institutional capability required to achieve full electrification by 2013
It will ensure that the burden on Myanmar consumers and on the Government of Myanmar is consistent with their ability to pay. In the absence of donor financing, tariffs may rise to unaffordable levels. The long tenor of the concessional finance makes sure that the future users of electricity—who can expect to be substantially better off than the current users—pick up a fair share of the burden
It will support the roll-out program over the period of economic reforms. Over time, as Myanmar’s economy becomes more integrated with the global financial system, and as the local banking system matures, commercial finance will increasingly become available which can replace concessional finance without a material shock to tariffs.

12
3 Target Number of Connections
EI’s assessment of the total number of connections required to electrify Myanmar’s entire population by 2030 is summarized in Table 3.1 below:
Table 3.1: Total Target Connections by State and Type over the Entire Program
No State/Region Total Grid Connections
Total Mini-grid Connections
Total Off-grid Connections
Total Connections
1 Ayerawady 1,092,296 32 9 1,092,337
2 Bago 686,085 160 - 686,245
3 Chin 119,524 701 1,114 121,339
4 Kachin 115,467 703 425 116,595
5 Kayah 26,952 224 21 27,197
6 Kayin 379,450 287 26 379,763
7 Magway 788,685 203 72 788,960
8 Mandalay 723,874 22 38 723,934
9 Mon 256,452 1,221 21 257,694
10 Naypitaw 98,221 - - 98,221
11 Rankhine 969,539 725 151 970,415
12 Sagaing 908,747 1,366 275 910,388
13 Shan 505,394 2,625 2,241 510,260
14 Thaninthayri 322,853 2,611 75 325,539
15 Yangon 207,752 - 8 207,760
Total 7,201,291 10,880 4,476 7,216,647
Source: EI
We estimate that over the next five years (FY2015-2019), it will be technically feasible to implement close to 1.7 million additional connections, or 12.3 percent of the total connections expected under the roll-out program. By contrast, the total capital expenditure during that period will be only 4 percent of the expected total cost of the entire roll-out program, since the easiest and cheapest connections will be made first.
3.1 Grid Connections Ramp Up
Our analysis of the capability constraints suggests a ramp up profile for grid connections shown in Table 3.2 below. This was developed (i) using historical data for new annual connections from the two distribution utilities—Electricity Supply Enterprise (ESE) and Yangon Electricity Supply Board (YESB), (ii) conducting interviews with ESE/YESB engineers and management, as well as village electrification committees to assess physical and institutional capacity, (iii) benchmarking ramp up rates from similar developing countries.
Overall, we understand that both the private and public sectors in Myanmar are likely to be short of approximately 1,000 trained electrical workers required for the implementation of the roll-out. We estimate that it will take up to two years to train the required personnel, with on-going commitment to training in the future.

13
Table 3.2 below provides the estimated annual grid connections ramp up between 2015 to 2019.
Table 3.2: Ramp Up in Annual Grid Connections (2015- 2019)
New Total Connections Required
2012 Year 1 Year 2 Year 3 Year 4 Year 5
Actual 2015 2016 2017 2018 2019
ESE 6,993,539 59,000 75,000 150,000 225,000 337,500 517,170
YESB 207,752 130,000 130,000 77,752 0 0 0
Total 205,000 227,752 225,000 337,500 517,170
The specific assumptions around this ramp up as are follows:
YESB continues to connect households at its current rate, until all of Yangon is connected. This takes only two years, since 78% of Yangon is already electrified.
ESE increases connections by 20% in the first year, as service providers (such as private contractors) respond to an increased volume of work by being more productive with existing resources. Resources include adequately skilled labor as well as physical resources (materials, equipment and so forth)
Connections on the ESE franchise area double in the second year through additional resources recruited by ESE and through greater reliance on the private sector, plus some reallocation from freed up YESB resources
Connections on the ESE franchise area increase by approximately 50% in years three and four through additional resources and growth in the private sector, including completion of training by approximately 1,000 additional electricians
Year five is the first “steady state” year. From this point on the same number of connections are made to end of the roll out.
YESB and ESE currently perform a limited range of work themselves: a substantial proportion of MV/LV line installation and household connections is currently performed by private contractors. At present, such private providers may be contracted by YESB and ESE themselves, or by Village Electrification Committees (VECs). However, the capacity of the private sector is also constrained due to limited level of activity in this sector until now. As the volume of contracting increases, both the public and the private sectors will develop new capabilities. On the public side, the increase in the volume of contracting will require further enhanced procurement capability. In recent years, capex by ESE amounted to about $20 million to $40 million per year, while the capex by YESB has been between $15 million and $30 million. This total capex of between $35 million and $70 million a year will need to rise consistently to reach over $230 million within 5 years.
3.2 Permanent Mini-grid and Off-grid Connections Ramp Up
EI’s geospatial analysis indicates that only a very small proportion of households can expect to be permanently served by mini-grid and off-grid solutions: fewer than 11,000 households will be served by mini-grids, and fewer than 5,000 will be served by household solutions. For the purposes of this Investment Prospectus, we assume that all of these households will be connected during the next five years.

14
In practice, since many of these households are extremely isolated and poor, it is difficult to predict exactly when they will become served. However, we think it is reasonable to assume that their basic needs can be addressed fairly quickly:
Mini-grid and off-grid connections make up a small part of the overall electrification program—0.15% and 0.06% of total connections respectively. With a concerted effort, they can be completed quickly
EI’s results have shown that there is no clear way to rank mini-grid and off-grid connections in least cost order, since they cost nearly the same per connection across the country
Our fieldwork has revealed that mini-grid and off-grid connections are proceeding rapidly across the country, so the envisaged five year time period to make all mini-grid and off-grid connections by the least cost plan is reasonable.
Overall, we would like to emphasize that the number of permanent non-grid connections in question is so small, that the timing makes almost no difference to the financing need (although clearly, a lot of difference to those households).
3.3 Pre-electrification Connections Ramp Up
We assume that out of a total of 7.21 million households that will be connected to the grid, some proportion will be in areas where a temporary mini-grid or other “pre-electrification” such as a household solar solution may be viable. Since the grid roll-out may not reach these areas for 10 or more years, it is implausible to expect that residents and businesses in some of them will not find alternative solutions in the meantime. In due course, these pre-electrified areas will be connected to the grid.
Assuming the least-cost grid rollout is on target and finished by 2030, the net benefits from pre-electrification are greatest—and pre-electrification is most commercially viable—during the first five years. This is because it will allow capital costs of setting up a diesel mini-grid or diesel-solar hybrid systems to be largely amortized, before the grid arrives. This is based on EI’s assumption that diesel generators (main additional cost of diesel and diesel-hybrid solutions) have to be replaced after 10 years. In other cases, existing local renewable energy sources will enable pre-electrification, which will remain as a viable source of generation even after grid connection in the later phase. Finally, household solar solutions may also be available prior to the grid arriving in an area.
Overall, it appears that the opportunity for commercially viable pre-electrification may exist in areas that serve around 250,000 households over the entire period, and around 100,000 of these could be done in the first five years. Although it is difficult to accurately predict the extent of local initiative, the financing availability, the institutional support, or the availability of local renewable energy sources that will spur pre-electrification connections, we assume a gradual ramp up in such connections over the next five years.
For the purposes of this Prospectus, we draw on the analysis of pre-electrification options prepared by EI and include a broad estimate of possible financing required to provide a reasonable level of support for pre-electrification.
In the base case we have assumed majority of the pre-electrification solutions will use solar or solar-diesel hybrid solutions, with lower performance levels than the permanent solutions. However, another option would be to assume nearly all pre-electrification connections

15
would be diesel based. The choice of technology affects the capex and opex profile. Diesel systems have overall lower capex requirements but higher opex requirements than solar or diesel-solar hybrid systems. For example the capex for the same number of diesel-based pre-electrification connections in the first five years would have been about US$149 million less, However, in present value terms the total costs regardless of the technology are roughly the same, and therefore do not have an impact on the funding gap. In reality it is likely that pre-electrification solutions will lie somewhere in between the two scenarios described. The Government and donors will tend towards sponsoring solar hybrids and other renewables, while private operators will prefer diesel systems.
While it is challenging to predict exactly which households across Myanmar will be covered by pre-electrification, EI identified states that will be connected towards the end of the program (due to high connection costs), and are therefore more likely to pre-electrify. These states include Chin, Shan, Kachin and Kayah. However for financial modeling purposes, the location of these pre-electrification connections is largely irrelevant.

16
4 Costs of the Roll-out
We have developed a 55-year financial model to estimate the annualized costs of the electrification roll-out. This model allows us to estimate the revenue requirement of Myanmar’s electricity system, as well as consider the implications of different tariff levels for the requirement for Government subsidy.
To understand the financial viability of the roll-out, we model the distribution roll-out as a stand-alone “business” over a period from 2015 to 2070—that is, the period during which all loans will be fully amortized. This allows us to examine the effects of different tariff assumptions on:
The extent to which newly connected households will fund the services they will receive
The extent to which the existing electricity consumers will contribute to the funding of the electrification roll-out
The level of government subsidy required.
A further benefit of looking at the “new” and “old” distribution systems as separate businesses is that it allows us to pinpoint the incidence of subsidy. This is important since many components of the roll-out will actually be implemented by stand-alone businesses (such as private mini-grids or private concessionaires of distribution sub-franchises), and each one of them will need to be financially viable.
Our financial model for the ‘new” distribution system combines three cost areas:
Distribution capex and opex—The capital and operating costs of the distribution infrastructure needed for the rollout as well as the capital and operating costs of generation in areas identified as more suitable for mini-grids. This analysis is derived from work of EI.
Return on and return of capital—This is the cost of finance, and the tenor of such finance.
For the purpose of this analysis, we assume that all the capex for the rollout program is financed with concessional loans. The assumed loan terms, modeled along IDA lines, are given in Table 4.1 below:
Table 4.1: Assumed Loan Terms for Donor Finance
Interest Rate 1.25 percent Annual
Grace Period 5 years No principal payments due for first five years. Interest is payable from year 1.
Term of Loan 25 years From year of drawdown
Start year Project year when financing is disbursed for capex required in that year
Additional infrastructure costs–The capital and operating costs of additional infrastructure needed to support the rollout. This includes:

17
– New build generation to provide the energy to additional customers. At present, the Government of Myanmar, with support from its development partners, is undertaking a review of its generation plan, and developing a least-cost generation plan. Pending the preparation of this plan, we have assumed that all new generation is prices at its Long-Run Marginal Cost (LRMC), i.e. a price per kWh which fully covers the return on and return of capital, as well as operating costs, of new generation under reasonable load factor assumptions
– New build transmission lines to supply the expanded distribution system. Again, since we do not have sufficient information on the timing of the transmission projects, we estimate the cost of transmission on the LRMC basis
– New build distribution lines—mainly 33 kilo volt (kV) lines to support the expanded distribution system.
For the “old” distribution system, we model:
Existing infrastructure costs–This is in two parts:
– The current annualized cash costs of the existing generation, transmission and distribution infrastructure. We assume that the GoM will not seek to earn a return on capital from the capital already sunk into the system (although since the cash costs include payments to Independent Power Producers (IPP), and since IPPs have to earn return on and of capital, not all value of sunk capital is ignored)
– The maintenance and refurbishment capital to replace the existing infrastructure as it reaches the end of its economic life, as well as any additional expenditure to improve current reliability levels
New build generation—This is the cost of additional generation required to meet the growing demand from existing customers. Again, we model this on the LRMC basis.
The analysis of the above cost components allows us to calculate the total annual revenue required to cover all cash expenses of the roll-out for each year—that is all operating expenses, plus all interest on loans in addition to any amortization of loans. These annual amounts will depend on the rate at which new connections are made, as well as on the terms of finance that is available for the roll-out.
We discuss the sensitivities of costs to various assumptions in Section 4.4. One of the key sensitivities is the cost of finance: the concessional rate of 1.25 percent is unlikely to be available for the entire roll-out program. In our model, we have built-in a contingency for an increase in the cost of finance. Overall, it is reasonable to expect that over time the cost of finance would increase, but the actual costs of the roll-out and system operations would decline as the economy of scale is realized and as a greater role emerges for the private sector.
Our model is set out in constant real US dollars. In other words, it does not consider the effects of inflation. Such effects need to be added to any calculations of future tariffs in kyats. For example, if a tariff were to remain constant in real US dollar terms, it would in fact need to increase by about 5 percent per annum in kyats, given the recent inflation trends.

18
The system average tariff required to cover all costs over the 40-year period is a unit cost estimate of the overall electrification program. We estimate that the average real cost of electrification in Myanmar over the period is $0.084 (8.4 cents) per kWh.
Below we present our estimates of the capital costs (capex) and the operating costs (opex) of the entire program.
4.1 Capital Costs
The capital cost components associated with grid-based electrification are shown in the figure below:
Table 4.2: Capital Costs for Grid Electrification (US$ Million)
National Least Cost
2015 2016 2017 2018 2019
LV lines $20.5 $22.8 $22.5 $33.8 $51.7
Service drop, meter etc $41.0 $45.6 $45.0 $67.5 $103.4
Transformer $4.4 $4.9 $4.9 $9.4 $14.7
MV lines $0.0 $0.0 $0.1 $16.6 $41.3
Capex replacement cost* $0.0 $0.0 $0.0 $0.0 $0.0
Contingency Cost (10% of capex) $6.6 $7.3 $7.3 $12.7 $21.1
Total $72.5 $80.6 $79.8 $139.9 $232.2
*Since all the grid-based capital assets have lifetimes of longer than five years, no capital replacement is necessary in the first five years of the program
Our capex estimates are based on current costs for the required inputs observed in Myanmar. However, we have added a contingency provision on the expectation, assuming that initial ramp-up may involve less than optimal procurement and learning. We expect that unit costs should decline over time as the benefits of scale are realized.
For the mini-grid and off-grid connections, we anticipate that there will be a ramp up over time. However, since this makes almost no difference to financial modeling, for ease of analysis we have assumed that an equal number of connections are made each year. This assumption allows us to see the scale of each component more clearly.
The components of capital costs for permanent mini-grids, pre-electrification (assuming majority solar and solar hybrid systems), and off-grid are shown in the table below:

19
Table 4.3: Mini-grid, Pre-electrification and Off-grid Capex (US$ Million)
Mini Grid 2015-2019
LV lines $1.0
Diesel Generator $1.4 Generator Installation Cost $0.4
CapEX replacement cost $0.0
Contingency Cost $0.2
Total cost as part of roll out $3.0
Household Solar 2015-2019
Solar Panel $4.5
Solar Battery $5.1
Solar Balance of System $2.3
Capex Replacement Cost* $0.0
Contingency Cost (10% of capex) $1.1
Total cost as part of roll out $13.0
Pre-electrification (base case) 2015-2019
Capex (mini-grid and off grid)* $156.96
Capex replacement cost $0.0
Contingency Cost $17.44
Total additional pre-electrification $174.4
*Note that actual pre-electrification capex will depend on the decisions about technology choice The total capex of the roll-out program to 2030 is estimated at $5.8 billion. We estimate the present value of the program at $1.8 billion. Present value estimates are used to assess the funding gap and the relative contribution of different stakeholders to the sector-wide cash flows.
4.2 Operating Costs
The present value of operating costs (opex) of the whole program, broken up by grid, mini-grid, and off-grid is estimated at around $2.9 billion5. The opex includes generation and transmission costs. For diesel mini-grids, we estimate the variable cost of generation. For the grid, we assume that additional transmission and generation enter at their Long-Run Marginal Cost (LRMC).
In other words, in present value terms, more than 62% of the roll-out program is due to operating costs—particularly the purchase of energy—and only 38% is due to the
5 Note once again that the exact annual operating costs will depend on the choice of pre-electrification technology. But the
total effect will be negligible since the pre-electrification program is very small compared to the required grid based expansion.

20
distribution system capex. This underscores the importance of ensuring that the least cost generation plan is implemented alongside the least-cost distribution roll-out plan.
The table below shows costs per MWh of various components of service. It illustrates the effect of blending in additional generation at LRMC of $92.35 per MWh to the existing generation with an average cash cost of $52.41.
Table 4.4: Cost per MWh (Grid based Connections)
System Cost
Components
Year 1 Year 2 Year 3 Year 4 Year 5 Year 6
2015 2016 2017 2018 2019 2020
Existing
Generation $52.41 $52.41 $52.41 $52.41 $52.41 $52.41
Distribution $17.99 $17.99 $17.99 $17.99 $17.99 $17.99
Transmission6 $2.85 $2.85 $2.85 $2.85 $2.85 $2.85
Growth in Existing Network
Generation $92.35 $92.35 $92.35 $92.35 $92.35 $92.35
Distribution $17.99 $17.99 $17.99 $17.99 $17.99 $17.99
Transmission $2.85 $2.85 $2.85 $2.85 $2.85 $2.85
Grid Roll Out
Generation $92.35 $92.35 $92.35 $92.35 $92.35 $92.35
Distribution $22.97 $18.83 $15.84 $14.32 $13.49 $22.97
Transmission $15.33 $15.33 $15.33 $15.33 $15.33 $15.33
4.3 Demand Assumptions
We assume that demand by households newly connected to the grid or a mini-grid follows an “S-curve”. We assume that demand (and consumption) is350kWh/year—a minimum level associated with minimum use of appliances, in the first year of being connected. For each connection, we assume this grows to 1000kWh/year over five years. After five years of being connected, we assume that demand by existing customers grows by 3% per annum.
The growth in electricity demand per connection over time is shown in Table 4.5 below:
Table 4.5: Annual Electricity Demand per Grid and Mini-Grid Connection (2015-2030)
6 Includes a $2/MWh additional cost to improve the reliability of the existing Transmission system

21
The overall demand for grid and mini-grid connections is calculated from a combination of growth in connections and growth in demand from each connection over time.
An estimate of demand is an important determinant for the estimate of opex, as it determines the units of energy that must be paid for.
4.4 Key Sensitivies
The key sensitivity for costs arises out of the decisions made about different priorities for the distribution roll-out.
As our base case, we use the national least-cost roll-out. As the name suggests, this assumes that the cheapest connections wherever they happen to be in the country, are made first. As we explained previously, this pattern of grid roll-out delivers the biggest “bang for the buck” over the five year period: it identifies the least amount of financing required to connect approximately 1.7 million households.
We are conscious, however, that the Government’s priorities may be driven by considerations other than the cost of connection. In some cases, because of social or economic reasons, it may be desirable to prioritize connections in parts of the country where it costs more per household to connect. To test the effects of such decisions on the financing need, we develop two further connection scenarios.
We would like to emphasize that all scenarios assume least-cost progression at the local level. In other words, the pattern of connection always follows proximity to the existing medium voltage (MV) line, with the MV line extensions built once the nearest households are connected.
4.4.1 Proportional Connections Roll-out Scenario
In the Proportional connections scenario, states and regions contribute proportionally to the total number of connections that need to be made each year. For example Ayerawady, with 1.09 million total connections to be made over the 16 year roll out period will contribute 11,700 in year one, whereas Kayah with only 27,000 connections to be made will contribute 290. This scenario thus favors states and regions with the largest total number of

22
connections to be made. From a policy perspective, this scenario could be rationalized as focusing resources on the states and regions with the largest electrification challenge in terms of households left to be connected.
Table 4.6: Proportional Connections Roll-out (FY2015-2019)
State/ Region
Proportional Contribution to Nation-wide conns.
Year 1 Year 2 Year 3 Year 4 Year 5
2015 2016 2017 2018 2019
Ayerawady 15.6% 11,714 23,428 35,142 52,713 88,118
Bago 9.8% 7,358 14,715 22,073 33,110 55,348
Chin 1.7% 1,282 2,564 3,845 5,768 9,642
Kachin 1.7% 1,238 2,477 3,715 5,572 9,315
Kayah 0.4% 289 578 867 1,301 2,174
Kayin 5.4% 4,069 8,139 12,208 18,312 30,611
Magway 11.3% 8,458 16,916 25,374 38,061 63,625
Mandalay 10.4% 7,763 15,526 23,289 34,933 58,397
Mon 3.7% 2,750 5,500 8,251 12,376 20,689
Naypitaw 1.4% 1,053 2,107 3,160 4,740 7,924
Rankhine 13.9% 10,398 20,795 31,193 46,789 78,215
Sagaing 13.0% 9,746 19,491 29,237 43,855 73,311
Shan 7.2% 5,420 10,840 16,260 24,390 40,771
Thaninthayri 4.6% 3,462 6,925 10,387 15,581 26,045
This scenario increases the total cost of MV connections over 5 years by $136.6 million. In other words, the total financing need under this scenario increases over the period from $645.5 million, to $785.1 million. This additional capex would need to be funded by the Government of Myanmar as a result of its policy decisions.
4.4.2 Targeted Connections Roll-out Scenario
The targeted connections scenario favors the states and regions that have the lowest existing electrification rates. The assumed focus of the first five years is to bring them to the national average. We have developed this scenario using existing electrification rates from MOEP, shown in Table 4.7 below. We use existing electrification rates to calculate how many total connections need to be made over the five year period, and then allow the states and regions to contribute proportionally in the period after 2019.
Table 4.7: Current Electrification Rates and National Average
State/Region Current Electrification Rate Total Connections to be done in FY2015-2019 Period by State
Ayerawady 9% 297,006
Bago 22% 97,362
Chin 15% 25,328

23
Kachin 23% 15,231
Kayah 37% -
Kayin 13% 87,998
Magway 16% 159,243
Mandalay 31% 37,576
Mon 29% 18,441
Naypitaw 57% -
Rankhine 6% 292,714
Sagaing 19% 156,223
Shan 21% 76,774
Thaninthayri 9% 87,787
National Average excluding Yangon
36.1%
Yangon 78%
Source: MOEP 2011 (Sourced from: Pg 37, Phone Myint, Electricity Distribution Development in Myanmar from 1998-2011, February 2012, YESB)
As seen above, Kayah and Naypitaw are assumed to receive no new connections during the period because they already exceed the national average. This scenario increases the total cost of MV connections over 5 years by $89.2 million. In other words, the total financing need under this scenario increases from $645.5 million to $737.7 million over the period. This additional capex would need to be funded by the Government of Myanmar as a result of its policy decisions.
4.4.3 Sensitivity to Generation Cost
For the purposes of this study, we did not conduct a detailed investigation of generation options and costs in Myanmar. Technical assistance to analyze least-cost generation was under way concurrently with this study. Pending the results of that analysis, we needed to come up with a practical way to calculate the average long run marginal cost (LRMC) of generation for new demand growth. We did this by using international and Myanmar specific information on the costs of different generation technologies, and identifying a likely generation mix to calculate the blended cost.
Different generation technologies play different roles in meeting the total demand as it varies both during a typical day and seasonally:
Peaking generation—typically open cycle gas turbines or diesel plants which have low construction costs and thus low fixed costs, but high fuel costs. This is the most economical technology to supply peak demand: load that only occurs for a few hours in the day is best served through technology with low fixed costs and high variable costs
Base load generation—typically hydro or coal-fired plants that have much higher capital costs but much lower fuels costs. Technologies with high fixed costs and low variable costs the most economical technology to supply load that is constant for most of the day.

24
There are also mid merit order plants that sit between peak and base load generation. In each case, the plant needs to be optimized to its expected capacity factor. The capacity factor is the proportion of time during which each plant will be utilized.
Our analysis starts by estimating the fixed (capital) and variable (largely fuel) costs of three generation options:
Peak: Open Cycle Gas Turbine (OCGT)
Mid merit: Combined Cycle Gas Turbine (CCGT); and
Base load: Hydro.
We then calculated the total annual cost for each technology of generation at various capacity factors. We show the results in Figure 4.1.
Figure 4.1: Annual Generation Costs and Load Factors
For example at capacity factors below 21%, OCGT has lower levelized costs than CCGT. Similarly with capacity factors above 56%, Hydro will have a lower levilized cost of generation than CCGT.
Next, we applied these capacity factors to an estimated load duration curve—that is the demand in each hour of the year sorted from highest demand to lowest demand. We developed a hypothetical load duration curve using the data from Myanmar and from similar electricity systems (given the current energy shortages, the existing load duration curve in Myanmar may be misleading). We show the hypothetical load duration curve and the resulting generation mix in Figure 4.2.
0% 10% 20% 30% 40% 50% 60% 70% 80% 90%
A
n
n
u
a
l
C
o
s
t
Capacity Factor
OCGT
CCGT
Hydro
Hydro is lower annual cost than CCGT at capacity factors above 56%CCGT is lower annual cost
than OCGT at capacity factors above 21%
Hydro is lower annual cost than CCGT at capacity factors above 56%CCGT is lower annual cost
than OCGT at capacity factors above 21%
Hydro is lower annual cost than CCGT at capacity factors above 56%CCGT is lower annual cost
than OCGT at capacity factors above 21%
Hydro is lower annual cost than CCGT at capacity factors above 56%CCGT is lower annual cost
than OCGT at capacity factors above 21%

25
Figure 4.2: Annual Generation Costs and Load Factors
This shows that hydro plants would generate almost 100 percent of the time, meet 56 percent of the total demand, and would provide 62 percent of energy (the area of the blue shaded region). From the curve we also estimated the percentage of energy each generation type would likely meet. We detail this in Table 4.8 below.
Table 4.8: Hypothetical Least-cost Generation Mix
Generation Load Factor Levilised Cost $/MWh
% of Energy
OCGT 21% $133.94 6%
CCGT 23% $91.89 32%
Large Hydro 100% $59.84 62%
Average 72% $74.41 100%
After transmission losses (6.1 percent) and distribution losses (averaging about 17.5 percent), the LRMC of generation per MWh of demand delivered to customers averages $92.35. This is in line with the JICA “National Electricity Master Plan” in which generation costs across three scenarios (prior to transmission and distribution losses) range from $69.50/MWh to $72.20/MWh with a recommended scenario cost of $71.80/MWh.7
7 “The Project for Formulation on the National Electricity Master Plan in the Republic of The Union Of Myanmar -
Draft Final Report”, July 2014, Japan International Cooperation Agency
0%
20%
40%
60%
80%
100%
120%
0% 10% 20% 30% 40% 50% 60% 70% 80% 90%
P
e
a
k
D
e
m
a
n
d
Hours in the Year
Hydro Generation
CCGT Generation
OCGT Generation

26
Our simple least-cost generation model is sensitive to gas price and construction costs for large hydro. We tested the following sensitivities:
A plus or minus $3/MMbtu change in the gas price. Our default estimate was $10/MMbtu
A plus or minus 15% change in the capital cost of large scale hydro generation
Combining the effects of both the change in gas price and cost of hydro generation.
The table below shows the average cost of generation under different assumptions and the effects on the required average tariff growth rate under the reference scenario.
Table 4.9: Least Cost Dispatch from our Analysis of Levelized Costs of Generation
Generation % of Energy
LRMC Average Delivered Cost of Generation
$/MWh
Average Long Term Tariff Growth Rate
Default OCGT (6%)
CCGT (32%)
Hydro (62%) $92.35 3.18%
Plus $3/MMBtu in Gas Cost OCGT (4%)
CCGT (19%)
Hydro (77%)
$93.31 3.20%
Minus $3/MMBtu in Gas Cost OCGT (10%)
CCGT (56%)
Hydro (34%)
$83.70 3.01%
Plus 15% in the cost of Hydro OCGT (6%)
CCGT (46%)
Hydro (48%)
$100.35 3.33%
Minus 15% in the cost of Hydro
OCGT (6%)
CCGT (18%)
Hydro (76%)
$80.0 2.93%
Plus $3/MMBtu in Gas Price & 15% in the cost of Hydro
OCGT (4%)
CCGT (30%)
Hydro (66%)
$106.62 3.45%
Minus $3/MMBtu in Gas Price & 15% in the cost of Hydro
OCGT (10%)
CCGT (34%)
Hydro (56%)
$77.85 2.89%
Changing the cost of hydro has a proportionately larger effect than changing the cost of gas, since hydro provides the highest share of energy. There is little effect from rising gas prices as hydro can provide a greater portion of the energy demand with very little change in its levelized cost. It is useful to note that coal could be considered as an alternative to large hydro. Coal is essentially the same cost as hydro at high load factors. We would therefore expect that should hydro cost increase substantially relative to coal, then coal will likely provide a cheaper substitute. Hence, generation costs would be unlikely to deviate substantially from our default generation cost estimates.

27
For the purposes of the geospatial rollout modelling carried out by the Earth Institute, Castalia provided an all-inclusive LRMC of $130/MWh covering the costs of generation, transmission and distribution. This was used to evaluate the least cost solution between grid and off grid solutions on a whole of life costing basis. This in line with the JICA’s now completed “National Electricity Master Plan” in which the equivalent costs across three scenarios range from $124/MWh to $128/MWh with a recommended scenario of $126/MWh.8
8 “The Project for Formulation on the National Electricity Master Plan in the Republic of The Union Of Myanmar -
Draft Final Report”, July 2014, Japan International Cooperation Agency

28
5 Funding (Cost Recovery)
In this section, we consider if the roll-out is financially viable by examining whether all costs—including debt service (annual interest and principal repayment)—can be fully funded through a combination of consumer tariffs and Government subsidies.
For any level of tariff, the Government will need to decide whether the overall funding gap between the cost of achieving its electrification objectives and the revenue from the current tariffs is fiscally sustainable. The funding gap will be reduced if tariffs are increased.
However, the electricity rollout will not succeed if tariffs are unaffordable to the population and are not competitive for businesses. Assessing affordability is complex and would best be done through a detailed “willingness to pay” survey as well as a detailed survey of household expenditure patterns on electricity substitutes in non-electrified households. Further, even when informed by such surveys, policy makers, and governments are required to make difficult judgments about balancing different needs and objectives.
This report does not recommend any level of tariff. However, it highlights the relationship between tariff choices and the fiscal burden on the Government of Myanmar, as measured by the funding gap. We also show some international comparisons to provide a broad basis for making choices between tariff levels and funding gap (subsidy) levels.
The figure below summarizes the relationship between tariff levels and the funding gap. At one extreme, we show the current tariff of Myanmar. For this chart, we assume that this tariff is held constant in real terms—in other words, that the nominal tariff is adjusted each year in line with inflation. This tariff produces the highest funding gap, with the present value of $2.17 billion. This is greater than the total present value of the capex required for the roll-out program to achieve 100% electrification. This is because the current tariff—while it is sufficient to cover costs in the short term—will not cover the operating costs of the new or the old systems in the long run.
At the other extreme, we show the average tariff that would fully cover the system unit costs over the next 40 years. Given the existing structure of tariffs, this would require the weighted average tariff of $0.084 per kWh, or an average weighted residential tariff of approximately $0.05 per kWh.
We note that the Government’s current strategy is to adjust the tariff to ensure that the revenues on the existing system cover all cash costs. Even if no roll-out happens, the cash costs of the existing system will grow as the already connected customers increase their demand, and new generation has to be added at LRMC to meet that demand. We estimate the average tariff that would be required to keep the current system cash neutral at $0.076 per kWh. This translates into a weighted average residential tariff of $0.043. In other words, the weighted average residential tariff would need to increase from $0.037 to $0.043—a real rise of 17% on average over the period—to maintain the “old” system on the cash neutral basis. We show this point along the curve.
As an illustration, we also show an approximate funding gap that would result if the current tariffs prevalent in Vietnam were used. Vietnam has similar per capita GDP to Myanmar, but has a substantially higher electrification ratio.

29
Figure 5.1: Funding Gap Sensitivity to Tariff Levels
Note: Points on the horizontal axis represent the weighted average residential tariff
5.1 International Tariff Comparisons
We look at the level of prices actually paid by residential and business customers in neighboring countries with similar levels of income to Myanmar. We show the results for residential customers in Figure 5.2, and that of business customers in Figure 5.3. We only show the rates for the first block of consumption, both for residential and business customers.
$-
$0.500
$1.000
$1.500
$2.000
$2.500
$0.037 $0.038 $0.040 $0.041 $0.042 $0.043 $0.045 $0.046 $0.047 $0.049
Fun
din
g G
ap $
bill
ion
Average Residential Tariff $/kwh
Myanmar current tariff
Vietnam
Existing system cash neutral tariff

30
Figure 5.2: GDP Per Capita and Residential Electricity Prices
Source: GDP per capita World Bank, 2012, Residential electricity prices at up to 1200 kWh per year from Survey of Investment Related Costs in Asia and Oceania, May 2013, Overseas Research Department Japan External Trade Organization (JETRO)
Figure 5.3: Business electricity prices: 2013 comparison
Source: Business electricity prices at up to 6000 kWh per year from Survey of Investment Related Costs in Asia and Oceania, May 2013, Overseas Research Department Japan External Trade Organization
Note: the business electricity tariff for Myanmar is shown for the level effective from 1 April 2014.
The figure above shows that neighboring countries with similar GDP per capita, such as Lao PDR, Vietnam, and Cambodia, have higher prices for residential customers, and countries such as Vietnam, Pakistan, and Cambodia have higher prices for business customers.
Cambodia
Indonesia
Lao PDR
Malaysia
Myanmar
Pakistan
Philippines
Thailand
Vietnam
0
50
100
150
200
250
300
0 2,000,000 4,000,000 6,000,000 8,000,000 10,000,000 12,000,000
Res
iden
tial
Tar
iff
(Kya
t/kW
h)
GDP per Capita (Kyat)
0
50
100
150
200
250
Indonesia Myanmar Lao PDR Malaysia Vietnam Pakistan Thailand Phillipines Cambodia
Bu
sin
ess
Kya
t/kW
h

31
Note that our comparison does not take into account the differing costs of generation or the differing levels of subsidy implicit in these prices. To get an insight into the willingness to pay of customers with similar income levels which are subject to similar competitive constraints, we consider the actual payments made by low usage residential and business customers.
All of the countries considered in our brief survey have higher levels of electrification than Myanmar, ranging from 31 per cent in Cambodia, to 97 per cent in Vietnam as shown in Figure 5.4.
Figure 5.4: Electrification Ratios
Without pre-judging the outcome, we conclude that substantial opportunity exists to increase tariffs over time to minimize the size of the funding gap.
5.2 The Reference Case
Our reference case is the continuation of the current policy where the Government aims to set tariffs such that the existing YESB and ESE businesses are cash neutral in every year. Since demand from consumers on the existing system is growing every year, and requires more expensive generation, the policy means that tariffs will need to rise in real terms to accommodate the blending-in of more expensive generation.
We assume tariffs are increased uniformly between the “new system” and the “existing system”. This allows us to calculate the level of Government support required for the “new system”—the hypothetical standalone “roll-out” business—as long as the existing system is made cash neutral.
The required real tariff increases are presented in Table 5.1 below.
0%
20%
40%
60%
80%
100%
120%
Ele
ctri
fica
tio
n R
atio

32
Table 5.1: Required Real Growth in Average Tariff to Ensure Current Network is Cash Neutral
Cash Neutral Real Tariff Growth (%)
2016 2017 2018 2019 2020 2021 2022 2023 2024 2025
Compound Annual Growth
Rate for 40 years
Existing System (Standalone)
3.82 3.74 3.65 3.57 3.50 3.42 3.35 3.28 3.21 3.15 2.63
Overall, the current system can be kept cash neutral through a steady and modest real increase in tariffs.
The figure below shows the effect of the reference tariff policy on the present value of the funding gap. We present the funding gap in present value terms because it allows us to capture the effect of tariffs on the recovery of both capital, and operating costs of the electricity system. At the given tariff assumptions, the present value of the funding gap shown below ($1.069 billion) means that over the long-term, the Union budget will on average provide 27.4 percent of all funding for the electricity system. Consumers will provide 72.6 percent of funding. The total cash-flow burden (including both funding and financing) will be shared between the Government of Myanmar (18.6 percent), providers of concessional finance (32 percent), and consumers (49.4 percent).
Figure 5.5: Funding Gap When Existing System is Cash Neutral: National Least Cost Roll out Scenario
Assumptions: 10% discount rate; time period: 2015-2070; after 2046 revenues, capex and opex are kept at their 2045 levels

33
The effects of this tariff path on the required Government support in each of the following 16 years are shown below.
Figure 5.6: Annual Government Support Needed under National Least-Cost Roll-out
5.3 Key Sensitivities
The size of the funding gap depends both on the tariff decisions, and on decisions about how to prioritize investments: if the Government does not follow the national least-cost roll-out path, the size of the funding gap increases. In addition, the size of the funding gap at any particular tariff will be significantly influenced by generation costs and future system loss.
5.3.1 Tariffs Remain Constant in Real Terms
We define this as the case where electricity tariffs remain constant in real terms at their current levels (they are assumed to be adjusted for inflation every year).
We also assume that the tariff structure and the pattern of consumption remain unchanged throughout the roll-out period. Specifically, we assume that 5% of connections are at the current industrial rate of 0.075US$/kWh for the lowest-block consumption, and 95% are at the residential rate of 0.035US$/kWh. Furthermore, we conservatively assume that mini-grid tariffs are 1.5 times the weighted average of the grid tariffs. The mini-grid tariff assumption is based on data provided by the MOEP9. No tariff is assumed to be charged for off-grid solar home systems. The tariff assumptions are given below:
Table 5.2: Tariff and Connection Charges
Unit Grid Mini-Grid Off-Grid
Connection Fee US$/ connection
90 90 90
Tariff US$/kWh 0.037 0.065 -
9 Private Distribution Provider in Off-Grid Area Permitted by MOEP, Department of Electricity Planning, MOEP (2014)

34
The present value (PV) of the consumer funding gap at constant real tariffs is given below for three connection options. For the national least-cost roll-out scenario, the consumer funding gap is the lowest, at US$2.1 billion in present value terms. For the Proportional and Targeted connection scenarios, the consumer funding gap is approximately US$2.3 billion in present value terms.
Table 5.3: PV of Funding Gap 2015-2070, National Least Cost Connections
Assumptions: 10% discount rate; time period: 2015-2070; after 2046 revenues, capex and opex are kept at their 2045 levels
Table 5.4: PV of Funding Gap 2015-2070, Proportional Connections
35
Assumptions: 10% discount rate; time period: 2015-2070; after 2046 revenues, capex and opex are kept at their 2045 levels
Table 5.5: PV of Funding Gap 2015-2070, Targeted Connections
Assumptions: 10% discount rate; time period: 2015-2070; after 2046 revenues, capex and opex are kept at their
2045 levels
Overall, with constant real tariffs, for every kWh of electricity sold, the roll-out “business” loses money. This means that the need for financial support increases over time, as demand on this “business” grows. Moreover, this also means that consumers on the existing network, as their demand grows, impose losses on the existing YESB and ESE businesses. While current tariffs cover the cash costs of existing generation, they do not cover LRMC of generation. Hence, at current tariffs, YESB and ESE will lose money for every additional kilo-watt-hour consumed by their current customers.
Assuming tariffs and connection charges do not increase in real terms, the government will need to subsidize operating losses, and pay debt service to close the funding gap. We define operating balance (surplus or loss) as revenue (electricity tariffs and connection charges), minus electricity distribution and transmission opex, minus the cost of energy.
5.3.2 Zero Funding Gap Tariff
We now consider the opposite extreme: the tariff would remove any need for Government support. While such a tariff may be unlikely in the short term, and would probably be inefficient since there are significant national benefits from promoting electrification during this early phase, this sensitivity allows us to consider the level of effort that may be required to eliminate the funding gap. The annual real increase in tariffs required between 2015 and 2070 is 5.12% per year.
It is worth noting that with constantly rising tariffs, the hypothetical standalone roll-out business will not be cash-flow neutral in every year. In some years, the Government may

36
need to borrow to provide additional support. However, the zero consumer funding gap calculation ensures that sufficient revenue is available in years with positive cash-flow to repay such additional debt.
To avoid such interim borrowing, we consider what tariffs would be needed for consumer revenues to cover operations and debt service in every year. This is shown in Table 5.6 below for the next 10 years.
Table 5.6: Tariffs when New System is Cash Neutral Every Year (In US$)
Least Cost Nation-wide
2015 2016 2017 2018 2019 2020 2021 2022 2023 2024 2025
Grid 0.037 0.060 0.092 0.092 0.092 0.095 0.097 0.098 0.099 0.100 0.102
Mini-grid 0.065 0.106 0.162 0.162 0.162 0.165 0.170 0.172 0.172 0.175 0.179
Annual % increase needed 0% 63% 53% 0% 0% 2% 3% 1% 0% 1% 2%
This table clearly shows the magnitude of the challenge: tariffs would need to jump significantly in 2016 and 2017 in real terms to avoid even short term reliance on government subsidy. Again, this tariff path would be neither desirable nor efficient.
37
6 Implementation Road Map
Even if financing and funding become available, the institutional capability will remain a significant constraint on electrification.
Given the scale of the electrification challenge and the long time commitment, the NEP requires a sector-wide, programmatic approach to accelerate electrification rates in Myanmar. In practical terms, this means that all institutions involved in funding, financing, and implementing various components of the electrification roll-out must work in a highly coordinated and integrated way. Money must flow through the system efficiently and on time, it must follow the technical least-cost electrification plan, and the projects which flow from that plan must be procured and implemented as efficiently as possible. In other words, the success of the NEP depends on more than just making more money available: if that money cannot be used in an efficient and timely manner, the NEP objectives will not be achieved.
The key features of a sector-wide programmatic approach are:
Organizing the roll-out around a comprehensive technically least-cost plan for grid, mini-grid, and individual household-level connections. In practice, this means ensuring that the plan is constantly updated and refined, and that actual projects follow the plan, in terms of what, where and when gets built
Funding flows must be predictable. For the technical plan, there must be a clear and comprehensive multi-year funding and financing plan. The institutions implementing the program must all play their role in ensuring that the flow of funds keeps the program moving. This will require a high degree of coordination, with direct involvement by key political decision-makers
The implementation of the plan must be standardised and simplified, so that procurement and other necessary activities can be carried out without delay and at low transaction costs
The program must remain focused on the overall results, with clear accountability and incentives for performance.
Institutions will play a critical role in shaping how the NEP will be delivered. In particular, institutions need to be designed to ensure (i) there are sufficient funds flowing into the overall electrification program (ii) there is coordination of the funding, such that it is reaching projects which are (iii) prioritized on a least-cost basis, and (iv) projects are being built efficiently, and are achieving social objectives. A clear pathway for private sector participation within that framework will be necessary to increase the probability of efficient implementation.
Few countries have been able to achieve the kind of acceleration in electrification rates that Myanmar will need to achieve. Those—such as Rwanda— that have implemented a programmatic, sector wide approach. The box below describes how Rwanda implemented its electrification roll-out. Rwanda and other countries seeking to accelerate electrification provide useful lessons for Myanmar. Our analysis draws on those lessons, but seeks to apply them within the specific context of Myanmar’s institutions and fiscal practices.

38
Box 6.1: Programmatic Sector-Wide Approach: Case of Rwanda
In June 2008, Rwanda embarked on a mission to accelerate electrification rates using a programmatic sector-wide approach.
Goal: The goal was to increase electrification from a mere 6 percent in 2008 to 16 percent by 2014. This meant they had to make around 37,000 new connections per year, over in a five year period. However they were starting with a growth rate in new connections of less than 5000 per year. The overall cost of the program was estimated at US$336.6 million
Key Features:
The program received strong and broad-based support from key players in the Government, including the Cabinet, the Ministry of Energy, Ministry of Finance, Ministry of Economy, other line Ministries, along with the electricity utilities. Each of these entities was held accountable for performing certain actions.
Rwanda’s sector-wide approach was anchored by an integrated and detailed technical, financial, and implementation plan.
To ensure efficient and effective program delivery, a National Electrification Program Management Department was established within the national distribution utility Electrogaz. The functions of this department was to oversee:
– planning, design, and implementation
– pooling of all funds irrespective of donor
– monitoring and evaluation, and
– reporting accountability.
Results: Overall, the results from this program are positive.
Rwanda is on track to achieve its electrification targets as shown by the table below:
Program Connections (Target and Actual)
2008 Actual
2009 2010 2011 August
2014 Target
New connections < 5,000 32,995 43,733 40,419 On track
Households connected to electricity
110,896 143,891 187,624 228,043 350,000
Donors pledged US$225 million for first slice of program (2009-2013)
Cost per new connection was substantially lowered than before the program was implemented
A comprehensive framework for monitoring results was developed that did not exist prior to the plan
Rwanda was one of the first countries to use a programmatic, sector-wide approach. Today several countries including Kenya, Uganda, and Ethiopia are following suite.
Source: Castalia Rwanda Electrification Investment Prospectus (2008), Rwanda: Extending Access to Energy, Lessons from a Sector Wide Approach, ESMAP, World Bank 2013

39
Our review, undertaken in consultation with the sector stakeholders, finds that Myanmar is currently not institutionally equipped to roll out the electrification program on a programmatic, sector-wide basis. Myanmar’s existing institutional arrangements are designed to support electrification expansion on an ad-hoc project-by-project basis. This means that funding from the state and donors—where it is available—would be fragmented and unable to reduce the costs and support achievement of the universal electrification objectives. However, our consultations with the Government have resulted in a high degree of understanding and commitment by the Government of Myanmar to implement institutional solutions to support the NEP.
In summary, in order to follow a programmatic sector-wide approach and achieve rapid and efficient scale up, the following key institutional issues will need to be addressed:
A mechanism is needed to pull together the various funding and financing sources, into a coherent and comprehensive program and to ensure that money flows in line with the financial plan
An entity is needed that will take control of the program, and coordinate with the various stakeholders. It must be given resources and authority, and be held accountable for its outcomes
Grid-based electricity provision through the distribution utilities needs to be made more efficient in order to scale up. Significant opportunity must be created for private sector participation
Support for the implementation of mini-grids must be coordinated, both to achieve the benefits of standardization and to ensure that money follows appropriate projects
The design of the household-level electrification program needs to be made more sustainable and efficient.
We have discussed a number of institutional reform options with the Government. We have received feedback from the Government of Myanmar on some of the proposals. The Government has also made a number of further reform decisions. This section of the report presents our diagnostic of the institutional barriers and sets out a Roadmap of specific steps required for the successful implementation of the NEP.
6.1 Diagnostic of Institutional Barriers to Implementing the NEP
A systematic and coherent approach to planning, funding, financing, and physically making new connections is needed to scale up electrification in Myanmar. In this section we consider the barriers to integrating various aspects of electrification into an overall program. We also examine barriers to efficient implementation of various components of the program: on-grid, mini-grid and individual household-level electrification.
Our analysis is summarized in Figure 6.1 below.

40
Figure 6.1: Summary of Barriers to Achieving Electrification Objectives
6.1.1 Program-level Management and Coordination
Our consultations with stakeholders indicate that at present there is no effective mechanism to coordinate funding and financing flows from different streams into a program.
To begin with, there is currently no institutional structure in Myanmar to coordinate decisions about the setting of electricity tariffs and the electrification objective. In order to implement a programmatic approach to electrification, it would be necessary to link tariffs to the cost of providing and expanding electricity services, as well as to the availability of budget funds to subsidize such services. In practice, we understand that the two relevant decisions—how high the tariffs should be and how much fiscal resource is available to develop the electricity system are taken in isolation from each other. Most importantly, they are taken in isolation from any electrification target.
In effect, the Parliament decides the level of electricity tariff by reference to two primary considerations: the political acceptability of the tariff, and the existing cash needs of the electricity system. This means that future needs of the expanding system are not taken into account.
The Government separately decides how much capital investment is possible in the sector on the basis of its current fiscal constraint, and on the basis of individual project and loan proposals that are put before the relevant agencies by various donors and developers. This means that the pace of electrification is the residual of such project-by-project and short-term fiscal considerations, rather than the other way around—where the financial plan is developed to achieve stated objectives.
Furthermore, the Government has limited mechanisms to assess and prioritize various contributions it makes to the overall sector development. As is often the case, the Ministry of Finance has different “vertical” budget approvals for each ministry. Hence, when

41
government spending for various aspects of electrification comes out of different budgets, it is difficult to form a comprehensive view of how various activities contribute to the overall program, and whether there is a better way to align such activities. This is further complicated by the role, that has now been given to Regional and State Governments, to promote electrification at the local level. Since Union and Regional Government budgets are formed separately, and since there are barriers to coordination between Regional and Union budgets (for example, Union funding has to be spent via Union-level procurement agencies and cannot be channelled to locally implemented projects), there is considerable risk that local and Union-level electrification projects could be at cross-purposes to each other.
At present, the Ministry of Electric Power (MOEP) takes primary responsibility for planning the national grid expansion and rehabilitation. MOEP is cooperating with the World Bank Group and its consultants in the development of the initial least-cost electrification plan. However, while MOEP is able to provide such technical cooperation, it has no institutional basis to serve as the agency that would be able to administer the least-cost sector-wide roll-out plan. MOEP may be able to develop the institutional capability to review, manage, and update the on-grid aspects of the roll-out plan, but it would not have the authority to coordinate between on-grid and mini-grid projects, and to allocate funds to mini-grid projects.
In principle, the Ministry of Finance has the authority to coordinate the financial flows between different budget streams, but of course, the Ministry of Finance does not, and will not, have the technical expertise to manage the least-cost electrification plan. In other words, what is missing is the crucial link between the technical planning process, the link to electrification objectives and authority to manage the flow of funds in accordance with the plan that would achieve those objectives.
The existing mechanism for bringing together the activities of different agencies is through ministerial coordination committees. However, such committees may not be suited to achieving the required sector-wide coordination. In Myanmar, ministerial committees bring together ministries with their existing budgets and priorities. They do not serve as a tool for re-prioritising budgets. By contrast, sector-wide coordination of the electrification roll-out will require ability to make decisions about prioritizing between on-grid and mini-grid developments, and to manage the flow of funds in line with the constantly updated least-cost roll-out plan.
A further complication is that the existing mechanism for the approval of external loans—through a further ministerial committee (National Foreign Aid Committee)—may impose an additional level of separation between the least-cost electrification plan and the financial plan that must sit behind it. The current approval process is by its nature based on project-by-project appraisal, and does not fit easily with the programmatic approach.
Overall, the existing institutions are geared towards a project-by-project review, approval, and implementation. This needs to be turned around towards an institutional model which enables to support programmatic, sector-wide implementation. This will require integrating responsibility for technical planning with the responsibility for managing a financial plan that supports the overall objective, ensuring that funds flow to projects identified by the least-cost plan at the rate able to support the agreed electrification target.

42
6.1.2 Efficient Operation of Utilities and their Ability to Scale-up
The geospatial analysis shows that the majority of electrification in Myanmar will occur through extending the existing national grid. Hence, the bulk of the electrification effort will fall to the two on-grid utilities: ESE and YESB.
However, our review suggests that it is unlikely that the two utilities would be able to successfully fulfil this responsibility under the current institutional setting. Even if funding and financing become available, to achieve higher rates of electrification, the two utilities will need to recruit additional staff and improve their operating efficiencies. In our view, this is unlikely to be achieved under their current structures as Government trading entities.
The key problems facing Government trading entities in Myanmar are:
Limited operational flexibility and ability to plan. We understand that the Government of Myanmar is seeking to provide greater flexibility to its trading entities. However, our review of the Accounting Policies for State-Owned Enterprises (2012), as well as discussions with stakeholders, indicates that there is little ability for such enterprises to make their own commercial decisions. Key spending decisions require inclusion in the Union budget, while staff policies have to be coordinated with the remainder of the public sector. While such enterprises will have some ability to access finance via the Government owned development banks, they will not have the freedom to manage their balance sheets in line with their medium-term objectives
Limited performance incentives. State-owned enterprises effectively remain budget implementation agencies, rather than commercial organizations incentivized to minimize their costs and to maximize their sales to their customers in order to maximize profits
No ability to access finance on own balance sheet. Apart from limited access to public sector loans, ESE and YESB will not be able to arrange finance from alternative sources. In effect, they have to serve as passive recipients of the available finance. This means that they are not able to set their own pace of development.
In addition, there is currently no instrument for setting cost-reflective tariffs, and for making rational decisions about the incidence of subsidy. Parliamentary approval of tariffs creates on-going uncertainty for the utilities, and means that they cannot provide credible multi-year promises to their suppliers or potential lenders. As a result, ESE and YESB either have to enter into short-term, high-risk arrangements, or require the Government to stand behind every long-term contract (such as IPP contracts). In practice, this means that electrification can only proceed at the pace of the slowest component in the chain—the Government’s ability to review and provide support to the utilities’ various initiatives.
It is important to emphasize that—given their financial and institutional constraints—there are many things that YESB and ESE do well. We have been impressed with the orderly management of the fiscal constraint and the existing process to prioritize individual projects against this fiscal constraint. We have also been impressed by the attempts to bring in the private and commercial sectors into the electricity sector. Much of the network build is already outsourced to the private sector. In addition, ESE and YESB have entered into contracts with private companies for the management of the electricity network in a few

43
townships, beginning in 2012. We have reviewed one such contract, and it appears to be a form of system-loss reduction contract—where the private entity earns profits from undertaking investments that would reduce system loss and increase local capacity. However, this contract does not draw on the existing international best practice, and is unlikely to provide a basis for a strategic role for the private sector to participate in the efficient implementation of the NEP.
Overall, we believe that an increase in funding flows would enable ESE and YESB to increase the rate of connection to some extent. But, without institutional reform that would promote operational flexibility, medium-term decision-making, and strong performance incentives, the ability to scale up without blowing out costs would be limited.
6.1.3 Need for Coordinated Implementation of Mini-grids
At present, there is no coordinated mechanism for the implementation of mini-grids. 10 Regional Governments and private entities are free to come up with ideas for mini-grids. International donors are also interested in supporting mini-grid projects at the village level, particularly those built around local renewable generation sources. However, this “bottom up” ability to promote projects is different from the required ability to implement mini-grid projects in line with the least-cost electrification plan. At present, there is significant risk that individual mini-grid proposals may not conform to the least cost plan.
In addition, there is no standard format or process for developing mini-grids. This means that every project effectively has to “re-invent the wheel”: come up with its own institutional design, technical plans, legal documentation, and financial proposals. Since mini-grids are by definition relatively small projects, this means that the transactions costs—the costs of getting the mini-grid organized—can be a very high proportion of the total cost. Such transactions costs will reduce the number of projects that can proceed.
Finally, there is no ministry “ownership” for mini-grids. Ministry of Electric Power (MOEP) is focused on the national grid, while Department of Rural Development (DRD), housed within the Ministry of Livestock, Fisheries and Rural Development (MLFRD) deals with household-level electrification. In effect, this means that there is no instrument for channelling the Union budget to mini-grids or for integrating mini-grids into a comprehensive program. At present, proponents of mini-grid ideas have to seek financial support directly from donors or other interested parties. Again, this is complicated, costly and can only underpin a limited number of projects.
It is important to emphasise that mini-grid solutions may become particularly important for pre-electrification. Hence, the process for enabling mini-grid investment must also involve clear transition to future grid connection.
6.1.4 Sustainability and Efficiency of Individual Household Solutions
The Government is currently implementing a household-level solar electrification program through DRD. Under this program, DRD has private service providers installing village-level solar home systems (SHS), and providing training to local people for the exploitation of the system. We were impressed by the enthusiasm and commitment of the staff of DRD. We are also conscious that the household-level program will be a small part of the overall 10 Definition of Isolated mini-grids: These are small scale distribution networks typically operating below 11 kilovolts (kV)
that provide power to one or more local communities and produce electricity from small generators using fossil fuels, renewable fuels, or a combination of the two

44
electrification roll-out. However, we believe that the program can be improved in a number of ways:
The standard of electricity service delivered by the program needs to be carefully reviewed against the national electrification objective. We are concerned that a village may be considered to be electrified after receiving solar systems that are only capable of providing lighting, and hence may fall out of the national electrification roll-out that would have delivered electricity that could support economic development
The provision of the household-level systems needs to be linked to the least-cost electrification plan: such units should be targeted at areas slated for household-level electrification in the plan
The implementation of the program needs to ensure incentives for on-going maintenance of the system.
Again, the scale of the household program may be influenced by the size of the pre-electrification effort, and will require coordination with the arrival of the grid.
6.2 Program Coordination
The Government has now confirmed that the responsibility for electrification will not be centralized in a single Ministry. Rather, the responsibility will remain shared across various Ministries, including, Ministry of Electric Power, Ministry for Livestock, Fisheries and Rural Development (MLFRD), as well as Regional and State Governments.
Hence, a coordination body needs to be created and provided with sufficient resources and sufficient “political pull” to ensure that the coordination task is achieved. We recommend that the Government of Myanmar:
Designate a single coordination committee to oversee all aspects of the electrification roll-out. Since successful implementation of the NEP goes beyond the strict confines of rural electrification, we suggest that NEMC should have the oversight role
Establish a well-resourced Executive Secretariat to undertake the coordination function. This Secretariat would need to report directly to a senior political figure (for example, the Vice President or the President) and have the authority to oversee the functioning of the NEMC. In addition, it should be able to work directly with all relevant agencies (such as MOEP, MLFRD etc). As we discuss later, Myanmar’s development partners should consider providing substantial technical assistance funding to support this Secretariat.
The Executive Secretariat should perform a number of roles:
It would maintain and update the geospatial and financial plans for the NEP, and monitor the achievement of the electrification targets
It would serve as the main point of contact for Myanmar’s development partners and would advise the Government on managing a coherent financing program for the sector-wide plan

45
It would provide advice and support to the Ministries involved in implementing the aspects of the NEP they will be responsible for.
We understand that the Government is considering setting up an independent regulator to determine electricity tariffs in Myanmar. This is an essential reform. However, it may take time to implement. In order for the NEP roll-out to begin, YESB, ESE and potential private operators will require certainty about tariffs and subsidies in order to access financing.
We suggest that while the regulator is being established, the Executive Secretariat should take on the responsibility for:
Reviewing and updating the estimates of the total funding requirement for the next five years
Advising the Government on tariff options and the implications for the subsidy requirement
Coordinating timely delivery of the required subsidy.
6.3 Grid Connections in YESB Franchise Area
The Government is considering the idea of corporatizing YESB, and is working with the International Finance Corporation to develop an investment program for YESB.
We suggest that in addition to the work already under way and in anticipation of the results of such work, the Government move quickly to change the way it provides support to investment by YESB. At present, YESB applies for budget funds for its investment needs. Once the funding is disbursed, there is no obligation on YESB to return that capital. Such capital provided by the Union Budget does not count towards the costs of the YESB business, and hence is not recovered in tariff.
We suggest that the Government’s objective should be to provide sufficient certainty to YESB to enable it to access financing for investment. This can be achieved by:
Calculating an appropriate cost of service for YESB, including the cost of power purchases and the return on and of distribution capital
Determining how much of that cost will be recovered through tariffs, and
Providing the balance through an annual subsidy payment.
There are many precedents for this approach. In Indonesia, the Government provides an annual Public Service Obligation (PSO) subsidy to the national power company (PLN) such that it earns a target rate of return through a combination of tariff revenue and the PSO. This enables PLN to borrow, and enter long-term power purchase contracts. Similar arrangements exist in various Indian states, where State Governments provide subsidies to local distribution companies.
In the medium term, it will be the role of the regulator to set the Annual Revenue Requirement (ARR) for the distribution enterprises. In the short term, this function can be performed by the Executive Secretariat.
6.4 Grid Connections in the ESE Franchise Area
The majority of new connections in Myanmar will occur in the ESE franchise area. In our view, Myanmar has no option but to implement a “conventional” utility reform program.

46
This involves first corporatizing the utilities—ESE and YESB—so that they operate as independent commercial entities under a commercially skilled board, are able to conduct financing operations on their own balance sheet, and are able to make independent decisions about staffing levels, pay, and other resources. Under the corporatized structure, the utility’s performance is judged by its ability to earn a return on capital, with the Board and management being rewarded for commercial performance in the same way as would occur in the private sector. Successful corporatization programs result in reduction of political involvement in the operation of utilities: utilities invest and hire because it advances their commercial objectives, not to achieve political objectives such as employment.
We describe this reform program as “conventional” because this has been the path followed around the world. While the speed of reform may differ from country to country—and the performance of corporatized utilities also differs—the overall approach is no longer seen as controversial.
An essential component of the “conventional” utility reform program is the creation of a utility regulatory regime which ensures that tariffs are linked to cost (after allowance for any subsidies from the Government). There are two reasons for such a regime. First, it helps to “de-politicize” the tariff setting process, and provides both the corporatized entity, and any private investors and lenders with greater certainty about the level of tariffs. Second, it ensures that the management and Board of the corporatized utility cannot meet their financial performance objectives through the exploitation of monopoly power, rather than through efficient operation of the utility. By ensuring that the tariffs are set so that the utility is only able to recover reasonably efficient costs, including the weighted average cost of capital, a regulatory regime also ensures that strong financial performance by the utility is only possible if it operates efficiently.
There are numerous models for implementing a utility regulatory regime. These range from the establishment of an independent utility regulator, which would be able to undertake periodic reviews of cost reflective tariffs and set such tariffs without interference from the political process, to the setting of tariff formulas in contract between the Government and the utility.
A further reform step of splitting the corporatized ESE into smaller state and region based distribution enterprises could also be considered in the longer term. Smaller regional entities might be more nimble and responsive, as load growth dramatically increases with the expansion program. Introducing a layer of competition between these distribution companies might also improve operational efficiency.
Relatedly, the option of strategically involving private sector should also be considered. The level of private sector involvement may range from system loss reduction contracts, to management contracts to full concession for utilities. The best approach will depend, in part, on incidence of subsidy and the optimal number of utilities across the country. There are many examples of high quality private sector participation contracts around the world.
We understand that the Government is already considering reform options for ESE and YESB. While the detail of utility reform is outside the scope of this report, it is clear that NEP would not be able to proceed without significant and rapid progress on such reform. However, we realize that reform may take time, and that the electrification program cannot wait for the completion of the reform program. With this in mind, we would suggest a

47
number of measures that could improve operational efficiency and flexibility of the utilities in the short-term, and enable first steps towards scaling up of electrification. These include:
Developing a five-year budget for ESE and YESB in line with the electrification plan, so that the utilities can commence medium-term planning
Provide ESE and YESB with the flexibility to hire staff on short-term contracts to enable more rapid expansion
Announce the five-year plan as quickly as possible, so that private sector providers can start gearing up for the expected contracts, and in particular, start training personnel with the necessary skills
Pending the creation of the regulatory regime, develop and announce a five-year tariff path consistent with the electrification plan and with a realistic assessment of consumers’ ability and willingness to pay.
Finally, we recommend that new connections should be included on the utilities’ balance sheet, and financed as part of the overall program, rather than requiring consumers to fund the entire connection or to use their own sources of finance to finance it. This would enable concessional financing to be used for the cost of connections and remove a significant barrier to electrification.
Some of these connections will be carried out by ESE itself. However, it is likely that many connections can be managed by private and community enterprises that will receive a concession for a sub-franchise. For example, we have been informed that MLFRD is considering setting up a state enterprise under the Ministry to implement the roll-out in selected priority rural areas. This enterprise will receive a sub-franchise from ESE to make low voltage (LV) connections in those areas, to connect to the ESE MV network, to collect tariffs, and to maintain the LV network. We understand MLFRD is considering bidding out the operation of this enterprise as a public-private partnership (PPP).
We expect there will be many similar examples and opportunities. To ensure orderly process of establishing and implementing such sub-franchises, it will be necessary to:
Make arrangements for a clear delineation of service areas and responsibilities
Ensure that ESE receives wheeling payments for its MV investments that serve such sub-franchises
Create a mechanism to enable operators of such sub-franchises (whether private or community-owned) to access appropriate financing
Create a mechanism for delivering subsidies to these operators where such subsidies are required.
The figure below summarizes the structures that will need to be put in place to enable sub-franchising.

48
Figure 6.2: Private and Community Operators on the ESE Franchise
We discuss the implementation issues for the ESE and for sub-franchises separately.
6.4.1 ESE
Unlike YESB, there is no work at present to examine the corporatization of ESE. We recommend that the Government implement similar reforms for both utilities:
Examine corporatization and investment options for ESE
Change the structure of support provided to ESE from disbursement of funding for investment to ensuring adequate funding to enable ESE to access financing
Enable ESE to borrow on its balance sheet, including on-lending to ESE donor financing
Use the Executive Secretariat to examine the ESE cost of service, and to determine the required subsidy for any level of tariff.
6.4.2 Sub-Franchise Concessions
The Government should encourage concessions for various sub-franchises. This will greatly speed the roll-out and will lead to lower costs. However, it is essential that the process for sub-franchising be orderly, and that it should encourage competitive procurement:
The MOEP, as the Ministry responsible for ESE, should develop clear rules and standard application forms for a sub-franchise. Such rules should specify the responsibilities of the sub-franchisee (including the obligation to serve the entire
Electrification Roll Out Program
Project A
Project A
Financing
Customer payments
SubsidyCustomer payments
Banking Sector

49
population in the area), define the boundaries between the sub-franchise and ESE as well as other sub-franchises, and set the wheeling charges to be paid by the sub-franchises depending on the extent of its reliance on the ESE’s MV network
MOEP, with advice from the Executive Secretariat, should set the tariff rules and the starting tariff for the sub-franchise
Sub-franchises should be allocated to operators on the basis of least subsidy (See Appendix A on the Chilean Model). In some cases, it should be possible to conduct competitive tenders: for example, MLFRD should conduct a competitive tender for minimum subsidy for its proposed PPP for rural electrification in the priority areas. Similarly, if ESE designates an area as a potential sub-franchise, it should be bid out on the basis of minimum subsidy.
However, in many cases, a competitive tender may not be possible: a sub-franchise proposal may come from a community or from a local entrepreneur, who would have put considerable effort into developing a proposal and may be the only party able to take the lead. It would be undesirable to discourage such innovation by forcing those who show such initiative to go through a standard open tender. Rather, we propose that the Government implement an approach known as the “Swiss Challenge”: the party that develops a sub-franchise proposal should determine the subsidy that it will require. The draft agreement should then be opened to challenge by third parties, who may offer to implement it for a lower subsidy. The original proponent should then be given an opportunity to match the lowest subsidy bid. If the local proposal genuinely cannot be replicated, no challenges will be received.
MOEP, together with the Executive Secretariat, should ensure that the total subsidy envisaged for the roll-out program includes subsidies provided to sub-franchises.
In addition to ensuring an orderly and competitive process, and delivering the required subsidies, the operators of sub-franchises will also need to be provided with access to finance. Since the initial roll-out program is based on 100% financing through concessional sources, there will be a need for a mechanism to enable on-lending of concessional finance to such private and community operators.
We have conducted initial due diligence on a number of banks in Myanmar that may be able to implement such an on-lending program. We had discussions with the Myanmar Investment and Commercial Bank (MICB), the Myanmar Rural Development Bank (RDB) and the Myanmar Economic Bank (MEB). Of the three state-owned banks, MICB has most experience of working with private investors and of providing some project based finance. However, even MICB has very limited capabilities and would require considerable technical assistance to become an effective project finance lender. At present MICB mainly lends on 1 and 2 year terms, and most of its lending is against real estate collateral. MICB has offices in Yangon and Mandalay, and has a loan book of about $440 million.
At present, the Rural Development Bank also only has branches in Yangon and Mandalay, but intends to open a branch in every state in the next year, and will aim eventually to have branches in the 330 townships where the MLFRD has an office. RDB has only been in existence for just over a year, and so far has operated largely as a kind of micro-finance institution for seasonal financing of farming. Its total loan book is US$36 million, of which

50
US$35 million is rural overdrafts. RDB currently has lower capability to manage relatively sophisticated and complicated infrastructure deals than MICB, and will need considerably more capacity building.
Myanmar Economic Bank is the biggest of the three state-owned banks we examined. Its total loan book is US$1.5 billion, and it has divisions dealing with different economic sectors, including a loans and supervision department for energy enterprises. ESE and YESB have their accounts with MEB. MEB also has previous experience in administering two step loans from International Finance Institutions (ADB), and is currently negotiating a two-step loan program to be supported by JICA.
We recommend that Myanmar’s development partners set aside a part of the financing to be provided to the electrification program to be delivered via a selected state-owned bank to private and community-based operators of sub-franchises. We further recommend that development partners undertake detailed due diligence on the state-owned banks and present a proposal for negotiations.
A two-step loan program will require technical assistance to the selected bank to enable it to understand and manage credit risks associated with long-term electricity distribution investments.
6.5 Mini-Grid Connections
We have reviewed a number of approaches that involve primary reliance on local initiatives for mini-grids, giving the Union Government a support role through standard-form funding and financing programs, as well as enforcing baseline performance through standard contracts. Chile, and more recently Mali provide examples of such more decentralized approaches. Relevant experience of these countries is described in Appendix A.
The table below summarizes how these successful models can be adapted to Myanmar.
Table 6.1: Decentralized Mini-grid Support Model Adapted to Myanmar
Function Who? What and How?
Funding and Financing Support
Union Government Agency
Various mechanisms possible, from funding feasibility studies, to competitive subsidies to developers/VECs, to offering concessional loans to developers or a combination of all
Project Prioritization Union Government Agency, could potentially include support from the Regional Governments
Linked to priority areas, and electrification targets in each area, but primarily prioritized around the quality of project preparation at local level
Detailed Project Design
Private developers, or private developers contracted by VECs
Need to follow the basic design and construction standards stipulated by the Union Government
Procurement of Materials, Construction
Private developers, VECs Not necessary to follow a standard process
Processes, Guidelines and Standard Setting
Union Government Agency
Would provide light handed processes for applying for permits, and potentially

51
regulation of service standards
Performance oversight Regional Government or local community
If a loan has to be repaid, or a contract between the developer and central Government requires a specific tariff to be charged, may involve some degree of central oversight. If it is self-sustaining less oversight will be needed
While permanent mini-grids will play a minor role in the electrification program, there may be numerous “pre-electrification” mini-grids. In essence, community groups and private investors may decide an opportunity to electrify an area well ahead of the time when it is feasible to extend the MV lines to that area. However, there is no reason why it would not be feasible to install grid-ready LV lines in that area, and to use local generation until the grid arrives. In many cases, local generation will be temporary in nature. It will either need to be amortized in the period before the grid arrives, or it needs to have some second-hand value and be able to be moved elsewhere. For example, diesel generator sets clearly fall into that category.
There will also be many cases when local generation is more permanent in nature: mini hydro or other local renewable power sources could provide a basis for mini-grids. Such renewable generation will be more costly than large scale thermal or hydro-based generation operating on the grid. Hence, arrangements will need to be put in place to enable some of the cost of such generation to be amortized prior to the mini-grid joining with the grid, or to provide subsidies for such generation to make it competitive with the rest of the grid. The International Finance Corporation is currently providing advice to the Government on the models that can be adopted in such circumstances. There are a number of useful models that have been trialed in other countries.
From the perspective of the implementation of the NEP, the issues around the development of mini-grids (whether temporary or permanent) are similar to the sub-franchising of the ESE areas. In particular there is the need to:
Provide standard processes and standard documentation which sets out the obligations of the operator
Provide a competitive (minimum subsidy) process, or a “Swiss challenge” where the proposal is in response to a local initiative, against predictable tariff rules
Ensure timely delivery of the subsidy
Enable the operator to access concessional finance.
We suggest that given the similarities in the issues, the solutions should also be similar. In fact, we would recommend that a single set of rules be applied to sub-franchising of grid connections and to mini-grids, since the main factor differentiating the two is likely to be the timing of when the grid connection occurs. A mini-grid operator will need to know what wheeling charges it will need to pay to ESE once the grid arrives, as well as have an orderly process for managing its generation assets.

52
6.6 Household Electrification
Beginning in 2012, the DRD has used donor funds and Union budget to develop a nascent solar initiative that provides free Solar Home Systems (SHS) to households mainly in rural areas, provided they meet certain broad criteria.
Household-level solutions will be least cost or pre-electrification solutions for the more isolated, relatively small settlements. Hence, in addition to scaling up grid and mini-grid connections, it will be important to scale up the household-level initiative.
There are four main ways to improve sustainability and efficiency of the household-level program:
The program must be backed by predictable sources of financing and funding
The program must generate revenues that would contribute to on-going costs and be financially sustainable
The program must be designed to ensure that once installed, the systems continue to provide quality service
The program must be well targeted to areas where SHS based solutions are the most economic electrification option.
Several countries, including Myanmar’s direct neighbors—Lao PDR and Bangladesh—have implemented large-scale solar programs and have achieved some success. We describe their experience in Appendix A. Here we consider the implications for Myanmar.
Institutional Options and Recommendations for Scaling up Household-level Solutions
We recommend that DRD:
Provide financial incentives that promote cost-recovering business models to flourish. Given the high upfront cost of SHS, some form of concessional financing and/or funding is essential for scale-up. The Government must clearly specify the types and amount of financial incentives available. Financial incentives could include initial capital subsidies and various types of concessional loans. Additionally, the Government must establish clear criteria for which entities are eligible for receiving the financial incentives. This would help improve the targeting of the program. The incidence of the financial incentives could be on the product suppliers, project companies or service companies, technicians, end-users, and the community
Provide clear guidelines and rules for the entities that will benefit from the financial incentives. For example if the financial incentive is concessional loans to end customers, the program design should include streamlined loan application procedures and flexible arrangements for securing and repaying loans. Loan officers must be familiar with the system in order to facilitate and accelerate loan processing. Similarly, if a product supplier needs a license to supply to the market, the licensing procedure should be clear and simple
Encourage scaling up in areas where SHS is economical. The economic niche for solar home systems covers remote or isolated areas where loads and load densities are low, and where grid based solutions are not cost justified. The

53
Government entity promoting this program should have a clear idea where these areas are, and prioritize them by targeting financial resources to those areas. Knowing these areas would require being well acquainted with the updated geospatial rollout plan. In such areas, the Government can provide additional technical support, fully fund feasibility studies and surveys, and devise educational and marketing campaigns
Ensure close coordination between the grid roll-out and the SHS program. International experience shows that the usefulness of temporary SHS solutions depends on the timing of grid extension. For example, Laos found that more than one third of the systems were retrieved in less than two years after installation due to the arrival of the grid
Provide training support and incentives to ensure sufficient and well trained technicians. Well-trained technicians are needed to install, maintain, and repair SHS. While some users can perform simple maintenance procedures, trained technicians are still required after installation, since experience has shown that in the long term, reliance on users for maintenance can impair the performance of SHS. The Government can provide centers of excellence for training or additional incentives to become a technician
Closely monitor the program’s progress. It is also very crucial for the Government entity directing the program to ensure the scale up is progressing according to plan. They should do this by collecting information and then being proactive about making improvements program delivery as lessons are being learned.
DRD has already developed some expertise in SHS, and its staff display impressive enthusiasm for their program. Providing technical assistance to DRD to develop its program in line with international experience, while ensuring that funding and financing available to the program was in line with the NEP, would allow for the scale up of the household-level component of the NEP.
Overall, the Government needs to move the household electrification program from the relatively unsustainable give-away of solar systems, to an arrangement where customers are provided with energy supply by firms that maintain and operate household and village systems. Customers would pay for the energy they receive. Private providers would use revenue to cover the costs of maintenance. The Government would provide subsidies to ensure that tariff revenues were sufficient to cover the costs of the private operator. Such a shift will be particularly important to support the “pre-electrification” program.

54
7 Technical Assistance for Myanmar National Electrification Plan (NEP)
Implementation of the National Electricity Electrification Plan is a complex and challenging undertaking, which is more difficult than the “business as usual” rate of new connections currently undertaken by the policy and implementation institutions in Myanmar. Technical and administrative capacity will be a major constraint on the roll out.
The challenge will be particularly acute in rural areas as ESE will be required to increase its rate of connections from around 60,000 per year, to more than 500,000 per year to achieve the goal of 100% electrification by 2030.
A further challenge will be managing the influx of substantial donor funds through concessional loans. Coordinating funding, meeting the needs and requirements of a number of donor agencies, and ensuring that the electrification program meets its targets represents a large scale and complex administrative and project management task. This task is significantly in excess of the current roles and experience of the major institutions involved in the electrification rollout.
It is clear that successful implementation will require a major Technical Assistance program. In this section we detail:
The institutions that will be involved
The tasks that will require TA; and
An estimate of the scale of TA required.
We estimate the total amount of TA required over the next five years to support the distribution rollout as $23.8 million as shown in Table 7.1.
Table 7.1: Technical Assistance Costs
Area Person/Months Monthly Rate Cost
Executive Secretariat 288 $30,000 $8.460,000
Independent Regulator 150 $30,000 $4,500,000
DRD & MOEP 54 $30,000 $1.620,000
YESB & ESE 156 $30,000 $4,680,000
Banking Sector 144 $30,000 $4,320,000
Total 792 $30,000 $23,760,000
For this estimate, we use a blended international rate of $30,000 per month, which includes all international advisor costs and local technical support.
The level of effort and the tasks required for each institution are shown in Table 7.2.

55
Table 7.2: Technical Assistance Tasks and Level of Effort
Institution 2015-16 2016-17 2017-18 2018-19 2019-20
Executive Secretariat
(Establishment)
Establish Secretariat--policies, procedures staffing and training
12 person months
Set policies and assigning responsibilities for government agencies and implementation service providers
24 person months
Review project governance and organizational structures and implement appropriate changes
12 person months
Review pre-electrification policies and strategy
12 person months
Review implementation policies and responsibilities and overall governance structure
24 person months
Implement revised policies and responsibilities for government agencies and implementation service providers from 2020
24 person months
Liaising with multi-lateral agencies on terms and conditions of concessional loans including financial control and procurement requirements
12 person months
Reporting progress and performance to multi-lateral agencies
12 person months
Reporting progress and performance to multi-lateral agencies
12 person months
Developing funding road map and prospectus for next five year period from 2020
24 person months
Syndicating funding for next five years from 2020
12 person months
Develop more detailed geospatial plan to set priorities and targets and allow service providers to undertake detailed planning
Annual update of detailed rollout plan including full technical and financial analysis of performance
Annual update of detailed rollout plan including full technical and financial analysis of performance
Full review of technical and financial performance of rollout implementation to set policy and governance framework for next
Developing detailed geospatial plan to set priorities and targets, and allow service providers to undertake detailed planning for
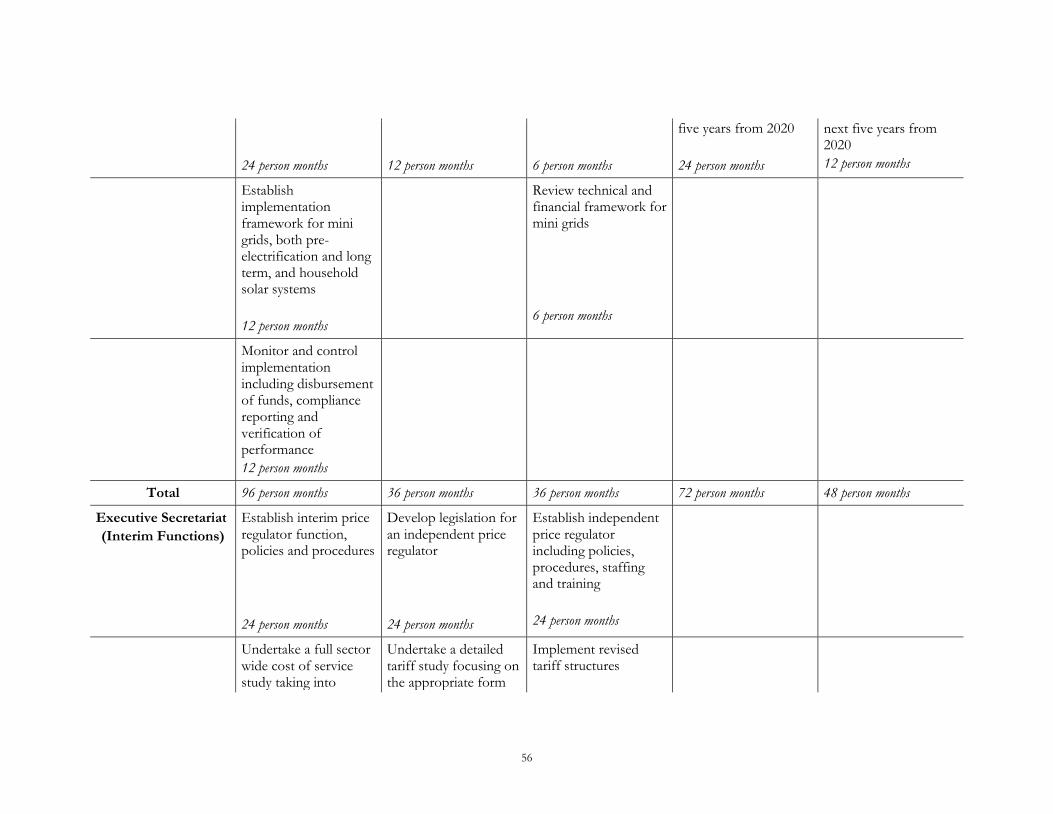
56
24 person months
12 person months
6 person months
five years from 2020
24 person months
next five years from 2020
12 person months
Establish implementation framework for mini grids, both pre-electrification and long term, and household solar systems
12 person months
Review technical and financial framework for mini grids
6 person months
Monitor and control implementation including disbursement of funds, compliance reporting and verification of performance
12 person months
Total 96 person months 36 person months 36 person months 72 person months 48 person months
Executive Secretariat
(Interim Functions)
Establish interim price regulator function, policies and procedures
24 person months
Develop legislation for an independent price regulator
24 person months
Establish independent price regulator including policies, procedures, staffing and training
24 person months
Undertake a full sector wide cost of service study taking into
Undertake a detailed tariff study focusing on the appropriate form
Implement revised tariff structures

57
account current generation, transmission and distribution infrastructure, as well as the additional investment required to support the rollout and load growth on the existing system. The study will determine the current level of cost reflectivity of existing tariffs
30 person months
and structure of tariffs to promote cost reflectivity and economic efficiency. A significant aspect will be the extent to which tariff cross subsidies—for example from business and industrial customers to residential customers—while lessening subsidy requirements may inhibit economic development and expansion by industry
18 person months
Design a subsidy program that will provide estimates of the total funding requirement for the medium to long term and a subsidy mechanism that is appropriately targeted and at a level that will be sustainable for the Government of Myanmar. The subsidy program should outline the medium to long
Implement subsidy program

58
term path to cost reflectivity.
18 person months
12 person months
Total 54 person months 60 person months 36 person months
Department of Rural Development and Ministry of Electric Power
(Sub Franchise Procurement)
Establish policies, clear rules and standard process for potential sub-franchises including obligation to supply, boundaries with YESB and ESE, and wheeling charges and financial structures
24 person months
Set up competitive process for sub franchises in co-operation with the Secretariat and YESB and ESE
24 person months
Policy review of the performance and issues with the sub-franchise initiative
6 person months
Total 24 person months 24 person months 6 person months
YESB and ESE
(Upskilling)
YESB and especially ESE will require large scale up skilling of its technical planning functions to manage the increased number of connections
48 person months
Project management—as the rollout momentum builds, YESB and ESE will require better project management skills so that projects are efficiently implemented, procured, monitored and controlled
48 person months

59
Procurement: YESB and ESE will require support to implement combined and coordinated procurement processes for the materials and services. Procurement will be larger scale and long term and will also be required to conform to donor agency requirements for a competitive and transparent process
36 person months
Training—YESB and ESE will require assistance to train large numbers of skilled and semi-skilled staff. TA will be needed to set up the training program and train the trainers
12 person months
Further large scale training will be required as the scale and pace of the rollout increases.
12 person months
Total 96 person months 60 person months
Banking Sector
(Credit assessment and lending
Establish policies, procedures and systems to facilitate long term lending to

60
assistance) the private sector for electricity infrastructure such as mini-grids and distribution sub-franchises
48 person months
Establish linkages with donor agencies and policies and systems such that local banks can successfully on lend concessional loans in accordance with donor agency requirements
24 person months
Develop and expand new and existing funding sources and secondary markets for long term debt.
48 person months
Review banking sector capabilities to fund or partially fund the next five year phase of the distribution rollout
24 person months
Total 72 person months 48 person months 24 person months
Grand Total 342 person months 228 person months 72 person months 102 person months 48 person months

61
The key institutions requiring support are:
The Executive Secretariat which will have the major role of coordinating the rollout, monitoring progress, and maintaining and updating the Plan
The Ministry of Electric Power (MOEP) as the key electricity sector policy institution
The Department of Rural Development (DRD) as the key rural development institution
The Electricity Supply Enterprise (ESE) and the Yangon Electricity Supply Board (YESB) as the key implementing agencies
The banking sector as it will have a key role providing finance to private sector service providers—particularly for mini grid and household solar systems.
We explain their TA requirements below.
The Role of the Executive Secretariat
We previously outlined the need for effective sector-wide coordination, and for the responsibility for electrification not to be centralized to a single Ministry. We recommended that the Government of Myanmar establish a well-resourced Executive Secretariat to coordinate the program. Technical Assistance will be needed in the following areas:
Maintaining and updating the geospatial and financial plans for the NEP, monitoring the achievement of the electrification targets and modifying and updating the Plan over time, and incorporating learning’s from progress. This a complex technical task, as well as a complex policy task
Managing a coherent financing and funding program for the sector-wide plan, including liaison with donor agencies and the Department of Finance. This will involve meeting the financial control requirements of the donor agencies, and appropriate disbursement of funds to the implementing agencies and banks; and
Help support and coordinate the MOEP and DRD policies that underpin the aspects of the NEP they have policy responsibility
The Executive Secretariat will be the Project Management Office for the Plan. Substantial TA will be required to establish the PMO and its functions, and recruit and train staff. There will also be a need for appropriate systems, policies and administrative procedures.
Interim roles for the Executive Secretariat
While we recommend that the Government de-politicize the setting of electricity tariffs by establishing an independent regulator to determine electricity tariffs, this will take time to implement. In order for the NEP roll-out to begin, it is likely that donor agencies as well as private sector service providers will require some certainty about tariffs and subsidies in order to access financing. While the regulator is being established, we recommend that the Secretariat take on the role as a regulator in the short run. They will require TA to undertake this role. The TA will fund:
A full sector wide cost of service study taking into account current generation, transmission and distribution infrastructure, as well as the additional investment

62
required to support the rollout and load growth on the existing system. This study will determine the current level of cost reflectivity of existing tariffs
A detailed tariff study focusing on the appropriate form and structure of tariffs to promote cost reflectivity and economic efficiency. A significant aspect will be the extent to which tariff cross subsidies—for example from business and industrial customers to residential customers—while lessening subsidy requirements may inhibit economic development and expansion by industry
A subsidy design program that will provide estimates of the total funding requirement for the medium to long term, and a subsidy mechanism that is appropriately targeted and at a level that will be sustainable for the Government of Myanmar. The subsidy program should outline the medium to long term path to cost reflectivity.
Assisting Department of Rural Development and Ministry of Electric Power with Sub-Franchise Procurement
Encouraging concessions for various sub-franchises will greatly speed the roll-out, and will lead to lower costs. It is essential for DRD and MOEP to ensure that the process of sub-franchising be orderly and should encourage competitive procurement. It is likely that these sub-franchises may be most appropriate in rural areas and in States, where electrification rates are low and ESE has minimal resources and infrastructure.
TA will be required to help DRD and MOEP develop clear rules and standard processes for potential sub-franchises. The rules will need to specify the responsibilities of the sub-franchisee (including the obligation to serve the entire population in the area), define the boundaries between the sub-franchise and YESB or ESE as well as other sub-franchises, and set the wheeling charges to be paid by the sub-franchises depending on the extent of its reliance on the ESE’s MV network. A TA program will be required not only to develop the rules, but to co-ordinate the sub franchise initiative in conjunction with the Secretariat, MOEP, and YESB and ESE.
There will also likely be a need for TA to set up a competitive process for these sub-franchises. Under such a tender process, potential sub-franchises will bid the minimum subsidy.
Up-skilling the Capabilities of YESB and ESE
The needs of YESB and ESE as the key service delivery agencies for the rollout are somewhat different in scale. For YESB, the Yangon region already has a high level of electrification—almost 70 per cent—and is already achieving a high rate of connections—approximately 120,000 per year. Thus at current rates of connection YESB will achieve essentially 100 per cent electrification within two years.
By contrast, the majority of new connections required for the remainder of Myanmar will occur in the area which ESE oversees. Further, ESE’s current rate annual rate of 60,000 new connections per year will have to increase by almost tenfold to around 500,000 per year.
This means that there is a greater need to focus on ensuring that ESE has the technical and institutional capabilities to carry out its responsibilities of the roll-out than YESB.
That capability will need to be enhanced in three key areas:

63
Planning and financial control—particularly ESE will require a large scale up skilling of its planning and project management capabilities both at a head office and regional level, as the scale of their construction activities expands almost tenfold. It will also require assistance to implement the systems and procedures needed to ensure appropriate financial controls
Procurement—both ESE and YESB will require assistance to implement a combined and coordinated procurement program for the materials and equipment required for the roll out. Not only will the scale of the procurement be much larger than seen in Myanmar, it will also be long term. The fifteen year timescale of the rollout means that there will be opportunities and efficiencies in long term contracts and relationships for key materials and equipment.
Further, the donor agencies will also have stringent, competitive, and transparent procurement requirements as a condition of providing concessional finance
Training—particularly ESE will require assistance to recruit and train large numbers of skilled, and semi-skilled staff. While much of the training will be done by ESE itself from its internal resources, it is likely that setting up such large scale training will require TA—for example for “train the trainer” programs. In addition, the Government (via the utilities or training institutions) could be expected to contribute to training for the staff who will be eventually employed by private sector service providers.
Assisting Banks to Lend to Private and Community Enterprises
Many of the new connections will be made by private and community enterprises. These will likely be:
Sub-franchises to the ESE and YESB grids
Mini grids—both permanent and pre electrification
House hold solar systems
The entities that will provide the infrastructure and connections in these areas will require financing from the banking sector.
TA will be needed for banks if they were to set up a two-step loan program such as MEB and to understand and manage the credit risks associated with long-term electricity distribution investments.

64
8 Conclusions: Milestones and Accountability
It is clear that looking back on this Roadmap five years from now, its success or failure will be judged by the increase in the electrification rate in Myanmar and the overall performance, including financial stability of the electricity system. However, looking back a year or two from now, how will we know that the Roadmap has been a success?
We suggest the following milestones for the implementation of the Roadmap in the next 12 months:
Milestone 1: the Government of Myanmar formally adopt the Roadmap, including the institutional implementation plan via a Government Decree
Milestone 2: The Government appoint an Executive Secretariat tasked with coordinating the roll-out program and responsible directly to the Vice-President. The Executive Secretariat should be empowered by Decree to act as the single window for cooperation with Myanmar’s development partners in relation to the roll-out program. While various agencies involved in the roll-out (such as the Myanmar International Cooperation Agency being set up by MLFRD as the implementation enterprise) will have direct dealings with donors, the Executive Secretariat should coordinate the overall financing program, and help align donor preferences with the responsibilities of particular agencies
Milestone 3: the Government of Myanmar commence donor pledging process, and continue working with donors to secure the full financing package needed for the implementation of the program
Milestone 4: the Government of Myanmar formally and publically instruct the Executive Secretariat to conduct a tariff study (with appropriate technical assistance), and to conduct public consultation to improve public understanding of the costs of the electricity service and of the required tariff decisions
Milestone 5: the Government of Myanmar appoint advisors to develop a sub-franchising mechanism and standard documentation to facilitate private sector participation in the roll-out program
Milestone 6: the Government of Myanmar make short-term changes to the budgeting process for YESB and ESE to facilitate more independent commercial decision-making, and to encourage and enable both to borrow on their balance sheet.
We recommend that the Office of the Vice-President should hold the overall accountability for the implementation of the NEP, with each Minister being provided with clear delegations of responsibility and corresponding accountability.

65
Appendix A: Successful Electrification Case Studies
This appendix describes relevant international experience referred to in Section 6.
Chile’s competitive subsidy program to promote private initiative
Between 1994 and 2000, Chile followed an innovative, relatively decentralized approach to incentivizing private distribution companies to develop and operate systems in remote rural areas. They did this through creating a competitive subsidy program. This program was regarded as successful, achieving 120,000 new connections and contributing to the goal of 75% rural electrification a year earlier than planned.
The Chilean National Energy Commission (CNE), a Government entity housed within the Ministry for Economy was responsible for allocating yearly funds to Regional Governments across the country. For example, the southern regions received more funding since they had lower electrification rates. The CNE monitored progress, updated high-level plans and targets, and was also responsible for setting performance standards. Regional Governments provided one-time capital subsidies to projects proposed by private distribution companies that had economic benefits greater than costs, but a financial internal rate of return below a predetermined amount. Projects that met both these objective criteria, and had the minimum subsidy requirement per new connection were prioritized, until the limited grant funding for that year was exhausted. As the program grew, elements of it became standardized. For example Regional Governments used standard unit costs to judge the financial and economic viability of projects11.
A decentralized approach still involves a significant role for the Government, but that role focused more on standard setting and provision of support in response to private initiatives, rather than in initiating mini-grid development.
Mali’s mini-grid support program
In practice, there is a continuum between more and less centralized approach—between the government taking a more or less leading role in initiating mini-grid projects. Mali provides an example of a somewhat mixed role for the government. Today Mali is seen as one of the most successful jurisdictions in promoting mini-grids within Africa, with around 60 different operators, and the coverage of mini-grids increasing from 1% in 2006 to 12.5% in 2011. Mali’s rural energy agency AMADER (Agence Malienne pour le Developpment de l’Energie Domestique et de l’Electrification Rurale), supervised by the Ministry of Energy and Water, is a corporation with financial autonomy to support rural electrification projects. National funds and international funding flows for electrification are routed through AMADER. AMADER solicits bids for the electrification of designated high-priority areas—that is those with very low electrification rates. It awards a fixed capital subsidy, which has historically averaged about $750 per connection, to the private promoter that offers the lowest tariff to service the area. This is done because since tariffs for mini-grids are not nationally regulated. In areas where there is more competition from promoters, it adds additional criteria, such as number of connections made in the first two years, and the lowest subsidy per customer. In
11 Source: Douglas Barnes (Editor), The Challenge of Rural Electrification: Strategies for Developing Countries, pg 198-224, Resources for the Future, 2007

66
areas where project developers are hard to come by, AMADER funds feasibility studies, does a high-level design of the project and puts it up for bidding12.
Lao PDR’s SHS delivery model
Lao PDR’s SHS program supports business models that emphasize cost-recovery from operations and the use of low-cost technology.
A specialist entity, the Off-grid Promotion Support (OGS) Office in the Department of Electricity manages and oversees implementation of the SHS program, and other off-grid systems, in Lao PDR since 2001.
Private companies, also known as Provincial Energy Service Companies (PESCOs) help to plan, organize, install and then provide ongoing support to off-grid schemes in rural areas, but in particular SHS. Their mandate and certification criteria were clearly laid out in 2001 by the Ministry of Energy.
Following guidelines set out by OGS, the licensed PESCOs identify villages that qualify, procure the equipment, and employ Village Energy Managers (VEMs) that are responsible for installing the equipment, maintaining it and collecting bills.
PESCOs and VEMs make these systems available to households through hire-purchase agreements. Households can make monthly payments over five or 10 years, after which they own the systems. This enables households that cannot afford the $300 installation coststo acquire SHS, and pay back the costs in US$1 to US$2 monthly repayments.
These customer payments flow into a revolving fund that finances the costs of installation, management, maintenance, and payment collection. Additional grant funding is contributed to this revolving fund by donors and the Government. Together this allows for financing of additional systems for distribution to new customers.13
Currently, over 19,000 households have been provided with SHS through this program. These installations recover their full operational costs, and partial capital costs.
While the program has many successful elements, there are concerns about the complexity of the business model. The model involves many players and layers, leading to high overhead costs which represent a significant amount of the total cost of the program. The actual funds available to the revolving fund for reinvestment are reduced to a smaller amount than expected. There is a question about the extent to which high overhead costs are compensated by the increased efficiency and sustainability of delivery. Further, while the rate of user non-payment is low, the remittance of funds to the revolving fund has been less reliable than expected.
Bangladesh’s SHS delivery model
Bangladesh has adopted a more private sector driven approach to SHS promotion than Lao PDR, which has also been seen as successful. In 1997, the Bangladeshi Government established the Infrastructure Development Company Limited (IDCOL)—an autonomous
12 Source: Bernard Tenenbaum, Chris Graecan, Tilak Siyambalapitiya and James Knuckes, “From the Bottom Up: How
Small Power Producers and Mini-Grids Deliver Electrification and Renewable Energy in Africa,” pg 37 and ESMAP AFREA presentation
13 Source: pg 27-30, Power to the People: Twenty Years if National Electrification in Lao PDR, World Bank, 2012,

67
financing entity that promotes private sector participation and cost recovery in the delivery of SHS and other renewables, particularly in rural areas.
IDCOL has played a key role in building and expanding the SHS market in Bangladesh by establishing SHS product certification, supported by a subsidy incentive plan.
The Government of Bangladesh finances IDCOL at 3 percent, and acts as a conduit for financing by the Asian Development Bank, the German Development Agency (GIZ), the Islamic Development Bank, the Global Environment Facility, and the World Bank Group. For an SHS bought with a three-year credit with a 15 percent down payment, IDCOL lends to the private distributor (POs) 80 percent of the amount borrowed at 6 to 8 percent over 7 to 10 years, with a one-to-two-year grace period.
Using this capital, firms that are approved as suppliers of products with IDCOL’s technical specifications on-lend to customers at an annual interest rate equivalent to 15 percent. In addition to providing the system, these firms are also expected to develop a robust market chain for SHS systems so that it sustains beyond the period of intervention by IDCOL.14
1.9 million households in rural areas have been electrified through this program as of 2013.15
The Right Institutional Choice: Thailand’s Remarkable Grid-based Electrification Expansion Program Plans for Thailand’s grid based rural electrification began in 1972, when a mere 10 percent of people living outside Bangkok had electricity. Thirty years later, more than 99 percent of Thailand’s villages were electrified.
The general idea behind the dramatically successful electrification program was to target villages with the lowest costs and highest demand for electricity, that would set a sound financial base for future expansion in more remote areas. The electrification efforts were led and managed by the Provincial Electrification Authority (PEA), an autonomous Government agency responsible for electricity distribution, with complete control over budget and program implementation.
PEA’s ability to solely focus on areas outside metropolitan areas, and incentives to manage costs were major factors in the program’s success. The PEA adopted a number of innovative and practical strategies to remain financially sound, and remain highly efficient throughout the electrification period:
To avoid political interference the PEA developed a methodology for village selection. It allocated villages through an analysis of their socioeconomic conditions, and predicted the level of electricity use for households that did not have electricity at the time
To minimize system construction costs, the PEA instituted a far-reaching policy of system standardization, including technical, equipment and other components
14 Source: pg From Gap to Opportunity: Business Models for Scaling Up Energy Access, IFC publication, 2012
15 Pg 3, Hussain A. Samada, Shahidur R. Khandkerb, M. Asaduzzamanc, Mohammad Yunus, “The Benefits of Solar Home Systems: An Analysis from Bangladesh,” World Bank Research Pape,r 2013

68
To increase local participation the PEA and help lower the financial burden, on many occasions PEA worked with the villagers who provided free labor and animal transport. Subsequently such workers received training to perform higher skilled jobs in neighboring areas and earned wages, increasing overall support for the program
Finally a smart pricing policy enabled the PEA to realize a reasonable return on investments and retain sufficient funds to finance system expansion. The PEA lobbied for, and benefitted from a bulk power cross-subsidy from urban to rural customers. The national generation utility (EGAT) charged the PEA 30 percent less for bulk power sales than it charged the Metropolitan Electrification Authority—the entity responsible for distribution in urban areas.
“The State and the People Work Together, the Central and Local Work Together”: Vietnam’s motto for Rapid Electrification
Starting from a base of 2.5 percent in 1975, today Vietnam is being heralded as the developing country with the highest rate of rural electrification by the World Bank. Close to 98 percent of total households in Vietnam are connected to the grid.
The country has relied on central, decentralized, and international support for the rapid and effective implementation of its electrification program. The Central Government and Provincial and Local Authorities agreed on a locally centered institutional framework, involving communities closely in the management and operation of local LV networks as well as to build a large, responsible customer base. A special effort was made to ensure clear communication to all stakeholders. The Central Government, EVN (national generation, transmission and distribution utility), and the World Bank worked together in formulating policies and projects and to solve problems. Two key features set the model apart, and contributed to its success:
Sustainable Funding and Financing: Funds to support the large scale electrification were mobilized from practically every source, and in different ways. The Central Government always reserved funds to support the program, even when the budget was scarce. Communal, district, provincial budgets were also used to support the efforts. A cross-subsidy program was adopted, wherein each kWh consumed by customers in urban areas was subject to a surcharge to support the development of rural networks. Customers were directly asked to pay for a share of the infrastructure costs of bringing the grid to their area. Several agriculture cooperatives and communes borrowed from commercial banks to finance the development of the LV system in their areas. And finally, various donor agencies started supporting the program in a big way from 1996 onwards, offering soft loans and technical assistance
Local Community Involvement and Capacity Building: The Government and EVN tried to include local communities to the extent possible from planning to construction to operation. For example they provided training to a large number of local people, who then became service agents responsible for routine technical and commercial operations and maintenance, such as meter reading, billing, collections, monitoring of rights-of-way, and minor repair of in-house wiring. This helped to speed communication, reduce the incidence of non-payment because of a sense of local ownership, help lower operation and

69
maintenance costs, and provide jobs. Additionally, during the construction of individual local networks, local participants were given an opportunity to bid for construction contracts or provide other services in support of construction. Local authorities were given the authority to approve the completion of all local contracts by the contractors. As a result of this approach, more than 600 contracts were assigned to local contractors, enabling more rapid buildup of networks. Unified national technical standards from the 1990s, allowed for high quality work, but did not preclude local participation.
Public Utility Driven Grid Extension in Lao PDR
The Government of Laos made a strong commitment and set targets for electrification. Electrification increased from 15% of the population in 1995 to 84% in 2011 (ahead of the targets set in 2002, which aimed for 70% by 2010 and 80% by 2015). The Government is now aiming for 90% electrification by 2020.
The targets are being achieved through establishing a strong implementation capacity in Electricity du Laos (EdL), the national utility. These included:
Capacity building since mid 1990s, when the World Bank started the first rural electrification project
Efficiency in system planning, procurement, installation and commissioning
A comprehensive system loss reduction program to reduce distribution system losses (and thus cost of services), with system loss declining to about 20% in 2005 and to 10% in 2010, along with the fast expansion of the distribution system into rural areas.
The roll-out program was underpinned by a programmatic approach to tariff reform to ensure cost recovery and a profit margin for EdL and strong Government support to Electricity du Laos (EdL), a public utility company, to expand access to electricity services.
The tariff regime provided for cross-subsidies among consumer categories to ensure (i) affordability of rural housheolds; and (ii) weighted average tariff cover the weighted cost of services. However, financial support was provided to EdL when tariff did not cover the cost. A cost-recovery based tariff regime received strong endorsement from the Government.
EdL was further supported with concessional loans for rural electrification projects.
.
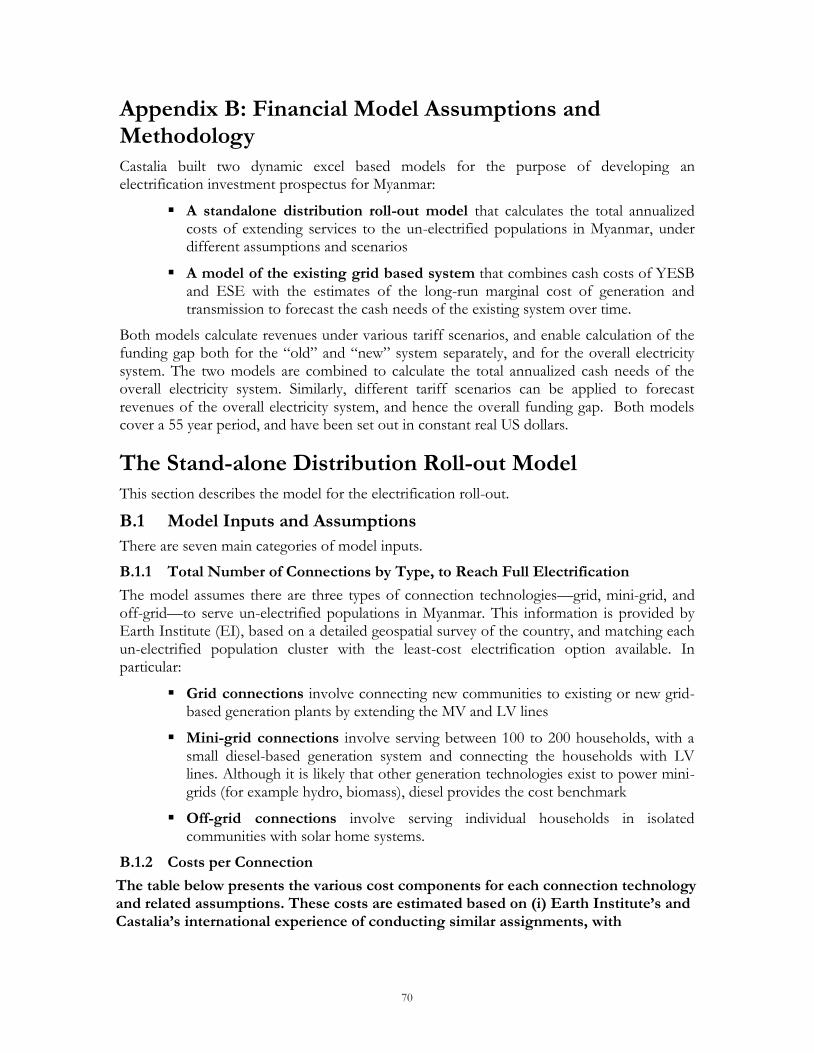
70
Appendix B: Financial Model Assumptions and Methodology
Castalia built two dynamic excel based models for the purpose of developing an electrification investment prospectus for Myanmar:
A standalone distribution roll-out model that calculates the total annualized costs of extending services to the un-electrified populations in Myanmar, under different assumptions and scenarios
A model of the existing grid based system that combines cash costs of YESB and ESE with the estimates of the long-run marginal cost of generation and transmission to forecast the cash needs of the existing system over time.
Both models calculate revenues under various tariff scenarios, and enable calculation of the funding gap both for the “old” and “new” system separately, and for the overall electricity system. The two models are combined to calculate the total annualized cash needs of the overall electricity system. Similarly, different tariff scenarios can be applied to forecast revenues of the overall electricity system, and hence the overall funding gap. Both models cover a 55 year period, and have been set out in constant real US dollars.
The Stand-alone Distribution Roll-out Model
This section describes the model for the electrification roll-out.
B.1 Model Inputs and Assumptions
There are seven main categories of model inputs.
B.1.1 Total Number of Connections by Type, to Reach Full Electrification
The model assumes there are three types of connection technologies—grid, mini-grid, and off-grid—to serve un-electrified populations in Myanmar. This information is provided by Earth Institute (EI), based on a detailed geospatial survey of the country, and matching each un-electrified population cluster with the least-cost electrification option available. In particular:
Grid connections involve connecting new communities to existing or new grid-based generation plants by extending the MV and LV lines
Mini-grid connections involve serving between 100 to 200 households, with a small diesel-based generation system and connecting the households with LV lines. Although it is likely that other generation technologies exist to power mini-grids (for example hydro, biomass), diesel provides the cost benchmark
Off-grid connections involve serving individual households in isolated communities with solar home systems.
B.1.2 Costs per Connection
The table below presents the various cost components for each connection technology and related assumptions. These costs are estimated based on (i) Earth Institute’s and Castalia’s international experience of conducting similar assignments, with

71
adjustments for the local context in Myanmar, (ii) data provided by ESE and YESB16. Table B.1:Grid-based Cost Components
Cost Component Number or Range Assumed
LV lines 100US$/connection
Service Drop, Meter etc 200US$/connection
Transformer 21-50US$/connection
MV lines 0-500US$/connection
O&M on LV lines 1US$/connection/year
O&M on service drop, meter etc 2US$/connection/year
Annual meter reading cost 5US$/connection/year
Levelized Cost of Generation 0.09US$/kWh
Transmission 0.02US$/kWh
O&M on Transformer 0.65-1.5 US$/connection/year
O&M on MV lines 0-5 US$/connection/year
For mini-grid based connections:
Table B.2: Mini grid-based Cost Components
Cost Component Number or Range Assumed
LV lines 100 US$/connection
Diesel generator 139 US$/connection
O&M on LV lines 1 US$/connection/year
O&M on diesel generator 1.4 US$/connection/year
Diesel Costs 1.10 US$/per liter
For off-grid connections:
Table B.3: Off grid-based Cost Components
Cost Component Number or Range Assumed
Solar panel 845 US$/connection
16 Note that only the cost estimates for permanent grid, mini-grid and off-grid solutions are shown, since prelectrification
connection costs can vary substantially. See accompanying EI report on cost assumptions for prelectrification

72
Solar battery 1,014 US$/connection
Solar balance of system 423 US$/connection
O&M on Solar Panel 42US$/connection/year
Solar Battery 51US$/connection/year
Solar Balance of System 21US$/connection/year
We assume that any asset with a lifetime less than 25 years would be replaced. The asset lifetimes were provided by EI. The replacement value is assumed to equal the initial capital cost of the asset in real terms.
Table B.4: Assets that need to be Replaced
Asset Lifetime Cost
Meter 10 years US$100
Diesel generator 10 years U$845
Solar battery 3 years US$1014
Solar balance of system 10 years US$423
B.1.3 Sequence of Connection Roll-out
For grid connections—since the capital costs of grid based connections vary from one location to another, given the distance from the existing MV network and the size of the community being served (which affects transformer cost per connection), EI provided us with a least cost roll out sequence for making grid-based connections. An example is presented below.
Table B.5: Partial Snapshot of EI Roll out Sequence Algorithm Output
Source: EI

73
For non-grid connections—there is no least-cost sequence for off-grid and mini-grid connections, because they are isolated and self-sufficient systems and do not depend on existing networks. As a result, each mini-grid and off-grid system is assumed to cost about the same.
B.1.4 Demand
After holding discussions with ESE and YESB, and collecting statistics on average demand for currently connected households in Myanmar from MOEP, we assume that:
Each newly connected household will consume 350kWh/connection in the first year of connection
The household’s demand will continue to grow in each subsequent year following connection, until a steady state is reached in year 5, of 1000kWh per year per connection, after which there is a 3 percent annual growth rate per connection. This is consistent with observations from electrification projects from around the world. As households begin to appreciate the value that electricity brings, they are likely to buy more appliances and thus consume more electricity. The assumed demand growth profile is shown below:
Table B.6: Annual Baseline Demand Growth Profile (Base Case)
Source: Castalia model
It is important to note that although these numbers were used in the baseline scenario, the model has been built with the flexibility to change demand projections.
B.1.5 Revenue
There are two sources of revenue from customers: electricity tariffs for units of electricity consumed, and one-off connection fees charged for making a new connection.
Castalia assumed the following base case electricity tariffs and connection scenarios:
Table B.7: Customer Connection Charges and Tariffs (Base Case)
Customer Type
Tariff & Growth Rate
Basis for Assumption Connection Charge & Growth Rate
Basis for Assumption
Grid Connection
0.037 US$/kWh; 0% growth
Although industrial connections have not been explicitly modeled, at least 5% of connections would be industrial. We then take the weighted average of the
US$90/connection; 0% growth
Based on ESE existing connection charges 2013 for making grid based
Starting consumption in first year MOEP kWh/ year 350
Steady state consumption MOEP kWh/ year 1,000
Number of years to end consumption rate years 5
Annual electricity consumption per connection
Growth after steady state year assume 3% growth 3%
Years since connection 1 2 3 4 5 6
Grid Castalia (assumed S curve)kWh/ year 350 513 675 838 1,000 1,030
Mini-grid Castalia (assumed S curve)kWh/ year 350 513 675 838 1,000 1,030
Off-grid Castalia (assumed S curve)kWh/ year 350 513 675 838 1,000 1,030

74
existing industrial tariff at 75kyat/kWh (0.075US$/kWh), and the existing household tariff at 35kyat/kwh (0.035US$/kWh)
connections
Mini-grid Connection
0.065US$/kWh 0% growth
Based on anecdotal evidence, and data provided by MOEP (licenses of existing mini-grid operators), we assume mini-grid tariffs are 1.75X grid tariffs
US$90/connection; 0% growth
Assumed to be the same as grid based connections
Off-grid Connection
0US$/kWh; 0% growth
Since homeowners own the system, they do not pay for the electricity generated
US$90/connection; 0% growth
Assumed to be the same as grid based connections
Note that once again these numbers were used in the baseline scenario, but the model has been built with the flexibility to change the tariff and connection fee scenarios—including the base rate and the growth rate.
B.1.6 Financing
The model assumes that all capital expenditures will be financed. We model key loan terms, including grace periods, tenor and interest rates.
In the base case, we model loan terms along IDA lines:
An annual interest rate of 1.25%
A five year grace period on principal repayment
A 25 year loan duration
No grace period on interest payment
Additionally, the model has the ability to include multiple sources of loan financing that are arranged from least expensive to most expensive. As the cheaper loan source is exhausted, it automatically moves to the more expensive loan source. A snapshot from the model shows how this is organized:
75
Figure 8.1: Snapshot of Financing Input Assumptions
Source: Castalia Model
B.1.7 Annual Connections Ramp up Profile by Type
Since least-cost roll-out plan focuses on the total number of connections that need to be made and the sequencing, Castalia made assumptions for the annual number of connections to be done in any given year.
The model allows the flexibility to create other roll out scenarios by:
Choosing whether the connections are (i) being arranged in a least-cost order nationally—that is the cheapest connections are chosen first no matter where they occur in the country, (ii) being arranged in a least-cost order by state—that is the roll out is sequenced for each state independently, starting from exiting grid and high demand centers in each state
Extend or reduce the roll out period. For example, 100 percent electrification can be completed in 2035 instead of 2030
Change the total number of connections (grid, mini-grid, off-grid) done in any given year, as long by the end of the roll-out period the total number of connections match EI’s calculations
Customize the roll out for a particular state. For example it is possible to completely ignore a state, or alternatively fix the number of connections that come from that particular state
Change pre-electrification connections
Note that despite this flexibility, in all cases the grid connections that contribute to the total will be ordered in a least cost sequence.
B.2 How the Model Works
The following steps summarize how the model works.
Option 1
Source of loan World Bank / IDA
Maximum Drawdown $2,000 USD millions
Interest Rate 1.25% percent
Principal Repayment Grace Period 5 years
Term of Loan 25 years
Start year 1 year
Expiry 30 years
Interest Payment Grace Period 0 years
Option 2
Source of loan Asian Development Bank
Maximum Drawdown $15 USD millions
Interest Rate 2.00% percent
Grace Period 5 years
Term of Loan 25 years
Start year 3 year
Expiry 8 years
Interest Payment Grace Period 0 years
Option 3
Source of loan JICA

76
Step 1: Links Connection Scenarios (or Annual Connections Profile) to Least-Cost Roll out Order
The model first links the total number of annual connections (under any given connection scenario) to be done, with the least cost grid roll out sequence. This ensures that in any given year, the cheapest connections are indeed being selected first. Note that this only applies to grid connections since non-grid connections are not arranged in any particular order.
Step 2: Aggregates total costs in each year
There are three cost categories. We elaborate on how they are aggregated:
The total capital costs (initial costs plus replacement costs) per connection in each year, is multiplied by the total number of connections in that year. The capital costs are separated by grid, mini-grid, and off-grid
Since the operating costs are recurrent, a schedule is created that multiplies the total operating cost per connection in that year, by the number of connections in that year. This cost is then incurred every year for the entire duration of the model. Operating cost schedules are separated by grid, mini-grid and off-grid
Financing costs are calculated by creating a schedule that adds up for every annual loan amount drawn (i) the annual principal repayment and (ii) the interest amount due over time.
Step 3: Aggregates total revenues in each year
There are two sources of revenue. These are aggregated in the following way:
To aggregate tariff revenues, the tariff for a particular year is multiplied by the amount of electricity consumed in that year. This is broken down by grid and mini-grid, since they each have different tariff and electricity consumption levels
To aggregate connections fees, the connection fee in any given year is multiplied by the number of new connections. This is separated by connection fees earned from grid, mini-grid and off grid connections.
Step 4: Compiles total cost and revenue cashflows
The annual cashflows from the cost categories and revenue categories are brought together on to a single sheet. Adding and subtracting these various cash streams results in different outputs.
B.3 Model Outputs
The outputs produced by the model are closely interrelated:
The annual financing need—this is effectively the same as the total capital costs (capex), since we assume that all the capex will need to be financed, and that there is enough financing available to cover capex
Annual operating subsidy—this takes the total revenues in each year and subtracts it from the total operating costs in each year. If this number is positive, it results in a surplus, if it is negative it results in a deficit. An operating subsidy from the government is needed to fill this deficit
Annual funding gap—this is calculated using the following formula:

77
(Annual Revenue + Annual Upfront Financing Received) – (Annual Capital Cost + Operating Cost + Annual Interest & Principal Repayment)
If the revenues and financing received is less than the sum of the costs, the government must intervene to fill the gap.
PV of the funding gap—this is simply the present value of the annual funding gap, discounted at a ten percent social discount rate.
These outputs can be altered by changing the following:
Annual connections ramp up, or connections scenarios
Tariff and connection fee projections
Demand projections
Financing terms

T: +1 (202) 466-6790 F: +1 (202) 466-6797 1747 Pennsylvania Avenue NW 12th Floor WASHINGTON DC 20006 United States of America T: +61 (2) 9231 6862 F: +61 (2) 9231 3847 36 – 38 Young Street SYDNEY NSW 2000 Australia T: +64 (4) 913 2800 F: +64 (4) 913 2808 Level 2, 88 The Terrace PO Box 10-225 WELLINGTON 6143 New Zealand T: +33 (1) 45 27 24 55 F: +33 (1) 45 20 17 69 7 Rue Claude Chahu PARIS 75116 France ------------- www.castalia-advisors.com