myles.al.maximing economic impact from festivals · measuring the economic returns from festivals...
TRANSCRIPT

Measuring the Economic Returns from Festivals and Special Events• Al Myles, Extension Professor, Agricultural Economics Department and Interim Associate Director,
Southern Rural Development Center• Rachael Carter, Project Manager, Stennis Institute of Government • Jason Barrett, Extension Associate, Agricultural Economics DepartmentAll at Mississippi State University
Accepted for presentation at the 8th Annual Conference of the National Association of Community Development Extension Professionals
May 20 – 23, 2012Park City, Utah
WHY MEASURE THE IMPACT OF FESTIVALS AND SPECIAL?Provide Tourism Managers and Directors with data about the effectiveness of activities and programs carried out in the community
Encourage Support for the tourism in the community
Improve Decision Making
Enhance Tourism Opportunities in community
Increase Revenue, Employment, and Income in the community
Introduction• Festivals and special events play an important role in the
development of communities.• These events are growing forms of tourism, especially in rural
areas that are struggling to revitalize local economies and drawing people to these areas.
• It is important to recognize that festivals and events are attractions that have drawing power and staying power. This means that they not only bring in new visitors, but they help to keep visitors in the area longer.
Length of Events• Events can range from one day to one week in duration.• The types of visitors will vary.• Research suggests that participant-based events may yield
greater expenditure per person than spectator-based events.

Size of Events• Size of events vary, and larger events have greater potential
economic impact because of attendance and media coverage.• The economic impact of events may differ due to the length,
size, and type of event developed and the market attracted to that event.
• Therefore, it is also useful to classify events to assess economic performance against other types of events.
Factors Contributing to a Successful Event• Increasing visitor length of stay in region/town• Increasing visitor expenditure in region/town• Increasing destination awareness• Increasing civic pride or community supportThese factors are obviously beneficial to an area and its tourism industry, although the cost at which they are obtained must be justified.
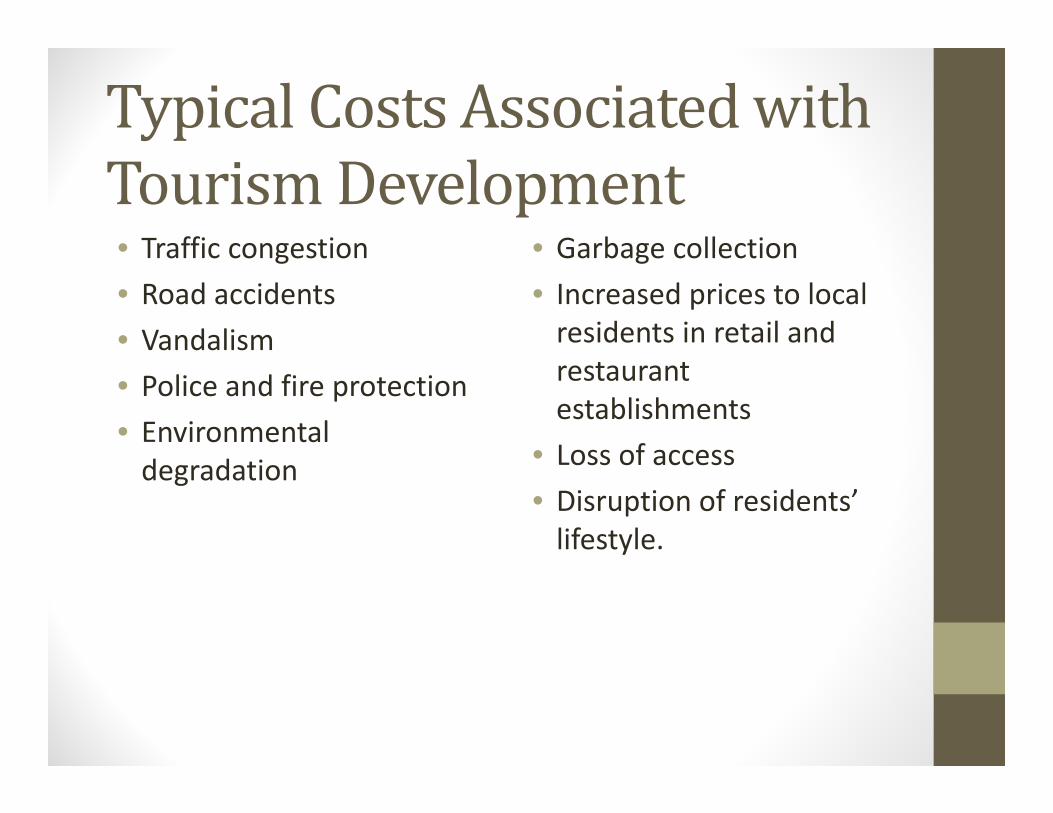
Typical Costs Associated with Tourism Development• Traffic congestion• Road accidents• Vandalism• Police and fire protection• Environmental
degradation
• Garbage collection• Increased prices to local
residents in retail and restaurant establishments
• Loss of access• Disruption of residents’
lifestyle.
Methods, Data Collection, and Information In measuring tourism economic impact many issues must
be reviewed, including questionnaire design, sampling of event participants, data processing, the development of multipliers for the area just to name a few.
One of the main methods of data or information collection required to measure the economic benefits of festivals and special events to the host community is the participant or visitor survey.

• Using this type of survey, it is easier to ask visitors about their spending and behavior patterns.
• The survey also gives the community opportunities to ask the participants some demographic-based questions to assist in the compilation of a market profile.

Data and Information Collection• The main method of data collection is the
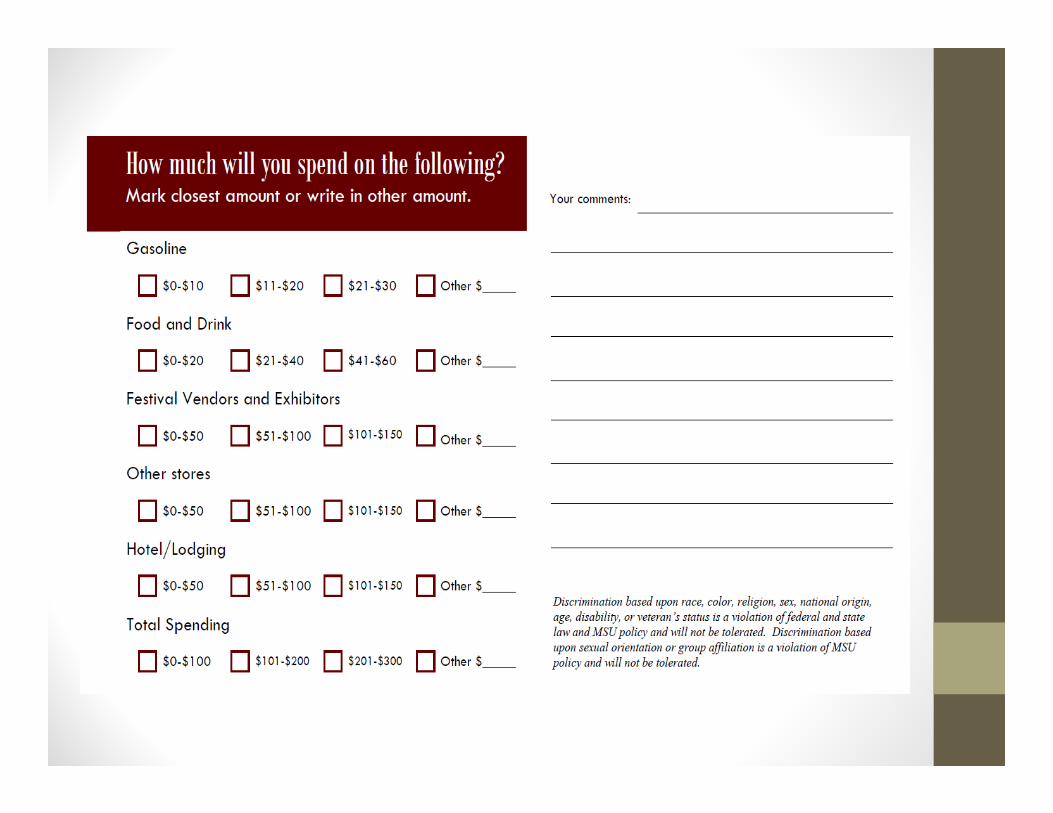
participant or visitor survey.• Types of questions to ask:
• Demographic information• Spending patterns• Event specific information• Others
• Is the tourist in town specifically for the event?• How long is the tourist staying?• Where will the tourist be staying?
Data Entry• Data must be entered accurately• Analysis can be performed using Microsoft Excel.
• SPSS can also be used, but is not required.
Assessing non-local participant numbers• Spending by non-local participants is the spending that is used
for the economic impact assessment.• Spending by local participants does not increase the
“economic pie” of the area.

Table 1. Projected Total Attendance at the Market Street Arts and Crafts Festival, 2011
In-State Number
Non-local (NL) 2,949
Local (L) 26,827
Out of State (OFS) 4,315
Total 34,091
How Do We Measure the Economic Impact of F&SE?There are many ways to measure the economic value of and industry or event. • Evaluate the costs and benefits to the host community, which
include measuring direct costs and revenues to organizers.• Measure total attendance, visitor expenditures, vendor
expenditures and revenues, plus organizers’ expenditures.• Estimate direct and indirect economic benefits, including
employment, value-added income, and taxes.
ModelsTwo of the most usual economic models for performing this type of analysis are the IMPLAN Input-Output model and Benefit-Cost Analysis.
• Input-output models create linkages between industries in the local economy.
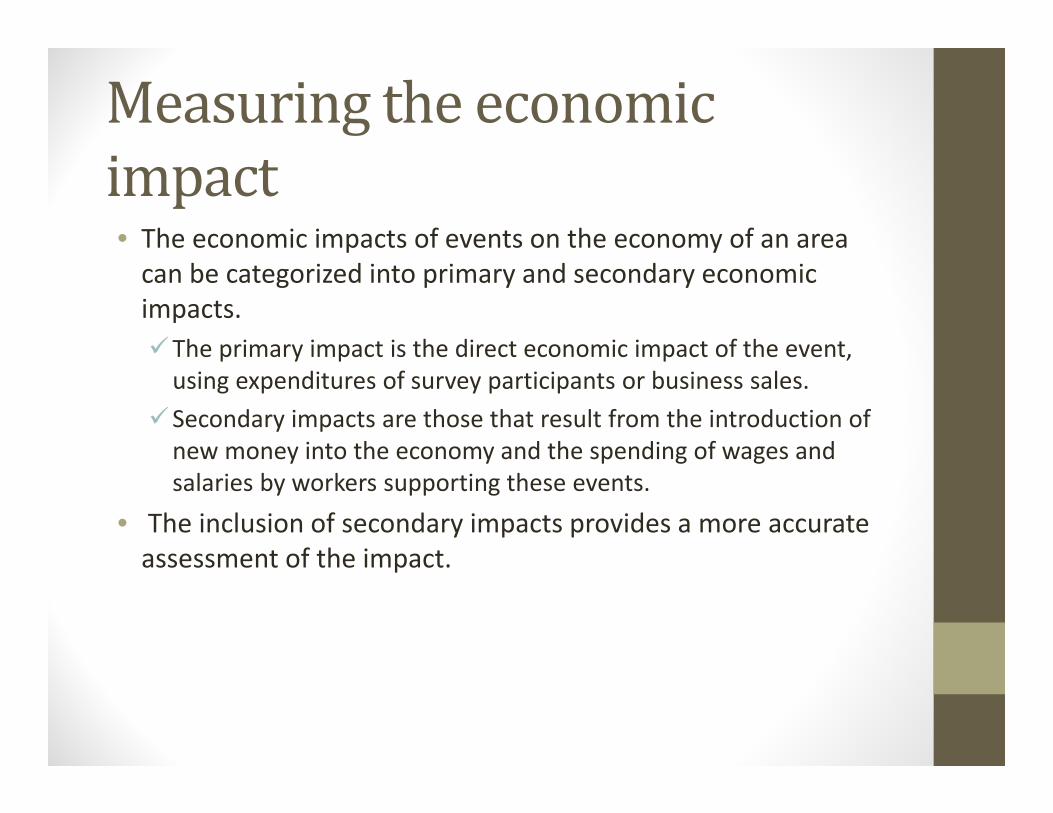
Measuring the economic impact• The economic impacts of events on the economy of an area
can be categorized into primary and secondary economic impacts. The primary impact is the direct economic impact of the event,
using expenditures of survey participants or business sales. Secondary impacts are those that result from the introduction of
new money into the economy and the spending of wages and salaries by workers supporting these events.
• The inclusion of secondary impacts provides a more accurate assessment of the impact.
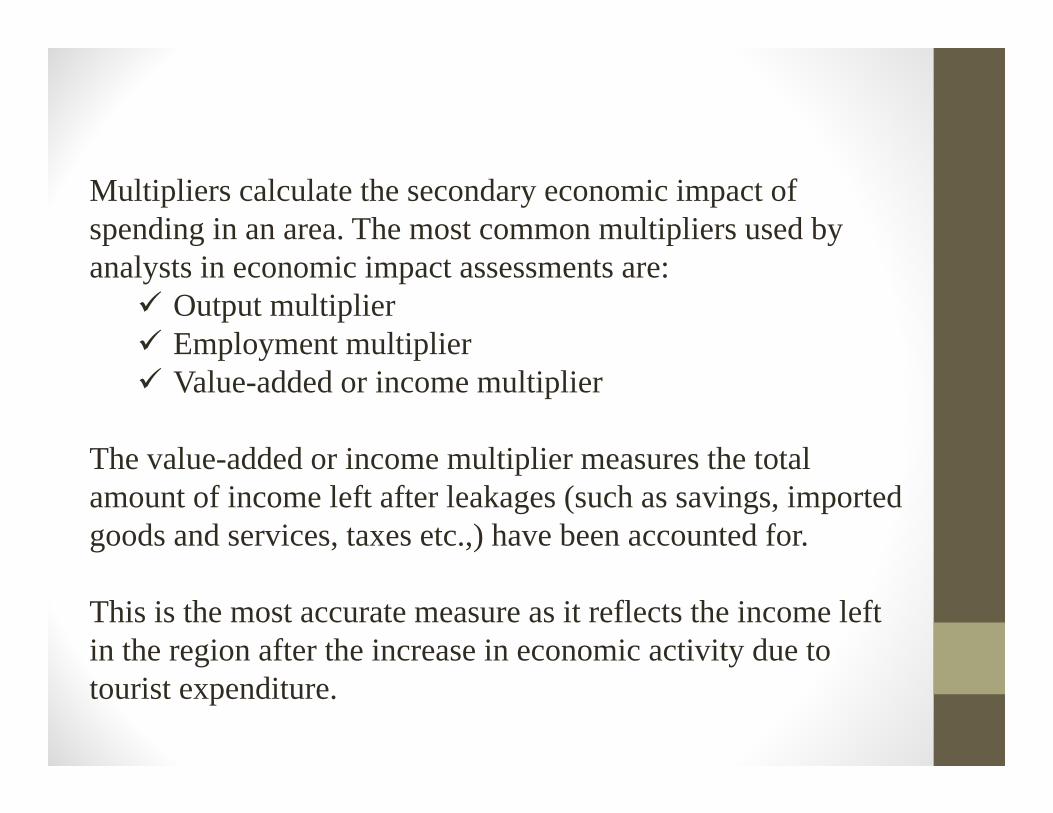
Multipliers calculate the secondary economic impact of spending in an area. The most common multipliers used by analysts in economic impact assessments are: Output multiplier Employment multiplier Value-added or income multiplier
The value-added or income multiplier measures the total amount of income left after leakages (such as savings, imported goods and services, taxes etc.,) have been accounted for.
This is the most accurate measure as it reflects the income left in the region after the increase in economic activity due to tourist expenditure.
DESCRIBING THE ECONOMIC IMPACTS AND RETURNSExamples from the 2011 Market Street Arts and Crafts Festival

Direct Impact• The number of non-local participants should be multiplied by
the average spending of these participantsTable 4. Estimated Spending by Visitors with Local Retailers and Vendors at the Market Street Arts and Crafts Festival, 2011
Expense*
In-State: Local
In-State: Non-local
Out-of-State Total
Food Services and Drinking Establishments (Restaurants, Concessions, Bars) $1,451,150 $38,914 $534,502 $2,024,567
General Merchandise Stores (Clothing, Souvenirs, Gifts, etc.) 587,002.08 49,515.33 680,108 $1,316,625
Hotel Lodging and Accommodations 601,837.65 46,965.76 645,089 $1,293,892
Purchases from Vendors and Exhibitors at Festival 575,737.44 54,895.05 754,000 $1,384,632
Gasoline 447,386.08 57,969.17 796,224 $1,301,579
Total $3,663,114 $248,260 $3,409,923 $7,321,297
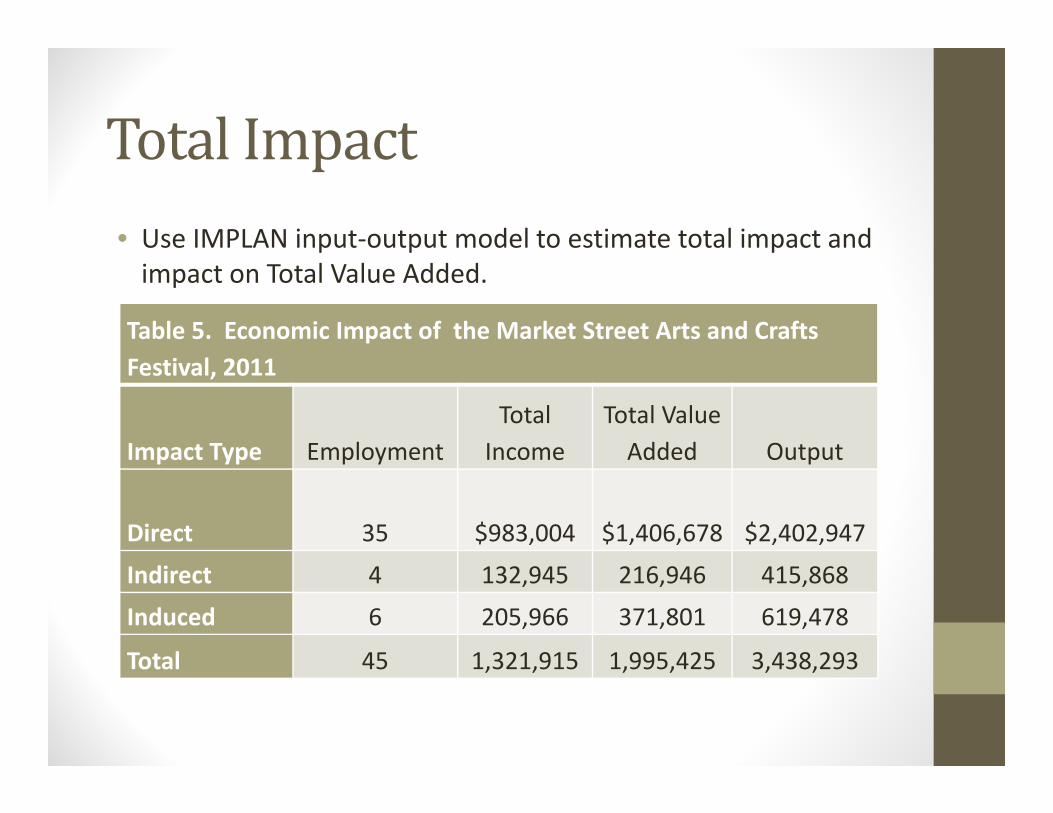
Total Impact• Use IMPLAN input-output model to estimate total impact and
impact on Total Value Added.
Table 5. Economic Impact of the Market Street Arts and Crafts Festival, 2011
Impact Type EmploymentTotal
IncomeTotal Value
Added Output
Direct 35 $983,004 $1,406,678 $2,402,947Indirect 4 132,945 216,946 415,868Induced 6 205,966 371,801 619,478
Total 45 1,321,915 1,995,425 3,438,293
Public Finances• Local government revenues associated with these types of
events come from sales taxes on visitors’ spending.

Impact of Market Street Arts and Crafts Festival on Sales Tax Receipts, 2011Item Amount
Food Services and Drinking Establishments (Restaurants, Concessions, Bars)
$26,218
General Merchandise Stores (Clothing, Souvenirs, Gifts, etc.) 17,050
Hotel Lodging and Accommodations 16,756
Purchases from Vendors and Exhibitors Present at Festival. 17,931
Gasoline 16,855Total $94,811 Source: Estimates derived as 7% statewide retail sales tax times municipal share of retail taxes (18.5 percent) times total unadjusted spending of $7.3 million by festival goers.

Impacts Resulting from Festivals and Special Events• Increased expenditures• Creation of employment• Increase in labor supply• Increase in public finances (sales tax receipts)• Increase in standard of living• Increased awareness of the area as a travel/tourism
destination

Benefit–Cost Analysis• BCA is a systematic process for calculating and comparing
benefits and costs of projects. Projects can range from dams and highways to tourism to training programs and health care systems.
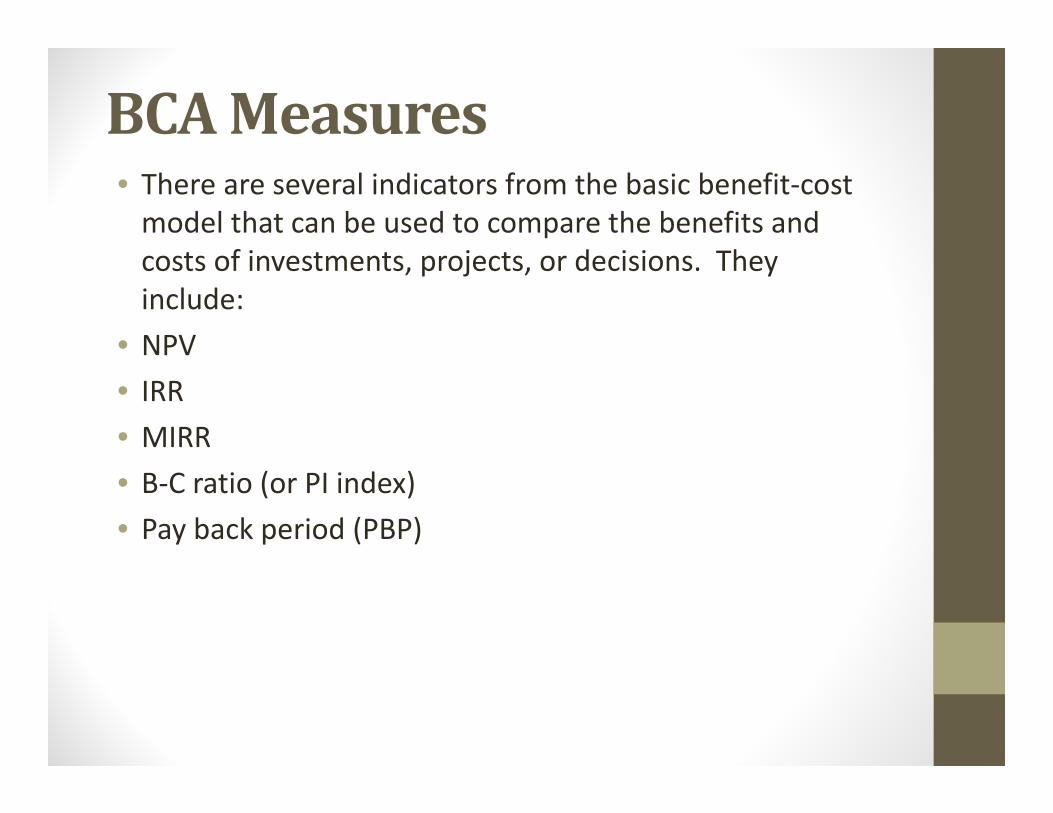
BCA Measures• There are several indicators from the basic benefit-cost
model that can be used to compare the benefits and costs of investments, projects, or decisions. They include:
• NPV• IRR• MIRR• B-C ratio (or PI index)• Pay back period (PBP)
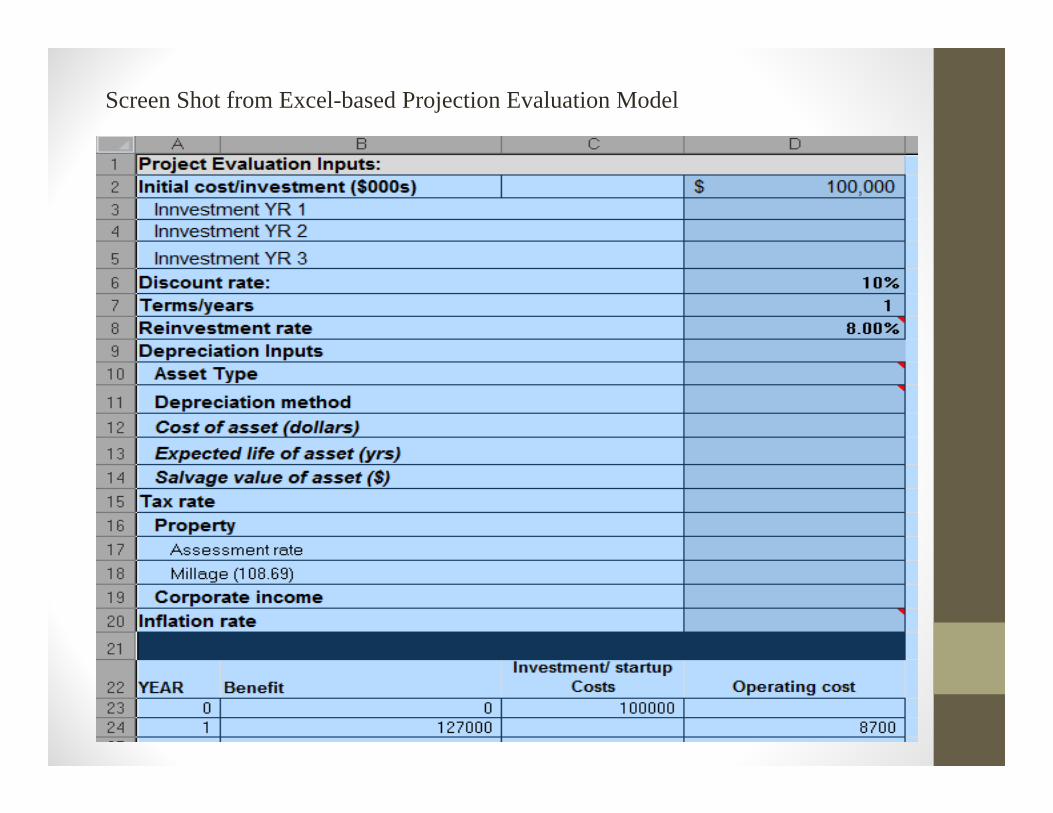
Screen Shot from Excel-based Projection Evaluation Model
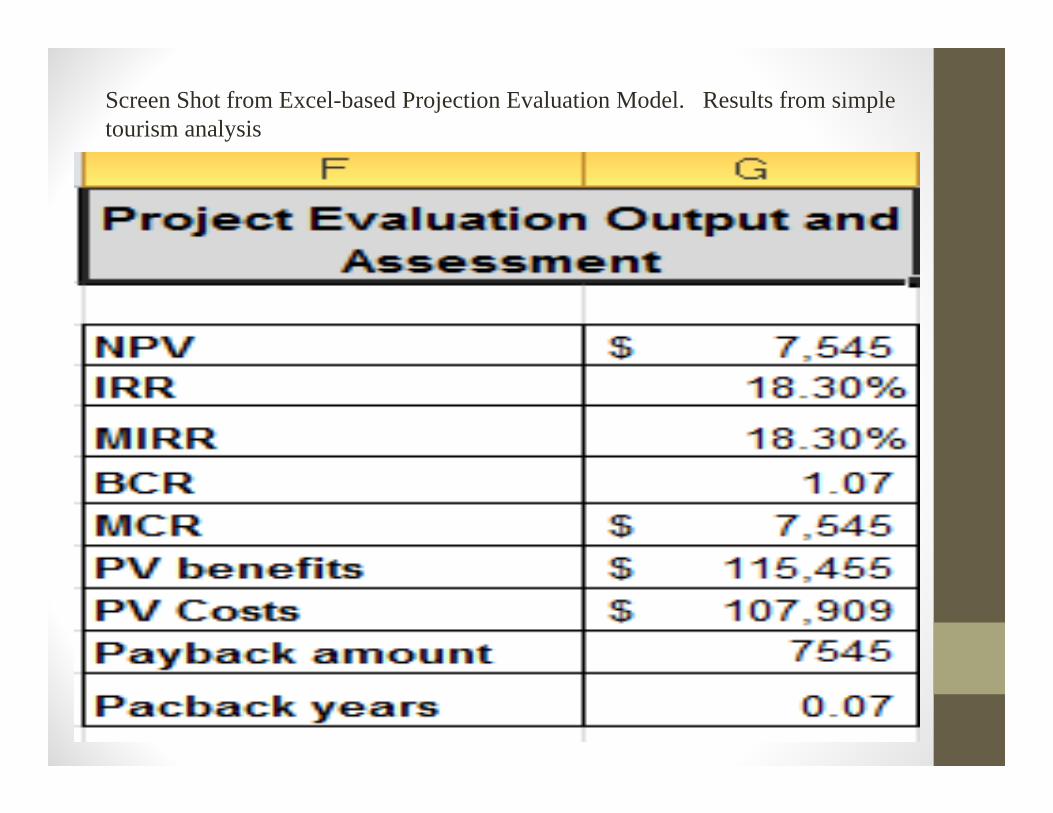
Screen Shot from Excel-based Projection Evaluation Model. Results from simple tourism analysis
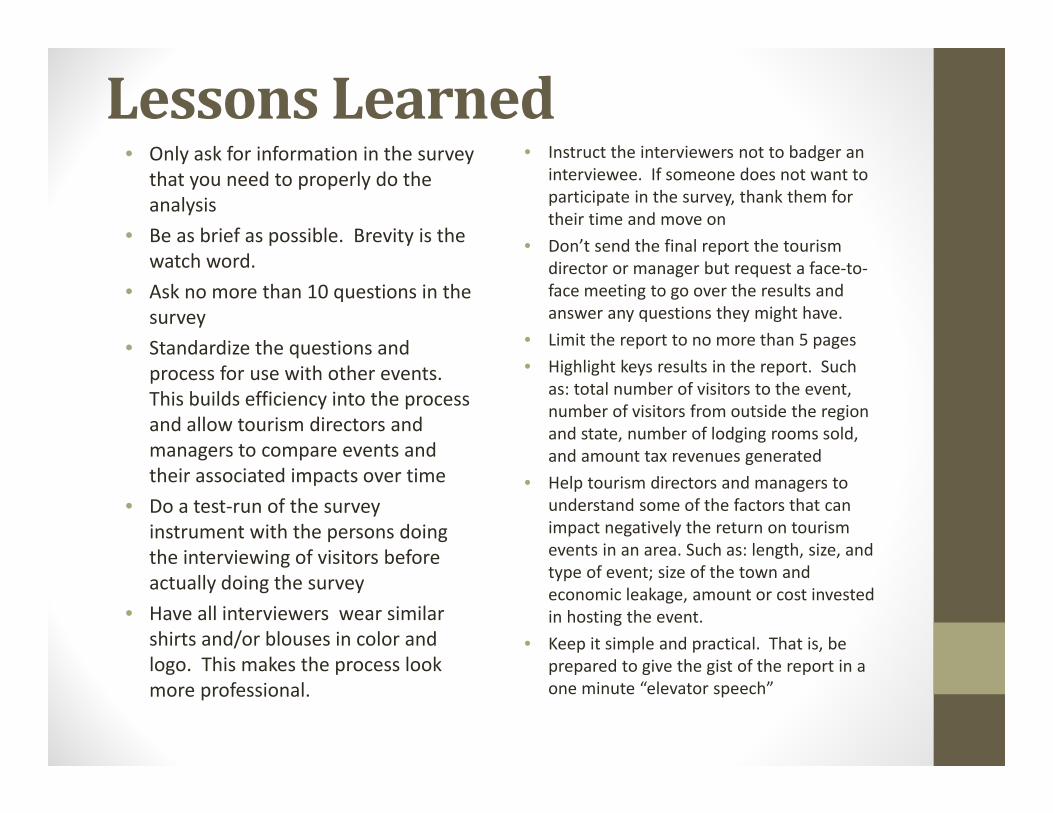
Lessons Learned• Only ask for information in the survey
that you need to properly do the analysis
• Be as brief as possible. Brevity is the watch word.
• Ask no more than 10 questions in the survey
• Standardize the questions and process for use with other events. This builds efficiency into the process and allow tourism directors and managers to compare events and their associated impacts over time
• Do a test-run of the survey instrument with the persons doing the interviewing of visitors before actually doing the survey
• Have all interviewers wear similar shirts and/or blouses in color and logo. This makes the process look more professional.
• Instruct the interviewers not to badger an interviewee. If someone does not want to participate in the survey, thank them for their time and move on
• Don’t send the final report the tourism director or manager but request a face-to-face meeting to go over the results and answer any questions they might have.
• Limit the report to no more than 5 pages• Highlight keys results in the report. Such
as: total number of visitors to the event, number of visitors from outside the region and state, number of lodging rooms sold, and amount tax revenues generated
• Help tourism directors and managers to understand some of the factors that can impact negatively the return on tourism events in an area. Such as: length, size, and type of event; size of the town and economic leakage, amount or cost invested in hosting the event.
• Keep it simple and practical. That is, be prepared to give the gist of the report in a one minute “elevator speech”
SUMMING UP AND MOVING FORWARD
Once the economic impact of an event has been calculated the potential use of this information is almost endless. Figures can be used with policy makers to justify continued support for tourism in the area.
The information on expenditures by sectors could be used to show the direct impact on the local economy resulting from a specific event. These results could then be used to illustrate the benefits of the event to local industry and as a tool for gaining local sponsorship.