myocardial scar visualized by cardiovascular magnetic ... scar visualized by cardiovascular magnetic...
TRANSCRIPT
HgrsrapT
FGCLtRh
a
Journal of the American College of Cardiology Vol. 56, No. 11, 2010© 2010 by the American College of Cardiology Foundation ISSN 0735-1097/$36.00P
Myocardial Scar Visualized by CardiovascularMagnetic Resonance Imaging Predicts Major AdverseEvents in Patients With Hypertrophic Cardiomyopathy
Oliver Bruder, MD,* Anja Wagner, MD,† Christoph J. Jensen, MD,* Steffen Schneider, PHD,‡Peter Ong, MD,§ Eva-Maria Kispert, RN,§ Kai Nassenstein, MD,� Thomas Schlosser, MD,�Georg V. Sabin, MD,* Udo Sechtem, MD,§ Heiko Mahrholdt, MD§
Essen, Ludwigshafen, and Stuttgart, Germany; and Philadelphia, Pennsylvania
Objectives We sought to establish the prognostic value of a comprehensive cardiovascular magnetic resonance (CMR) ex-amination in risk stratification of hypertrophic cardiomyopathy (HCM) patients.
Background With annual mortality rates ranging between 1% and 5%, depending on patient selection, a small but significantnumber of HCM patients are at risk for an adverse event. Therefore, the identification of and prophylactic ther-apy (i.e., defibrillator placement) in patients with HCM who are at risk of dying are imperative.
Methods Two-hundred forty-three consecutive patients with HCM were prospectively enrolled. All patients underwent initialCMR, and 220 were available for clinical follow-up. The mean follow-up time was 1,090 days after CMR. Endpoints were all-cause and cardiac mortality.
Results During follow-up 20 of the 220 patients died, and 2 patients survived sudden cardiac death due to adequateimplantable cardioverter-defibrillator discharge. Most events (n � 16) occurred for cardiac reasons; the remain-ing 6 events were related to cancer and accidents. Our data indicate that the presence of scar visualized by CMRyields an odds ratio of 5.47 for all-cause mortality and of 8.01 for cardiac mortality. This might be superior toclassic clinical risk factors, because in our dataset the presence of 2 risk factors yields an odds ratio of 3.86 forall-cause and of 2.20 for cardiac mortality, respectively. Multivariable analysis also revealed the presence of lategadolinium enhancement as a good independent predictor of death in HCM patients.
Conclusions Among our population of largely low or asymptomatic HCM patients, the presence of scar indicated by CMR is agood independent predictor of all-cause and cardiac mortality. (J Am Coll Cardiol 2010;56:875–87) © 2010 bythe American College of Cardiology Foundation
ublished by Elsevier Inc. doi:10.1016/j.jacc.2010.05.007
sf
sftaspp
dcc
ypertrophic cardiomyopathy (HCM) is the most commonenetic cardiovascular disorder (1). With annual mortalityates ranging between 1% and 5% depending on patientelection, a small but significant number of patients are atisk for an adverse event (2). Therefore, the identificationnd prophylactic therapy (i.e., defibrillator placement) inatients with HCM who are at risk of dying are imperative.his is underscored by the fact that HCM has a high
rom the *Department of Cardiology and Angiology, Elisabeth Hospital, Essen,ermany; †Department of Cardiology, Hahnemann University Hospital, Drexelollege of Medicine, Philadelphia, Pennsylvania; ‡Institut für Herzinfarktforschung,udwigshafen, Germany; §Department of Cardiology, Robert Bosch Medical Cen-
er, Stuttgart, Germany; and the �Department of Diagnostic and Interventionaladiology, University Hospital, Essen, Germany. All authors have reported that theyave no relationships to disclose.
oManuscript received March 30, 2010; revised manuscript received May 13, 2010,
ccepted May 17, 2010.
ocioeconomic impact, because it is the most common causeor sudden cardiac death (SCD) in young people (3).
Currently, several clinical markers are accepted for risktratification in patients with HCM, including an adverseamily history, prior cardiac arrest, spontaneous ventricularachycardias or syncope, left ventricular (LV) wall thickness,nd ventricular outflow tract obstruction. However, risktratification in HCM is still limited by low positiveredictive values of the clinical markers described in thereceding text (4,5).
See page 888
Recently, it has been described that myocardial scarringetected by late gadolinium enhancement (LGE) cardiovas-ular magnetic resonance (CMR) is related to long-termlinical outcome and thus might be a much better predictor
f lethal adverse events (Fig. 1) than established clinical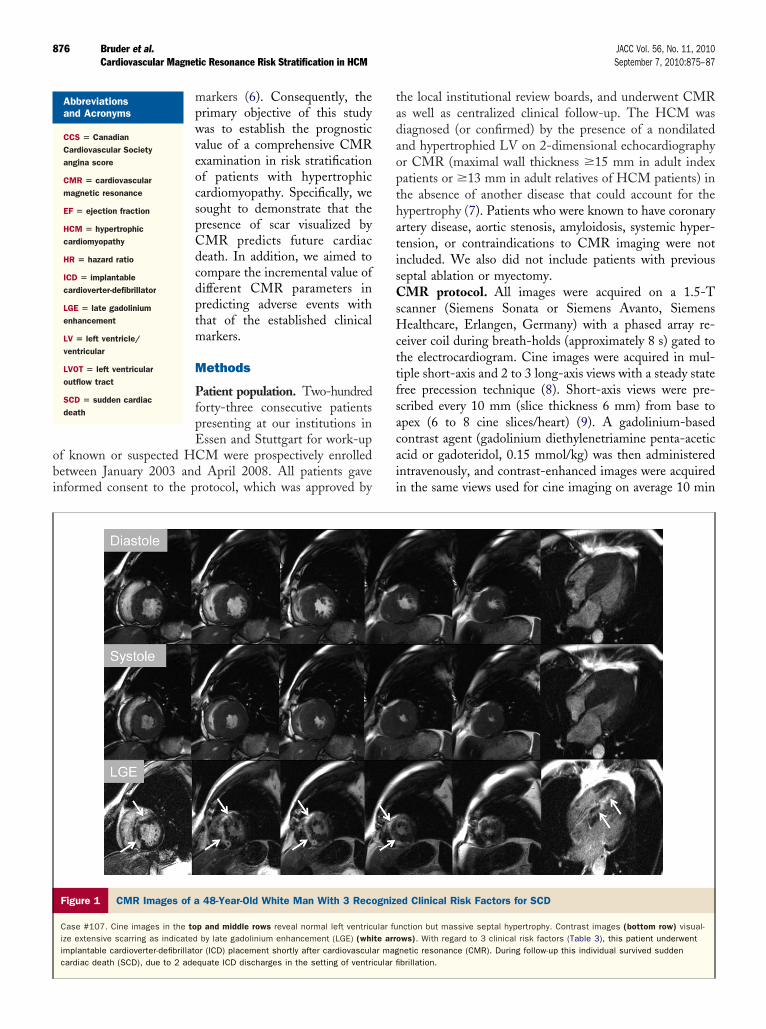
obi
tadaopthatisCsHcttfsacaii
876 Bruder et al. JACC Vol. 56, No. 11, 2010Cardiovascular Magnetic Resonance Risk Stratification in HCM September 7, 2010:875–87
markers (6). Consequently, theprimary objective of this studywas to establish the prognosticvalue of a comprehensive CMRexamination in risk stratificationof patients with hypertrophiccardiomyopathy. Specifically, wesought to demonstrate that thepresence of scar visualized byCMR predicts future cardiacdeath. In addition, we aimed tocompare the incremental value ofdifferent CMR parameters inpredicting adverse events withthat of the established clinicalmarkers.
Methods
Patient population. Two-hundredforty-three consecutive patientspresenting at our institutions inEssen and Stuttgart for work-up
f known or suspected HCM were prospectively enrolledetween January 2003 and April 2008. All patients gavenformed consent to the protocol, which was approved by
Abbreviationsand Acronyms
CCS � CanadianCardiovascular Societyangina score
CMR � cardiovascularmagnetic resonance
EF � ejection fraction
HCM � hypertrophiccardiomyopathy
HR � hazard ratio
ICD � implantablecardioverter-defibrillator
LGE � late gadoliniumenhancement
LV � left ventricle/ventricular
LVOT � left ventricularoutflow tract
SCD � sudden cardiacdeath
Figure 1 CMR Images of a 48-Year-Old White Man With 3 Reco
Case #107. Cine images in the top and middle rows reveal normal left ventricize extensive scarring as indicated by late gadolinium enhancement (LGE) (whiimplantable cardioverter-defibrillator (ICD) placement shortly after cardiovasculacardiac death (SCD), due to 2 adequate ICD discharges in the setting of ventri
he local institutional review boards, and underwent CMRs well as centralized clinical follow-up. The HCM wasiagnosed (or confirmed) by the presence of a nondilatednd hypertrophied LV on 2-dimensional echocardiographyr CMR (maximal wall thickness �15 mm in adult indexatients or �13 mm in adult relatives of HCM patients) inhe absence of another disease that could account for theypertrophy (7). Patients who were known to have coronaryrtery disease, aortic stenosis, amyloidosis, systemic hyper-ension, or contraindications to CMR imaging were notncluded. We also did not include patients with previouseptal ablation or myectomy.MR protocol. All images were acquired on a 1.5-T
canner (Siemens Sonata or Siemens Avanto, Siemensealthcare, Erlangen, Germany) with a phased array re-
eiver coil during breath-holds (approximately 8 s) gated tohe electrocardiogram. Cine images were acquired in mul-iple short-axis and 2 to 3 long-axis views with a steady stateree precession technique (8). Short-axis views were pre-cribed every 10 mm (slice thickness 6 mm) from base topex (6 to 8 cine slices/heart) (9). A gadolinium-basedontrast agent (gadolinium diethylenetriamine penta-aceticcid or gadoteridol, 0.15 mmol/kg) was then administeredntravenously, and contrast-enhanced images were acquiredn the same views used for cine imaging on average 10 min
d Clinical Risk Factors for SCD
nction but massive septal hypertrophy. Contrast images (bottom row) visual-ws). With regard to 3 clinical risk factors (Table 3), this patient underwentnetic resonance (CMR). During follow-up this individual survived suddenbrillation.
gnize
ular fute arror mag
cular fi
ardaCprc
dMcdcsdspdpiabHtsimm
SI(Ctmo
ocVsaaagfo
2hhaglpow
2a
877JACC Vol. 56, No. 11, 2010 Bruder et al.September 7, 2010:875–87 Cardiovascular Magnetic Resonance Risk Stratification in HCM
fter contrast administration with a segmented inversion-ecovery sequence constantly adjusting the inversion time asescribed previously (10). In-plane image resolution for cinend contrast was typically 1.2 � 1.6 mm.MR analysis. For all patients, the CMR scans werelaced in random order after the identity markers wereemoved. Two blinded observers evaluated the cine andontrast-enhanced images separately.
The endocardial and epicardial borders of the myocar-ium were planimetered on the short-axis cine images (11).aximum wall thickness was evaluated with all short-axis
ine images covering the entire ventricle. Volumes wereerived by summation of discs, and the ejection fraction wasalculated accordingly. The LV mass was calculated byubtracting endocardial from epicardial volume at end-iastole and multiplying by 1.05 g/cm3 (11). The extent ofcarred myocardium was determined automatically by com-uter counting of all hyperenhanced pixels in the myocar-ium on each of the short-axis images. Hyperenhancedixels resembling LGE were defined as those with imagentensities of 2 SDs above the mean of image intensities in
remote myocardial region in the same image, which haseen shown to represent myocardial fibrosis/scarring inCM by necropsy comparison (12). The scar volume was
hen calculated as a percentage of LV mass (%LV), as theum of hyperenhanced pixels from each of the short-axismages divided by the total number of pixels within the LV
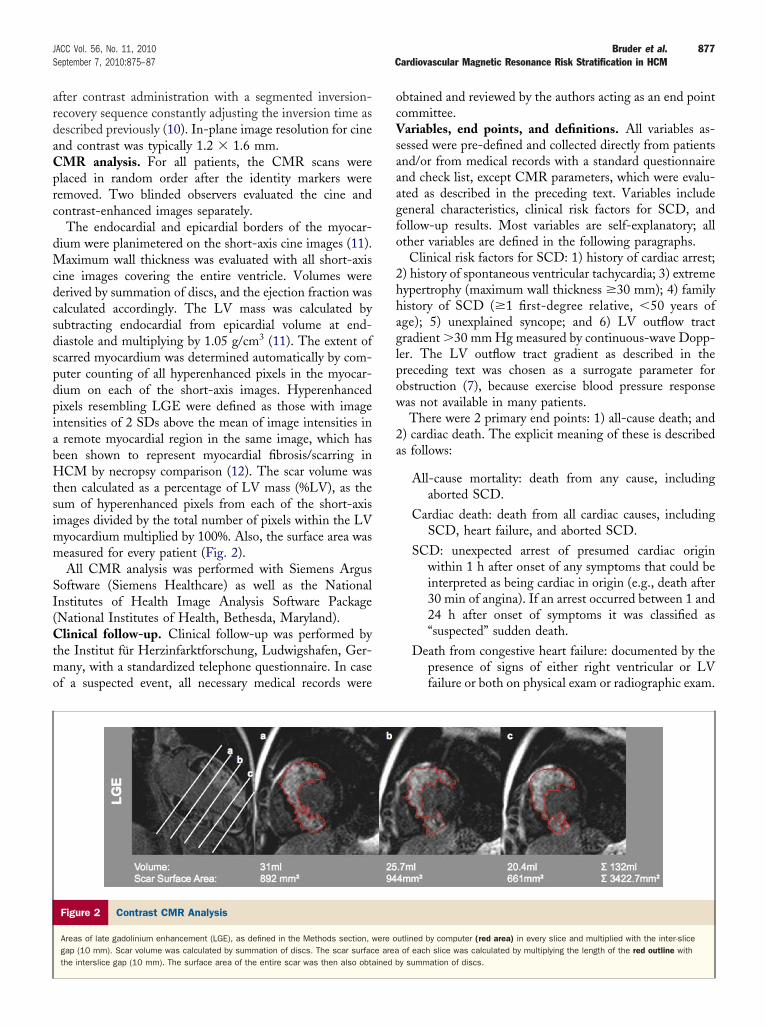
yocardium multiplied by 100%. Also, the surface area waseasured for every patient (Fig. 2).All CMR analysis was performed with Siemens Argus
oftware (Siemens Healthcare) as well as the Nationalnstitutes of Health Image Analysis Software PackageNational Institutes of Health, Bethesda, Maryland).
linical follow-up. Clinical follow-up was performed byhe Institut für Herzinfarktforschung, Ludwigshafen, Ger-any, with a standardized telephone questionnaire. In case
f a suspected event, all necessary medical records were
Figure 2 Contrast CMR Analysis
Areas of late gadolinium enhancement (LGE), as defined in the Methods section, wgap (10 mm). Scar volume was calculated by summation of discs. The scar surfacthe interslice gap (10 mm). The surface area of the entire scar was then also obta
btained and reviewed by the authors acting as an end pointommittee.ariables, end points, and definitions. All variables as-
essed were pre-defined and collected directly from patientsnd/or from medical records with a standard questionnairend check list, except CMR parameters, which were evalu-ted as described in the preceding text. Variables includeeneral characteristics, clinical risk factors for SCD, andollow-up results. Most variables are self-explanatory; allther variables are defined in the following paragraphs.Clinical risk factors for SCD: 1) history of cardiac arrest;
) history of spontaneous ventricular tachycardia; 3) extremeypertrophy (maximum wall thickness �30 mm); 4) familyistory of SCD (�1 first-degree relative, �50 years ofge); 5) unexplained syncope; and 6) LV outflow tractradient �30 mm Hg measured by continuous-wave Dopp-er. The LV outflow tract gradient as described in thereceding text was chosen as a surrogate parameter forbstruction (7), because exercise blood pressure responseas not available in many patients.There were 2 primary end points: 1) all-cause death; and
) cardiac death. The explicit meaning of these is describeds follows:
All-cause mortality: death from any cause, includingaborted SCD.
Cardiac death: death from all cardiac causes, includingSCD, heart failure, and aborted SCD.
SCD: unexpected arrest of presumed cardiac originwithin 1 h after onset of any symptoms that could beinterpreted as being cardiac in origin (e.g., death after30 min of angina). If an arrest occurred between 1 and24 h after onset of symptoms it was classified as“suspected” sudden death.
Death from congestive heart failure: documented by thepresence of signs of either right ventricular or LVfailure or both on physical exam or radiographic exam.
utlined by computer (red area) in every slice and multiplied with the inter-sliceof each slice was calculated by multiplying the length of the red outline withy summation of discs.
ere oe areained b
Sw(ascolcuaspommmssp
R
Pptrfp
am(A(v
nrpSsE
fsCrtamL
pwpfim
mb
B
A
LNv
878 Bruder et al. JACC Vol. 56, No. 11, 2010Cardiovascular Magnetic Resonance Risk Stratification in HCM September 7, 2010:875–87
The diagnosis should be confirmed by noninvasive orhemodynamic measurements.
Aborted SCD: resuscitation after cardiac arrest definedas performance of the physical act of cardioversion,appropriate implantable cardioverter-defibrillator (ICD)shocks, or cardiopulmonary resuscitation in a patientwho remains alive 28 days later.
Appropriate ICD shocks: defibrillator discharges wereconsidered appropriate, including automatic defibril-lation shocks triggered by ventricular tachycardia orfibrillation and documented by stored intracardiacelectrocardiographic or cycle-length data.
tatistical analysis. Absolute numbers and percentagesere computed to describe the patient population. Medians
with quartiles) or means (with SD) were computed asppropriate. Categorical values were compared by chi-quare test or Fisher exact test as appropriate. Kaplan Meierurves were calculated for visualizing the cumulative survivalf patients with and without scar indicated by LGE. Aog-rank test was performed to compare both survivalurves. A multivariable Cox proportional hazard model wassed for analyzing independent associations with all-causend cardiac mortality. The covariates included in the regres-ion model as potential confounders were selected with theresent data and are limited in number due to the numberf observed events. Therefore, the predictive value of LGEight be slightly lower than the current estimates from theultivariable analysis, due to over-fitting when applying theethod to future cases. Values of p � 0.05 were considered
ignificant. All p values are results of 2-tailed tests. Alltatistical analyses were performed with the SAS statisticalackage, version 9.1 (SAS Institute, Cary, North Carolina).
esults
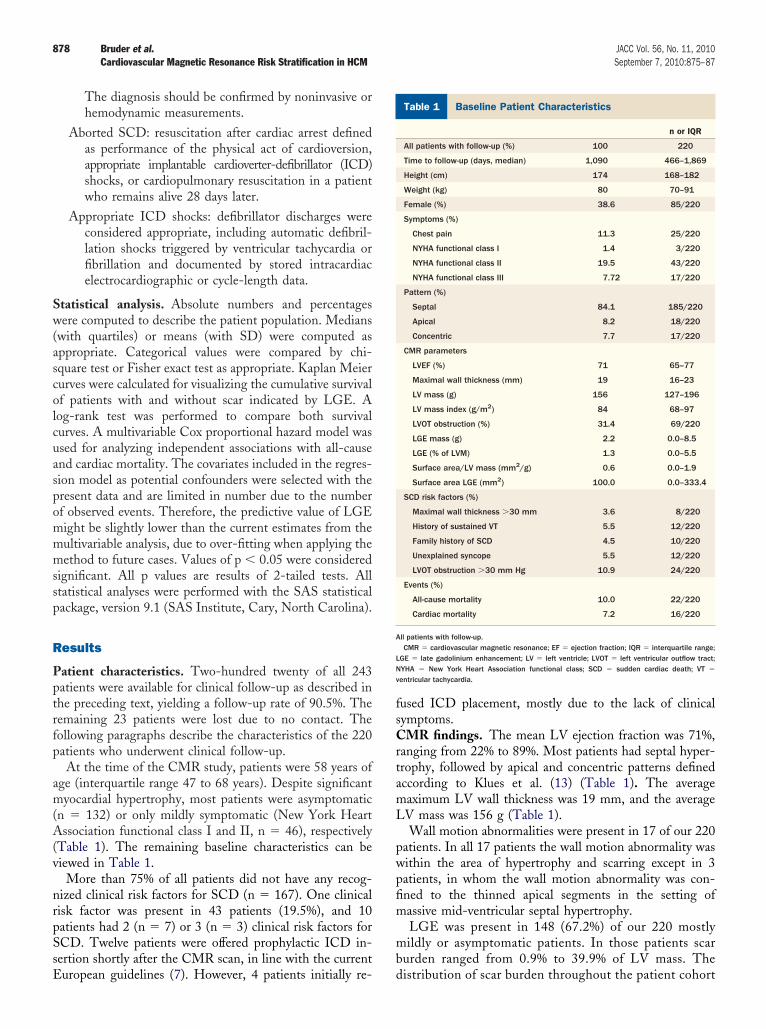
atient characteristics. Two-hundred twenty of all 243atients were available for clinical follow-up as described inhe preceding text, yielding a follow-up rate of 90.5%. Theemaining 23 patients were lost due to no contact. Theollowing paragraphs describe the characteristics of the 220atients who underwent clinical follow-up.At the time of the CMR study, patients were 58 years of
ge (interquartile range 47 to 68 years). Despite significantyocardial hypertrophy, most patients were asymptomatic
n � 132) or only mildly symptomatic (New York Heartssociation functional class I and II, n � 46), respectively
Table 1). The remaining baseline characteristics can beiewed in Table 1.
More than 75% of all patients did not have any recog-ized clinical risk factors for SCD (n � 167). One clinicalisk factor was present in 43 patients (19.5%), and 10atients had 2 (n � 7) or 3 (n � 3) clinical risk factors forCD. Twelve patients were offered prophylactic ICD in-ertion shortly after the CMR scan, in line with the current
uropean guidelines (7). However, 4 patients initially re- dused ICD placement, mostly due to the lack of clinicalymptoms.MR findings. The mean LV ejection fraction was 71%,
anging from 22% to 89%. Most patients had septal hyper-rophy, followed by apical and concentric patterns definedccording to Klues et al. (13) (Table 1). The averageaximum LV wall thickness was 19 mm, and the averageV mass was 156 g (Table 1).Wall motion abnormalities were present in 17 of our 220
atients. In all 17 patients the wall motion abnormality wasithin the area of hypertrophy and scarring except in 3atients, in whom the wall motion abnormality was con-ned to the thinned apical segments in the setting ofassive mid-ventricular septal hypertrophy.LGE was present in 148 (67.2%) of our 220 mostlyildly or asymptomatic patients. In those patients scar
urden ranged from 0.9% to 39.9% of LV mass. The
aseline Patient CharacteristicsTable 1 Baseline Patient Characteristics
n or IQR
All patients with follow-up (%) 100 220
Time to follow-up (days, median) 1,090 466–1,869
Height (cm) 174 168–182
Weight (kg) 80 70–91
Female (%) 38.6 85/220
Symptoms (%)
Chest pain 11.3 25/220
NYHA functional class I 1.4 3/220
NYHA functional class II 19.5 43/220
NYHA functional class III 7.72 17/220
Pattern (%)
Septal 84.1 185/220
Apical 8.2 18/220
Concentric 7.7 17/220
CMR parameters
LVEF (%) 71 65–77
Maximal wall thickness (mm) 19 16–23
LV mass (g) 156 127–196
LV mass index (g/m2) 84 68–97
LVOT obstruction (%) 31.4 69/220
LGE mass (g) 2.2 0.0–8.5
LGE (% of LVM) 1.3 0.0–5.5
Surface area/LV mass (mm2/g) 0.6 0.0–1.9
Surface area LGE (mm2) 100.0 0.0–333.4
SCD risk factors (%)
Maximal wall thickness �30 mm 3.6 8/220
History of sustained VT 5.5 12/220
Family history of SCD 4.5 10/220
Unexplained syncope 5.5 12/220
LVOT obstruction �30 mm Hg 10.9 24/220
Events (%)
All-cause mortality 10.0 22/220
Cardiac mortality 7.2 16/220
ll patients with follow-up.CMR � cardiovascular magnetic resonance; EF � ejection fraction; IQR � interquartile range;
GE � late gadolinium enhancement; LV � left ventricle; LVOT � left ventricular outflow tract;YHA � New York Heart Association functional class; SCD � sudden cardiac death; VT �
entricular tachycardia.
istribution of scar burden throughout the patient cohort
a3L
gtp
P
V
879JACC Vol. 56, No. 11, 2010 Bruder et al.September 7, 2010:875–87 Cardiovascular Magnetic Resonance Risk Stratification in HCM
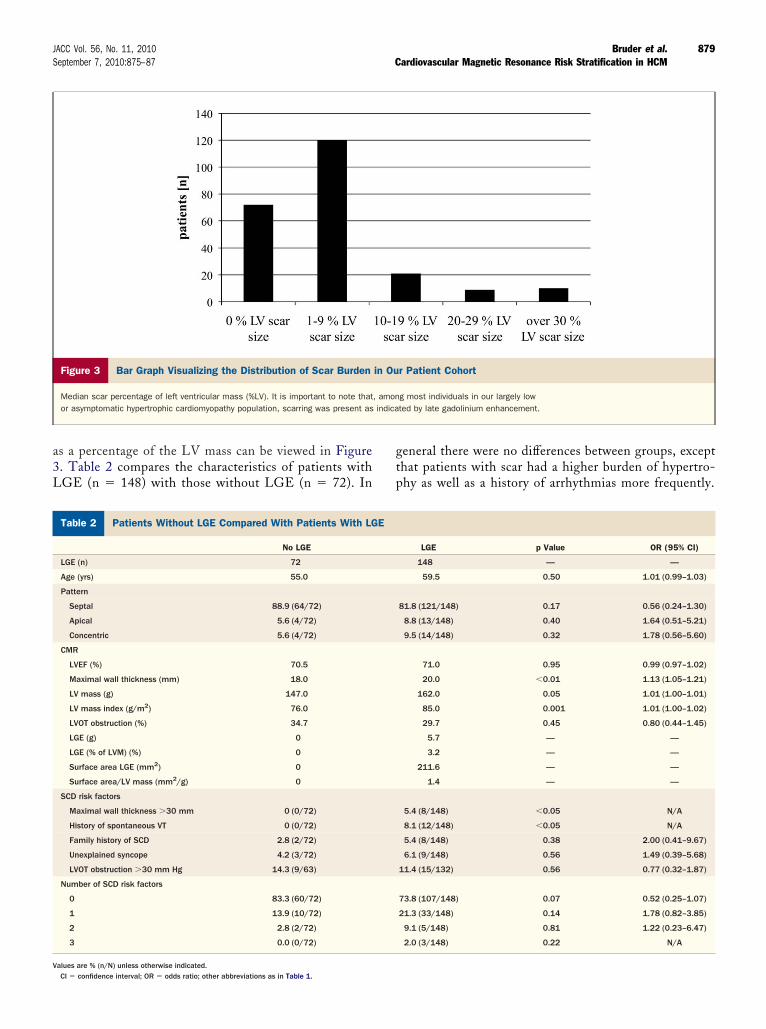
s a percentage of the LV mass can be viewed in Figure. Table 2 compares the characteristics of patients withGE (n � 148) with those without LGE (n � 72). In
Figure 3 Bar Graph Visualizing the Distribution of Scar Burden
Median scar percentage of left ventricular mass (%LV). It is important to note thator asymptomatic hypertrophic cardiomyopathy population, scarring was present as
atients Without LGE Compared With Patients With LGETable 2 Patients Without LGE Compared With Patients With LG
No LGE
LGE (n) 72
Age (yrs) 55.0
Pattern
Septal 88.9 (64/72)
Apical 5.6 (4/72)
Concentric 5.6 (4/72)
CMR
LVEF (%) 70.5
Maximal wall thickness (mm) 18.0
LV mass (g) 147.0
LV mass index (g/m2) 76.0
LVOT obstruction (%) 34.7
LGE (g) 0
LGE (% of LVM) (%) 0
Surface area LGE (mm2) 0
Surface area/LV mass (mm2/g) 0
SCD risk factors
Maximal wall thickness �30 mm 0 (0/72)
History of spontaneous VT 0 (0/72)
Family history of SCD 2.8 (2/72)
Unexplained syncope 4.2 (3/72)
LVOT obstruction �30 mm Hg 14.3 (9/63)
Number of SCD risk factors
0 83.3 (60/72)
1 13.9 (10/72)
2 2.8 (2/72)
3 0.0 (0/72)
alues are % (n/N) unless otherwise indicated.CI � confidence interval; OR � odds ratio; other abbreviations as in Table 1.
eneral there were no differences between groups, excepthat patients with scar had a higher burden of hypertro-hy as well as a history of arrhythmias more frequently.
r Patient Cohort
g most individuals in our largely lowted by late gadolinium enhancement.
LGE p Value OR (95% CI)
148 — —
59.5 0.50 1.01 (0.99–1.03)
81.8 (121/148) 0.17 0.56 (0.24–1.30)
8.8 (13/148) 0.40 1.64 (0.51–5.21)
9.5 (14/148) 0.32 1.78 (0.56–5.60)
71.0 0.95 0.99 (0.97–1.02)
20.0 �0.01 1.13 (1.05–1.21)
162.0 0.05 1.01 (1.00–1.01)
85.0 0.001 1.01 (1.00–1.02)
29.7 0.45 0.80 (0.44–1.45)
5.7 — —
3.2 — —
211.6 — —
1.4 — —
5.4 (8/148) �0.05 N/A
8.1 (12/148) �0.05 N/A
5.4 (8/148) 0.38 2.00 (0.41–9.67)
6.1 (9/148) 0.56 1.49 (0.39–5.68)
11.4 (15/132) 0.56 0.77 (0.32–1.87)
73.8 (107/148) 0.07 0.52 (0.25–1.07)
21.3 (33/148) 0.14 1.78 (0.82–3.85)
9.1 (5/148) 0.81 1.22 (0.23–6.47)
2.0 (3/148) 0.22 N/A
in Ou
, amonindica
E
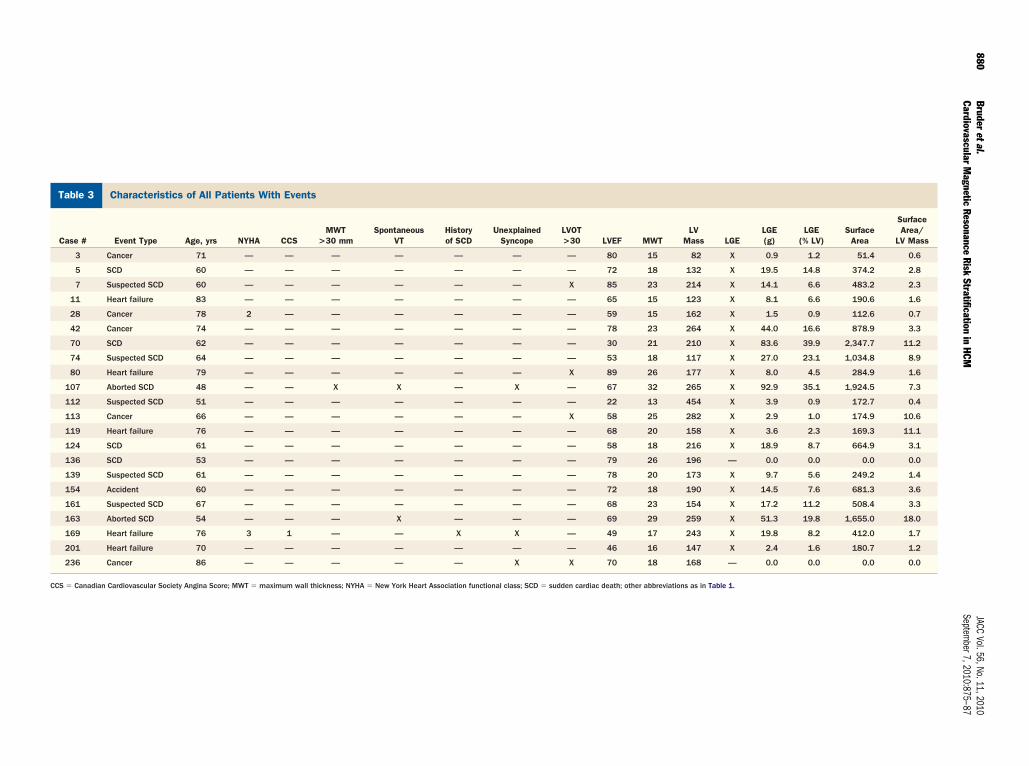
Characteristics of All Patients With EventsTable 3 Characteristics of All Patients With Events
Case # Event Type Age, yrs NYHA CCSMWT
>30 mmSpontaneous
VTHistoryof SCD
UnexplainedSyncope
LVOT>30 LVEF MWT
LVMass LGE
LGE(g)
LGE(% LV)
SurfaceArea
SurfaceArea/
LV Mass
3 Cancer 71 — — — — — — — 80 15 82 X 0.9 1.2 51.4 0.6
5 SCD 60 — — — — — — — 72 18 132 X 19.5 14.8 374.2 2.8
7 Suspected SCD 60 — — — — — — X 85 23 214 X 14.1 6.6 483.2 2.3
11 Heart failure 83 — — — — — — — 65 15 123 X 8.1 6.6 190.6 1.6
28 Cancer 78 2 — — — — — — 59 15 162 X 1.5 0.9 112.6 0.7
42 Cancer 74 — — — — — — — 78 23 264 X 44.0 16.6 878.9 3.3
70 SCD 62 — — — — — — — 30 21 210 X 83.6 39.9 2,347.7 11.2
74 Suspected SCD 64 — — — — — — — 53 18 117 X 27.0 23.1 1,034.8 8.9
80 Heart failure 79 — — — — — — X 89 26 177 X 8.0 4.5 284.9 1.6
107 Aborted SCD 48 — — X X — X — 67 32 265 X 92.9 35.1 1,924.5 7.3
112 Suspected SCD 51 — — — — — — — 22 13 454 X 3.9 0.9 172.7 0.4
113 Cancer 66 — — — — — — X 58 25 282 X 2.9 1.0 174.9 10.6
119 Heart failure 76 — — — — — — — 68 20 158 X 3.6 2.3 169.3 11.1
124 SCD 61 — — — — — — — 58 18 216 X 18.9 8.7 664.9 3.1
136 SCD 53 — — — — — — — 79 26 196 — 0.0 0.0 0.0 0.0
139 Suspected SCD 61 — — — — — — — 78 20 173 X 9.7 5.6 249.2 1.4
154 Accident 60 — — — — — — — 72 18 190 X 14.5 7.6 681.3 3.6
161 Suspected SCD 67 — — — — — — — 68 23 154 X 17.2 11.2 508.4 3.3
163 Aborted SCD 54 — — — X — — — 69 29 259 X 51.3 19.8 1,655.0 18.0
169 Heart failure 76 3 1 — — X X — 49 17 243 X 19.8 8.2 412.0 1.7
201 Heart failure 70 — — — — — — — 46 16 147 X 2.4 1.6 180.7 1.2
236 Cancer 86 — — — — — X X 70 18 168 — 0.0 0.0 0.0 0.0
CCS � Canadian Cardiovascular Society Angina Score; MWT � maximum wall thickness; NYHA � New York Heart Association functional class; SCD � sudden cardiac death; other abbreviations as in Table 1.
880Bruderetal.
JACCVol.56,No.11,2010
CardiovascularM
agneticResonance
RiskStratification
inHCM
September7,2010:875–87
edidmF12TtcctthprPedgtui
emohffsctpsHprLmfty
%efpc
U
V
881JACC Vol. 56, No. 11, 2010 Bruder et al.September 7, 2010:875–87 Cardiovascular Magnetic Resonance Risk Stratification in HCM
Scarring was always located in the area of hypertrophy,ither patchy with multiple foci (62.8%) or in a more diffuseistribution (37.2%). In contrast to subendocardial scarring
n ischemic or subepicardial scarring in inflammatory heartisease, scars were predominantly located within the mid-yocardium in the HCM patient group.ollow-up results. During the follow-up time (mean,090 days) (Table 1) 20 (9%) of the 220 patients died, andpatients survived SCD due to adequate ICD discharge.hose 2 patients were also counted as events as described in
he Methods section. Most events (n � 16) occurred forardiac reasons, the remaining 6 events were related toancer and accidents. The clinical and imaging characteris-ics of all patients with events are displayed in Table 3. Notehat 20 of the 22 (91%) patients who died during follow-upad no previous clinical symptoms. In addition, 8 of the 11atients (73%) suffering from SCD during follow-up had noecognized clinical risk factors for SCD.redictors of events. For evaluation of predictors forvents we looked at: 1) all patients who suffered any type ofeath during follow-up (all-cause mortality); 2) the sub-roup of patients who suffered cardiac death (cardiac mor-ality); and 3) the subgroup of patients suffering SCD. Thenivariate analysis comparing different general, clinical, andmaging characteristics between groups with and without an
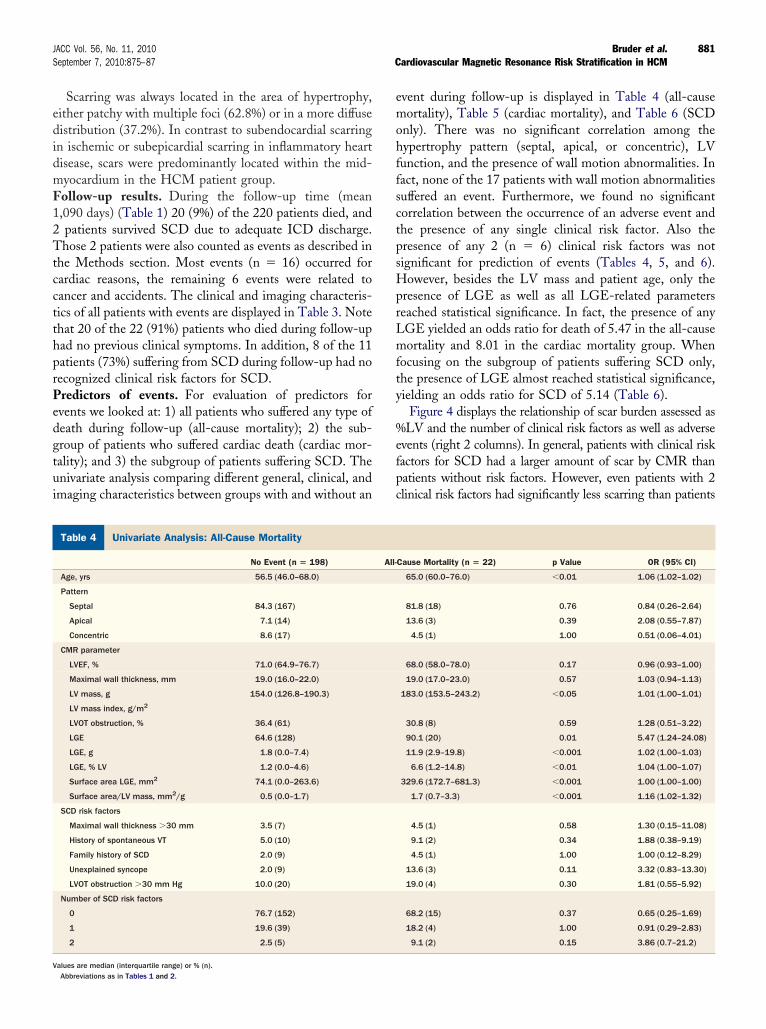
nivariate Analysis: All-Cause MortalityTable 4 Univariate Analysis: All-Cause Mortality
No Event (n � 198)
Age, yrs 56.5 (46.0–68.0)
Pattern
Septal 84.3 (167)
Apical 7.1 (14)
Concentric 8.6 (17)
CMR parameter
LVEF, % 71.0 (64.9–76.7)
Maximal wall thickness, mm 19.0 (16.0–22.0)
LV mass, g 154.0 (126.8–190.3)
LV mass index, g/m2
LVOT obstruction, % 36.4 (61)
LGE 64.6 (128)
LGE, g 1.8 (0.0–7.4)
LGE, % LV 1.2 (0.0–4.6)
Surface area LGE, mm2 74.1 (0.0–263.6)
Surface area/LV mass, mm2/g 0.5 (0.0–1.7)
SCD risk factors
Maximal wall thickness �30 mm 3.5 (7)
History of spontaneous VT 5.0 (10)
Family history of SCD 2.0 (9)
Unexplained syncope 2.0 (9)
LVOT obstruction �30 mm Hg 10.0 (20)
Number of SCD risk factors
0 76.7 (152)
1 19.6 (39)
2 2.5 (5)
alues are median (interquartile range) or % (n).Abbreviations as in Tables 1 and 2.
vent during follow-up is displayed in Table 4 (all-causeortality), Table 5 (cardiac mortality), and Table 6 (SCD
nly). There was no significant correlation among theypertrophy pattern (septal, apical, or concentric), LVunction, and the presence of wall motion abnormalities. Inact, none of the 17 patients with wall motion abnormalitiesuffered an event. Furthermore, we found no significantorrelation between the occurrence of an adverse event andhe presence of any single clinical risk factor. Also theresence of any 2 (n � 6) clinical risk factors was notignificant for prediction of events (Tables 4, 5, and 6).owever, besides the LV mass and patient age, only the
resence of LGE as well as all LGE-related parameterseached statistical significance. In fact, the presence of anyGE yielded an odds ratio for death of 5.47 in the all-causeortality and 8.01 in the cardiac mortality group. When
ocusing on the subgroup of patients suffering SCD only,he presence of LGE almost reached statistical significance,ielding an odds ratio for SCD of 5.14 (Table 6).
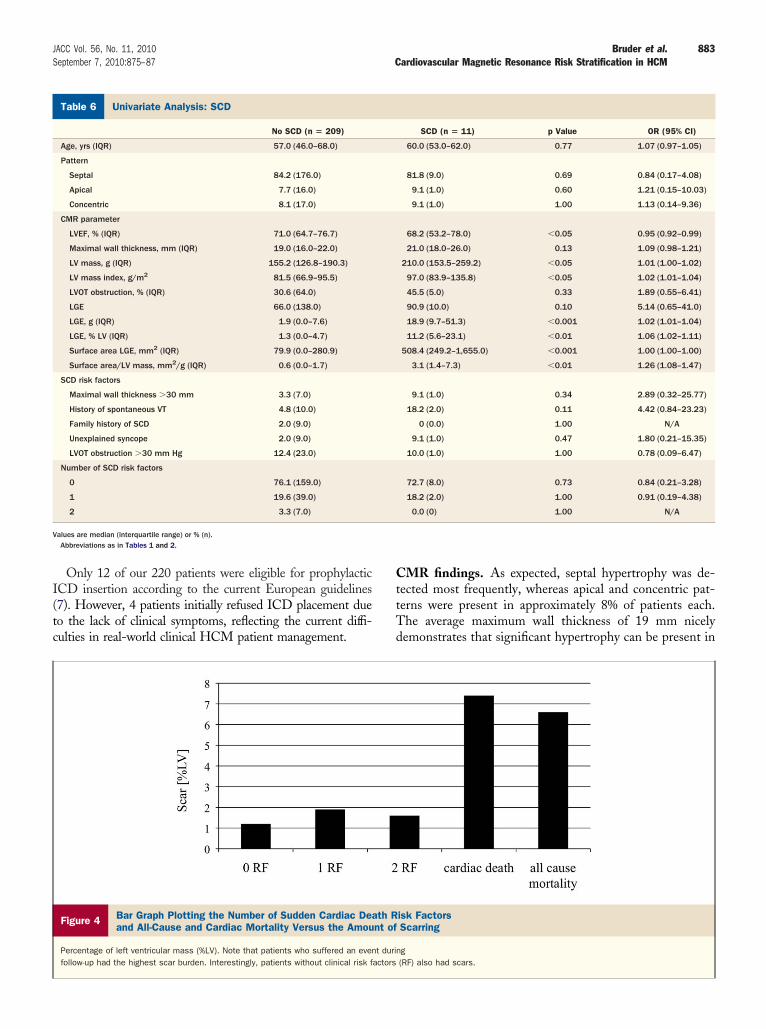
Figure 4 displays the relationship of scar burden assessed asLV and the number of clinical risk factors as well as adverse
vents (right 2 columns). In general, patients with clinical riskactors for SCD had a larger amount of scar by CMR thanatients without risk factors. However, even patients with 2linical risk factors had significantly less scarring than patients
Cause Mortality (n � 22) p Value OR (95% CI)
65.0 (60.0–76.0) �0.01 1.06 (1.02–1.02)
81.8 (18) 0.76 0.84 (0.26–2.64)
13.6 (3) 0.39 2.08 (0.55–7.87)
4.5 (1) 1.00 0.51 (0.06–4.01)
68.0 (58.0–78.0) 0.17 0.96 (0.93–1.00)
19.0 (17.0–23.0) 0.57 1.03 (0.94–1.13)
183.0 (153.5–243.2) �0.05 1.01 (1.00–1.01)
30.8 (8) 0.59 1.28 (0.51–3.22)
90.1 (20) 0.01 5.47 (1.24–24.08)
11.9 (2.9–19.8) �0.001 1.02 (1.00–1.03)
6.6 (1.2–14.8) �0.01 1.04 (1.00–1.07)
329.6 (172.7–681.3) �0.001 1.00 (1.00–1.00)
1.7 (0.7–3.3) �0.001 1.16 (1.02–1.32)
4.5 (1) 0.58 1.30 (0.15–11.08)
9.1 (2) 0.34 1.88 (0.38–9.19)
4.5 (1) 1.00 1.00 (0.12–8.29)
13.6 (3) 0.11 3.32 (0.83–13.30)
19.0 (4) 0.30 1.81 (0.55–5.92)
68.2 (15) 0.37 0.65 (0.25–1.69)
18.2 (4) 1.00 0.91 (0.29–2.83)
9.1 (2) 0.15 3.86 (0.7–21.2)
All-
wft9
cw5ai
emcmmiSmaHosmS
D
TpdpmcoaycrfcmaPcpMfiueo
U
V
882 Bruder et al. JACC Vol. 56, No. 11, 2010Cardiovascular Magnetic Resonance Risk Stratification in HCM September 7, 2010:875–87
ith an event. So the mean scar burden of patients with 2 riskactors was 3.8%, whereas the mean scar burden was 11.8% inhe group of individuals who suffered from cardiac death and.8% when all-cause mortality was considered.
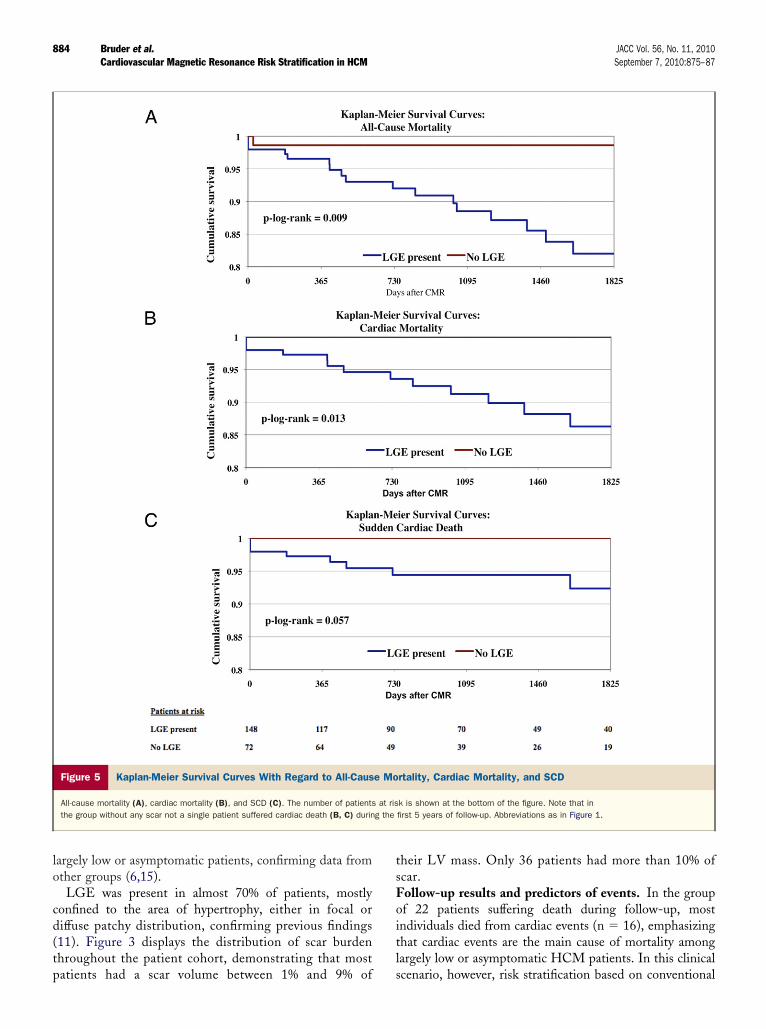
Kaplan-Meier survival curves—for all-cause mortality,ardiac mortality, and SCD comparing patients with scarith patients without scar—can be viewed in Figures 5A toC. Note that during the first 1,825 days of follow-up notsingle patient without scar suffered from any cardiac death,
ncluding SCD (Figs. 5B and 5C).Multivariable Cox regression analysis, including the pres-
nce of LGE, LV ejection fraction, and LV myocardialass, also revealed LGE as a good independent predictor of
ardiac death (p � 0.035; hazard ratio [HR]: 4.81). In thisodel ejection fraction (p � 0.067; HR: 0.96), and LVass (p � 0.40; HR: 1.00) did not reach statistical signif-
cance. When the presence of 1 and 2 clinical risk factors forCD as well as the presence of LGE was included in theultivariable regression analysis, the presence of LGE wasgood independent predictor of cardiac death (p � 0.038,R: 8.6), whereas the presence of 1 (p � 0.63, HR: 0.73)
r 2 clinical risk factors (p � 0.68, HR: 1.37) did not reachtatistical significance in our cohort. We did not performultivariable analysis in the subgroup of patients suffering
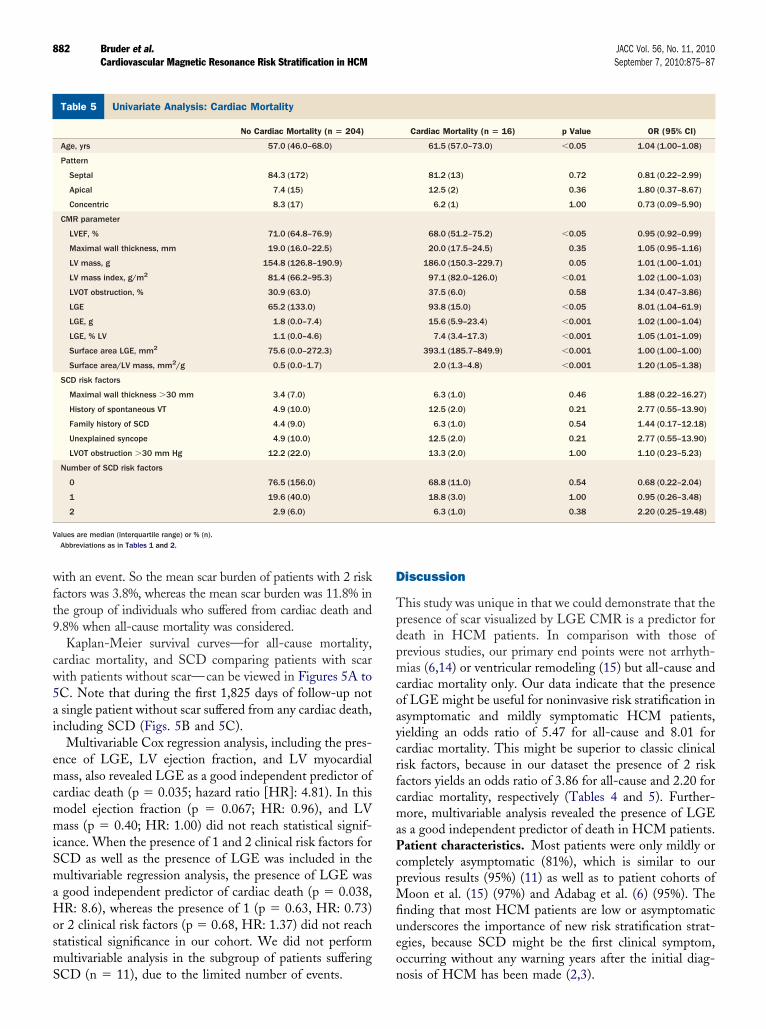
nivariate Analysis: Cardiac MortalityTable 5 Univariate Analysis: Cardiac Mortality
No Cardiac Mortality (n � 204)
Age, yrs 57.0 (46.0–68.0)
Pattern
Septal 84.3 (172)
Apical 7.4 (15)
Concentric 8.3 (17)
CMR parameter
LVEF, % 71.0 (64.8–76.9)
Maximal wall thickness, mm 19.0 (16.0–22.5)
LV mass, g 154.8 (126.8–190.9)
LV mass index, g/m2 81.4 (66.2–95.3)
LVOT obstruction, % 30.9 (63.0)
LGE 65.2 (133.0)
LGE, g 1.8 (0.0–7.4)
LGE, % LV 1.1 (0.0–4.6)
Surface area LGE, mm2 75.6 (0.0–272.3)
Surface area/LV mass, mm2/g 0.5 (0.0–1.7)
SCD risk factors
Maximal wall thickness �30 mm 3.4 (7.0)
History of spontaneous VT 4.9 (10.0)
Family history of SCD 4.4 (9.0)
Unexplained syncope 4.9 (10.0)
LVOT obstruction �30 mm Hg 12.2 (22.0)
Number of SCD risk factors
0 76.5 (156.0)
1 19.6 (40.0)
2 2.9 (6.0)
alues are median (interquartile range) or % (n).Abbreviations as in Tables 1 and 2.
CD (n � 11), due to the limited number of events. n
iscussion
his study was unique in that we could demonstrate that theresence of scar visualized by LGE CMR is a predictor foreath in HCM patients. In comparison with those ofrevious studies, our primary end points were not arrhyth-ias (6,14) or ventricular remodeling (15) but all-cause and
ardiac mortality only. Our data indicate that the presencef LGE might be useful for noninvasive risk stratification insymptomatic and mildly symptomatic HCM patients,ielding an odds ratio of 5.47 for all-cause and 8.01 forardiac mortality. This might be superior to classic clinicalisk factors, because in our dataset the presence of 2 riskactors yields an odds ratio of 3.86 for all-cause and 2.20 forardiac mortality, respectively (Tables 4 and 5). Further-ore, multivariable analysis revealed the presence of LGE
s a good independent predictor of death in HCM patients.atient characteristics. Most patients were only mildly orompletely asymptomatic (81%), which is similar to ourrevious results (95%) (11) as well as to patient cohorts ofoon et al. (15) (97%) and Adabag et al. (6) (95%). The
nding that most HCM patients are low or asymptomaticnderscores the importance of new risk stratification strat-gies, because SCD might be the first clinical symptom,ccurring without any warning years after the initial diag-
Cardiac Mortality (n � 16) p Value OR (95% CI)
61.5 (57.0–73.0) �0.05 1.04 (1.00–1.08)
81.2 (13) 0.72 0.81 (0.22–2.99)
12.5 (2) 0.36 1.80 (0.37–8.67)
6.2 (1) 1.00 0.73 (0.09–5.90)
68.0 (51.2–75.2) �0.05 0.95 (0.92–0.99)
20.0 (17.5–24.5) 0.35 1.05 (0.95–1.16)
186.0 (150.3–229.7) 0.05 1.01 (1.00–1.01)
97.1 (82.0–126.0) �0.01 1.02 (1.00–1.03)
37.5 (6.0) 0.58 1.34 (0.47–3.86)
93.8 (15.0) �0.05 8.01 (1.04–61.9)
15.6 (5.9–23.4) �0.001 1.02 (1.00–1.04)
7.4 (3.4–17.3) �0.001 1.05 (1.01–1.09)
393.1 (185.7–849.9) �0.001 1.00 (1.00–1.00)
2.0 (1.3–4.8) �0.001 1.20 (1.05–1.38)
6.3 (1.0) 0.46 1.88 (0.22–16.27)
12.5 (2.0) 0.21 2.77 (0.55–13.90)
6.3 (1.0) 0.54 1.44 (0.17–12.18)
12.5 (2.0) 0.21 2.77 (0.55–13.90)
13.3 (2.0) 1.00 1.10 (0.23–5.23)
68.8 (11.0) 0.54 0.68 (0.22–2.04)
18.8 (3.0) 1.00 0.95 (0.26–3.48)
6.3 (1.0) 0.38 2.20 (0.25–19.48)
osis of HCM has been made (2,3).
I(tc
CttTd
U
V
883JACC Vol. 56, No. 11, 2010 Bruder et al.September 7, 2010:875–87 Cardiovascular Magnetic Resonance Risk Stratification in HCM
Only 12 of our 220 patients were eligible for prophylacticCD insertion according to the current European guidelines7). However, 4 patients initially refused ICD placement dueo the lack of clinical symptoms, reflecting the current diffi-ulties in real-world clinical HCM patient management.
nivariate Analysis: SCDTable 6 Univariate Analysis: SCD
No SCD (n � 209)
Age, yrs (IQR) 57.0 (46.0–68.0)
Pattern
Septal 84.2 (176.0)
Apical 7.7 (16.0)
Concentric 8.1 (17.0)
CMR parameter
LVEF, % (IQR) 71.0 (64.7–76.7)
Maximal wall thickness, mm (IQR) 19.0 (16.0–22.0)
LV mass, g (IQR) 155.2 (126.8–190.3)
LV mass index, g/m2 81.5 (66.9–95.5)
LVOT obstruction, % (IQR) 30.6 (64.0)
LGE 66.0 (138.0)
LGE, g (IQR) 1.9 (0.0–7.6)
LGE, % LV (IQR) 1.3 (0.0–4.7)
Surface area LGE, mm2 (IQR) 79.9 (0.0–280.9)
Surface area/LV mass, mm2/g (IQR) 0.6 (0.0–1.7)
SCD risk factors
Maximal wall thickness �30 mm 3.3 (7.0)
History of spontaneous VT 4.8 (10.0)
Family history of SCD 2.0 (9.0)
Unexplained syncope 2.0 (9.0)
LVOT obstruction �30 mm Hg 12.4 (23.0)
Number of SCD risk factors
0 76.1 (159.0)
1 19.6 (39.0)
2 3.3 (7.0)
alues are median (interquartile range) or % (n).Abbreviations as in Tables 1 and 2.
Figure 4 Bar Graph Plotting the Number of Sudden Cardiac Deaand All-Cause and Cardiac Mortality Versus the Amou
Percentage of left ventricular mass (%LV). Note that patients who suffered an evenfollow-up had the highest scar burden. Interestingly, patients without clinical risk f
MR findings. As expected, septal hypertrophy was de-ected most frequently, whereas apical and concentric pat-erns were present in approximately 8% of patients each.he average maximum wall thickness of 19 mm nicelyemonstrates that significant hypertrophy can be present in
SCD (n � 11) p Value OR (95% CI)
60.0 (53.0–62.0) 0.77 1.07 (0.97–1.05)
81.8 (9.0) 0.69 0.84 (0.17–4.08)
9.1 (1.0) 0.60 1.21 (0.15–10.03)
9.1 (1.0) 1.00 1.13 (0.14–9.36)
68.2 (53.2–78.0) �0.05 0.95 (0.92–0.99)
21.0 (18.0–26.0) 0.13 1.09 (0.98–1.21)
210.0 (153.5–259.2) �0.05 1.01 (1.00–1.02)
97.0 (83.9–135.8) �0.05 1.02 (1.01–1.04)
45.5 (5.0) 0.33 1.89 (0.55–6.41)
90.9 (10.0) 0.10 5.14 (0.65–41.0)
18.9 (9.7–51.3) �0.001 1.02 (1.01–1.04)
11.2 (5.6–23.1) �0.01 1.06 (1.02–1.11)
508.4 (249.2–1,655.0) �0.001 1.00 (1.00–1.00)
3.1 (1.4–7.3) �0.01 1.26 (1.08–1.47)
9.1 (1.0) 0.34 2.89 (0.32–25.77)
18.2 (2.0) 0.11 4.42 (0.84–23.23)
0 (0.0) 1.00 N/A
9.1 (1.0) 0.47 1.80 (0.21–15.35)
10.0 (1.0) 1.00 0.78 (0.09–6.47)
72.7 (8.0) 0.73 0.84 (0.21–3.28)
18.2 (2.0) 1.00 0.91 (0.19–4.38)
0.0 (0) 1.00 N/A
isk FactorsScarring
g(RF) also had scars.
th Rnt of
t durinactors
lo
cd(tp
tsFoitl
884 Bruder et al. JACC Vol. 56, No. 11, 2010Cardiovascular Magnetic Resonance Risk Stratification in HCM September 7, 2010:875–87
argely low or asymptomatic patients, confirming data fromther groups (6,15).LGE was present in almost 70% of patients, mostly
onfined to the area of hypertrophy, either in focal oriffuse patchy distribution, confirming previous findings11). Figure 3 displays the distribution of scar burdenhroughout the patient cohort, demonstrating that most
Figure 5 Kaplan-Meier Survival Curves With Regard to All-Caus
All-cause mortality (A), cardiac mortality (B), and SCD (C). The number of patientsthe group without any scar not a single patient suffered cardiac death (B, C) durin
atients had a scar volume between 1% and 9% of s
heir LV mass. Only 36 patients had more than 10% ofcar.ollow-up results and predictors of events. In the groupf 22 patients suffering death during follow-up, mostndividuals died from cardiac events (n � 16), emphasizinghat cardiac events are the main cause of mortality amongargely low or asymptomatic HCM patients. In this clinical
rtality, Cardiac Mortality, and SCD
k is shown at the bottom of the figure. Note that infirst 5 years of follow-up. Abbreviations as in Figure 1.
e Mo
at risg the
cenario, however, risk stratification based on conventional
c2sS
pt
885JACC Vol. 56, No. 11, 2010 Bruder et al.September 7, 2010:875–87 Cardiovascular Magnetic Resonance Risk Stratification in HCM
linical risk factors (4,5) remains difficult, because 20 of the2 patients (91%) who died during follow-up had no clinicalymptoms, and only 3 of the 11 patients (27%) suffering
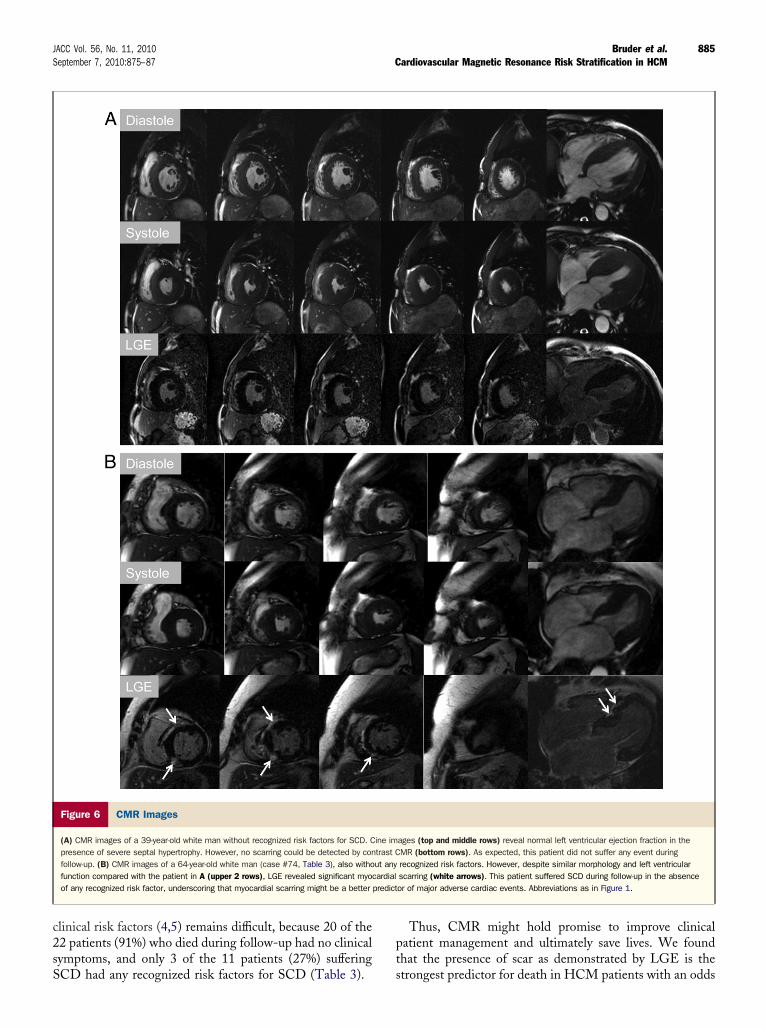
Figure 6 CMR Images
(A) CMR images of a 39-year-old white man without recognized risk factors for SCD. Cpresence of severe septal hypertrophy. However, no scarring could be detected by confollow-up. (B) CMR images of a 64-year-old white man (case #74, Table 3), also withofunction compared with the patient in A (upper 2 rows), LGE revealed significant myocof any recognized risk factor, underscoring that myocardial scarring might be a better
CD had any recognized risk factors for SCD (Table 3). s
Thus, CMR might hold promise to improve clinicalatient management and ultimately save lives. We foundhat the presence of scar as demonstrated by LGE is the
ages (top and middle rows) reveal normal left ventricular ejection fraction in theMR (bottom rows). As expected, this patient did not suffer any event duringrecognized risk factors. However, despite similar morphology and left ventricularscarring (white arrows). This patient suffered SCD during follow-up in the absenceor of major adverse cardiac events. Abbreviations as in Figure 1.
ine imtrast Cut anyardial
predict
trongest predictor for death in HCM patients with an odds
rrccpac(
aHaveirpadf
tfPdpscwfu(r
kpiirttvttptpdCatpstrs
a(r
grraldc
C
ApiclLwt
ATDle
RRg
R
886 Bruder et al. JACC Vol. 56, No. 11, 2010Cardiovascular Magnetic Resonance Risk Stratification in HCM September 7, 2010:875–87
atio of 5.47 for all-cause and 8.01 for cardiac mortality,espectively. Albeit limited by the relatively low number ofases and events, multivariable Cox regression analysisonfirmed the presence of LGE as a good independentredictor of cardiac death when compared with LV functionnd LV mass (p � 0.035; HR: 4.81) as well as whenompared with the presence of 1 or 2 clinical risk factorsp � 0.038, HR: 8.6), respectively.
This finding nicely fits with the fact that ventricularrrhythmias are the pathophysiological substrate of SCD inCM patients (16) and that the presence of LGE was
ssociated with a 7-fold increase in the risk of nonsustainedentricular tachycardia at follow-up in the cohort of Adabagt al. (6). In addition, as shown by Moon et al. (15), LGEs related not only to arrhythmias but also to ventricularemodeling and heart failure in HCM patients. All theserevious results might explain why in the present study notsingle patient without myocardial scarring suffered cardiaceath (including SCD) during the first 1,825 days ofollow-up (Figs. 5B and 5C).
This concept is also highlighted by Figure 6, displaying 2ypical examples of patients without any traditional riskactors but remarkable differences in scar size and outcome.atient A with no presence of scar by LGE had no eventuring the follow-up period. However, Patient B, with arominent scar, died from SCD. In fact, 8 of the 11 patientsuffering from SCD during follow-up had no recognizedlinical risk factors, but all had scars except 1. This patient,ho suffered SCD without any recognized clinical risk
actors and without any LGE (Table 3, Case #136),nderscores that additional parameters such as genotype17) or undetected coronary artery disease might also play aole in the clinical course of HCM.
Despite our encouraging data, however, it is important toeep in mind that there is not a 1:1 relationship between theresence of LGE and cardiac death. Thus, to furthermprove possible CMR risk stratification, we looked at thencremental value of several additional CMR-related pa-ameters, such as the scar surface area (Fig. 2), which ishought to cause electrical instability (18). Interestingly, allhese parameters reached statistical significance in the uni-ariate analysis (Tables 4 to 6). However, we were not ableo discriminate their individual predictive potential, due tohe limited number of cases and events available in theresent study. This topic as well as the question of whetherhe location of scarring within the ventricle might also helpredict events (19) will be revisited as soon as the HCMata of the EuroCMR Registry (20,21) will be available.linical implications. Although our data demonstrate
n association between LGE and death in HCM pa-ients, prospectively designed studies in large patientopulations—such as the EuroCMR Registry (20,21)—aretill required to definitively establish LGE as causally relatedo the death risk. However, with regard to our data and theesults from other groups demonstrating that LGE is the
ubstrate for ventricular arrhythmias in HCM (6,14) as wells associated to ventricular remodeling and heart failure15), it might be time to start regarding LGE as a primaryisk factor for HCM patients.
Consequently, we believe that some weight can already beiven to the presence of LGE as an arbitrator in reachingecommendations for prophylactic ICDs, when ambiguityemains concerning individual patient risk of cardiac deathfter assessing the conventional risk factors (22). Neverthe-ess, large longitudinal follow-up studies are needed toefinitely establish LGE as an independent predictor ofardiac death in HCM.
onclusions
mong our population of largely low or asymptomatic HCMatients, the presence of scar indicated by LGE is a goodndependent predictor of all-cause mortality as well as ofardiac mortality. These data support the necessity for futurearge longitudinal follow-up studies to definitely establishGE as an independent predictor of cardiac death in HCM asell as to evaluate the incremental prognostic value of addi-
ional CMR parameters, such as scar surface area.
cknowledgmentshe authors thank Prof. R. J. Kim and R. M. Judd from theuke Cardiovascular MR Center, Durham, North Caro-
ina, for their support during fellowship and ongoing coop-ration, which made this work possible.
eprint requests and correspondence: Dr. Heiko Mahrholdt,obert-Bosch-Medical Center, Auerbachstrasse 110, 70376 Stutt-art, Germany. E-mail: [email protected].
EFERENCES
1. Maron BJ, Pelliccia A, Spirito P. Cardiac disease in young trainedathletes. Insights into methods for distinguishing athlete’s heart fromstructural heart disease, with particular emphasis on hypertrophiccardiomyopathy. Circulation 1995;91:1596–601.
2. Cannan CR, Reeder GS, Bailey KR, Melton LJ III, Gersh BJ. Naturalhistory of hypertrophic cardiomyopathy. A population-based study,1976 through 1990. Circulation 1995;92:2488–95.
3. Maron BJ. Hypertrophic cardiomyopathy. Lancet 1997;350:127–33.4. Elliott PM, Poloniecki J, Dickie S, et al. Sudden death in hypertrophic
cardiomyopathy: identification of high risk patients. J Am Coll Cardiol2000;36:2212–8.
5. Spirito P, Seidman CE, McKenna WJ, Maron BJ. The managementof hypertrophic cardiomyopathy. N Engl J Med 1997;336:775–85.
6. Adabag AS, Maron BJ, Appelbaum E, et al. Occurrence and frequencyof arrhythmias in hypertrophic cardiomyopathy in relation to delayedenhancement on cardiovascular magnetic resonance. J Am Coll Car-diol 2008;51:1369–74.
7. Maron BJ, McKenna WJ, Danielson GK, et al. American College ofCardiology/European Society of Cardiology clinical expert consensusdocument on hypertrophic cardiomyopathy. A report of the AmericanCollege of Cardiology Foundation Task Force on Clinical Expert Con-sensus Documents and the European Society of Cardiology Committeefor Practice Guidelines. J Am Coll Cardiol 2003;42:1687–713.
8. Carr JC, Simonetti O, Bundy J, Li D, Pereles S, Finn JP. Cine MRangiography of the heart with segmented true fast imaging withsteady-state precession. Radiology 2001;219:828–34.
9. Kim RJ, Wu E, Rafael A, et al. The use of contrast-enhanced
magnetic resonance imaging to identify reversible myocardial dysfunc-tion. N Engl J Med 2000;343:1445–53.
1
1
1
1
1
1
1
1
1
1
2
2
2
K
887JACC Vol. 56, No. 11, 2010 Bruder et al.September 7, 2010:875–87 Cardiovascular Magnetic Resonance Risk Stratification in HCM
0. Simonetti OP, Kim RJ, Fieno DS, et al. An improved MR-imagingtechnique for the visualization of myocardial infarction. Radiology2001;218:215–23.
1. Choudhury L, Mahrholdt H, Wagner A. Myocardial scarring inminimally symptomatic patients with hypertrophic cardiomyopathy.J Am Coll Cardiol 2002;40:2156–64.
2. Moon JC, Reed E, Sheppard MN, et al. The histologic basis of lategadolinium enhancement cardiovascular magnetic resonance in hyper-trophic cardiomyopathy. J Am Coll Cardiol 2004;43:2260–4.
3. Klues HG, Schiffers A, Maron BJ. Phenotypic spectrum and patterns ofleft ventricular hypertrophy in hypertrophic cardiomyopathy: morphologicobservations and significance as assessed by two-dimensional echocardi-ography in 600 patients. J Am Coll Cardiol 1995;26:1699–708.
4. Leonardi S, Raineri C, De Ferrari GM, et al. Usefulness of cardiacmagnetic resonance in assessing the risk of ventricular arrhythmias andsudden death in patients with hypertrophic cardiomyopathy. EurHeart J 2009;30:2003–10.
5. Moon JCC, McKenna WJ, McCrohon JA. Toward clinical riskassessment in hypertrophic cardiomyopathy with gadolinium cardio-vascular magnetic resonance. J Am Coll Cardiol 2003;41:1561–7.
6. Charron P, Dubourg O, Desnos M, et al. Clinical features andprognostic implications of familial hypertrophic cardiomyopathy re-lated to the cardiac myosin-binding protein C gene. Circulation
1998;97:2230–6. c7. Michels M, Soliman OI, Phefferkorn J, et al. Disease penetrance andrisk stratification for sudden cardiac death in asymptomatic hypertro-phic cardiomyopathy mutation carriers. Eur Heart J 2009;30:2593–8.
8. Bolick DR, Hackel DB, Reimer KA, Ideker RE. Quantitative analysisof myocardial infarct structure in patients with ventricular tachycardia.Circulation 1986;74:1266–79.
9. Kwon DH, Smedira NG, Rodriguez ER, et al. Cardiac magneticresonance detection of myocardial scarring in hypertrophic cardiomy-opathy: correlation with histopathology and prevalence of ventriculartachycardia. J Am Coll Cardiol 2009;54:242–9.
0. Bruder O, Schneider S, Nothnagel D, et al. EuroCMR (Europeancardiovascular magnetic resonance) registry: results of the Germanpilot phase. J Am Coll Cardiol 2009;54:1457–66.
1. Wagner A, Bruder O, Schneider S, et al. Current variables, definitionsand endpoints of the European Cardiovascular Magnetic ResonanceImaging Registry. J Cardiovasc Magn Reson 2009;11:43.
2. Maron BJ, Spirito P, Shen WK, et al. Implantable cardioverter-defibrillators and prevention of sudden cardiac death in hypertrophiccardiomyopathy. JAMA 2007;298:405–12.
ey Words: cardiovascular magnetic resonance y hypertrophic
ardiomyopathy y risk factors y risk stratification y sudden cardiac death.