n. 566 - are there asymmetries in the response of bank ... · are there asymmetries in the response...
TRANSCRIPT
Temi di discussionedel Servizio Studi
Are there asymmetries in the response of bank interest rates to monetary shocks?
Number 566 - November 2005
by L. Gambacorta and S. Iannotti

The purpose of the Temi di discussione series is to promote the circulation of working papers prepared within the Bank of Italy or presented in Bank seminars by outside economists with the aim of stimulating comments and suggestions.
The views expressed in the articles are those of the authors and do not involve the responsibility of the Bank.
Editorial Board: GIORGIO GOBBI, MARCELLO BOFONDI, MICHELE CAIVANO, ANDREA LAMORGESE, FRANCESCO PATERNÒ, MARCELLO PERICOLI, ALESSANDRO SECCHI, FABRIZIO VENDITTI, STEFANIA ZOTTERI.Editorial Assistants: ROBERTO MARANO, CRISTIANA RAMPAZZI.
ARE THERE ASYMMETRIES IN THE RESPONSE
OF BANK INTEREST RATES TO MONETARY SHOCKS?
by Leonardo Gambacorta* and Simonetta Iannotti**
Abstract
This paper examines the velocity and asymmetry of the response of bank interest rates to monetary policy shocks. Using an Asymmetric Vector Error Correction Model (AVECM), it analyses the pass-through of changes in money market rates to retail bank interest rates in Italy in the period 1985-2002. The main results of the paper are: 1) the speed of adjustment of bank interest rates to monetary policy changes increased significantly after the introduction of the 1993 Consolidated Law on Banking; 2) interest rate adjustment in response to positive and negative shocks is asymmetric in the short run, but not in the long run; 3) banks adjust their loan (deposit) rate faster during periods of monetary tightening (easing); 4) this asymmetry almost vanished since the 1990s.
JEL classification: E43, E44, E52.
Keywords: monetary policy transmission, interest rates, asymmetries, liberalization.
Contents
1. Introduction.......................................................................................................................... 7 2. Some institutional characteristics of the Italian banking sector .......................................... 8 3. Data...................................................................................................................................... 9 4. The VAR model................................................................................................................. 12 5. Cointegration properties of interest rates........................................................................... 13 6. The Asymmetric Vector Error Correction Model (AVECM) ........................................... 16 7. Testing asymmetry and the reduced-form model .............................................................. 18 8. A simulation: adjustment to positive and negative shocks................................................ 19 9. Robustness checks ............................................................................................................. 20 10.Conclusions ....................................................................................................................... 21 Tables and figures................................................................................................................... 22 References .............................................................................................................................. 32
* Banca d’Italia, Economic Research Department. ** Banca d’Italia, Competition, Regulation and General Affairs.


1. Introduction1
This paper examines the velocity and asymmetry of the response of bank interest rates
to monetary policy shock. These aspects are very important for understanding monetary
transmission mechanisms: a change in the monetary stance is effective only if monetary
impulses are transmitted quickly to other rates and if the new structure of interest rates
affects real expenditure. Asymmetric behaviour of bank interest rates in the case of a
monetary tightening or easing could have different effects on output and prices, and
therefore knowing how much, how quickly and how symmetrically a change in the monetary
interest rate is transmitted to bank rates is extremely important for the conduct of monetary
policy. Moreover, an asymmetric response of banking rates also has major consequences for
profit margins, interest rate risks and the overall performance of the banking industry.
The empirical literature so far has documented that lending and deposit rates respond
sluggishly to money market rate changes.2 The studies for Italy refer to the 1980s and early
1990s, before the enactment of the 1993 Consolidated Law on Banking which has fostered
competition in the banking sector. One of the aims of this paper is to examine whether the
increased competition has had any effect on interest rate setting: the financial liberalization
process of Italy’s banking industry in the 1990s should have led to a faster adjustment of
bank interest rates to monetary policy changes compared with the 1980s, when a certain
degree of stickiness in bank interest rates could be observed.
We analyze the simultaneous interactions between three bank rates (on current
accounts, on short-term lending and on the interbank market) and the monetary policy
indicator (the rate on repurchase agreements) in two separate periods. The first (1985:01-
1993:08) coincides with the partial liberalization of the banking system, while in the second
1 We wish to thank two anonymous referees for very helpful comments. We also thank Heinz P. Galler,
Giorgio Gobbi, Guay Lim and participants at seminars held at the Bank of Italy and the Halle Institute for Economic Research for discussions and comments. The usual disclaimer applies. The opinions expressed in this paper are those of the authors only and in no way involve the responsibility of the Bank of Italy. Email: [email protected]; [email protected].
2 Among cross-country studies, see Cottarelli and Kourelis (1994), Borio and Fritz (1995) and de Bondt et al. (2003). Among national studies see Cottarelli et al. (1995) and Angeloni et al. (1995) for Italy, Weth (2002) for Germany, and Berlin and Mester (1999) for the US.

8
period (1993:09-2002:12) the Banking Law was already in force. The paper tests for
differences in the velocity of adjustment of banking rates to the monetary policy indicator
and for the presence of asymmetric adjustments in the event of opposite monetary policy
impulses (tightening or easing). The econometric framework used is an Asymmetric Vector
Error Correction Model (AVECM) as in Lim (2001). The AVECM is based on a
reformulation of the multivariate error correction model proposed by Johansen (1988; 1995),
which allows for asymmetric behaviour both in the long and the short run. In particular, the
model captures the interplay of long-run optimizing behaviour on the part of banks,
embedded in the cointegration relationship, with their short-run adjustments, captured by the
part in first difference.
The paper is organized as follows. Section 2 analyzes some institutional characteristics
of the Italian banking sector. Section 3 gives a descriptive analysis of the data and identifies
possible breaks in the estimation period. After an analysis of the characteristics of the VAR
model in Section 4, Section 5 discusses the long-run relationship between the interest rates
using Johansen’s methodology. Section 6 presents the Asymmetric Vector Error Correction
Model used to test for the presence of asymmetric behaviour depending on whether policy
rates are increasing or decreasing. Model specification tests are reported in Section 7, while
Section 8 contains the result of a simulation using the estimated AVECM for Italy.
Robustness checks are presented in Section 9. The last section summarizes the main
conclusions.
2. Some institutional characteristics of the Italian banking sector
Before discussing the econometric analysis of banks’ interest rate setting, we briefly
highlight the important measures to liberalize the markets and deregulate the intermediaries
implemented over the last two decades (Ciocca, 2000). This institutional analysis will help
us to identify the estimation periods with respect to different degrees of financial
liberalization.
At the beginning of the 1980s the Italian banking system was quite tightly regulated: 1)
foreign exchange controls were in place; 2) the establishment of new banks and the opening
9
of new bank branches were subject to authorization;3 3) competition was curbed by
mandatory maturity specialization, with special credit institutions operating at medium-long
term maturities and commercial banks at short-term; 4) the quantity of bank lending was
subject to a ceiling.
All these restrictions were gradually removed between the mid-1980s and the early
1990s (Cottarelli et al., 1995; Passacantando, 1996; Angelini and Cetorelli, 2002): 1) the
ceiling on lending was abolished de facto in 1985; 2) foreign exchange controls were lifted
between 1987 and 1990; 3) branching was liberalized in 1990; 4) the 1993 Consolidated Law
on Banking allowed banks and special credit institutions to perform all banking activities.4
On the basis of these institutional characteristics of the Italian banking system, we
divide the estimation period into two parts. The first sub-sample (1985:01-1993:08) refers to
the period of partial liberalization. Previous periods are excluded because the presence of
ceilings on lending could influence the results. The second sample (1993:09-2002:12) starts
with the introduction of the Consolidated Law on Banking and refers to a period in which all
restrictions were largely removed.
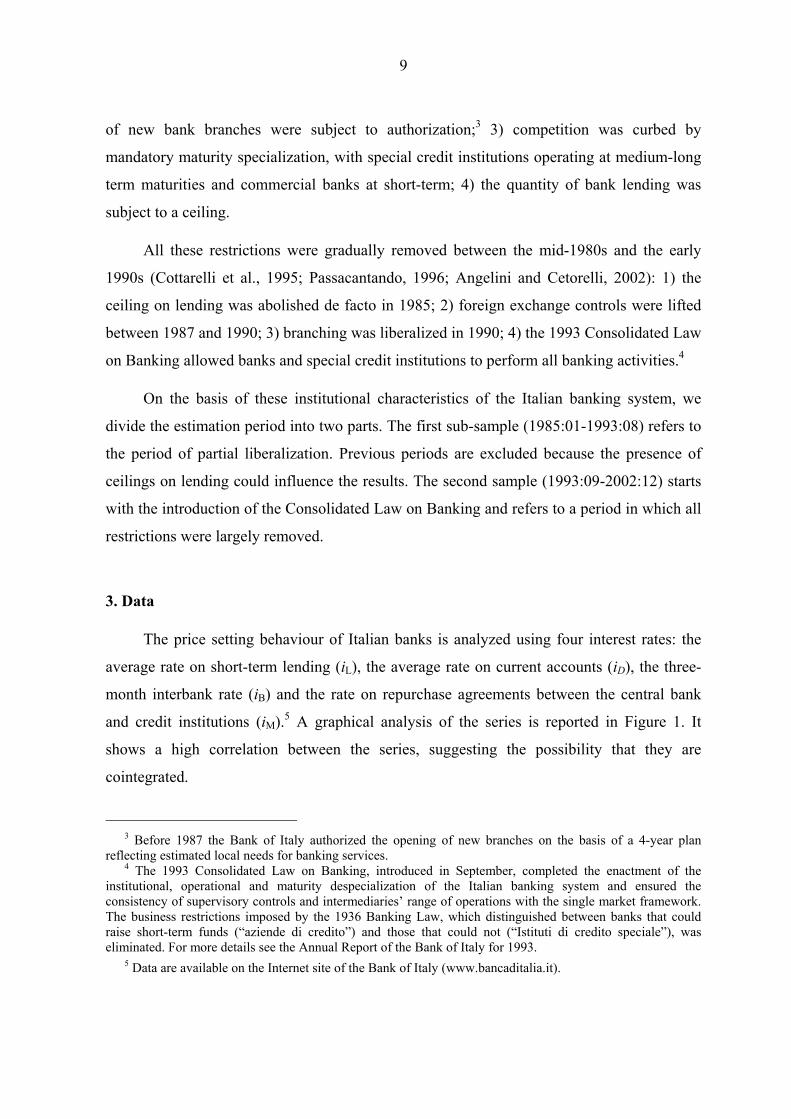
3. Data
The price setting behaviour of Italian banks is analyzed using four interest rates: the
average rate on short-term lending (iL), the average rate on current accounts (iD), the three-
month interbank rate (iB) and the rate on repurchase agreements between the central bank
and credit institutions (iM).5 A graphical analysis of the series is reported in Figure 1. It
shows a high correlation between the series, suggesting the possibility that they are
cointegrated.
3 Before 1987 the Bank of Italy authorized the opening of new branches on the basis of a 4-year plan
reflecting estimated local needs for banking services. 4 The 1993 Consolidated Law on Banking, introduced in September, completed the enactment of the
institutional, operational and maturity despecialization of the Italian banking system and ensured the consistency of supervisory controls and intermediaries’ range of operations with the single market framework. The business restrictions imposed by the 1936 Banking Law, which distinguished between banks that could raise short-term funds (“aziende di credito”) and those that could not (“Istituti di credito speciale”), was eliminated. For more details see the Annual Report of the Bank of Italy for 1993.
5 Data are available on the Internet site of the Bank of Italy (www.bancaditalia.it).

10
The choice of the rate on domestic short-term lending has two main advantages. First,
it excludes credit directly channeled through legal requirements (i.e. lending to housing and
rural sectors) and foreign exchange operations. Second, short-term loans are typically not
collateralized and this allows the effects of the “balance sheet” channel to be isolated
(Mishkin, 1995; Oliner and Rodebusch, 1996; Kashyap and Stein, 1997). Broadly speaking,
the pass-through from market interest rates to the interest rate on loans does not depend on
market price variations that influence the value of collateral. Nearly half of banks’ business
is done at this rate.
The deposit rate is the weighted average rate paid on current accounts, which are
highly homogenous deposit products. Current accounts are the most common type of deposit
(at the end of 2002 they represented around 70 per cent of total bank deposits and passive
repos). Current accounts allow unlimited checking for depositors, who can close the account
without notice. The bank, in turn, can change the interest paid on the account at any time.
Both bank rates are posted rates that are changed at discrete intervals (often less than
weekly, see Green, 1998). In our case, the monthly frequency of the data is sufficient to
capture all relevant changes due to monetary policy shocks. Both rates are before tax.
The interbank rate is included in the model because, especially in the first period of
partial liberalization, the transmission of monetary policy impulses to the interbank rate
could take more than a month (see, among others, Amisano et al., 1997).
The interest rate taken as monetary policy indicator is that on repurchase agreements
between the Bank of Italy and credit institutions in the period 1985:01-1998:12, and the
interest rates on main refinancing operations of the ECB in the period 1999:01-2002:12. As
pointed out by Amisano et al. (1997) and Buttiglione and Ferri (1994), in the period under
investigation the repo rate mostly affected the short-term end of the yield curve and it
represented the value to which market rates and bank rates eventually tended to converge. It
is worth noting that the interest rate on main refinancing operations of the ECB does not
present any particular break with the repo rate at the beginning of stage three of EMU. The
Augmented Dickey Fuller (ADF) tests provided in Table 1 clearly show that all the series are
I(1) without drift.
11
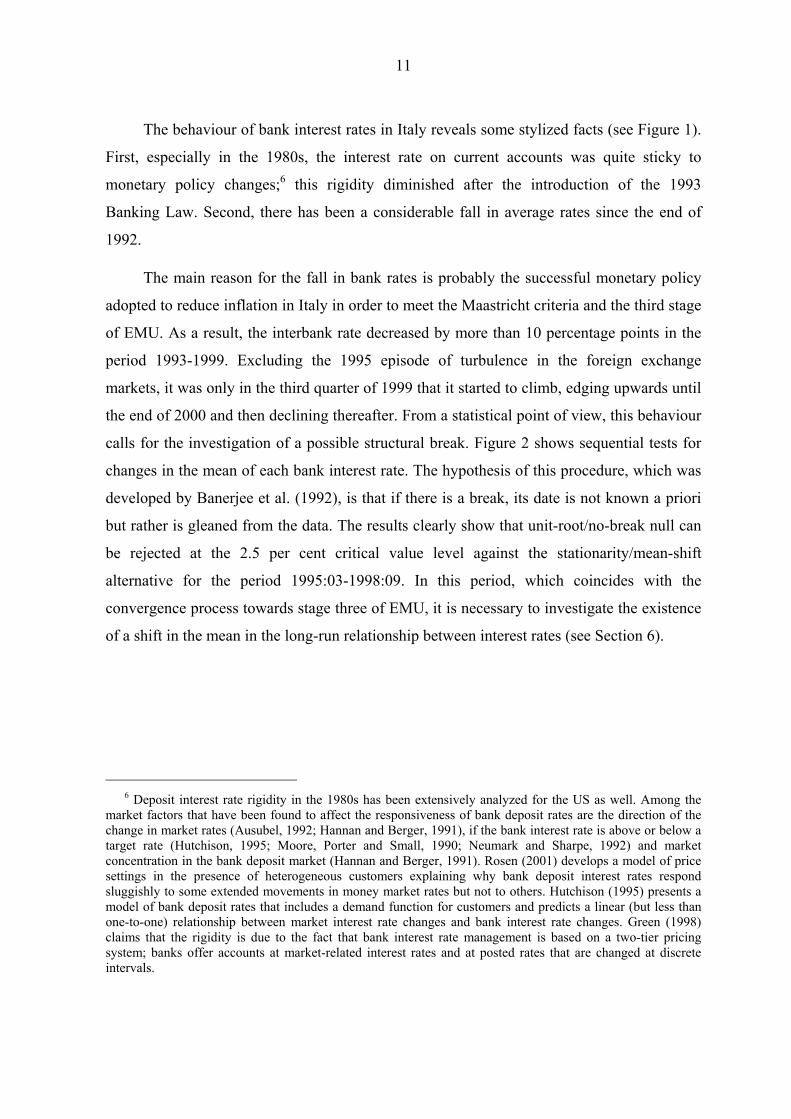
The behaviour of bank interest rates in Italy reveals some stylized facts (see Figure 1).
First, especially in the 1980s, the interest rate on current accounts was quite sticky to
monetary policy changes;6 this rigidity diminished after the introduction of the 1993
Banking Law. Second, there has been a considerable fall in average rates since the end of
1992.
The main reason for the fall in bank rates is probably the successful monetary policy
adopted to reduce inflation in Italy in order to meet the Maastricht criteria and the third stage
of EMU. As a result, the interbank rate decreased by more than 10 percentage points in the
period 1993-1999. Excluding the 1995 episode of turbulence in the foreign exchange
markets, it was only in the third quarter of 1999 that it started to climb, edging upwards until
the end of 2000 and then declining thereafter. From a statistical point of view, this behaviour
calls for the investigation of a possible structural break. Figure 2 shows sequential tests for
changes in the mean of each bank interest rate. The hypothesis of this procedure, which was
developed by Banerjee et al. (1992), is that if there is a break, its date is not known a priori
but rather is gleaned from the data. The results clearly show that unit-root/no-break null can
be rejected at the 2.5 per cent critical value level against the stationarity/mean-shift
alternative for the period 1995:03-1998:09. In this period, which coincides with the
convergence process towards stage three of EMU, it is necessary to investigate the existence
of a shift in the mean in the long-run relationship between interest rates (see Section 6).
6 Deposit interest rate rigidity in the 1980s has been extensively analyzed for the US as well. Among the
market factors that have been found to affect the responsiveness of bank deposit rates are the direction of the change in market rates (Ausubel, 1992; Hannan and Berger, 1991), if the bank interest rate is above or below a target rate (Hutchison, 1995; Moore, Porter and Small, 1990; Neumark and Sharpe, 1992) and market concentration in the bank deposit market (Hannan and Berger, 1991). Rosen (2001) develops a model of price settings in the presence of heterogeneous customers explaining why bank deposit interest rates respond sluggishly to some extended movements in money market rates but not to others. Hutchison (1995) presents a model of bank deposit rates that includes a demand function for customers and predicts a linear (but less than one-to-one) relationship between market interest rate changes and bank interest rate changes. Green (1998) claims that the rigidity is due to the fact that bank interest rate management is based on a two-tier pricing system; banks offer accounts at market-related interest rates and at posted rates that are changed at discrete intervals.
12
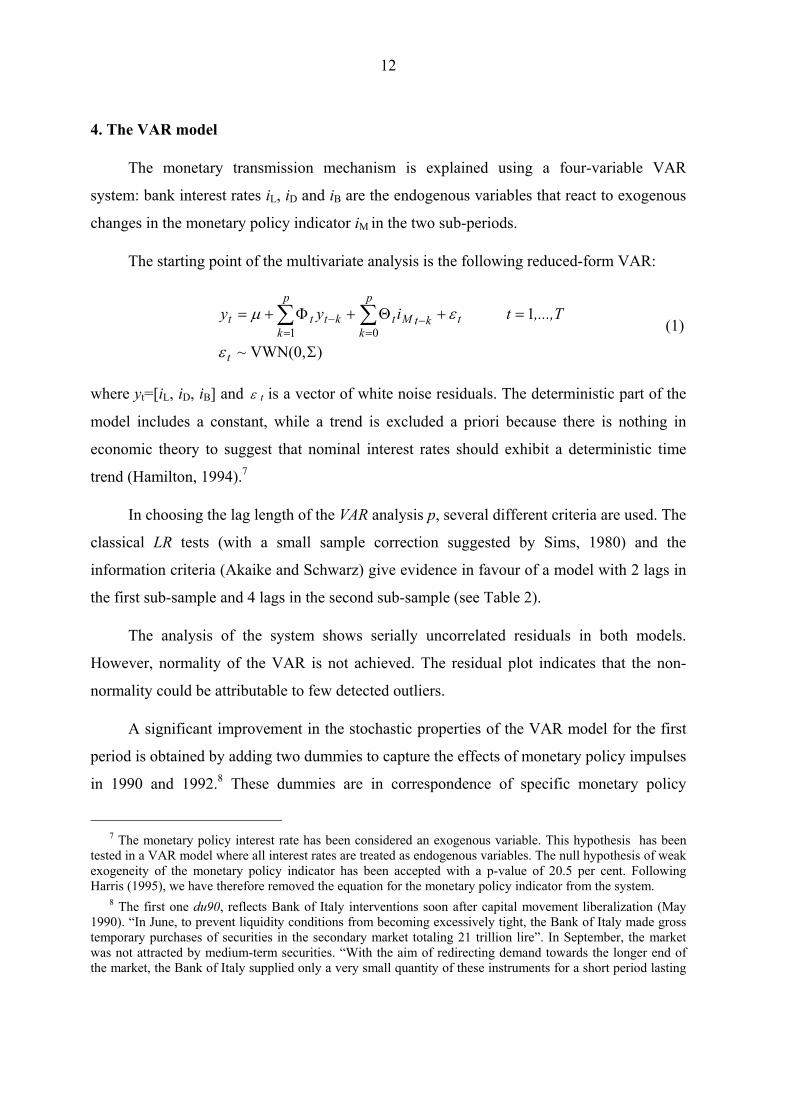
4. The VAR model
The monetary transmission mechanism is explained using a four-variable VAR
system: bank interest rates iL, iD and iB are the endogenous variables that react to exogenous
changes in the monetary policy indicator iM in the two sub-periods.
The starting point of the multivariate analysis is the following reduced-form VAR:
)VWN(0,~
1 01
Σ
=+Θ+Φ+= −=
−=
∑∑
t
tktM
p
ktkt
p
ktt ,...,Ttiyy
ε
εµ (1)
where yt=[iL, iD, iB] and ε t is a vector of white noise residuals. The deterministic part of the
model includes a constant, while a trend is excluded a priori because there is nothing in
economic theory to suggest that nominal interest rates should exhibit a deterministic time
trend (Hamilton, 1994).7
In choosing the lag length of the VAR analysis p, several different criteria are used. The
classical LR tests (with a small sample correction suggested by Sims, 1980) and the
information criteria (Akaike and Schwarz) give evidence in favour of a model with 2 lags in
the first sub-sample and 4 lags in the second sub-sample (see Table 2).
The analysis of the system shows serially uncorrelated residuals in both models.
However, normality of the VAR is not achieved. The residual plot indicates that the non-
normality could be attributable to few detected outliers.
A significant improvement in the stochastic properties of the VAR model for the first
period is obtained by adding two dummies to capture the effects of monetary policy impulses
in 1990 and 1992.8 These dummies are in correspondence of specific monetary policy
7 The monetary policy interest rate has been considered an exogenous variable. This hypothesis has been
tested in a VAR model where all interest rates are treated as endogenous variables. The null hypothesis of weak exogeneity of the monetary policy indicator has been accepted with a p-value of 20.5 per cent. Following Harris (1995), we have therefore removed the equation for the monetary policy indicator from the system.
8 The first one du90, reflects Bank of Italy interventions soon after capital movement liberalization (May 1990). “In June, to prevent liquidity conditions from becoming excessively tight, the Bank of Italy made gross temporary purchases of securities in the secondary market totaling 21 trillion lire”. In September, the market was not attracted by medium-term securities. “With the aim of redirecting demand towards the longer end of the market, the Bank of Italy supplied only a very small quantity of these instruments for a short period lasting
13
interventions. As regards the second sub-period, one point dummy in 1995:03 is necessary to
take account of the spikes in interest rates due to turbulence in the foreign exchange markets.
Even if the stochastic properties of the model improve significantly, reaching a normal
residual distribution (see Table 3), the inclusion of these dummies affects the underlying
distribution on which cointegration tests depend, so that the critical values reported
thereafter are only indicative.
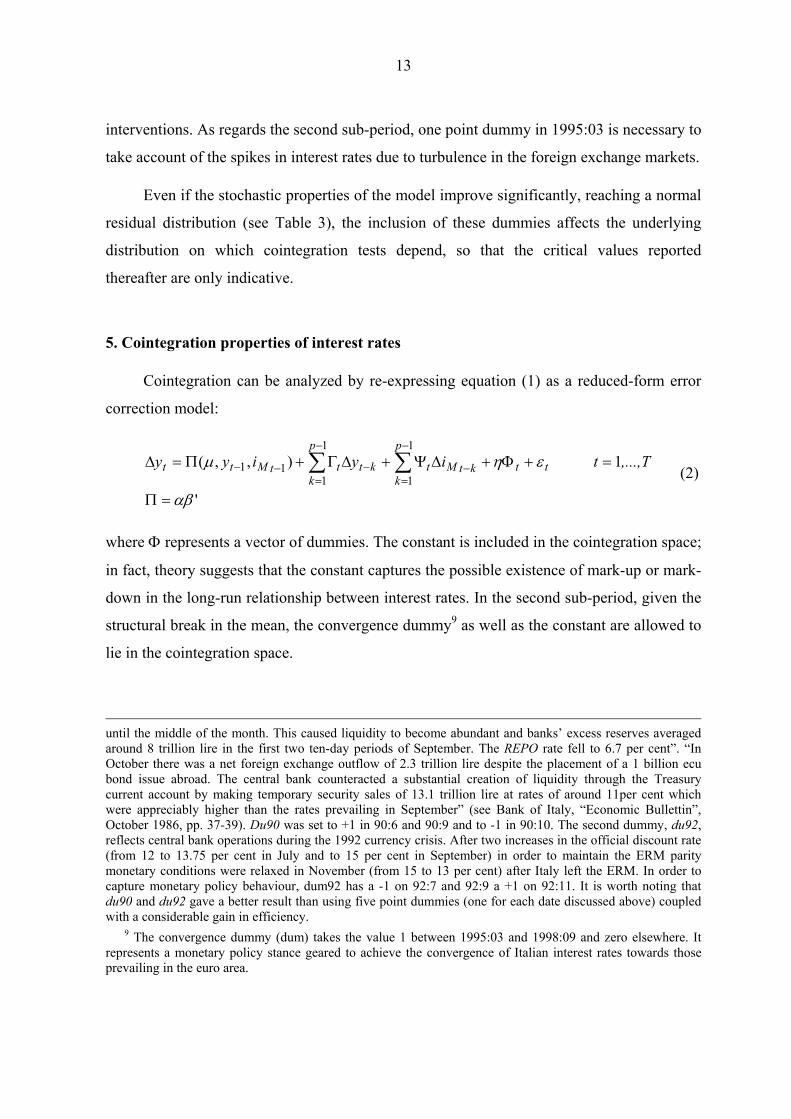
5. Cointegration properties of interest rates
Cointegration can be analyzed by re-expressing equation (1) as a reduced-form error
correction model:
'
1 ),,(1
1
1
111
αβ
εηµ
=Π
=+Φ+∆Ψ+∆Γ+Π=∆ −
−
=−
−
=−− ∑∑ ,...,Ttiyiyy ttktM
p
ktkt
p
kttMtt (2)
where Φ represents a vector of dummies. The constant is included in the cointegration space;
in fact, theory suggests that the constant captures the possible existence of mark-up or mark-
down in the long-run relationship between interest rates. In the second sub-period, given the
structural break in the mean, the convergence dummy9 as well as the constant are allowed to
lie in the cointegration space.
until the middle of the month. This caused liquidity to become abundant and banks’ excess reserves averaged around 8 trillion lire in the first two ten-day periods of September. The REPO rate fell to 6.7 per cent”. “In October there was a net foreign exchange outflow of 2.3 trillion lire despite the placement of a 1 billion ecu bond issue abroad. The central bank counteracted a substantial creation of liquidity through the Treasury current account by making temporary security sales of 13.1 trillion lire at rates of around 11per cent which were appreciably higher than the rates prevailing in September” (see Bank of Italy, “Economic Bullettin”, October 1986, pp. 37-39). Du90 was set to +1 in 90:6 and 90:9 and to -1 in 90:10. The second dummy, du92, reflects central bank operations during the 1992 currency crisis. After two increases in the official discount rate (from 12 to 13.75 per cent in July and to 15 per cent in September) in order to maintain the ERM parity monetary conditions were relaxed in November (from 15 to 13 per cent) after Italy left the ERM. In order to capture monetary policy behaviour, dum92 has a -1 on 92:7 and 92:9 a +1 on 92:11. It is worth noting that du90 and du92 gave a better result than using five point dummies (one for each date discussed above) coupled with a considerable gain in efficiency.
9 The convergence dummy (dum) takes the value 1 between 1995:03 and 1998:09 and zero elsewhere. It represents a monetary policy stance geared to achieve the convergence of Italian interest rates towards those prevailing in the euro area.

14
This framework can be used to apply Johansen’s trace test to verify the order of
integration of the matrix Π. In fact, the rank of Π determines the number of cointegrating
vectors (r) such that α is a n r× matrix of loading coefficients and β is a n r× matrix of
cointegrating vectors.
The results are reported in Table 4. Johansen’s cointegration rank statistics show the
presence of 3 cointegrating relationships in the model. The hypothesis of the existence of
three cointegrating vectors is consistent with a strong a-priori economic view because if we
consider a set of nominal interest rates, the non–stationary driving force for all of them is
likely to be the inflationary process. Nevertheless, as discussed in the previous section, the
presence of dummy variables in the model affects the underlying distribution on which
Johansen’s cointegration test depends, so that the critical values reported in the first part of
Table 4 are only indicative. Therefore, in order to provide the robustness of the rank result, a
Hansen and Johansen (1993) iterative procedure is investigated. The outcome, presented in
Figure 3, suggests that the evidence of rank 3 is strongly consistent.
As for the economic interpretation of the cointegrating relationship, we suppose that
the interbank rate is equal to the exogenous monetary policy rate plus a mark-up, µB. The
latter is equal to zero if interbank lending is considered a risk-free activity.
BMB ii µ+= (3)
Economic theory on oligopolistic (and perfect) competition suggests that, in the long
run, both bank rates (on lending and deposits) should be related to the interbank rate that
represents the cost of banks’ refinancing. For example, Freixas and Rochet (1997) show that
in a model of imperfect competition among N banks, the relationships between the three
interest rates become:
LBL ii µ+= (4)
DBD ii µξ +−= )1( (5)

15
where NLLiLLL
**)('+= γµ and
NDDiDDD
**)('+= γµ are constants. In the unique Cournot
equilibrium each bank x sets the same quantity of loans (*
iLLN
= ) and deposits (*
iDDN
= ). A
part of deposits (ξ) is invested in compulsory (or free) reserves. The mark-up µL (mark-down
µD) is influenced by the constant marginal cost of intermediation on lending Lγ (deposits
Dγ ) and by the elasticity of the loan (deposit) demand function evaluated at the optimum. It
is worth noting that in the case of perfect competition (N→∞), the last part in µL and µD goes
to zero and long-run relationships are independent of loan and deposit demand functions.
The normalized cointegrating relationships are presented in the second part of Table 4,
with the associated standard errors. No identification restrictions are imposed on the
cointegrating space. The results give us the following insights. First, in the period of partial
liberalization both the long-run elasticities of bank rates with respect to the monetary policy
indicator and the loading coefficients have lower absolute values. This result leads to an
increase in competition in the 1990s. In particular, the lower values of the loadings in the
first part of the sample period indicate a more sluggish reversion to the long-run equilibrium
in the case of an exogenous shock.
Second, given that some of the loading coefficients are not statistically different from
zero in both periods, the model can be simplified. In particular, the third cointegrating
relationship does not enter the first two equations for iL and iD (αD3 and αL3 are statistically
not different from zero), while the first two cointegrating relationships do not enter the
equation for iB (αB1 and αB2 are zero). This means that the interbank rate is weakly
exogenous with respect to the two banking rates and that it responds directly to the monetary
policy indicator. Indeed, exogenous shocks in the long-run relationships that drive both bank
rates do not influence the interbank rate. This result is consistent with a causal chain between
interest rates of the type: iM → iB → (iD, iL). The null hypothesis αD3=αL3=αB1=αB2=0 is
accepted for both sub-samples with p-values of, respectively, 0.24 and 0.10 per cent. As we
will see in the next section this result will be used to reduce the number of parameters in the
asymmetric model.
16
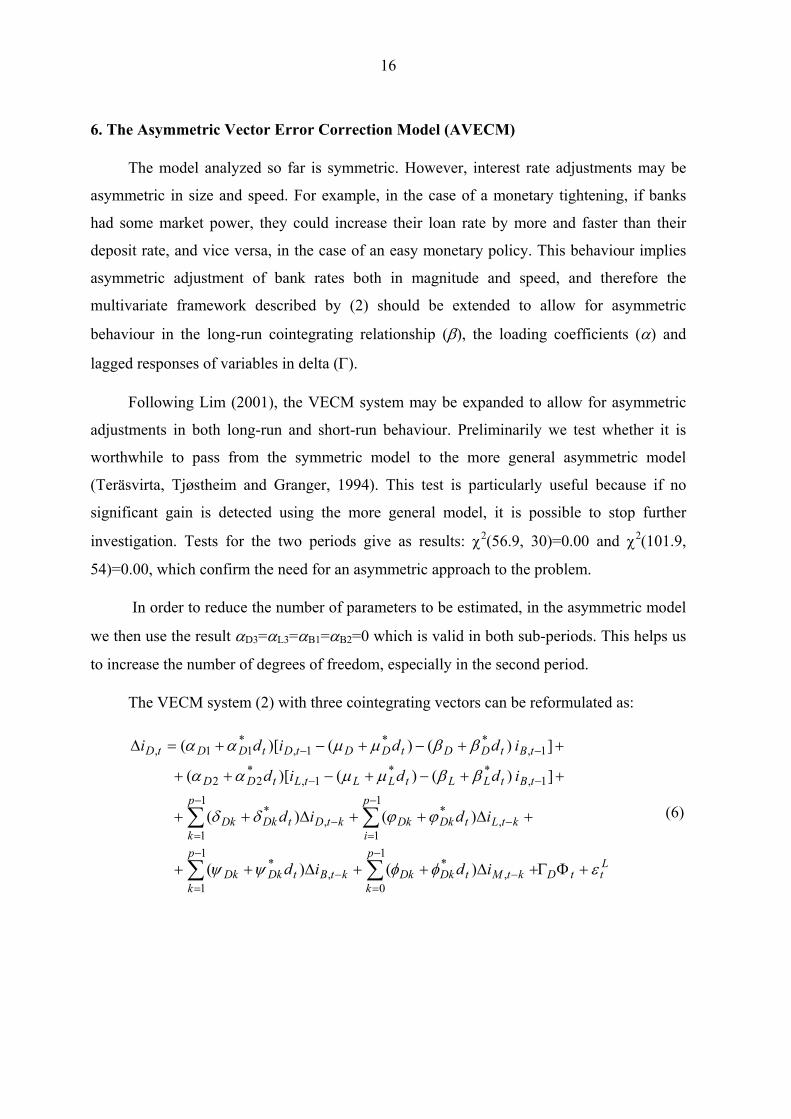
6. The Asymmetric Vector Error Correction Model (AVECM)
The model analyzed so far is symmetric. However, interest rate adjustments may be
asymmetric in size and speed. For example, in the case of a monetary tightening, if banks
had some market power, they could increase their loan rate by more and faster than their
deposit rate, and vice versa, in the case of an easy monetary policy. This behaviour implies
asymmetric adjustment of bank rates both in magnitude and speed, and therefore the
multivariate framework described by (2) should be extended to allow for asymmetric
behaviour in the long-run cointegrating relationship (β), the loading coefficients (α) and
lagged responses of variables in delta (Γ).
Following Lim (2001), the VECM system may be expanded to allow for asymmetric
adjustments in both long-run and short-run behaviour. Preliminarily we test whether it is
worthwhile to pass from the symmetric model to the more general asymmetric model
(Teräsvirta, Tjøstheim and Granger, 1994). This test is particularly useful because if no
significant gain is detected using the more general model, it is possible to stop further
investigation. Tests for the two periods give as results: χ2(56.9, 30)=0.00 and χ2(101.9,
54)=0.00, which confirm the need for an asymmetric approach to the problem.
In order to reduce the number of parameters to be estimated, in the asymmetric model
we then use the result αD3=αL3=αB1=αB2=0 which is valid in both sub-periods. This helps us
to increase the number of degrees of freedom, especially in the second period.
The VECM system (2) with three cointegrating vectors can be reformulated as:
LttD
p
kktMtDkDk
p
kktBtDkDk
p
iktLtDkDk
p
kktDtDkDk
tBtLLtLLtLtDD
tBtDDtDDtDtDDtD
idid
idid
iddid
iddidi
εφφψψ
ϕϕδδ
ββµµαα
ββµµαα
+ΦΓ+∆++∆++
+∆++∆++
++−+−++
++−+−+=∆
∑∑
∑∑−
=−
−
=−
−
=−
−
=−
−−
−−
1
0,
*1
1,
*
1
1,
*1
1,
*
1,**
1,*
22
1,**
1,*
11,
)()(
)()(
] )()()[(
] )()()[(
(6)
17
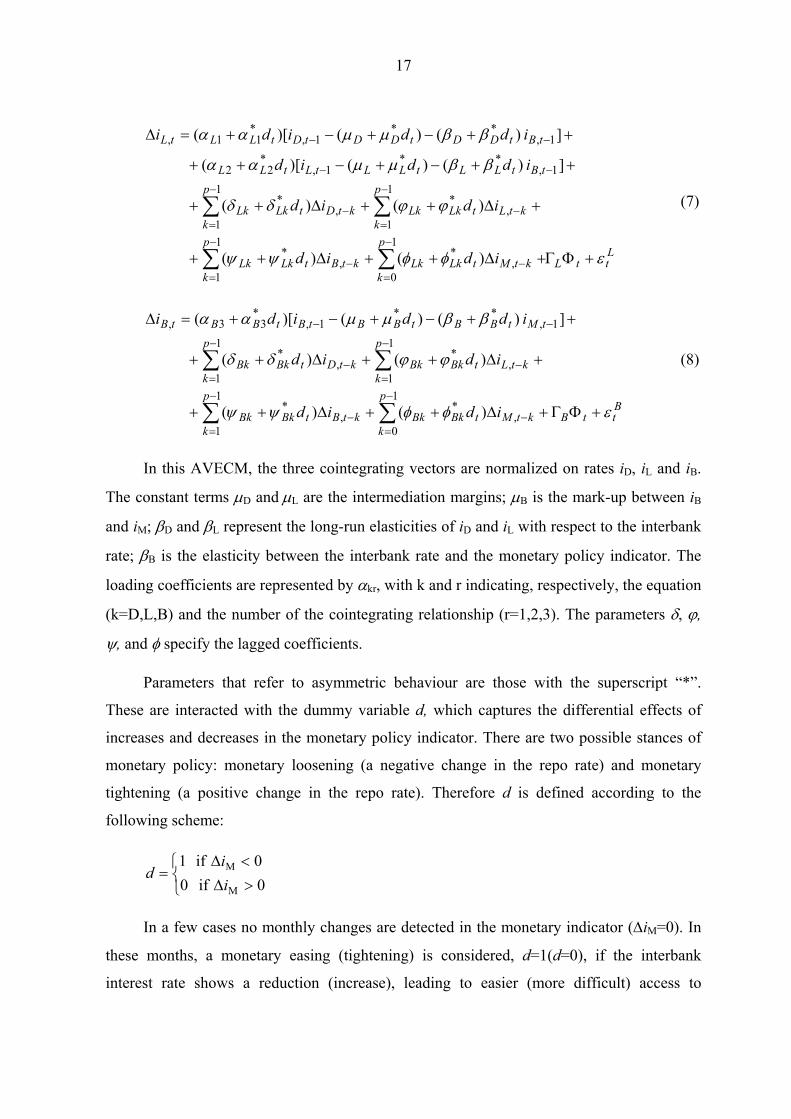
LttL
p
kktMtLkLk
p
kktBtLkLk
p
kktLtLkLk
p
kktDtLkLk
tBtLLtLLtLtLL
tBtDDtDDtDtLLtL
idid
idid
iddid
iddidi
εφφψψ
ϕϕδδ
ββµµαα
ββµµαα
+ΦΓ+∆++∆++
+∆++∆++
++−+−++
++−+−+=∆
∑∑
∑∑−
=−
−
=−
−
=−
−
=−
−−
−−
1
0,
*1
1,
*
1
1,
*1
1,
*
1,**
1,*
22
1,**
1,*11,
)()(
)()(
] )()()[(
] )()()[(
(7)
BttB
p
kktMtBkBk
p
kktBtBkBk
p
kktLtBkBk
p
kktDtBkBk
tMtBBtBBtBtBBtB
idid
idid
iddidi
εφφψψ
ϕϕδδ
ββµµαα
+ΦΓ+∆++∆++
+∆++∆++
++−+−+=∆
∑∑
∑∑−
=−
−
=−
−
=−
−
=−
−−
1
0,
*1
1,
*
1
1,
*1
1,
*
1,**
1,*
33,
)()(
)()(
] )()()[(
(8)
In this AVECM, the three cointegrating vectors are normalized on rates iD, iL and iB.
The constant terms µD and µL are the intermediation margins; µB is the mark-up between iB
and iM; βD and βL represent the long-run elasticities of iD and iL with respect to the interbank
rate; βB is the elasticity between the interbank rate and the monetary policy indicator. The
loading coefficients are represented by αkr, with k and r indicating, respectively, the equation
(k=D,L,B) and the number of the cointegrating relationship (r=1,2,3). The parameters δ, ϕ,
ψ, and φ specify the lagged coefficients.
Parameters that refer to asymmetric behaviour are those with the superscript “*”.
These are interacted with the dummy variable d, which captures the differential effects of
increases and decreases in the monetary policy indicator. There are two possible stances of
monetary policy: monetary loosening (a negative change in the repo rate) and monetary
tightening (a positive change in the repo rate). Therefore d is defined according to the
following scheme:
>∆<∆
=0 if 00 if 1
M
M
ii
d
In a few cases no monthly changes are detected in the monetary indicator (∆iM=0). In
these months, a monetary easing (tightening) is considered, d=1(d=0), if the interbank
interest rate shows a reduction (increase), leading to easier (more difficult) access to
18
interbank liquidity. Figure 4 shows the changes in the monetary policy indicator in the two
periods.
7. Testing asymmetry and the reduced-form model
Starting from the model described in equations (6)-(8), we follow a general to specific
strategy to test for asymmetry. Nevertheless, this approach is not interpreted as a mechanical
reduction process that implies dropping all insignificant parameters (Pagan, 1990). The
removal of every insignificant parameter is done to control for the multivariate significance
level of the model. All tests for asymmetry are reported in Table 5.
Asymmetry is tested considering the null hypothesis of zero restrictions on the dummy
variables. The test for asymmetry in the loading coefficients (see part A of Table 5) supports
the hypothesis of a different adjustment to disequilibrium gaps. On closer analysis, the
asymmetry in the first period is contained in the loading coefficients αD1*
and αL2*
; in this
case the model can be further simplified because αD2 and αL1 are statistically not different
from zero.10 In the second period a single asymmetry is detected for αL1*.
From an economic perspective this means that in the first period there is a greater
difference in the velocity of adjustment of both bank rates towards the long-run equilibrium.
In particular, the signs of the coefficients show that the interest rate on deposits responds
faster when the deviation from the long-run equilibrium is caused by an easy monetary
policy. On the contrary, the adjustment towards the long-run equilibrium is faster for lending
rates in the case of monetary tightening. In the second period, the only asymmetry is
detected in the response of the lending rate to a deviation in the long run relationship
between the interest rate on deposits and the interbank rate. This result suggests that after the
introduction of the Banking Law there was a greater interplay between lending and deposits
price strategy.
By contrast, the test for asymmetry in the intercept and elasticities of the long-run
relationships (parts B and C in Table 5) always fails to support the hypothesis of a different
10 The likelihood ratio for αD2 =αD2
*=αL1=αL1 *=0 is given by χ2 (4)=5.57 with a p-value of 0.23 per cent.
19
equilibrium due to the characteristics of the monetary policy impulse. This means that in the
long run the pass-through from money market rates to bank rates has the same size
independent of the sign of the shock. This is also consistent with the idea that in the long run
the equilibrium between interest rates is unique.
The significance of asymmetries in the lagged terms (see part D of table 5) gives
information about the dynamic path of adjustment in the short run. The results show that in
both sub-samples bank interest rates react asymmetrically to short-term changes in the
monetary policy indicator. However, the asymmetric effect on the interbank rate is
statistically significant only in the first period, and vanishes in the 1990s. There is also an
asymmetry in the autoregressive part of the equation for loan interest rates for the second
period; however, since the sign of the asymmetric coefficient is positive it tends to
counterbalance the asymmetric effects detected in the case of a change in the monetary
policy indicator. In other words, when a monetary easing occurs, the reduction of the short-
term interest rate in the first months is counterbalanced by a positive autoregressive
coefficient, which reflects an increase in the velocity of adjustment towards the new
equilibrium. Table 6 presents the results for the reduced trivariate system, including the
significant asymmetric short-term effects.
8. A simulation: adjustment to positive and negative shocks
In order to evaluate the effect of an exogenous monetary policy shock a simulation
exercise is performed to generate time paths for the three bank rates. Figure 5 presents the
adjustment paths of the three bank interest rates to positive and negative changes in iM. In
particular, the policy experiment consists in increasing (decreasing) the repo rate by one per
cent, starting from a base when the trivariate system is in equilibrium. To make simulations
more graphically comparable, the effects for easy monetary policy have been multiplied by
-1. The main results are the following.
In both regimes (partial liberalization and complete deregulation), the cumulative long-
run changes in iL, iD and iB to a monetary shock are symmetric. Consistently with economic
theory, the hypothesis of a long-run unitary elasticity between both the short-term lending

20
rate and the interbank rate and the monetary policy indicator is largely accepted (βL=βB=1).11
On the contrary, given the presence of the reserve coefficient, the elasticity between iD and
iM, βD, is around 0.7 in both sub-periods. This is consistent with the work of Cottarelli et al.
(1995) for the first period and Gambacorta (2005) for the second period.
In the short run, lending rates adjust faster with rising interest rates and less markedly
when interest rates are falling. On the contrary, interest rates on deposits tend to converge
more rapidly to the long-run equilibrium in the case of a monetary easing and more
sluggishly in the case of a tightening. However, these differences in short-run adjustments
diminish over time. Indeed, after a year the gap between the response of the lending rate to a
tight and an easy monetary policy is 14 basis points in the first period and 3 basis points in
the second. In the case of deposits the difference is -12 basis points in the period of partial
liberalization and vanishes in the deregulation period.
Asymmetries in the adjustment of the interbank rate to a monetary shock are detected
only in the first period. This reflects the existence, from the beginning of the 1990s, of an
efficient screen-based market for interbank deposits (Mercato Interbancario dei Depositi,
MID) in Italy, which led to a reduction in the number of bilateral current accounts between
banks and a strong increase in competitiveness.
9. Robustness checks
The robustness of the results is checked in several ways. The first test is to estimate a
simple model for the second sub-sample (1993:09-2002:12) which excludes the interbank
rate. This specification helps us to check if the results on the asymmetric effects in Section 7
are robust in terms of a greater number of degrees of freedom. The exclusion of the
interbank rate from the model can be adopted because of the high velocity of adjustment of
the interbank rate to the policy rate in the 1990s. However, a formal test of exclusion of this
variable from the model can be accepted only marginally (the p-value is 0.011). The
simplified version of the model turns out to have the same characteristics as the more general
11 As for the test βL=βB=1, the likelihood ratio test statistic is 0.981 with a p-value of 0.612 in the first
period and 0.402 with a p-value of 0.818 in the second period.
21
one (the same lags and cointegration properties). As for asymmetries, the only difference is
the lack of significance of α*L1 (the null hypothesis can be accepted with a p-value of
0.125). The simulation exercises confirm the existence of a difference in adjustment only in
the short-run (the gaps between the response of bank rates to a tight and an easy monetary
policy vanish after eight months). No asymmetry is detected in the long run.
The second test considers whether different fiscal treatments over the sample period
could have changed deposit demand (from June 1996 the interest rate on deposits is subject
to 27 per cent tax, deducted at source; 12.5 per cent before). However, when the net interest
rate on current accounts is used in place of the gross rate, nothing changes.
The third robustness check analyzes the cointegration properties in a model where all
variables are endogenous. Even in this case the λ-trace test shows the existence of three
cointegrating relationships. Loading coefficients and long-run elasticities remain the same.
10. Conclusions
In this paper we investigate velocity and asymmetry in the response of bank interest
rates to monetary policy shocks in Italy in the period 1985-2002. Understanding asymmetric
responses of bank rates is important in two respects: first, because of their potential impact
on output and prices, and second, because it gives insights into banks’ behaviour in their
relationship with customers and more generally regarding the evolution of competitive
conditions in the credit and deposit markets. Using an Asymmetric Vector Correction Model
(AVECM) that allows for different behaviour in both the long-run and the short-run, we
obtain the following results: 1) the speed of adjustment of bank interest rates to monetary
policy changes increased significantly after the introduction of the 1993 Banking Law; 2)
interest rate adjustments, in response to positive and negative shocks, are asymmetric in the
short run, but not in the long run, consistently with the idea that in the long run the
equilibrium is unique; 3) banks adjust their loan (deposit) prices at a faster rate during
periods of monetary tightening (easing); 4) this asymmetry has almost vanished since the
1990s.

Tables and figures

Table 1
AUGMENTED DICKEY-FULLER TESTS
Only two models are compared: Model B, which includes a constant and Model A, which has no deterministic components. Following Hamilton (1994), the presence of a linear trend in interest rates is not considered because it is theoretically inconsistent. Starting from the more general model the progressive tests establish what is the most appropriate deterministic component (Model B → Model A). The lagged differences in the models are included to obtain white noise residuals. The length of the lag (p*) used in the model for each series is chosen by comparing three different information criteria (Schwarz, Hannan-Quinn and Final Prediction Error), taking into consideration the necessary condition that the errors should be white noise. Further information on the test is provided by Said and Dickey (1984) and Dolado and Jenkinson (1987).
Model B p*-1
t t-1 j t-1 tj=1
y + y yµ ρ ρ ε∆ = + ∆ +∑
Model A p*-1
t t-1 j t-1 tj=1
y y yρ ρ ε∆ = + ∆ +∑
Series p*
ρ=0 τµ
µ=0 ταµ
ρ=µ=0 Φ1
ρ=0 τ
I:1985:01-1993:08
iL 3 -2.66 2.45 3.96 -1.06 iD 4 -2.81 2.49 4.53 -2.11 iB 4 -2.73 2.63 4.10 -0.99 iM 6 -2.74 2.67 3.89 -0.73
II: 1993:09-2002:12 iL 3 -0.77 0.40 0.85 -1.19 iD 4 -1.09 0.25 1.53 -1.20 iB 4 -0.79 0.31 0.86 -1.32 iM 2 -0.66 -0.01 1.40 -1.51
Critical 5% -2.89 2.54 4.71 -1.94 values 1% -3.51 3.22 6.70 -2.59
Table 2
LAG ORDER DETERMINATION Information criteria: AK=Akaike and SC=Schwarz. The Likelihood Ratio (LR) is computed taking into account the small sample correction suggested by Sims (1980). GODF=Godfrey portmanteau test for autocorrelation of order 1.
LR: L[h] vs L[h-1]
df p-va AK SC GODF p-va
LR: L[h] vs L[h-1]
df p-va AK SC GODF p-va
Lag(h)
I:1985:01-1993:08 II: 1993:09-2002:12 1 n.a. 12 n.a. -9.56 -8.29 0.000 n.a. 12 n.a. -13.76 -13.15 0.239 2 72.323 12 0.000 -10.15 -9.20 0.249 30.987 12 0.002 -13.86 -12.96 0.506 3 41.333 12 0.051 -10.61 -9.14 0.122 29.007 12 0.004 -13.96 -12.75 0.000 4 25.982 12 0.101 -10.50 -8.92 0.071 39.957 12 0.000 -14.20 -12.68 0.351 5 9.658 12 0.646 -10.39 -8.48 0.001 9.462 12 0.663 -14.08 -12.28 0.100 6 19.349 12 0.080 -10.41 -8.20 0.003 10.590 12 0.564 -13.99 -11.88 0.309
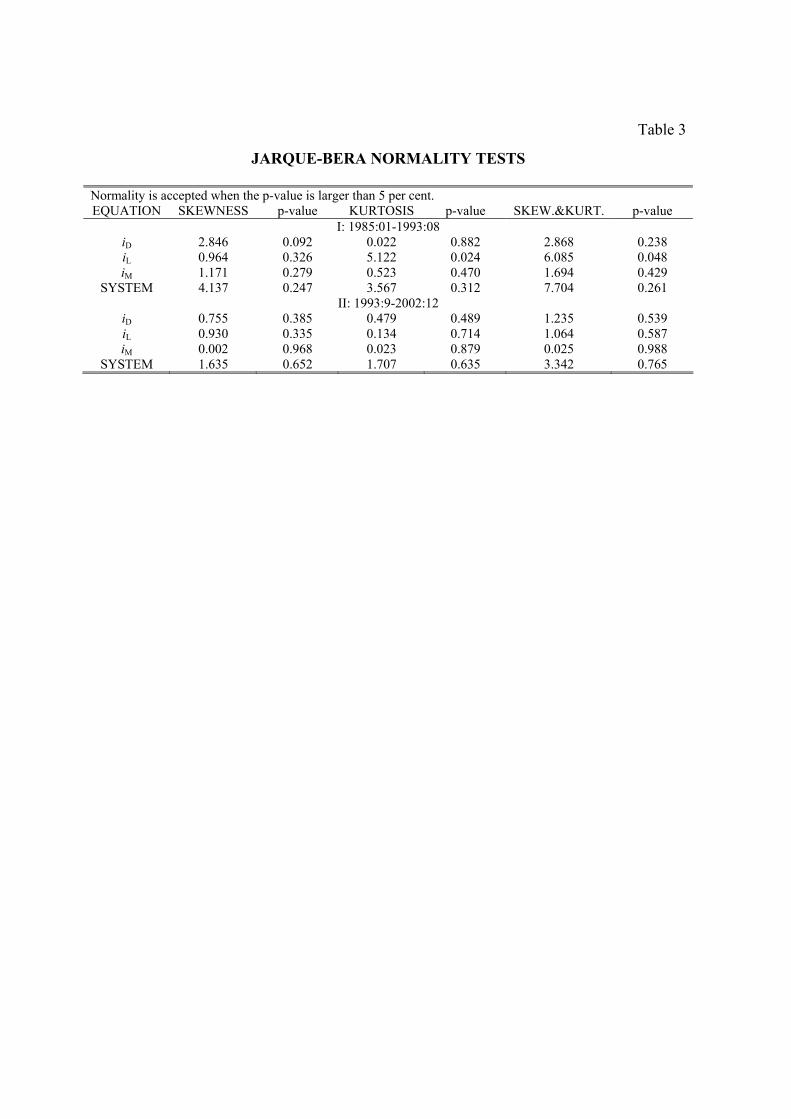
Table 3
JARQUE-BERA NORMALITY TESTS
Normality is accepted when the p-value is larger than 5 per cent. EQUATION SKEWNESS p-value KURTOSIS p-value SKEW.&KURT. p-value
I: 1985:01-1993:08 iD 2.846 0.092 0.022 0.882 2.868 0.238 iL 0.964 0.326 5.122 0.024 6.085 0.048 iM 1.171 0.279 0.523 0.470 1.694 0.429
SYSTEM 4.137 0.247 3.567 0.312 7.704 0.261 II: 1993:9-2002:12
iD 0.755 0.385 0.479 0.489 1.235 0.539 iL 0.930 0.335 0.134 0.714 1.064 0.587 iM 0.002 0.968 0.023 0.879 0.025 0.988
SYSTEM 1.635 0.652 1.707 0.635 3.342 0.765

Table 4
COINTEGRATION ANALYSIS Test for the cointegration rank of the models in the two sub-samples. ** denotes rejection at the 1 per cent significance level; * denotes rejection at the 5 per cent significance level. The model for the second sub-sample also includes the convergence dummy in the cointegrating space. Johansen λ-trace tests take into account the adjustment for degrees of freedom proposed by Reimers (1993) for small samples. Asymptotic critical values are provided in Osterwald-Lenum (1992), although due to the presence of dummy variables they are only indicative. H0: r=0 H0: r≤1 H0: r≤2
I: 1985:1-1993:08 57.35** 24.25* 11.11* II: 1993:9-2002:12 68.61** 37.88** 11.57*
Cointegrating vectors (standard errors in brackets)
I: 1985:1-1993:08
)744.1()136.0(745.0 568.0 −= BD ii
)126.1()088.0(634.3 856.0 += BL ii
)189.1()096.0(473.1 892.0 += MB ii
II: 1993:9-2002:12
dumcoii BD)095.0()098.0()018.0(
314.0153.1 691.0 −−=
dumcoii BL)144.0()148.0()027.0(
387.0028.2 039.1 −+=
dumcoii MB)390.0()386.0()073.0(
984.0088.0 010.1 −+=
Loading coefficients (standard errors in brackets)
I: 1985:1-1993:08
−−
−−
−−
=
)063.0()119.0()097.0(
)023.0()027.0()022.0(
)016.0()030.0()016.0(
237.0008.0046.0
031.0096.0027.0
004.0000.0047.0
α
II: 1993:9-2002:12
−
−−
−−
=
)012.0()788.0()133.0(
)059.0()050.0()066.0(
)016.0()065.0()086.0(
146.0146.0034.0
003.0193.0168.0
016.0164.0339.0
α
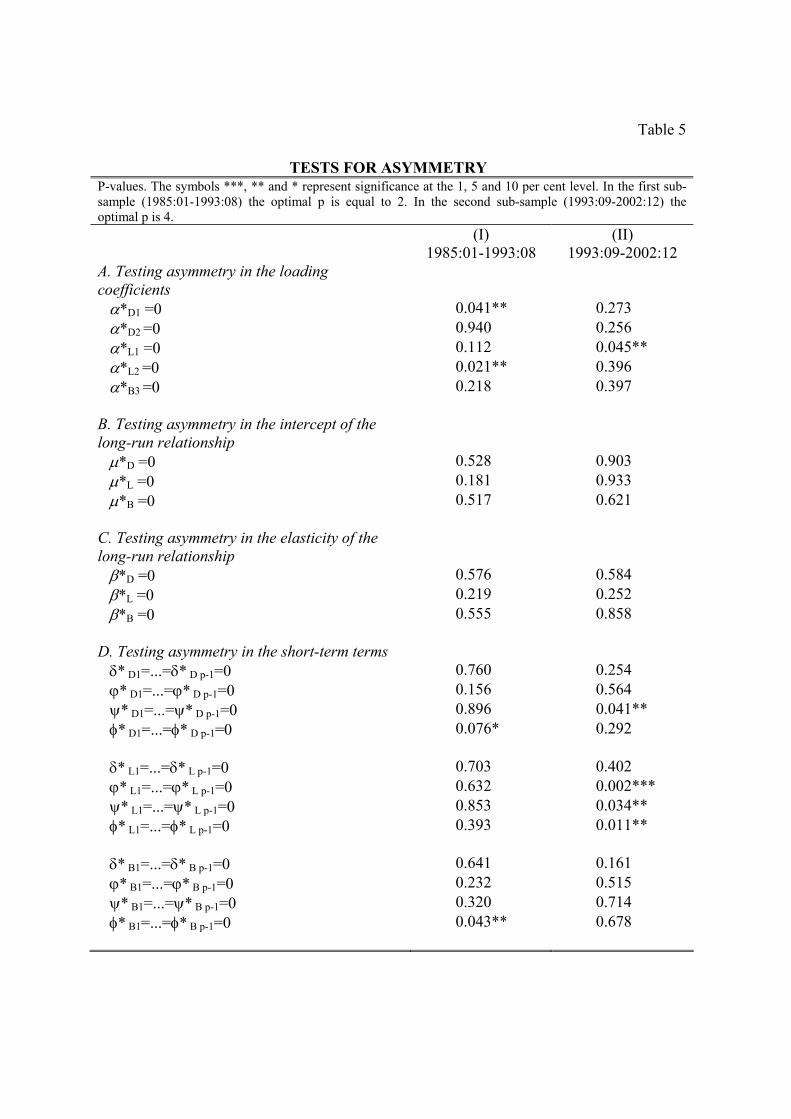
Table 5
TESTS FOR ASYMMETRY P-values. The symbols ***, ** and * represent significance at the 1, 5 and 10 per cent level. In the first sub-sample (1985:01-1993:08) the optimal p is equal to 2. In the second sub-sample (1993:09-2002:12) the optimal p is 4. (I)
1985:01-1993:08 (II)
1993:09-2002:12 A. Testing asymmetry in the loading coefficients
α*D1 =0 0.041** 0.273 α*D2 =0 0.940 0.256 α*L1 =0 0.112 0.045** α*L2 =0 0.021** 0.396 α*B3 =0 0.218 0.397
B. Testing asymmetry in the intercept of the long-run relationship
µ*D =0 0.528 0.903 µ*L =0 0.181 0.933 µ*B =0 0.517 0.621
C. Testing asymmetry in the elasticity of the long-run relationship
β*D =0 0.576 0.584 β*L =0 0.219 0.252 β*B =0 0.555 0.858
D. Testing asymmetry in the short-term terms δ* D1=...=δ* D p-1=0 0.760 0.254 ϕ* D1=...=ϕ* D p-1=0 0.156 0.564 ψ* D1=...=ψ* D p-1=0 0.896 0.041** φ* D1=...=φ* D p-1=0 0.076* 0.292 δ* L1=...=δ* L p-1=0 0.703 0.402 ϕ* L1=...=ϕ* L p-1=0 0.632 0.002*** ψ* L1=...=ψ* L p-1=0 0.853 0.034** φ* L1=...=φ* L p-1=0 0.393 0.011** δ* B1=...=δ* B p-1=0 0.641 0.161 ϕ* B1=...=ϕ* B p-1=0 0.232 0.515 ψ* B1=...=ψ* B p-1=0 0.320 0.714 φ* B1=...=φ* B p-1=0 0.043** 0.678

Table 6
COEFFICIENTS OF THE TRIVARIATE MODEL IN REDUCED FORM Standard errors in brackets. The symbols ***, ** and * represent significance at the 1, 5 and 10 per cent level. Coefficients and standard errors for the dummies are not reported. (I) 1985:01-1993:08 (II) 1993:09-2002:12 Equations for: rD rL rB rD rL rB
α 1 -0.044** (0.018)
-0.253** (0.093)
0.015 (0.085)
α 2 -0.115*** (0.029)
0.037 (0.060)
-0.184*** (0.048)
α 3 -0.187*** (0.035)
α*1 -0.037**
(0.018) 0.143**
(0.034)
α*2 0.047**
(0.022)
µ D -1.470 (1.850)
-1.470 (1.850)
-1.470 (1.850)
-0.980*** (0.101)
-0.980*** (0.101)
-0.980*** (0.101)
µ L 1.838*** (0.145)
1.838*** (0.145)
1.838*** (0.145)
2.206*** (0.060)
2.206*** (0.060)
2.206*** (0.060)
β D 0.699*** (0.148)
0.699*** (0.148)
0.699*** (0.148)
0.700*** (0.016)
0.700*** (0.016)
0.700*** (0.016)
β L 1.000 ( - )
1.000 ( - )
1.000 ( - )
1.000 ( - )
1.000 ( - )
1.000 ( - )
δ 1 0.174* (0.090)
0.075 (0.129)
0.165** (0.073)
δ 2 -0.163** (0.079)
-0.189*** (0.069)
φ 0 0.020 (0.015)
0.063** (0.018)
0.436*** (0.055)
0.037 (0.034)
0.214*** (0.063)
0.707*** (0.709)
φ 1 0.040** (0.017)
0.151*** (0.045)
-0.001 (0.042)
φ 3 0.080 (0.059)
φ*0 0.056*
(0.032) -0.137** (0.068)
φ*1 -0.132**
(0.055) 0.066* (0.037)
φ*3 -0.124**
(0.062)
ϕ 1 -0.029 (0.055)
0.429*** (0.048)
0.0354*
-0.159 (0.126)
ϕ 2 0.011* (0.006)
ϕ 3 -0.032* (0.019)
ϕ*1 0.452***
(0.146)
ψ 1 0.097*** (0.019)
0.096*** (0.027)
0.139*** (0.025)
ψ 3 0.063* (0.037)
ψ* 3 0.012** (0.006)
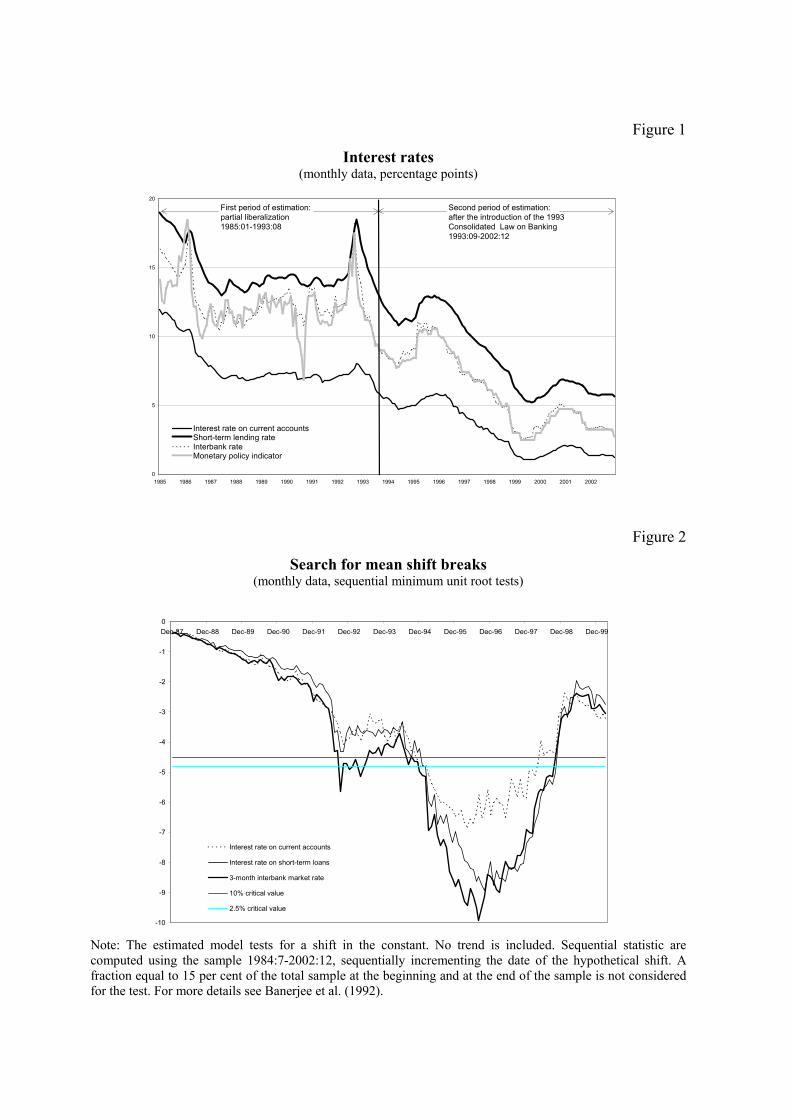
Figure 1
Interest rates (monthly data, percentage points)
Figure 2
Search for mean shift breaks (monthly data, sequential minimum unit root tests)
Note: The estimated model tests for a shift in the constant. No trend is included. Sequential statistic are computed using the sample 1984:7-2002:12, sequentially incrementing the date of the hypothetical shift. A fraction equal to 15 per cent of the total sample at the beginning and at the end of the sample is not considered for the test. For more details see Banerjee et al. (1992).
-10
-9
-8
-7
-6
-5
-4
-3
-2
-1
0Dec-87 Dec-88 Dec-89 Dec-90 Dec-91 Dec-92 Dec-93 Dec-94 Dec-95 Dec-96 Dec-97 Dec-98 Dec-99
Interest rate on current accounts
Interest rate on short-term loans
3-month interbank market rate
10% critical value
2.5% critical value
0
5
10
15
20
1985 1986 1987 1988 1989 1990 1991 1992 1993 1994 1995 1996 1997 1998 1999 2000 2001 2002
Interest rate on current accountsShort-term lending rateInterbank rateMonetary policy indicator
First period of estimation: partial liberalization 1985:01-1993:08
Second period of estimation: after the introduction of the 1993 Consolidated Law on Banking 1993:09-2002:12
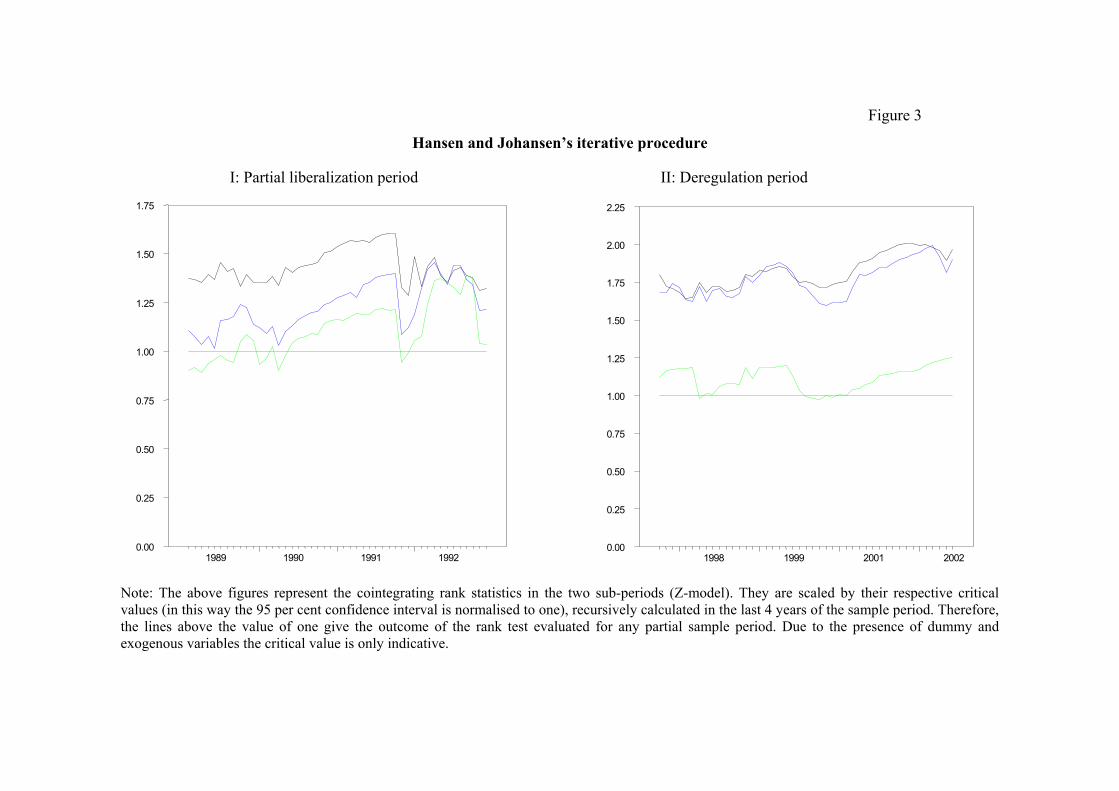
Figure 3
Hansen and Johansen’s iterative procedure
1989 1990 1991 19920.00
0.25
0.50
0.75
1.00
1.25
1.50
1.75
1998 1999 2001 2002
0.00
0.25
0.50
0.75
1.00
1.25
1.50
1.75
2.00
2.25
Note: The above figures represent the cointegrating rank statistics in the two sub-periods (Z-model). They are scaled by their respective critical values (in this way the 95 per cent confidence interval is normalised to one), recursively calculated in the last 4 years of the sample period. Therefore, the lines above the value of one give the outcome of the rank test evaluated for any partial sample period. Due to the presence of dummy and exogenous variables the critical value is only indicative.
I: Partial liberalization period II: Deregulation period
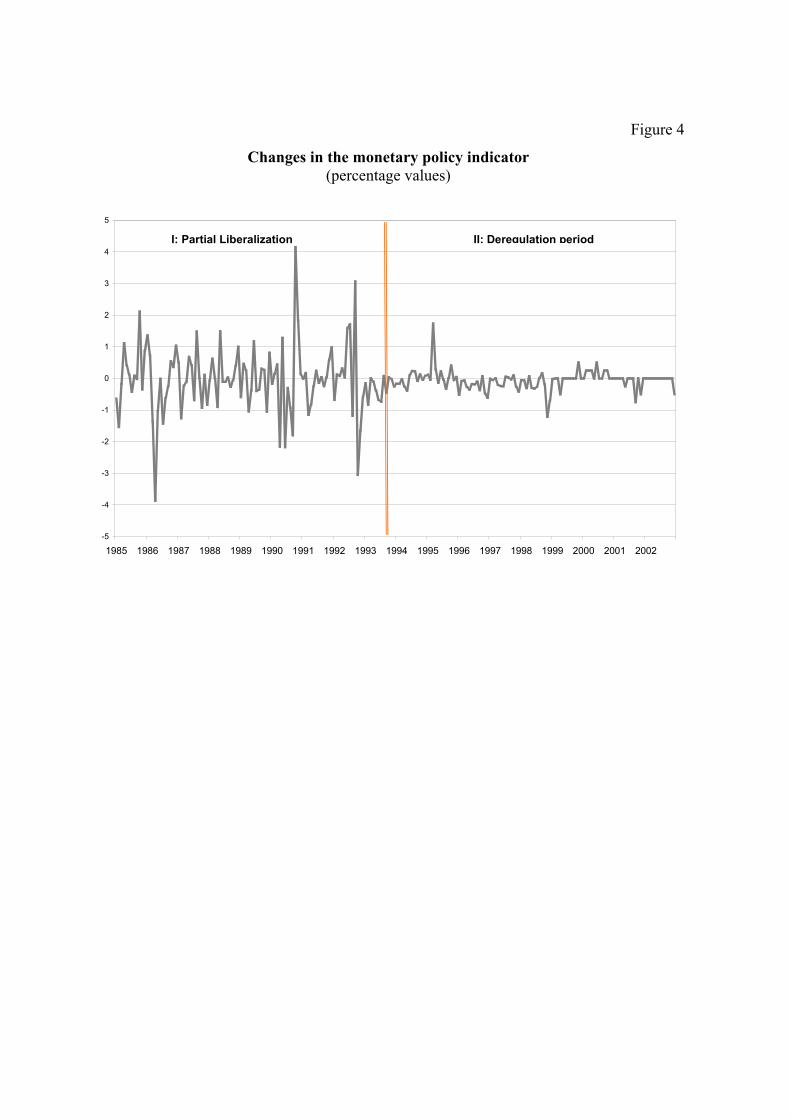
Figure 4
Changes in the monetary policy indicator (percentage values)
-5
-4
-3
-2
-1
0
1
2
3
4
5
1985 1986 1987 1988 1989 1990 1991 1992 1993 1994 1995 1996 1997 1998 1999 2000 2001 2002
I: Partial Liberalization II: Deregulation period

Figure 5
Adjustment paths of bank interest rates to positive and negative changes in the monetary policy indicator
(percentage values)
I: Partial liberalization period (1985:01-1993:08)
II: Deregulation period (1993:09-2002:12)
0.0
0.2
0.4
0.6
0.8
1.0
1.2
0 12 24 36 48 60 72 84 96
Tight MP Easy MP
interest rate on current accounts
interest rate onshort term lending
interbank rate
0.0
0.2
0.4
0.6
0.8
1.0
1.2
0 12 24 36 48 60 72 84 96
Tight MP Easy MP
interest rate oncurrent accounts
interest rate onshort term lending
interbank rate
Note: The experiment consists in evaluating the effect after 96 months of a 1 per cent change in the monetary policy indicator. To make simulations more comparable, the effects for easing monetary policy are multiplied by -1.

References
Amisano G., Cesura M., Giannini C. and Seghelini M. (1997), “The Transmission Mechanism among Italian Interest Rates”, Statistica, Vol., 57, No, 4, pp. 465-497.
Angelini P. and Cetorelli N. (2002), "The Effects of Regulatory Reform on Competition in the Banking Industry", Journal of Money, Credit and Banking, Vol. 35, pp. 663-684.
Angeloni I., Buttiglione L., Ferri G. and Gaiotti E. (1995), “The Credit Channel of Monetary Policy across Heterogeneous Banks: The Case of Italy”, Banca d’Italia, Temi di discussione, No. 256.
Ausubel L. M. (1992), Rigidity and Asymmetric Adjustment of Bank Interest Rates, mimeo.
Banerjee A., Lumsdaine R.L. and Stock J.H. (1992), “Recursive and Sequential Tests of the Unit-Root and Trend Break Hypotheses: Theory and International Evidence”, Journal of Business and Economic Statistics, Vol. 10, No. 3, pp.271-87.
Berlin M. and Mester L.J. (1999), “Deposits and Relationship Lending”, Review of Financial Studies, Vol. 12, No. 3, pp. 579-607.
Borio C.E.V. and Fritz W. (1995), “The Response of Short-term Bank Lending Rates to Policy Rates: A Cross Country Perspective”, in Bank for International Settlements (ed.), Financial Structure and the Monetary Policy Transmission Mechanism, pp. 106-53.
Buttiglione L. and Ferri G. (1994), “Monetary Policy Transmission via Lending Rates in Italy: Any Lessons from Recent Experience?”, Banca d’Italia, Temi di discussione, No. 224.
Ciocca P. (2000), La nuova finanza in Italia. Una difficile metamorfosi (1980-2000), Bollati Boringhieri, Torino.
Cottarelli C. and Kourelis A. (1994), “Financial Structure, Bank Lending Rates and the Transmission Mechanism of Monetary Policy”, IMF Staff Papers, Vol. 41, No. 4, pp.587-623.
Cottarelli C., Ferri G. and Generale A. (1995), “Bank Lending Rates and Financial Structure in Italy: A Case Study”, IMF Working Papers, No. 38.
de Bondt G., Mojon B. and Valla N. (2003), “Term Structure and the Sluggishness of Retail Bank Rates in the Euro Area”, ECB, mimeo.
Dolado J. and Jenkinson T. (1987), “Cointegration: A Survey of Recent Developments”, Applied Economics Discussion Paper, No. 39, Oxford Institute of Economics and Statistics.
Freixas X. and Rochet J. (1997), Microeconomics of Banking, Cambridge, MIT Press.
Gambacorta L. (2005), “How Do Banks Set Interest Rates?”, Banca d’Italia, Temi di discussione, No. 542. Also published as NBER Working Paper, n.10295.
Green C.J. (1998), “Banks as Interest Rate Managers”, Journal of Financial Services Research, Vol. 14, No. 3, pp. 189-208.
Hamilton J.D. (1994), Time Series Analysis, Princeton, Princeton University Press.
Hannan T.H. and Berger A.N. (1991), “The Rigidity of Prices: Evidence From Banking Industry”, American Economic Review, Vol. 81, pp.938-45.
Hansen H. and Johansen S. (1993), “Recursive Estimation in Cointegrated VAR Models”, University of Copenhagen, Institute of Mathematical Statistics.
Harris R. (1995), Cointegration analysis in econometric modelling, Prentice Hall, Harvester Wheatsheaf, London.

33
Hutchison D.E. (1995), “Retail Bank Deposit Pricing: An Intertemporal Asset Pricing Approach”, Journal of Money Credit and Banking, Vol. 27, pp. 217-31.
Johansen S. (1988), “Statistical Analysis of Cointegration Vectors”, Journal of Economic Dynamics and Control, Vol. 12, No. 2, pp.231-254.
Johansen S. (1995), Likelihood-based Inference in Cointegrated Vector Autoregressive Models, Oxord University Press.
Kashyap A.K. and Stein J.C. (1997), “The Role of Banks in Monetary Policy: A Survey with Implications for the European Monetary Union”, Economic Perspectives, Vol. 21, No. 5, pp. 2-18.
Lim G.C. (2001), “Bank Interest Rate Adjustments: Are They Asymmetric?”, The Economic Record, Vol. 77, No. 237, pp.135-147.
Mishkin F.S. (1995), “Symposium on the Monetary Transmission Mechanism”, Journal of Economic Perspectives, Vol. 9, No. 4, pp. 3-10.
Moore G. R., Porter R.D. and Small D.H. (1990), “Modelling the Disaggregated Demands for M2 and M1: the U.S. Experience in the 1980s”, Proceedings of a Federal Reserve Board Conference on Monetary Aggregates and Financial System Behavior.
Neumark D. and Sharpe S. A. (1992), “Market Structure and the Nature of Price Rigidity: Evidence From the Market for Consumer Deposits”, Quarterly Journal of Economics, Vol. 107, pp.657-80.
Oliner S.D. and Rodebusch G.D. (1996), “Is There a Broad Credit Channel for Monetary Policy?”, Economic Review, Federal Reserve Bank S. Francisco, No. 1, pp. 3-13.
Osterwald-Lenum M. (1992), “A Note with Quantiles of the Asymptotic Distribution of the Maximum Likelihood Cointegration Rank Test Statistics”, Oxford Bulletin of Economics and Statistics, Vol. 54, No. 3, pp. 461-472.
Pagan A.R. (1990), “Three Econometric Methodologies: a Critical Appraisal”, in Granger C.W.J. (ed.), Modelling Economic Series: Readings in Econometric, Oxford, Oxford University Press, pp. 97-120.
Passacantando F. (1996), “Building an Institutional Framework for Monetary Stability”, BNL Quarterly Review, Vol. 49, No. 196, pp. 83-132.
Reimers H.E. (1993), “Lag Order Determination in Cointegrated VAR Systems with Application to Small German Macro-Models”, Paper presented at ESEM '93, Uppsala, August 1993.
Rosen R. J. (2001), “What Goes Up Must Come Down? Asymmetries and persistence In Bank Deposit Rates”, Journal of Financial Service Research, forthcoming.
Said S.E. and Dickey D.A. (1984), “Testing for Unit Roots in Autoregressive - Moving Average Models of Unknown Order”, Biometrika, Vol. 71, No. 3, pp 599-608.
Sims C. A. (1980), “Macroeconomics and Reality”, Econometrica, Vol. 48, No. 1, pp. 1-48.
Teräsvirta T., Tjøstheim D. and Granger C.W.J. (1994), “Aspects of Modelling Non Linear Time Series”, in Engle R.F. and McFadden D.L. (eds.), Handbook of Econometrics, Vol. 4, Amsterdam, Elsevier Science.
Weth M.A. (2002), “The Pass-Through from Market Interest Rates to Bank Lending Rates in Germany”, Discussion Paper No. 11, Economic Research Center of the Deutsche Bundesbank.
(*) Requests for copies should be sent to: Banca d’Italia – Servizio Studi – Divisione Biblioteca e pubblicazioni – Via Nazionale, 91 – 00184 Rome(fax 0039 06 47922059). They are available on the Internet www.bancaditalia.it.
RECENTLY PUBLISHED “TEMI” (*).
N. 541 – L’introduzione dell’euro e le politiche di prezzo: analisi di un campione di dati individuali, by E. GAIOTTI and F. LIPPI (February 2005).
N. 542 – How do banks set interest rates?, by L. GAMBACORTA (February 2005).
N. 543 – Maxmin portfolio choice, by M. TABOGA (February 2005).
N. 544 – Forecasting output growth and inflation in the euro area: are financial spreads useful?, by A. NOBILI (February 2005).
N. 545 – Can option smiles forecast changes in interest rates? An application to the US, the UK and the Euro Area, by M. PERICOLI (February 2005).
N. 546 – The role of risk aversion in predicting individual behavior, by L. GUISO and M. PAIELLA (February 2005).
N. 547 – Prices, product differentiation and quality measurement: a comparison between hedonic and matched model methods, by G. M. TOMAT (February 2005).
N. 548 – The Basel Committee approach to risk weights and external ratings: what do we learn from bond spreads?, by A. RESTI and A. SIRONI (February 2005).
N. 549 – Firm size distribution: do financial constraints explain it all? Evidence from survey data, by P. ANGELINI and A. GENERALE (June 2005).
N. 550 – Proprietà, controllo e trasferimenti nelle imprese italiane. Cosa è cambiato nel decennio 1993-2003?, by S. GIACOMELLI and S. TRENTO (June 2005).
N. 551 – Quota dei Profitti e redditività del capitale in Italia: un tentativo di interpretazione, by R. TORRINI (June 2005).
N. 552 – Hiring incentives and labour force participation in Italy, by P. CIPOLLONE, C. DI MARIA and A. GUELFI (June 2005).
N. 553 – Trade credit as collateral, by M. OMICCIOLI (June 2005).
N. 554 – Where do human capital externalities end up?, by A. DALMAZZO and G. DE BLASIO (June 2005).
N. 555 – Do capital gains affect consumption? Estimates of wealth effects from italian households’ behavior, by L. GUISO, M. PAIELLA and I. VISCO (June 2005).
N. 556 – Consumer price setting in Italy, by S. FABIANI, A. GATTULLI, R. SABBATINI and G. VERONESE (June 2005).
N. 557 – Distance, bank heterogeneity and entry in local banking markets, by R. FELICI and M. PAGNINI (June 2005).
N. 558 – International specialization models in Latin America: the case of Argentina, by P. CASELLI and A. ZAGHINI (June 2005).
N. 559 – Caratteristiche e mutamenti della specializzazione delle esportazioni italiane, by P. MONTI (June 2005).
N. 560 – Regulation, formal and informal enforcement and the development of the household loan market. Lessons from Italy, by L. CASOLARO, L. GAMBACORTA and L. GUISO (September 2005).
N. 561 – Testing the “Home market effect” in a multi-country world: a theory-based approach, by K. BEHRENS, A. R. LAMORGESE, G. I. P. OTTAVIANO and T. TABUCHI (September 2005).
N. 562 – Banks’ participation in the eurosystem auctions and money market integration, by G. BRUNO, M. ORDINE and A. SCALIA (September 2005).
N. 563 – Le strategie di prezzo delle imprese esportatrici italiane, by M. BUGAMELLI and R. TEDESCHI (November 2005).
N. 564 – Technology transfer and economic growth in developing countries: an econometric analysis, by V. CRISPOLTI and D. MARCONI (November 2005).
N. 565 – La ricchezza finanziaria nei conti finanziari e nell’indagine sui bilanci delle fami-glie italiane, by R. BONCI, G. MARCHESE and A. NERI (November 2005).

"TEMI" LATER PUBLISHED ELSEWHERE
1999
L. GUISO and G. PARIGI, Investment and demand uncertainty, Quarterly Journal of Economics, Vol. 114 (1), pp. 185-228, TD No. 289 (November 1996).
A. F. POZZOLO, Gli effetti della liberalizzazione valutaria sulle transazioni finanziarie dell’Italia con l’estero, Rivista di Politica Economica, Vol. 89 (3), pp. 45-76, TD No. 296 (February 1997).
A. CUKIERMAN and F. LIPPI, Central bank independence, centralization of wage bargaining, inflation and unemployment: theory and evidence, European Economic Review, Vol. 43 (7), pp. 1395-1434, TD No. 332 (April 1998).
P. CASELLI and R. RINALDI, La politica fiscale nei paesi dell’Unione europea negli anni novanta, Studi e note di economia, (1), pp. 71-109, TD No. 334 (July 1998).
A. BRANDOLINI, The distribution of personal income in post-war Italy: Source description, data quality, and the time pattern of income inequality, Giornale degli economisti e Annali di economia, Vol. 58 (2), pp. 183-239, TD No. 350 (April 1999).
L. GUISO, A. K. KASHYAP, F. PANETTA and D. TERLIZZESE, Will a common European monetary policy have asymmetric effects?, Economic Perspectives, Federal Reserve Bank of Chicago, Vol. 23 (4), pp. 56-75, TD No. 384 (October 2000).
2000
P. ANGELINI, Are banks risk-averse? Timing of the operations in the interbank market, Journal of Money, Credit and Banking, Vol. 32 (1), pp. 54-73, TD No. 266 (April 1996).
F. DRUDI and R. GIORDANO, Default Risk and optimal debt management, Journal of Banking and Finance, Vol. 24 (6), pp. 861-892, TD No. 278 (September 1996).
F. DRUDI and R. GIORDANO, Wage indexation, employment and inflation, Scandinavian Journal of Economics, Vol. 102 (4), pp. 645-668, TD No. 292 (December 1996).
F. DRUDI and A. PRATI, Signaling fiscal regime sustainability, European Economic Review, Vol. 44 (10), pp. 1897-1930, TD No. 335 (September 1998).
F. FORNARI and R. VIOLI, The probability density function of interest rates implied in the price of options, in: R. Violi, (ed.) , Mercati dei derivati, controllo monetario e stabilità finanziaria, Il Mulino, Bologna, TD No. 339 (October 1998).
D. J. MARCHETTI and G. PARIGI, Energy consumption, survey data and the prediction of industrial production in Italy, Journal of Forecasting, Vol. 19 (5), pp. 419-440, TD No. 342 (December 1998).
A. BAFFIGI, M. PAGNINI and F. QUINTILIANI, Localismo bancario e distretti industriali: assetto dei mercati del credito e finanziamento degli investimenti, in: L.F. Signorini (ed.), Lo sviluppo locale: un'indagine della Banca d'Italia sui distretti industriali, Donzelli, TD No. 347 (March 1999).
A. SCALIA and V. VACCA, Does market transparency matter? A case study, in: Market Liquidity: Research Findings and Selected Policy Implications, Basel, Bank for International Settlements, TD No. 359 (October 1999).
F. SCHIVARDI, Rigidità nel mercato del lavoro, disoccupazione e crescita, Giornale degli economisti e Annali di economia, Vol. 59 (1), pp. 117-143, TD No. 364 (December 1999).
G. BODO, R. GOLINELLI and G. PARIGI, Forecasting industrial production in the euro area, Empirical Economics, Vol. 25 (4), pp. 541-561, TD No. 370 (March 2000).
F. ALTISSIMO, D. J. MARCHETTI and G. P. ONETO, The Italian business cycle: Coincident and leading indicators and some stylized facts, Giornale degli economisti e Annali di economia, Vol. 60 (2), pp. 147-220, TD No. 377 (October 2000).
C. MICHELACCI and P. ZAFFARONI, (Fractional) Beta convergence, Journal of Monetary Economics, Vol. 45, pp. 129-153, TD No. 383 (October 2000).
R. DE BONIS and A. FERRANDO, The Italian banking structure in the nineties: testing the multimarket contact hypothesis, Economic Notes, Vol. 29 (2), pp. 215-241, TD No. 387 (October 2000).

2001
M. CARUSO, Stock prices and money velocity: A multi-country analysis, Empirical Economics, Vol. 26 (4), pp. 651-72, TD No. 264 (February 1996).
P. CIPOLLONE and D. J. MARCHETTI, Bottlenecks and limits to growth: A multisectoral analysis of Italian industry, Journal of Policy Modeling, Vol. 23 (6), pp. 601-620, TD No. 314 (August 1997).
P. CASELLI, Fiscal consolidations under fixed exchange rates, European Economic Review, Vol. 45 (3), pp. 425-450, TD No. 336 (October 1998).
F. ALTISSIMO and G. L. VIOLANTE, Nonlinear VAR: Some theory and an application to US GNP and unemployment, Journal of Applied Econometrics, Vol. 16 (4), pp. 461-486, TD No. 338 (October 1998).
F. NUCCI and A. F. POZZOLO, Investment and the exchange rate, European Economic Review, Vol. 45 (2), pp. 259-283, TD No. 344 (December 1998).
L. GAMBACORTA, On the institutional design of the European monetary union: Conservatism, stability pact and economic shocks, Economic Notes, Vol. 30 (1), pp. 109-143, TD No. 356 (June 1999).
P. FINALDI RUSSO and P. ROSSI, Credit costraints in italian industrial districts, Applied Economics, Vol. 33 (11), pp. 1469-1477, TD No. 360 (December 1999).
A. CUKIERMAN and F. LIPPI, Labor markets and monetary union: A strategic analysis, Economic Journal, Vol. 111 (473), pp. 541-565, TD No. 365 (February 2000).
G. PARIGI and S. SIVIERO, An investment-function-based measure of capacity utilisation, potential output and utilised capacity in the Bank of Italy’s quarterly model, Economic Modelling, Vol. 18 (4), pp. 525-550, TD No. 367 (February 2000).
F. BALASSONE and D. MONACELLI, Emu fiscal rules: Is there a gap?, in: M. Bordignon and D. Da Empoli (eds.), Politica fiscale, flessibilità dei mercati e crescita, Milano, Franco Angeli, TD No. 375 (July 2000).
A. B. ATKINSON and A. BRANDOLINI, Promise and pitfalls in the use of “secondary" data-sets: Income inequality in OECD countries, Journal of Economic Literature, Vol. 39 (3), pp. 771-799, TD No. 379 (October 2000).
D. FOCARELLI and A. F. POZZOLO, The determinants of cross-border bank shareholdings: An analysis with bank-level data from OECD countries, Journal of Banking and Finance, Vol. 25 (12), pp. 2305-2337, TD No. 381 (October 2000).
M. SBRACIA and A. ZAGHINI, Expectations and information in second generation currency crises models, Economic Modelling, Vol. 18 (2), pp. 203-222, TD No. 391 (December 2000).
F. FORNARI and A. MELE, Recovering the probability density function of asset prices using GARCH as diffusion approximations, Journal of Empirical Finance, Vol. 8 (1), pp. 83-110, TD No. 396 (February 2001).
P. CIPOLLONE, La convergenza dei salari manifatturieri in Europa, Politica economica, Vol. 17 (1), pp. 97-125, TD No. 398 (February 2001).
E. BONACCORSI DI PATTI and G. GOBBI, The changing structure of local credit markets: Are small businesses special?, Journal of Banking and Finance, Vol. 25 (12), pp. 2209-2237, TD No. 404 (June 2001).
G. MESSINA, Decentramento fiscale e perequazione regionale. Efficienza e redistribuzione nel nuovo sistema di finanziamento delle regioni a statuto ordinario, Studi economici, Vol. 56 (73), pp. 131-148, TD No. 416 (August 2001).
2002
R. CESARI and F. PANETTA, Style, fees and performance of Italian equity funds, Journal of Banking and Finance, Vol. 26 (1), TD No. 325 (January 1998).
L. GAMBACORTA, Asymmetric bank lending channels and ECB monetary policy, Economic Modelling, Vol. 20 (1), pp. 25-46, TD No. 340 (October 1998).
C. GIANNINI, “Enemy of none but a common friend of all”? An international perspective on the lender-of-last-resort function, Essay in International Finance, Vol. 214, Princeton, N. J., Princeton University Press, TD No. 341 (December 1998).

A. ZAGHINI, Fiscal adjustments and economic performing: A comparative study, Applied Economics, Vol. 33 (5), pp. 613-624, TD No. 355 (June 1999).
F. ALTISSIMO, S. SIVIERO and D. TERLIZZESE, How deep are the deep parameters?, Annales d’Economie et de Statistique,.(67/68), pp. 207-226, TD No. 354 (June 1999).
F. FORNARI, C. MONTICELLI, M. PERICOLI and M. TIVEGNA, The impact of news on the exchange rate of the lira and long-term interest rates, Economic Modelling, Vol. 19 (4), pp. 611-639, TD No. 358 (October 1999).
D. FOCARELLI, F. PANETTA and C. SALLEO, Why do banks merge?, Journal of Money, Credit and Banking, Vol. 34 (4), pp. 1047-1066, TD No. 361 (December 1999).
D. J. MARCHETTI, Markup and the business cycle: Evidence from Italian manufacturing branches, Open Economies Review, Vol. 13 (1), pp. 87-103, TD No. 362 (December 1999).
F. BUSETTI, Testing for stochastic trends in series with structural breaks, Journal of Forecasting, Vol. 21 (2), pp. 81-105, TD No. 385 (October 2000).
F. LIPPI, Revisiting the Case for a Populist Central Banker, European Economic Review, Vol. 46 (3), pp. 601-612, TD No. 386 (October 2000).
F. PANETTA, The stability of the relation between the stock market and macroeconomic forces, Economic Notes, Vol. 31 (3), TD No. 393 (February 2001).
G. GRANDE and L. VENTURA, Labor income and risky assets under market incompleteness: Evidence from Italian data, Journal of Banking and Finance, Vol. 26 (2-3), pp. 597-620, TD No. 399 (March 2001).
A. BRANDOLINI, P. CIPOLLONE and P. SESTITO, Earnings dispersion, low pay and household poverty in Italy, 1977-1998, in D. Cohen, T. Piketty and G. Saint-Paul (eds.), The Economics of Rising Inequalities, pp. 225-264, Oxford, Oxford University Press, TD No. 427 (November 2001).
L. CANNARI and G. D’ALESSIO, La distribuzione del reddito e della ricchezza nelle regioni italiane, Rivista Economica del Mezzogiorno (Trimestrale della SVIMEZ), Vol. XVI (4), pp. 809-847, Il Mulino, TD No. 482 (June 2003).
2003
F. SCHIVARDI, Reallocation and learning over the business cycle, European Economic Review, , Vol. 47 (1), pp. 95-111, TD No. 345 (December 1998).
P. CASELLI, P. PAGANO and F. SCHIVARDI, Uncertainty and slowdown of capital accumulation in Europe, Applied Economics, Vol. 35 (1), pp. 79-89, TD No. 372 (March 2000).
P. ANGELINI and N. CETORELLI, The effect of regulatory reform on competition in the banking industry, Federal Reserve Bank of Chicago, Journal of Money, Credit and Banking, Vol. 35, pp. 663-684, TD No. 380 (October 2000).
P. PAGANO and G. FERRAGUTO, Endogenous growth with intertemporally dependent preferences, Contribution to Macroeconomics, Vol. 3 (1), pp. 1-38, TD No. 382 (October 2000).
P. PAGANO and F. SCHIVARDI, Firm size distribution and growth, Scandinavian Journal of Economics, Vol. 105 (2), pp. 255-274, TD No. 394 (February 2001).
M. PERICOLI and M. SBRACIA, A Primer on Financial Contagion, Journal of Economic Surveys, Vol. 17 (4), pp. 571-608, TD No. 407 (June 2001).
M. SBRACIA and A. ZAGHINI, The role of the banking system in the international transmission of shocks, World Economy, Vol. 26 (5), pp. 727-754, TD No. 409 (June 2001).
E. GAIOTTI and A. GENERALE, Does monetary policy have asymmetric effects? A look at the investment decisions of Italian firms, Giornale degli Economisti e Annali di Economia, Vol. 61 (1), pp. 29-59, TD No. 429 (December 2001).
L. GAMBACORTA, The Italian banking system and monetary policy transmission: evidence from bank level data, in: I. Angeloni, A. Kashyap and B. Mojon (eds.), Monetary Policy Transmission in the Euro Area, Cambridge, Cambridge University Press, TD No. 430 (December 2001).
M. EHRMANN, L. GAMBACORTA, J. MARTÍNEZ PAGÉS, P. SEVESTRE and A. WORMS, Financial systems and the role of banks in monetary policy transmission in the euro area, in: I. Angeloni, A. Kashyap and B. Mojon (eds.), Monetary Policy Transmission in the Euro Area, Cambridge, Cambridge University Press, TD No. 432 (December 2001).
F. SPADAFORA, Financial crises, moral hazard and the speciality of the international market: further evidence from the pricing of syndicated bank loans to emerging markets, Emerging Markets Review, Vol. 4 ( 2), pp. 167-198, TD No. 438 (March 2002).
D. FOCARELLI and F. PANETTA, Are mergers beneficial to consumers? Evidence from the market for bank deposits, American Economic Review, Vol. 93 (4), pp. 1152-1172, TD No. 448 (July 2002).
E.VIVIANO, Un'analisi critica delle definizioni di disoccupazione e partecipazione in Italia, Politica Economica, Vol. 19 (1), pp. 161-190, TD No. 450 (July 2002).
M. PAGNINI, Misura e Determinanti dell’Agglomerazione Spaziale nei Comparti Industriali in Italia, Rivista di Politica Economica, Vol. 3 (4), pp. 149-196, TD No. 452 (October 2002).
F. BUSETTI and A. M. ROBERT TAYLOR, Testing against stochastic trend and seasonality in the presence of unattended breaks and unit roots, Journal of Econometrics, Vol. 117 (1), pp. 21-53, TD No. 470 (February 2003).
2004
F. LIPPI, Strategic monetary policy with non-atomistic wage-setters, Review of Economic Studies, Vol. 70 (4), pp. 909-919, TD No. 374 (June 2000).
P. CHIADES and L. GAMBACORTA, The Bernanke and Blinder model in an open economy: The Italian case, German Economic Review, Vol. 5 (1), pp. 1-34, TD No. 388 (December 2000).
M. BUGAMELLI and P. PAGANO, Barriers to Investment in ICT, Applied Economics, Vol. 36 (20), pp. 2275-2286, TD No. 420 (October 2001).
A. BAFFIGI, R. GOLINELLI and G. PARIGI, Bridge models to forecast the euro area GDP, International Journal of Forecasting, Vol. 20 (3), pp. 447-460,TD No. 456 (December 2002).
D. AMEL, C. BARNES, F. PANETTA and C. SALLEO, Consolidation and Efficiency in the Financial Sector: A Review of the International Evidence, Journal of Banking and Finance, Vol. 28 (10), pp. 2493-2519, TD No. 464 (December 2002).
M. PAIELLA, Heterogeneity in financial market participation: appraising its implications for the C-CAPM, Review of Finance, Vol. 8, pp. 1-36, TD No. 473 (June 2003).
E. BARUCCI, C. IMPENNA and R. RENÒ, Monetary integration, markets and regulation, Research in Banking and Finance, (4), pp. 319-360, TD No. 475 (June 2003).
E. BONACCORSI DI PATTI and G. DELL’ARICCIA, Bank competition and firm creation, Journal of Money Credit and Banking, Vol. 36 (2), pp. 225-251, TD No. 481 (June 2003).
R. GOLINELLI and G. PARIGI, Consumer sentiment and economic activity: a cross country comparison, Journal of Business Cycle Measurement and Analysis, Vol. 1 (2), pp. 147-172, TD No. 484 (September 2003).
L. GAMBACORTA and P. E. MISTRULLI, Does bank capital affect lending behavior?, Journal of Financial Intermediation, Vol. 13 (4), pp. 436-457, TD No. 486 (September 2003).
F. SPADAFORA, Il pilastro privato del sistema previdenziale: il caso del Regno Unito, Rivista Economia Pubblica, (5), pp. 75-114, TD No. 503 (June 2004).
G. GOBBI and F. LOTTI, Entry decisions and adverse selection: an empirical analysis of local credit markets, Journal of Financial services Research, Vol. 26 (3), pp. 225-244, TD No. 535 (December 2004).
F. CINGANO and F. SCHIVARDI, Identifying the sources of local productivity growth, Journal of the European Economic Association, Vol. 2 (4), pp. 720-742, TD No. 474 (June 2003).
C. BENTIVOGLI and F. QUINTILIANI, Tecnologia e dinamica dei vantaggi comparati: un confronto fra quattro regioni italiane, in C. Conigliani (a cura di), Tra sviluppo e stagnazione: l’economia dell’Emilia-Romagna, Bologna, Il Mulino, TD No. 522 (October 2004).
E. GAIOTTI and F. LIPPI, Pricing behavior and the introduction of the euro:evidence from a panel of restaurants, Giornale degli Economisti e Annali di Economia, 2004, Vol. 63(3/4):491-526, TD
No. 541 (February 2005).

2005
L. DEDOLA and F. LIPPI, The monetary transmission mechanism: evidence from the industries of 5 OECD countries, European Economic Review, 2005, Vol. 49(6): 1543-69, TD No. 389 (Decembre 2000).
G. DE BLASIO and S. DI ADDARIO, Do workers benefit from industrial agglomeration? Journal of regional Science, Vol. 45 n.4, pp. 797-827, TD No. 453 (October 2002).
M. OMICCIOLI, Il credito commerciale: problemi e teorie, in L. Cannari, S. Chiri e M. Omiccioli (a cura di), Imprese o intermediari? Aspetti finanziari e commerciali del credito tra imprese in Italia, Bologna, Il Mulino, TD No. 494 (June 2004).
L. CANNARI, S. CHIRI and M. OMICCIOLI, Condizioni del credito commerciale e differenzizione della clientela, in L. Cannari, S. Chiri e M. Omiccioli (a cura di), Imprese o intermediari? Aspetti finanziari e commerciali del credito tra imprese in Italia, Bologna, Il Mulino, TD No. 495 (June
2004).
P. FINALDI RUSSO and L. LEVA, Il debito commerciale in Italia: quanto contano le motivazioni finanziarie?, in L. Cannari, S. Chiri e M. Omiccioli (a cura di), Imprese o intermediari? Aspetti finanziari e commerciali del credito tra imprese in Italia, Bologna, Il Mulino, TD No. 496 (June
2004).
A. CARMIGNANI, Funzionamento della giustizia civile e struttura finanziaria delle imprese: il ruolo del credito commerciale, in L. Cannari, S. Chiri e M. Omiccioli (a cura di), Imprese o intermediari? Aspetti finanziari e commerciali del credito tra imprese in Italia, Bologna, Il Mulino, TD No. 497
(June 2004).
G. DE BLASIO, Credito commerciale e politica monetaria: una verifica basata sull’investimento in scorte, in L. Cannari, S. Chiri e M. Omiccioli (a cura di), Imprese o intermediari? Aspetti finanziari e commerciali del credito tra imprese in Italia, Bologna, Il Mulino, TD No. 498 (June 2004).
G. DE BLASIO, Does trade credit substitute bank credit? Evidence from firm-level data. Economic notes, Vol. 34 n.1, pp. 85-112, TD No. 498 (June 2004).
A. DI CESARE, Estimating Expectations of Shocks Using Option Prices, The ICFAI Journal of Derivatives Markets, Vol. II (1), pp. 42-53, TD No. 506 (July 2004).
M. BENVENUTI and M. GALLO, Perché le imprese ricorrono al factoring? Il caso dell'Italia, in L. Cannari, S. Chiri e M. Omiccioli (a cura di), Imprese o intermediari? Aspetti finanziari e commerciali del credito tra imprese in Italia, Bologna, Il Mulino, TD No. 518 (October 2004).
P. DEL GIOVANE and R. SABBATINI, L’euro e l’inflazione. Percezioni, fatti e analisi, Bologna, Il Mulino, TD No. 532 (December 2004).
FORTHCOMING
A. DALMAZZO and G. DE BLASIO, Production and consumption externalities of human capital: an empirical study for Italy. Journal of population economics, TD No. 554 (June 2005).