n. america polyolefins incremental change or transformation? · comperj: integrated petro chemical...
TRANSCRIPT

N. America Polyolefins
Incremental Change or Transformation?
SPE Blow Molding ConferencePittsburghOctober 8, 2012

SPE Blow Molding Conference
2
Braskem – largest PO producer in the Americas
Structural change in energy landscape
Boom in ethylene
Boom in propylene too?

SOURCE: CMAI; Braskem
Braskem is the largest polyolefin producer in the Americas
3,465 1,230
1,415
865 8151,180
Braskem CPChem
3,940
3,055
6,520
2,525
4,075
5,305
2,310
5,185
5,185
1,740
ExxonMobil Dow Formosa
1,065
TotalLBI
1,9302,310
925 440
Ineos
1,620
PPPE
Installed Americas capacitykT
3

Braskem is the leader in PP in N. America...
SOURCE: CMAI; Braskem
N. America PP capacitykT
0
200
400
600
800
1,000
1,200
1,400
1,600
4

Braskem is also making new investments across the Americas in polyolefins capacity
Greenfield integrated petrochemical complex
1 Mt/year of ethylene based on ethane cracker
1 Mt/year of HDPE and LDPE
Investment of ~$3.5 billion
MEXICO – ETHYLENE XXI PROJECT : Start-up in 2015
New Projects
NEW PROJECTS – under study
BRAZIL – PVC Expansion : Start-up in 2012
Expansion of capacity by 210 kT/yr in Alagoas
Investments of up to $500 million
Comperj: integrated petrochemical complex in the State of RJ
SOURCE: Braskem
Greenfield integrated petrochemical complex
1 Mt/year of ethylene based on ethane cracker
1 Mt/year of HDPE, LLDPE and LDPE
PERU – under study
5

Braskem is the leading producer of renewable polymers; commercialized Green PE
Start of works / Foundation Stone: April 2009Plant start-up: September 2010Investment: $250 millionCapacity – 200 kt/year
SOURCE: Braskem 6

SPE Blow Molding Conference
7
Braskem – largest PO producer in the Americas
Structural change in energy landscape
Boom in ethylene
Boom in propylene too?

8SOURCE: EIA; Deutsche Bank; Shale Gas.com; USGS; NPC; McKinsey analysis
Shale gas resources are potential game changer for the N. America energy landscape
ExplorationDevelopingProducing (Tcf reserves)
Niobrara
Cody
Mowry
Gammon
Excello-Mulky
Marcellus (256)
Devonian
Chattanooga
ConasaugaFloyd-Neal
Fayetteville (20)
Haynesville/Bossier (251)
Woodford/Caney
Barnett (118)
Pearsall/Eagle Ford (>100)
Woodford (42)
Barnett and Woodford
BendPierre
Lewis
Hermosa
Mancos
Hilliard-Baxter-Mancos
Antrim
New Albany
Utica
Horn River Shale (40)
Montney (152)
Bakken
Granite Wash
928 9631,093 1,122
109163 159
190202
202 202
616827
Conven-tional
CBM
TightGas
ShaleGas
2011
2,310
2008
2,074
2007
1,30935
2003
1,211
58
35
L48 gas resources
Tcf xx Resources to production ratio (years)
54 57 89 94

9SOURCE: EIA; HPDI; McKinsey analysis
Growth in shale production
3
3
48% p.a.
2011
16
5
31 1
20093
9
5
1 011
2007
3
3
BarnettHaynesvilleMarcellus
FayettevilleWoodfordEaglefordUS gas production
from shaleBcfd
6% 19% 28%
x% Percent of US production
Shale gas in the US continues to expand, growing by 48% per year in the last 4 years, resulting in a collapse in US gas prices
Decline in US natural gas prices
$ / MMBtu
0
2
4
6
8
10
12
14
16
18
2012201120102009200820072006
LNG import to JapanNBP (UK)Henry Hub (US)

10
Estimates of N. America shale gas production have increased with time
SOURCE: HPDI, McKinsey NA gas supply model, Analyst Reports
0
10
20
30
40
50
60
70
80
90
Projected N. America NG supply1,3
bcfd
Canada
US Offshore & Associated
USConventional
US Tight
US CBM
US Shales
20201918171615141312111020090
10
20
30
40
50
60
70
80
90
Projected N. America NG supply1,2
bcfd
Canada
US Offshore & Associated
USConventional
US TightUS CBM
US Shales
2020191817161514131211102009
1 US tight gas based on horizontal wells in Permian, Anadarko, Tex-LA and all wells in Green River, Austin Chalk2 Based on AEO 2010 reference case gas demand 3 Based on AEO 2011 reference case gas demand; Associated gas production from Bakken and Niobrara included in shale gas category
June 2010 estimate June 2011 estimate

11
1 Excludes finding and land costs2 Associated gas plays and predominantly oil basins excluded from this chart
SOURCE: HPDI, Woodmac, Rystad, Industry reports, EIA, McKinsey
1,5001,3001,2001,1001,000900800700
16
5004003002001000 1,400
14
12
10
8
6
4
2
01,7001,600600
Technically Recoverable resources2
Tcf
Full cost Breakeven for gas basins1 2
$/MMbtu
ConventionalCBM
TightShale
Gas production can yield ~10% returns in the $4-6 / MMBtu range, setting a “ceiling” for US gas prices
2011 Prod. = 24 TCF
~30 yrs of resources below $4/MMbtu
40+ yrs of resources below $6/MMbtu

12SOURCE: EIA; Deutsche Bank; ShaleGas.com; USGS; NPC; company announcements; McKinsey
Light Tight Oil (LTO) plays in the US can provide somewhere between 5 to 24 billion barrels of recoverable resources
Niobrara
Cody Mowry Gammon
Marcellus
Barnett
Eagle Ford/Pearsall (>100)
Avalon
Bend
Anadarko
Hermosa
Mancos
Utica
Major US shale gas, liquids, and tight oil resources
Estimated recoverable oil resources
1030307075
700
Barnett
Atoka-Cherokee
Permian (basin)
600Anadarko (basin)
150
Monterey (Antelope)
4,0003,000
4,500
Niobrara
Mancos
250
Bakken (SK)
Eagle FordBakken (ND)
Cardium 650
WaltmanExshaw
Utica
Mississippi LimeViking
Sprayberry
16
121110987654321
MMbbl
Total estimates vary widely, e.g.:▪ NPC estimates 5-10 billion
barrels of recoverable resource▪ EIA estimates up to 24 billion
barrels of recoverable resource
Monterey Shale (Antelope Play) CA
Eagle Ford/Midway/Wilcox formations TX3
14
6
12 Exshaw Shales MT
11 Bakken Shale Canada
2 Bakken Shale ND
8
13
9
Producing
Prospects
Tight oil play status
Cleveland
4
1
Sprayberry
Permian
5
Mississippi Lime
Mowry/Niobrara Shale WY
7
Green River Oil
Cardium
Duvernay Viking
7
131415
17
10
15
16
17
TBDTBDTBDTBD

13
0100200300400500600700800900
1,0001,1001,2001,300
WattenbergMississippi limeMonterey
WoodfordNiobraraBone SpringAustin Chalk
SpraberryGranite WashBakkenEagleford
SOURCE: HPDI; EIA; McKinsey analysis
Light tight oil (LTO) is undergoing a growth trajectory and has now surpassed 1 million barrels per day in the US
Financialcrisis
LTO productionkbod
Proportion of US productionPercent of March 2012 prod.
72
2843
40
17
Crude oil and petroleum products net importskbod
L481
100% = 3.9 MMbod
US
100% = 6.4 MMbod
LTOOther
GoM & Alaska
7,5471,1449,472
Mar-12LTOConventional prod. + de-mand trends
781
Mar-10
1 L48 = Lower 48 states (excludes Alaska)
1 ,200 kbod Mar 2012
2000 201202 04 06 08 10
100 kbodMarch 2006

14SOURCE: HPDI
LTO development in the US is happening at a faster pace than shale gas
1 Bakken, Eagleford, Granite Wash, Spraberry, Austin Chalk, Bone Spring, Niobrara (classified wells not included), Woodford, Monterey2 Barnett, Eagleford, Fayetteville, Haynesville, Marcellus, Woodford
0
500
1,000
1,500
2,000
2,500
3,000
3,500
LTO1 3/2006Gas 1/2002
3/201212/201110/2007
6+ years
LTO Shale gas
24,500
Number of new wellsx
8,200
16,785
Oil in kbod, Gas in kboed
Point in time where gas and oil shale broke 100 kboed
6 years later, oil production rate is 45% higher than gas was

15
Most crude production estimates call for significant increase in US crude production
Several key concerns will drive LTO evolution
▪ Amount of LTO resource available within the plays
▪ Capital expenditures available for drilling and investment
▪ The cost of supply
Estimates for 2020 US LTO production range from 2.0 to 13.8 million barrels oil per day
5.3
2.02.52.41.2
McKinsey
13.8
5.6
Belfer Center
6.6
4.2
Rystad EnergyMcKinsey
4.4
3.7
BentekBernsteinCurrent Goldman
Sachs
3.4
2.9
Bentek
Oil production from LTO playsMillion barrels per day
SOURCE: Rystad; Belfer Center; Bentek; Bernstein Research; McKinsey
2020 Estimate2015 EstimateLow Case
Base CaseHigh Case
May 2012

Significant shale gas resources in other regions could alter petrochemical landscape
16
Mexico19 tm3
USA24 tm3
Argentina22 tm3
Canada11 tm3
China36 tm3
Australia11 tm3
S. Africa14 tm3
Libya8 tm3
Algeria7 tm3
Poland5 tm3
SOURCE: EIA

SPE Blow Molding Conference
17
Braskem – largest PO producer in the Americas
Structural change in energy landscape
Boom in ethylene
Boom in propylene too?

18
Shale gas production has resulted in increase in NGL production, leaving more room for exports
SOURCE: Bentek
0.0
0.5
1.0
1.5
2.0
2.5
3.0
3.5
2005 2007 2009 2011 2013 2015
Pentanes PlusButanePropane
Ethane
0.00.10.20.30.40.50.60.70.8
201520132005 2007 2009 2011
Pentanes PlusButanePropane and Propylene
Ethane and propane production growth has pushed overall NGL production up
The rapid growth has left a surplus allowing more exports
1 This category also includes isobutene and isobutylene.
NGL US productionMillion bbl per day
NGL US exportsMillion bbl per day

19
Estimate of ethane supply has increased by ~ 400kbd, equivalent to seven million tonnes of ethylene
0
200
400
600
800
1,000
1,200
1,400
1,600
1,800
2,000
1412102009 11 13 15 17 19 20201816
L48 Ethane supplykbd
SOURCE: McKinsey North America Gas Model; OGJ; Company reports (ONEOK, Mistral, Pioneer, MarkWest, Eagle Rock, Chesapeake etc); EIA; MMS; US Bureau of Mines; Petral Consulting; Braskem
Current sourcesEaglefordMarcellus
BakkenGranite WashOther
Current level of consumption ~ 950 kbd
0
200
400
600
800
1,000
1,200
1,400
1,600
1,800
2,000
2009 11 1210 13 15 17 19 2020181614
Current sourcesEagle FordMarcellus
Bakken Granite Wash
AvalonNiobraraWoodford
Barnett
Current level of consumption ~ 950 kbd
June 2010 estimateJune 2011 estimate

20
Crackers with higher ethane intake are now at a lower cost; cost curve has, therefore, steepened in N. America
$/tonne ethylene
Crackers with >45% liquids2
25000
1000900800700600
400300200
500
1000
3000020000150001000050000
1100
Q1/2011
1 Includes plants that are not running2 Over 45% of ethylene production is based on gas oil, naphtha, or butane
US/Canada ethylene cash cost curveUses reported/estimated feed mix by crackerUses simplified, standardized assumptions for fixed cash costs
SOURCE: McKinsey ethylene model
470
Average 2007
200
0
400300200100
0350003000025000
900
15000
800700600
10000
500
11001000
5000 20000
Variable costFixed cash cost

21
N. America crackers are now competitive in all markets
SOURCE: McKinsey cost curve model
Global ethylene costs curve – plant gate; Region splits$/tonne
1,100
1,000
900
800
700
600
500
400
300
200
100
0140,000130,000120,000110,000100,000
1,200
80,00070,00060,00040,000 90,00020,00010,0000 50,00030,000
ChinaAsia ex ChinaNorth America
South AmericaWestern EuropeMiddle East
115
2010 – Q2▪ Oil price = $80/Bbl▪ Excess ethane conditions in the US▪ Alberta natural gas price = $2.80/MMBTU▪ ME ethane = $0.75/MMBTU
Effective capacity (93% of nameplate), KTA
Price setting capacity
Global demand
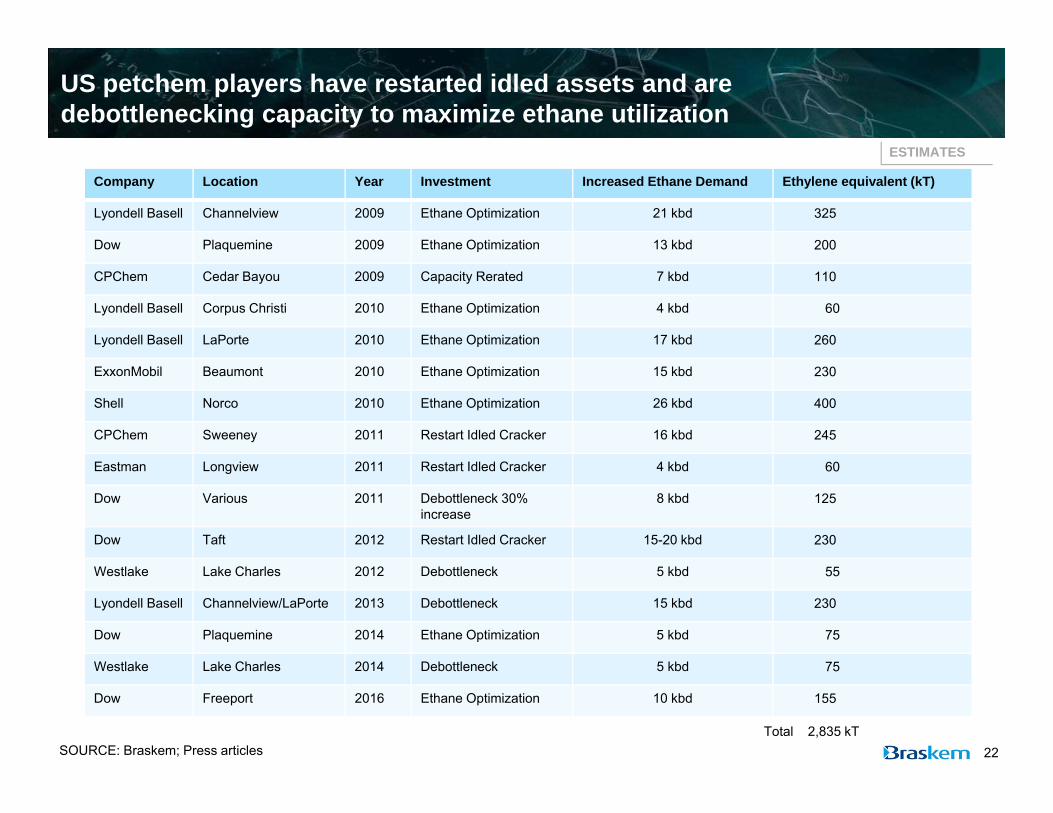
US petchem players have restarted idled assets and are debottlenecking capacity to maximize ethane utilization
22
Company Location Year Investment Increased Ethane Demand Ethylene equivalent (kT)
Lyondell Basell Channelview 2009 Ethane Optimization 21 kbd 325
Dow Plaquemine 2009 Ethane Optimization 13 kbd 200
CPChem Cedar Bayou 2009 Capacity Rerated 7 kbd 110
Lyondell Basell Corpus Christi 2010 Ethane Optimization 4 kbd 60
Lyondell Basell LaPorte 2010 Ethane Optimization 17 kbd 260
ExxonMobil Beaumont 2010 Ethane Optimization 15 kbd 230
Shell Norco 2010 Ethane Optimization 26 kbd 400
CPChem Sweeney 2011 Restart Idled Cracker 16 kbd 245
Eastman Longview 2011 Restart Idled Cracker 4 kbd 60
Dow Various 2011 Debottleneck 30% increase
8 kbd 125
Dow Taft 2012 Restart Idled Cracker 15-20 kbd 230
Westlake Lake Charles 2012 Debottleneck 5 kbd 55
Lyondell Basell Channelview/LaPorte 2013 Debottleneck 15 kbd 230
Dow Plaquemine 2014 Ethane Optimization 5 kbd 75
Westlake Lake Charles 2014 Debottleneck 5 kbd 75
Dow Freeport 2016 Ethane Optimization 10 kbd 155
SOURCE: Braskem; Press articles
ESTIMATES
Total 2,835 kT

Several players are considering new-build crackers in the US
Dow Chemical Co. launched an ambitious plan to increase ethylene and propylene production, as well as integrate U.S. operations into feedstock "opportunities" by using the prolific shale gas resources of the Marcellus and Eagle Ford shales. Dow is finalizing plans to construct a "world-scale" ethylene production plant along the U.S. Gulf Coast, for start-up in 2017
April 25, 2011
SOURCE: Press articles
Shell Oil Co. said today it plans to build an ethylene "cracker“ somewhere in the Appalachian region, to process natural gas from the Marcellus shale region into substances used to make petrochemicals. The Houston-based company said it's evaluating options for ethylene derivatives to make at the plant, and the leading one is Polyethylene
June 6, 2011
Chevron Phillips Chemical on Monday announced it was conducting a feasibility study to build a cracker, saying that it would be a world-scale unit using ethane as a feedstock. The new facility will utilize the advantaged feed sources expected from development of shale gas reserves, the company said
March 28, 2011
ExxonMobil Chemical plans to build a world-scale ethylene plant at its Baytown, Texas, olefins complex and two polyethylene units. Plans call for construction to begin by next March on a 1.5 million mt/year ethylene-capacity steam cracker at the Baytown complex. Start-up could come as early as 2016
June 2, 2012
23

24
600
750
900
1,050
1,200
1,350
1,500
1,650
2020201920182017201620152014201320121 Based on EIA data plus 90KBD additional supply from refineries (above average 20-40KBD reported by EIA). Includes inventory removals2 Based on Goldman/ICIS estimates of expansions/flexibility changes in existing crackers plus new crackers by Dow, CP Chem, Exxon, Shell, Sasol, but
with 1-2 year delays in start of new crackers from initial start-up date announcements
Projected cracking capacity additions will not cover ethane supply in the short term
SOURCE: EIA; Hodson; Petral; Goldman Sachs, ICIS, McKinsey analysis
Thousand bbl per dayExcess ethane supply1
Cracker capacity to consume (CTC)2
Ethane supply versus cracker capacity
… but risk that excess is used by 2020 unless ethane supply growth continues or additional delays in new crackers
Huge early excess of ethane; ethane price
likely to fall to fuel value …

0
1,000
800
600
400
200
1,200
403020100403020100
800
600
400
200
1,200
1,000
0403020100
SOURCE: McKinsey1 Based on April 2009 prices for feeds and coproducts (except CC4 prices determined by model); outlook demand based on significant recession
ImportsUtilizationXXDomestic demand
Ethylene cost curve (plant gate, 2011, Scenario No. 2) with ethylene derivative trade flow1
USD per metric ton ethylene; million metric tons ethylene equivalents; nameplate ethylene capacities
North America Europe/FSU China
South America Middle East/Africa Non-China Asia
66% of ME production will be exported
Preference for EU vs. NCA can swing back and forth as relative costs change
93% 75% 93%
63%93%93%
26.629.4 28.5
22.2
8.0
5.8
0.9
11.9
2.0
5.9
Americas could become an island continent; ME will continue to export primarily to Asia and Europe
25

SPE Blow Molding Conference
26
Braskem – largest PO producer in the Americas
Structural change in energy landscape
Boom in ethylene
Boom in propylene too?

27
Propylene supply-demand situation in N. America is tightening, leading to higher prices
SOURCE: Braskem analysis
3,458
1,328
28
18,470
13,684
Add’l builds
Net
750
Alky/poly
4,336
Chem demand
16,356
SupplyOn-purpose
CrackersRefining
1,500
Base case NA Propylene supply and demand 2015, KTA
Refining:▪ US FCC throughput
decrease (16%)▪ Includes Coker capacity
additions (488 KBPD)▪ Assumes some refinery
shutdowns (highest volume in Northeast)1
▪ Constant FCC propylene yield (7.88% US & Mexico, 10% Canada)
Key drivers
Chemicals:▪ No debottleneck or
expansions▪ Naphtha % of feedstock
constant thru 2015Additional builds included:▪ Dow PDH (750 KTA)▪ Enterprise PDH (750
KTA)▪ Others (750 KTA)
Deficit could be removed or turn to surplus, depending on how many new builds materialize

28
N. America refined gasoline demand projected to decline
SOURCE: McKinsey Global Institute
Demand1
kbd
8,000
6,000
4,000
2,000
16,000
14,000
12,000
10,000
0
Gasoline
Diesel
Biofuels
Efficiency gains
2020191817161514131211102009
x.x CAGR (2009-20), %
1 Area chart uses MGI Scenario 2 “Battered but resilient”
-1.8% p.a.
1.9% p.a.
8.0% p.a. ▪ Net refined gasoline demand to fall by 18%, or 1,595 MBD, in North America by 2020
▪ Continued legacy gains in fleet fuel efficiency extend downward trend in transportation fuels
▪ Substitution towards biofuels will also have a substantial impact on gasoline demand
▪ All scenarios will lead to at least some degree of refinery shutdowns

29
As a result, refining rationalization is likely to continue
1 Based on regional maximum recorded annual average throughput (2004)2 Does not include small ASPH/LUB stand-alone assets
Sources: OilDesk; McKinsey analysis
2.1
-3.0
-2.5
-0.4-0.3-0.10
0.1
0.6
1.6
PADD 1 net margin, 2009$/bbl
Net
mar
gin
($/b
bl) 9
8
7 6
5 4 3
2 1
10
Sunoco-Marcus Hook 1697
3 Conoco-Linden 270
Sunoco-Philadelphia 3624 5 Conoco-Trainer 192
PBF-Delaware City 1676
8 Western-Yorktown 50
United-Warren 682
Shutdown sequence
Demonstrated throughput1
kbd
Total2 1,570
PBF-Paulsboro 16110
Hess-Port Reading 589
Sunoco-Eagle Point 731
Sunoco Eagle Point: permanently shut February 1, 2010
PBF Delaware City: closed in 2009, but to be restarted in coming
weeks
PBF Paulsboro: 100 employees laid off
(Oct. 13, 2009)
Demonstrated throughput (kbd)
PBFOthersConoco
Sunoco

Higher PP prices appear to have impacted demand growth relative to its substitutes
30SOURCE: Braskem
4.0
-5.2
1.0
1.7
-10.07.7
12.4
-1.4
-1.0
29.0
3.7
4.4
-5.2
-9.2
-4.0
-5.6
Domestic sales
Distributors
InjectionMolding
Exports
Total Sales
Sheet
Film
Compounders
HDPEPP
Sales growth 2010-2011 (annualized)%

For many years, propylene-propane spreads could not justify PDH economics; more recently, spreads have been favorable
31
600
400
200
0
PG Propylene-Propane spreads1
$/tonne
2004 2006 2008 2010 2011
1,200
1,000
800
600
400
200
0
1990 1992 1994 1996 1998 2000 2002 2003
Margin for 10% IRR
SOURCE: CMAI; Braskem
1 Spreads between Propylene and 1.22*Propane price, which is stoichiometry for propane conversion to propylene in PDH; cost to convert propane to propylene is about $110/tonne and required return on investment is $200/tonne

Thank You!Thank You!